ARTHUR M. OKUN BrookingsInstitution A Postmortem of the 1974 Recession THE DECLINE of 2.1 percent in real gross national product from 1973to 1974 wasthefourth annual dip sincethe mid-forties (the others occurred in 1954, 1958, and 1970) andby farthe largest. With thebenefit of hindsight, I shall, in thisbrief paper, discuss whathappened to the economy andto the economic forecasters in thatbleak year. In the comments addressed to fore- casting, I shallnot allocate blameor praise; my purpose rather is to raise some questions and infer some lessons that may be relevant for future research and application. What Happened In combination, the decline in real consumption and in residential con- struction activity from 1973 to 1974 accounted for more than the total decline in real GNP (table1).These were also themainareas of disappoint- mentrelative to the expectations of forecasters. CONSUMPTION The2.3percent decline in real consumption in 1974 is attributable mainly to the 2.7 percent decline in realdisposable income, although, by historical standards, aggregate consumption was weak relative to income.The per- sonal saving rateof 1974 was7.9 percent, virtually unchanged fromthe 7.8 Note: I want to thank Nancy Delaney for her assistance in the research. 207
Transcript
ARTHUR M. OKUN
Brookings Institution
A Postmortem of the
1974 Recession
THE DECLINE of 2.1 percent in real gross national product from 1973 to 1974 was the fourth annual dip since the mid-forties (the others occurred in 1954, 1958, and 1970) and by far the largest. With the benefit of hindsight, I shall, in this brief paper, discuss what happened to the economy and to the economic forecasters in that bleak year. In the comments addressed to fore- casting, I shall not allocate blame or praise; my purpose rather is to raise some questions and infer some lessons that may be relevant for future research and application.
What Happened
In combination, the decline in real consumption and in residential con- struction activity from 1973 to 1974 accounted for more than the total decline in real GNP (table 1). These were also the main areas of disappoint- ment relative to the expectations of forecasters.
CONSUMPTION
The 2.3 percent decline in real consumption in 1974 is attributable mainly to the 2.7 percent decline in real disposable income, although, by historical standards, aggregate consumption was weak relative to income. The per- sonal saving rate of 1974 was 7.9 percent, virtually unchanged from the 7.8
Note: I want to thank Nancy Delaney for her assistance in the research.
207
t n 00 0X CN tn
C.w IIIIN I I
t~~~~~0 t booo .Xn : o tmc ^to
t~~~~~~~~~~~~~~C C4 1111
w ON0 0\ 0 0 On 'I 00 r- ??0 ?
X~~~~~~~~~0 1- en en CN? I.
v~~~~~~~~~~~~~~~~~~~~~C C _
= sv~~~~~~~~1 00 'IC o^t^
Po 54 WI c m ON t - c
Cm ~ ~~~~~~~~ tn tn en --q O Cs & 1
P; `4 o o oo tc n t \).n u
e0 C Cd > O O xo
o en N WI en oo~ en en Cs -
.
V~~~~~~~ ~~~ Cd =t
m _ v ? s; U) P? <X) & ? C ?~~~~~~~ ffi D2 a =0 tr 8 X s- > 4 =0 E C
Arthur M. Okun 209
percent average of the first three quarters of 1973, before automobile de- mand plummeted. Moreover, the saving rate of 1974 essentially matched the 7.8 percent average of 1970-73; in all years of the 1970s thus far, except 1972, the personal saving rate has been higher than in any year of the 1950s or 1960s.
The share of disposable income devoted to nondurable goods and ser- vices (in current dollars) rose from 74.7 percent in 1973 to 76.5 percent in 1974, the biggest one-year jump in the past generation. But the share spent on durables fell from 14.4 percent in 1973 to 13.0 percent in 1974, the biggest one-year drop in the past generation. Autos, of course, led the plunge: the share of disposable income spent on new cars fell to a post- Korean annual low of 3.8 percent from 4.8 percent in 1973 (5.1 percent in the first three quarters). But the decline in new cars generally eclipses that of all other consumer goods in recessions, quite apart from an energy crisis: their share dropped between 0.7 point and 1.1 points in the three previous recession years (table 2).1 In short, the auto collapse in 1974 should be attributed more to a shortage of real income than to a shortage of gaso- line, given income.
Of course, in line with standard theoretical reasoning and empirical evidence, a dip (or even slowdown) of real income does not normally have an immediate proportionate effect on consumer expenditure. Hence, a drop in the saving rate is to be expected when income sags. In that sense, the unchanged (as well as historically high) saving rate of 1974 is a mark of unusual weakness in consumer demand. But, in fact, the saving rate has not displayed any distinct countercyclical pattern during recessions in the post- war era. The share of disposable income spent on nondurables and services has typically risen (as it did in 1974); but the share spent on durables has invariably declined, sometimes dominating the aggregate consumption- income ratio.
In retrospect, it is not at all difficult to account for historically low con- sumption in relation to disposable income during 1974. In line with past experience, accelerating (unanticipated) inflation may have depressed con- sumer demand.2 Another contributor may have been the sharp decline in
1. The auto share held up rather well in the early stages of the 1957-58 and 1960-61 recessions, unlike 1974. It then recovered very slowly later in 1958 and 1961, after the economy turned up.
2. F. Thomas Juster and Paul Wachtel, "Inflation and the Consumer," BPEA (1:1972), pp. 71-72.
210 Brookings Papers on Economic Activity, 1:1975
Table 2. Shares of Selected Components of Disposable Personal Income during Peak and Recession Years, and Change, Selected Years, 1957-74
Nondurable Total Personial goods and durable New consumption
Period services goods automobilesa expenditures Saving
Sources: U.S. Department of Commerce, The National Income and Product Accounts of the United States, 1929-1965: Statistical Tables (1966), pp. 26, 33, 41, and Department of Commerce, U.S. National Income and Product Accounts, 1964-69 (1973), pp. 48, 51, 52; Survey of Current Business, vol. 54 (July 1974), pp. 19, 22, 23, and vol. 55 (March 1975), pp. 8, 9.
a. The personal consumption expenditures component of gross auto product. b. Fourth quarter excluded because of auto strike.
real household financial wealth (33 percent during 1973-74), reflecting in- flation and falling stock and bond prices. Indeed, consumer expenditures held up far better in 1974 than would have been implied by some estimates of the size and speed of the impact of changes in wealth (or in real cash balances).
To be sure, the bumpy quarterly pattern of consumer demand during 1974 can be explained only in terms of special and transitory influences like the unavailability of gasoline in the first quarter, the way the announcement of major price increases slated for the 1975 automobile models helped to sell 1974 cars during the third quarter, and the way that temporary rebound in automobile demand itself weakened the fourth-quarter performance. Nonetheless, for the year as a whole, the behavior of consumption was not much of a mystery, given the decline in real disposable income.
Arthur M. Okun 211
DISPOSABLE INCOME
Thus, the basic question about consumption in 1974 is, what made real disposable income so weak? And weak it was! It registered its first annual decline of the postwar era, and its drop (2.7 percent) even exceeded that of real GNP. The average of past postwar performances would have suggested that a 2.1 percent drop in real GNP would be associated with approxi- mately zero change in real disposable personal income.
By that standard, 1974 produced an unusual income squeeze, exceeding 21/2 percent. Relative price movements account for about half of that squeeze. The implicit deflator for personal consumption expenditures rose 11.4 percent from 1973 to 1974; whereas it typically increases a bit less than the GNP deflator, it advanced by 1.1 percentage points more in 1974. Im- ported oil was the key item that pushed up consumer prices relative to the GNP deflator.
The other half of the unusual dent in disposable income stemmed mainly from fiscal impacts. Most significantly, the built-in flexibility of the per- sonal income tax did not play its usual role of cushioning a recession. Be- cause the value of personal exemptions and the width of tax brackets are set in nominal rather than real terms, the progressivity of the tax system operated with respect to gains in nominal income even though real income was falling. As a share of "earned personal income" (personal income minus transfer payments), federal personal taxes rose from 12.2 percent in 1973 to 13.0 percent in 1974. That rise squeezed disposable personal income by 0.8 percent ($8 billion). In fact, with no change in income tax laws, the federal tax share of earned income would normally be expected to fall in recession.3 For example, from 1957 to 1958, it declined 0.4 percentage point. A second and smaller fiscal squeeze, exceeding $2 billion, stemmed from the increase in personal contributions for social insurance resulting from a rise in the maximum earnings base. Transfer payments did provide some cushion, rising about 19 percent in nominal terms, but the additional buying power provided by incremental transfers was eroded by inflation. The real increase amounted to 61/2 percent, far smaller than in previous recession years.
In nominal terms, earned personal income rose at the same rate as GNP. But that reflected the net effect of many contrary forces: a drop in farm
3. Joseph A. Pechman, "Responsiveness of the Federal Individual Income Tax to Changes in Income," BPEA (2:1973), pp. 403-05.
212 Brookings Papers on Economic Activity, 1:1975
income, a sharp rise in personal interest income, remarkable strength of employment in the face of declining output, and a weak gain in hourly compensation relative to prices of private nonfarm output.4
RESIDENTIAL CONSTRUCTION
While many forces influenced the level of homebuilding, its decline dur- ing 1973-74 can be linked closely to the movement of short-term interest rates. With a remarkably brief lag, these seemed to affect deposit inflows into thrift institutions, which in turn altered the supply of mortgages and then homebuilding in a prompt chain reaction. Short-term interest rates soared in the spring and summer of 1973, reaching levels far above yields on thrift deposits. Monthly deposit inflows into thrift institutions, which had averaged $3.6 billion throughout 1972 and $2.6 billion in the first half of 1973, shrank to $1.3 billion for the period June-October 1973; housing starts fell sharply in the second half of 1973.
Late in that year and early in the next, short-term rates eased off and net thrift inflows rebounded, averaging $2.1 billion a month from October 1973 to April 1974. But, as interest rates turned up sharply, monthly thrift in- flows averaged less than $1 billion in the period from April through October 1974. Housing starts, which had averaged about 1.6 million units (annual rate) from December 1973 to June 1974, plunged to less than a million by the end of 1974. In this period of tight money, unlike others, expenditures on mobile homes were hit hard too; they fell from $4.1 billion (annual rate) in 1974:2 to $2.3 billion in 1974:4.
The high and rising pattern of interest rates during most of 1973 is readily understandable: nominal GNP was growing at a rate of 12 percent while the money stock was kept close to the 61/2 percent growth track that charac- terized the entire period from the end of 1969 to the middle of 1974.5 Why the emerging slowdown of late 1973 was enough to turn interest rates down for a while, and why they then soared in the spring and summer (when the growth rate of nominal GNP averaged 9 percent), is not clear. The turn- around was associated with a surge of business loan demand that the
4. The movement of the "statistical discrepancy" in the national accounts from -$5.0 billion in 1973 to -$0.1 billion in 1974 also "cost" $5 billion of income.
5. From 1969:4 to 1974:2, the growth of M1 averaged 6.58 percent, and the maxi- mum deviation of M1 from a smooth trend line connecting those points was $3.0 billion in 1973:2.
Arthur M. Okun 213
Federal Reserve, holding M1 right on track during the spring quarter, did not accommodate.
The spurt in short-term interest rates from March to July made inevitable the second-half plunge in homebuilding and mobile homes. After midyear, the Federal Reserve shifted from a quantity-oriented monetary policy to a rate-oriented strategy, and allowed the money stock to sag below the pre- vious track, as credit demands waned. While it had tolerated an abrupt rise in interest rates during the spring, it cushioned the decline in rates during the fall and winter. If the Federal Reserve had maintained its quantity- oriented policy after midyear, it might have sped the turnaround in the credit-sensitive areas by several months, but it could no longer have pre- vented the housing collapse of the second half.
While the impact of high interest rates on residential construction and mobile homes is obvious, any major prompt influence of those rates on other components of expenditure (consumer durables other than mobile homes, inventory investment, and plant and equipment) is not visible to the naked eye-at least not to mine.
BUSINESS INVESTMENT
As currently estimated by the Department of Commerce, inventory in- vestment held up unusually well during 1974 in relation to final sales. During the first three quarters of 1974, real final sales ran nearly 2 percent below their peak rate of 1973:3, almost matching in that early stage the maximum peak-to-trough decline of any previous postwar recession. Yet accumulation of inventories continued at a rapid rate all year long. Never before in the postwar period had inventory investment remained positive when real final sales stayed below their peak for more than two quarters.
Clearly, most of the accumulation over that prolonged period of five quarters of submerged real final sales must have been voluntary; otherwise, production would have been slashed sooner. And it is understandable that business wanted additional stocks. First, the rapid advance of final sales in 1972 and early 1973 must have left many firms with inventories below de- sired levels late in 1973. Second, the shortages, delivery delays, and rising prices that marked 1973 and much of 1974 must have led many business- men to raise their targets on desired inventories in relation to sales.
Business fixed investment also remained strong during much of 1974, barely dropping in real terms until the fourth quarter. Plant and equipment
214 Brookings Papers on Economic Activity, 1:1975
outlays anticipated by businessmen early in 1974, unlike those in previous recession years, were not scaled down sharply during the course of the year. Actual outlays for the year corresponded closely to the anticipations re- ported in February 1974 ($112.4 billion actual vs. $112.7 billion projected). Of course, since prices of capital goods rose more sharply than businessmen had anticipated, fulfilling their dollar capital budgets meant acquiring less physical capital than had been expected.
The same pattern of business resistance to declining final sales evident in inventory and fixed investment also was displayed in the demand for labor. As I have argued previously,6 the expansive personnel policies seem attrib- utable to (1) the momentum of forces and attitudes that developed during the 1973 boom; (2) an overly optimistic interpretation of weak final sales early in 1974 as merely an embargo-induced "energy spasm"; and (3) "FIFO illusion," a tendency to take seriously the favorable profits bloated by inflationary inventory gains. For those reasons, firms felt no strong in- centive to retrench on employment, or inventories, or fixed capital.
In summary, the consumer was clobbered by U.S. fiscal policy and the "oil tax" during 1974; and homebuilding was battered by monetary policy. For much of the year, business spending and hiring supported the economy and resisted the downward pull of the declining sectors. It is not clear why so many businessmen seemed to realize so suddenly around August that they were holding up the economy merely by selling goods to one another and retaining workers they did not need. In any case, business finally lost the tug-of-war, and then the whole economy plunged in the closing months of 1974. The trimming of personnel and production that might have been accomplished gradually earlier in the year then took place abruptly and frenetically in 1974:4 and 1975: 1.
What Was Expected
While the typical forecast of real economic activity for 1974 was revised downward periodically, it remained overly optimistic throughout.
6. Arthur M. Okun, "Unemployment and Output in 1974," BPEA (2:1974), pp. 502-03.
Arthur M. Okun 215
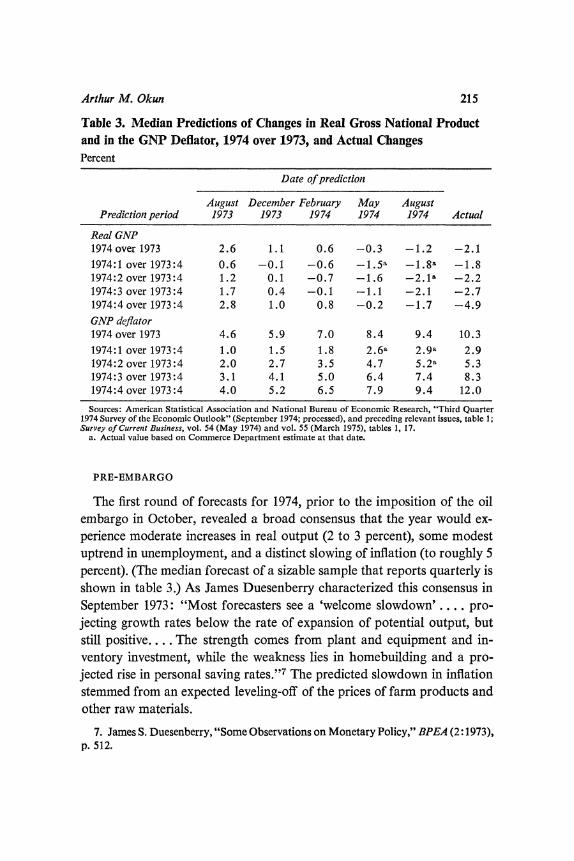
Table 3. Median Predictions of Changes in Real Gross National Product and in the GNP Deflator, 1974 over 1973, and Actual Changes Percent
Date of prediction
August December February May August Prediction period 1973 1973 1974 1974 1974 Actual
Real GNP 1974over 1973 2.6 1.1 0.6 -0.3 -1.2 -2.1 1974:1 over 1973:4 0.6 -0.1 -0.6 -1.5a -1.8a -1.8 1974:2 over 1973:4 1.2 0.1 -0.7 -1.6 -2.1l -2.2 1974:3 over 1973:4 1.7 0.4 -0.1 -1.1 -2.1 -2.7 1974:4 over 1973:4 2.8 1.0 0.8 -0.2 -1.7 -4.9 GNP deflator 1974 over 1973 4.6 5.9 7.0 8.4 9.4 10.3 1974:1 over 1973:4 1.0 1.5 1.8 2.6a 2.9a 2.9 1974:2 over 1973:4 2.0 2.7 3.5 4.7 5.2a 5.3 1974:3 over 1973:4 3.1 4.1 5.0 6.4 7.4 8.3 1974:4 over 1973:4 4.0 5.2 6.5 7.9 9.4 12.0
Sources: American Statistical Association and National Bureau of Economic Research, "Third Quarter 1974 Survey of the Economic Outlook" (September 1974; processed), and preceding relevant issues, table 1; Survey of Current Buisiness, vol. 54 (May 1974) and vol. 55 (March 1975), tables 1, 17.
a. Actual value based on Commerce Department estimate at that date.
PRE-EMBARGO
The first round of forecasts for 1974, prior to the imposition of the oil embargo in October, revealed a broad consensus that the year would ex- perience moderate increases in real output (2 to 3 percent), some modest uptrend in unemployment, and a distinct slowing of inflation (to roughly 5 percent). (The median forecast of a sizable sample that reports quarterly is shown in table 3.) As James Duesenberry characterized this consensus in September 1973: "Most forecasters see a 'welcome slowdown' .... pro- jecting growth rates below the rate of expansion of potential output, but still positive.... The strength comes from plant and equipment and in- ventory investment, while the weakness lies in homebuilding and a pro- jected rise in personal saving rates."7 The predicted slowdown in inflation stemmed from an expected leveling-off of the prices of farm products and other raw materials.
7. James S. Duesenberry, "Some Observations on Monetary Policy," BPEA (2:1973), p. 512.
216 Brookings Papers on Economic Activity, 1:1975
With the embargo and explosion in oil prices, the basic premises of that initial forecast suddenly became obsolete. From the point of view of a macroeconomist, an event like the quadrupling of oil prices by the cartel is fundamentally exogenous. If improvements are to be made in appraising the likelihood of such major disturbances, the assignment will have to be undertaken by foreign policy and commodity experts, rather than mere GNP-men. Even in the absence of the oil crisis, overall prices in 1974 would probably have risen distinctly more and output somewhat less than in the pattern envisioned by the forecasters. Nonetheless, their basic scenario of a nonrecessionary slowdown might well have been realized had it not been for the oil shock.
TURN OF THE YEAR
The forecasts made at the turn of the year cranked in some impact from the petroleum developments and some lessons from continued bad news on inflation. The consensus remained fairly broad as it shifted toward more in- flation and less real growth. The typical January-February forecast for 1974 had the following characteristics:
1. Nominal GNP was expected to grow by about $100 billion, or nearly 8 percent.
2. Real GNP was expected to rise only a fraction of 1 percent, and prices were marked up some 7 percent.
3. The expected quarterly pattern of real GNP was in the shape of a saucer, with the first quarter generally pegged down, and the final quarter up; disagreements on the sign of movements focused on the two middle quarters, but they were expected to register only small changes, whether plus or minus.
The true magnitude and significance of the increases in oil prices were still not apparent. In January, the price of imported oil was not expected to exceed $8 a barrel; it ultimately rose above $12. The Council of Economic Advisers noted that the price rise through December 1973, when applied to the volume of imports of 1973, would amount to "less than 1 percent" of GNP, and labeled this calculation as "probably an outside estimate of the costs in 1974."8
8. Economic Report of the President together with the Annual Report of the Council of Econiomic Advisers, February 1974, p. 26.
Arthur M. Okun 217
The weakened demand for automobiles had become apparent, and was the key element in the accurate forecast of a decline in real output for 1974:1. A few forecasters expected major losses in the nation's productive capability as a result of the scarcity of oil, but the majority correctly antici- pated no serious supply impact from the embargo. Generally, some explicit assumption-most often, "near midyear"-was made about the termina- tion of the embargo. That event was expected to aid the rebound in the second half, particularly by promoting recovery of automobile demand. A few economists called attention to the drain that the "oil tax" inflicted on real consumer income, quite apart from the embargo, but many ignored it. Continuing strength in plant and equipment spending and a rebound in housing were expected regardless of the oil situation.
The expected rebound in housing was linked to a dip of interest rates to levels that would restore thrift inflows. Interest rates were, in fact, falling at the turn of the year; but, as Tobin pointed out,9 it was hard to reconcile the prediction of continued declines with the prevailing expectations of 8 per- cent growth of nominal GNP, on the one hand, and 51/2 or 6 percent growth of the money stock, on the other.
Another bullish element was the expected strength of inventory invest- ment. That prediction was seriously biased upward by the original Com- merce Department underestimate of inventory investment in 1973. Initially, inventory investment for 1973:4 was pegged at $15.9 billion (annual rate), in contrast to the current estimate of $28.9 billion for the period; that for the entire year 1973 was initially put at $7.4 billion, in contrast to the pres- ent $15.4 billion. The forecasters were told that the shelves were bare, and expected them to be restocked.
The forecasters were also misled about the prospects for federal expendi- tures in the first half of 1974. Actual expenditures on the national income and product basis during fiscal 1974 ran $7 billion below the projection in the budget document of February 1974. While $2 billion of that total re- flected an accounting change (involving a complex transaction with India), the remaining $5 billion-$10 billion at annual rates during the first half of 1974-did make a substantial difference.
Because the large errors on the price level and output were offsetting, the prediction of nominal GNP turned out to be accurate. In fact, the GNP deflator rose 10.3 percent while output fell 2.1 percent, yielding the same 8
9. James Tobin, "Monetary Policy in 1974 and Beyond," BPEA (1:1974), pp. 221-22.
218 Brookings Papers on Economic Activity, 1:1975
percent gain in nominal GNP implied by the projected 7 + 1 pattern. In- deed, CEA predicted a rise in nominal GNP of $102 billion, the increase now shown by the Commerce estimates. But the significance of the actual $102 billion was drastically different from what had been envisioned.
In both 1969 and 1973, when price inflation had been substantially under- estimated by the profession, real GNP was forecast quite accurately and the projection of nominal GNP was far too low. In 1969, prices and wages were underestimated by about equal amounts and thus the error in the in- flation forecast per se made no big difference in the estimates of real dis- posable income. In 1973, an unexpected squeeze on real wage income emerged, but the bonus went to farmers, thus maintaining real disposable income. Moreover, with an unexpected $10 billion rise in net exports, for- eigners helped to buoy up real GNP (as well as to intensify inflation) in 1973. For 1974, however, the price predictions were much further below the mark than the wage forecasts, and the emerging squeeze on real disposable income was not anticipated.'0
AFTER THE END OF THE EMBARGO
By spring, the forecasters had to digest disappointing news on both prices and output for the first quarter. On the other hand, as of March 18, the lifting of the embargo became a fact and not merely a working assump- tion. Moreover, after a weak interval in January and February, industrial production and private employment leveled off. While the forecasters scaled down projected levels of real activity throughout 1974 and in May the median forecast called for a tiny decline of real GNP from 1973 to 1974, a cumulative decline in economic activity seemed to most a less serious threat than it had at the turn of the year. The predicted annual increase in the deflator was marked up into the 8 to 9 percent range, but inflation as well as output was expected to look better in the second half. The script was much the same as at the beginning of the year: continued gains in plant and equipment spending, a recovery in housing, a rebound in consumer dura- bles (which played a larger role than it had in the turn-of-the-year fore- casts), and less inflation in commodities (including oil).
10. Alternatively, it can be argued that, with monetary conditions so tight during 1974, the money stock exerted more influence on nominal GNP than it had in 1973 or even in 1969; thus inflation led to less upward adjustment of the velocity of money and more downward adjustment of real output.
Arthur M. Okun 219
SUMMER
In July, the forecasters got a new view of the inventory situation from the Department of Commerce. That revision raised a few doubts-but only a few-about the outlook for continuing strength in inventory investment. Although short-term interest rates were now soaring to unprecedented levels, the median expectation on housing starts in the ASA-NBER survey of forecasters in August was a plateau of 1.5 million units during the second half. At that point, most gave up on a second-half rebound of real GNP, projecting instead an essentially flat pattern. Still, they were prepared to bet 2 to 1 against a decline in real GNP in the fourth quarter and nearly 3 to 1 against such a decline for the first quarter of 1975. Again, they expected imminent improvement in inflation (in part, counting on good crops and hence falling farm prices) and an emerging recovery in the market for con- sumer durables (perhaps extrapolating the higher rate of car sales in the summer).
In light of subsequent developments in the economy and in fiscal policy, the administration's restrictive fiscal program of October 8 must be rated as the most misconceived stabilization package of the past generation. But, at least by some tastes on the output-inflation tradeoff, it was not unreason- able against the background of the typical forecast then prevailing.
The Lessons of 1974
The serious errors in appraising the 1974 outlook cannot be tied to any particularly defective forecasting theory or technique. Indeed, the striking fact is the basic agreement of most of the quantitative forecasters, whether Keynesians or monetarists, builders of large econometric models, devotees of leading indicators, or gazers into crystal balls. The tendency toward agreement may reflect the incentive system operating on forecasters: the costs in income and status of being wrong when alone must be far higher than the costs of being wrong in good company.
It is as easy to be wise in retrospect as it is difficult to be right in prospect. Yet a number of clues that became evident along the way pointed to a different assessment of the outlook and indeed were so interpreted by a few observers.
220 Brookings Papers on Economic Activity, 1:1975
First, by January or February, some economists appraised the impact of the oil crisis fairly accurately and adjusted their projections of real con- sumption downward to reflect the dent of the "oil tax" on real disposable income. Unfortunately, in the minds of many forecasters, the embargo apparently "excused" the setbacks in the early months of 1974 and thus masked the basic weakness of the economy. In addition, only a few fore- casters expressed concern that unanticipated inflation might depress con- sumer demand.
Second, at least by midyear, there were good reasons to expect some weakening of employment demand in relation to output. The minority who foresaw layoffs and rising unemployment expressed doubts about the be- lief-maintained so wrongly by so many for so long-that the consumer would come back to market.
Third, by spring, a few economists were raising questions about the im- pact on inflation of the end of wage and price controls on April 30. And the less optimistic forecasts of inflation were accompanied by greater concern about tight money and adverse consumer attitudes.
Fourth, by late spring, when interest rates were soaring and funds once again began to flow out of thrift institutions, an imminent decline in home- building should have been foreseen. At least, the widespread belief in a "floor" on starts of 1.5 million units should have been subjected to closer scrutiny.
Fifth, a few-but very few-monetarists viewed the declining real money stock in the first half of 1974 as a danger to real activity. If M1 had been growing at a zero rate with inflation at 4 percent, monetarists would gen- erally have been very bearish about real GNP. It is not clear why 6 percent M1 growth and 10 percent inflation did not make them equivalently bearish.
Sixth, the growing excess of inventories should have been diagnosed as final sales remained (and were expected to remain) far below their previous peak. The forecasters were betting against a regularity of postwar history in expecting no inventory liquidation. Particularly after the July statistical revisions, major markdowns of projected inventory investment were in order. Although such markdowns would have worsened the accuracy of inventory forecasts for the second half (when stocks piled up involuntarily), they would have dramatically improved the forecasts of real GNP.
Even the possibility of a traditional, typical inventory (and employment) cycle was widely dismissed until it roared into reality at the end of 1974. Many forecasters seemed to regard the business cycle as obsolete. For four-
Arthur M. Okun 221
teen years, the economy had escaped liquidation of inventories and sig- nificant reduction of work forces. The samples of data incorporated in equations and memories alike were heavily weighted with observations from a period of unusual stability in real economic activity. In this connec- tion, what many of the forecasters missed was not something new but some- thing old: multiplier-accelerator interactions and other cumulative cyclical processes. In days of yore, these were deeply imprinted in the profession's thinking-from the experience of the fifties; the time-series analysis of Arthur Burns, Wesley Mitchell, and others at the National Bureau of Eco- nomic Research; the inventory-cycle models of Lloyd Metzler; and the general multiplier-accelerator analysis of Paul Samuelson. Those old tracts could have helped to keep the forecasters on the right track.
The discussion of this report is combined with that of the Perry re- port which follows.