+ All Categories
Home > Documents > A prediction model for the residual flexural strength of ...

A prediction model for the residual flexural strength of ...

Date post: 25-Jan-2022
Category:
Upload: others
View: 3 times
Download: 0 times
Share this document with a friend
177
A prediction model for the residual flexural strength of corroded reinforced concrete beams Syed Ayub Azher Civil Engineering January 2005 Abstract Corrosion of reinforcing steel and subsequent concrete deterioration is a major problem faced by the construction industry. However, limited work is available for the estimation of the flexural strength of corrosion-damaged members. In the present work, an effort has been made to develop a model to predict the residual flexural strength of reinforced concrete beams with varying degree of reinforcement corrosion. The experimental variables included: applied corrosion current density, corrosion duration, rebar diameter and thickness of concrete cover. A total of 56 reinforced concrete beams (150 x 150 x 1100 mm) were cast using a common concrete mix, out of which 8 beams were earmarked as control beams that were not subjected to corrosion and the remaining 48 beams were subjected to corrosion by impressed current. All beams were tested in flexure in four-point bend tests. After testing in flexure the beams were broken to retrieve the reinforcing steel. The steel bars were cleaned to assess the gravimetric weight loss. Results indicate that the product of corrosion current density and corrosion period IcorrT, is the most significant factor affecting the flexural strength of a corroded beam. Diameter of steel bars also affected the extent of metal loss for identical IcorrT. The effect of cover thickness on the loss flexural strength was found to be insignificant for a given beam at constant Icorr T. Based on the experimental data, a two-step approach to predict the residual flexural strength of a corroded beam has been proposed. The usefulness of the proposed approach for prediction of the residual strength of the corroded beams for which information on corrosion current density, corrosion period, beam cross-section, and strength of materials are available has been illustrated through numerical examples. The accuracy of the proposed method has been verified by comparing the results with the test data available in the literature.
Transcript

A prediction model for the residual flexural strength of corroded reinforced concrete beams

Syed Ayub Azher

Civil Engineering

January 2005

Abstract

Corrosion of reinforcing steel and subsequent concrete deterioration is a major problem faced by the construction industry. However, limited work is available for the estimation of the flexural strength of corrosion-damaged members. In the present work, an effort has been made to develop a model to predict the residual flexural strength of reinforced concrete beams with varying degree of reinforcement corrosion. The experimental variables included: applied corrosion current density, corrosion duration, rebar diameter and thickness of concrete cover.

A total of 56 reinforced concrete beams (150 x 150 x 1100 mm) were cast using a common concrete mix, out of which 8 beams were earmarked as control beams that were not subjected to corrosion and the remaining 48 beams were subjected to corrosion by impressed current. All beams were tested in flexure in four-point bend tests. After testing in flexure the beams were broken to retrieve the reinforcing steel. The steel bars were cleaned to assess the gravimetric weight loss.

Results indicate that the product of corrosion current density and corrosion period IcorrT, is the most significant factor affecting the flexural strength of a corroded beam. Diameter of steel bars also affected the extent of metal loss for identical IcorrT. The effect of cover thickness on the loss flexural strength was found to be insignificant for a given beam at constant Icorr T.

Based on the experimental data, a two-step approach to predict the residual flexural strength of a corroded beam has been proposed. The usefulness of the proposed approach for prediction of the residual strength of the corroded beams for which information on corrosion current density, corrosion period, beam cross-section, and strength of materials are available has been illustrated through numerical examples. The accuracy of the proposed method has been verified by comparing the results with the test data available in the literature.

DEDICATED TO

MY BELOVED PARENTS

AND

MY BROTHERS & SISTERS

ACKNOWLEDGEMENTS

First and foremost, I thank Allah (subhana wa taala) for bestowing me with health, patience, and knowledge to complete this work.

Acknowledgement is due to the King Fahd University of Petroleum & Minerals for the support given to this research through its excellent facilities and for granting me the opportunity to pursue my graduate studies with financial support.

I acknowledge, with deep gratitude and appreciation, the inspiration, encouragement, valuable time and guidance given to me by Prof. Abul Kalam Azad, who served as my major advisor. Thereafter, I am deeply indebted and grateful to Dr. Shamsad Ahmad, my co-advisor, and Dr. Mohammed Maslehuddin, my committee member, for their extensive guidance, continuous support, and personal involvement in all phases of this research. I am also grateful to my other committee members, Dr. Ahmad S. Al-Gahtani and Dr. Mesfer M. Al-Zahrani for their constructive guidance, valuable advices and cooperation.

I also acknowledge the sincere and untiring efforts of Engr. Mukarram Khan and Mr. Hassan Zakaria who assisted me during all stages of my experiments and also helped me in preparing the experimental set-up utilized in this study. Thanks are due to the laboratory personnel Mr. Omer, Mr. Essa, Mr. Saleem and Mr. Abdullah for their substantial assistance in the experimental work, and also to the department secretaries, Mr. Mumtaz and Mr. Solano for their help and assistance. I am also indebted to the department chairman, H.I.Al-Abdul Wahhab and other faculty members for their support.

Special thanks are due to my brothers Syed Idris Azher and Syed Ilyas Azher for their moral support and encouragement throughout this work.

Thanks are due to my senior colleagues at the University, Mr. Shameem, Mr. Ibrahim, Mr. Rizwan, Mr. Ghulam Akber and Mr. Imran Ali for their valuable advices. I would also like to thank my friends Baqtiar, Imran Quadri, Siraj, Yousuf, Khaja, Mazher, Kashif, Anees, Ismail, Jaffer, Muqtader, Asif, Obaid, Farooq, Rizwan, Riyaz, Sajeed and Atif for their friendly environment during my graduate studies. Special thanks are due to Hameed, Qaiyum and Adil, who were always there to help me in my work and my sincere appreciation is due to all other North Compound friends who provided wonderful company and some memories that will last a lifetime.

Finally, I would like to express my deepest gratitude to my mother, father, sisters, younger brother, and all other relatives, for their emotional and moral support throughout my academic career and also for their love, patience, encouragement and prayers.

iv

TABLE OF CONTENTS

LIST OF TABLES .....................................................................................x

LIST OF FIGURES .................................................................................xii

THESIS ABSTRACT..............................................................................xvi

THESIS ABSTRACT (ARABIC) .........................................................xvii

CHAPTER 1

INTRODUCTION......................................................................................1

1.1 REINFORCEMENT CORROSION.............................................................1

1.2 EFFECT OF REINFORCEMENT CORROSION ON THE

PERFORMANCE OF REINFORCED CONCRETE ELEMENTS........4

1.3 EFFECT OF REINFORCEMENT CORROSION ON THE FLEXURAL

STRENGTH ..................................................................................................6

1.4 NEED FOR THIS RESEARCH ....................................................................7

1.5 SCOPE AND OBJECTIVES .........................................................................8

CHAPTER 2

LITERATURE REVIEW..........................................................................9

2.1 NATURE OF REINFORCEMENT CORROSION IN CONCRETE ......9

2.2 MECHANISM OF REINFORCEMENT CORROSION ........................11

v

2.3 EFFECT OF REINFORCEMENT CORROSION ON BEHAVIOR OF

CONCRETE MEMBERS ..........................................................................15

2.3.1 Time to Cover Cracking of Concrete Due to Corrosion .........................15

2.3.2 Effect of Reinforcement Corrosion on Bond between Steel and

Concrete..................................................................................................20

2.3.3 Flexural Strength of a Corroding Reinforced Concrete Member .........25

2.3.3.1 Corrosion of steel in concrete in relation to bar diameter and cover

thickness................................................................................................................25

2.3.3.2 Residual flexural strength of corroding reinforced concrete

structures ..............................................................................................................29

CHAPTER 3

METHODOLOGY OF RESEARCH.....................................................39

3.1 EXPERIMENTAL PROGRAM..................................................................39

3.2 EXPERIMENTAL VARIABLES................................................................39

3.3 TEST SPECIMENS......................................................................................40

3.4 DETAILS OF TEST SPECIMENS.............................................................41

3.5 CONCRETE CONSTITUENTS..................................................................42

3.6 PREPARATION OF BEAM SPECIMENS ...............................................43

3.6.1 Concrete Mix Proportions ......................................................................43

3.6.2 Casting and Curing of Beam Specimens ...............................................44

3.7 DESIGNATION FOR BEAM SPECIMENS .............................................45

3.8 EXPERIMENTAL TECHNIQUES ............................................................47

vi

3.8.1 Compressive Strength of Concrete .........................................................47

3.8.2 Tensile Strength of Reinforcing Bars ....................................................47

3.8.3 Corrosion Rate Measurements ...............................................................49

3.8.4 Test Setup for Inducing Reinforcement Corrosion ...............................54

3.8.5 Flexure testing of Beam Specimens .......................................................60

3.8.6 Gravimetric Weight loss..........................................................................64

CHAPTER 4

RESULTS AND DISCUSSION ..............................................................67

4.1 COMPRESSIVE STRENGTH OF CONCRETE......................................67

4.2 TENSILE STRENGTH OF REINFORCING STEEL BARS..................67

4.3 FLEXURAL STRENGTH OF BEAM SPECIMENS ...............................70

4.4 EFFECT OF CORROSION ON LOAD-DEFLECTION BEHAVIOR OF

BEAMS ........................................................................................................72

4.5 EFFECT OF CORROSION ON THE DUCTILITY OF BEAMS...........81

4.6 WEIGHT LOSS OF BARS AND EQUIVALENT CORROSION

CURRENT DENSITY................................................................................82

4.7 RELATIONSHIP BETWEEN Icorr AND Iapp.............................................87

4.8 EFFECT OF CHOSEN VARIABLES ON REINFORCEMENT

CORROSION..............................................................................................89

4.9 EFFECT OF CORROSION ON LOAD CARRYING CAPACITY OF

BEAMS ........................................................................................................92

vii

4.10 EXPERIMENTAL FLEXURAL CAPACITY OF CONTROL

BEAMS ........................................................................................................95

4.11 EXPERIMENTAL FLEXURAL CAPACITY OF CORRODED

BEAMS ........................................................................................................96

4.12 EFFECT OF CORROSION ACTIVITY INDEX ON RESIDUAL

STRENGTH OF CORRODED BEAMS ..................................................98

4.13 THEORETICAL FLEXURAL CAPACITY OF CONTROL BEAMS.100

4.14 FLEXURAL STRENGTH OF CORRODED BEAMS ..........................101

4.15 POST-CRACKING COMPLIANCE OF CORRODED BEAMS.........107

4.16 MODE OF FAILURE OF CONTROL AND CORRODED BEAMS...107

CHAPTER 5

PREDICTION OF RESIDUAL FLEXURAL STRENGTH .............111

OF CORRODED BEAMS.....................................................................111

5.1 BASIS FOR THE DEVELOPMENT OF THE MODEL........................111

5.2 STRENGTH PREDICTION MODEL......................................................112

5.3 A VERIFICATION OF THE ACCURACY OF PROPOSED METHOD

WITH THE AVAILABLE DATA...........................................................120

CHAPTER 6

CONCLUSIONS AND RECOMMENDATIONS...............................124

6.1 CONCLUSIONS .........................................................................................124

viii

6.2 SUGGESTIONS FOR FUTURE STUDY ................................................126

APPENDIX A.............................................................................................128

Load - Deflection Curves ....................................................................................128

APPENDIX B .............................................................................................142

Sample Calculations of Theoretical Flexural Strengths of Both Control and

Corroded Beams Using Strain Compatibility Analysis......................................142

LIST OF NOTATIONS.............................................................................149

REFERENCES ..........................................................................................151

ix

LIST OF TABLES

Table 3.1: Test variables and specimens........................................................................40

Table 3.2: Grading of Coarse Aggregates.......................................................................43

Table 3.3: Weight of constituents in one cubic meter of concrete.................................44

Table 3.4: Designation for control specimens ...............................................................45

Table 3.5: Designation for corroded specimens .............................................................46

Table 3.6: Total current applied to beam specimens .....................................................57

Table 4.1: Average 28-day compressive strength of concrete, for 10 batches ..............68

Table 4.2: Yield and Tensile strength and strain of steel bars .......................................69

Table 4.3: Flexure Test Results of Control Beams ........................................................70

Table 4.4: Flexure Test Results of Corroded Beams .....................................................71

Table 4.5: Gravimetric weight loss and their conversion to Icorr ...................................86

Table 4.6: Relationship between Icorr and Iapp ................................................................88

Table 4.7: Variation in Current efficiency with the rebar diameter...............................89

Table 4.8: IcorrT versus ρ Data for all Sets of Cv and D Values.....................................90

Table 4.9: Effect of percentage weight loss on Load carrying capacity of

Corroded Beams………………………………………………………….93

Table 4.10: Average Experimental Moment Capacity of Control Beams .....................95

Table 4.11: Relationship between Experimental Moment Capacity of

corroded and Uncorroded beams………………………………………...97 x

Table 4.12: IcorrT versus R Data for all Sets of Cv and D Values ....................................98

Table 4.13: Mex,uc, Mth,uc, and Cc for Four Control Beams.............................................100

Table 4.14: D′, Mex,c, Mth,c and Cf for the Corroded Beams ..........................................105

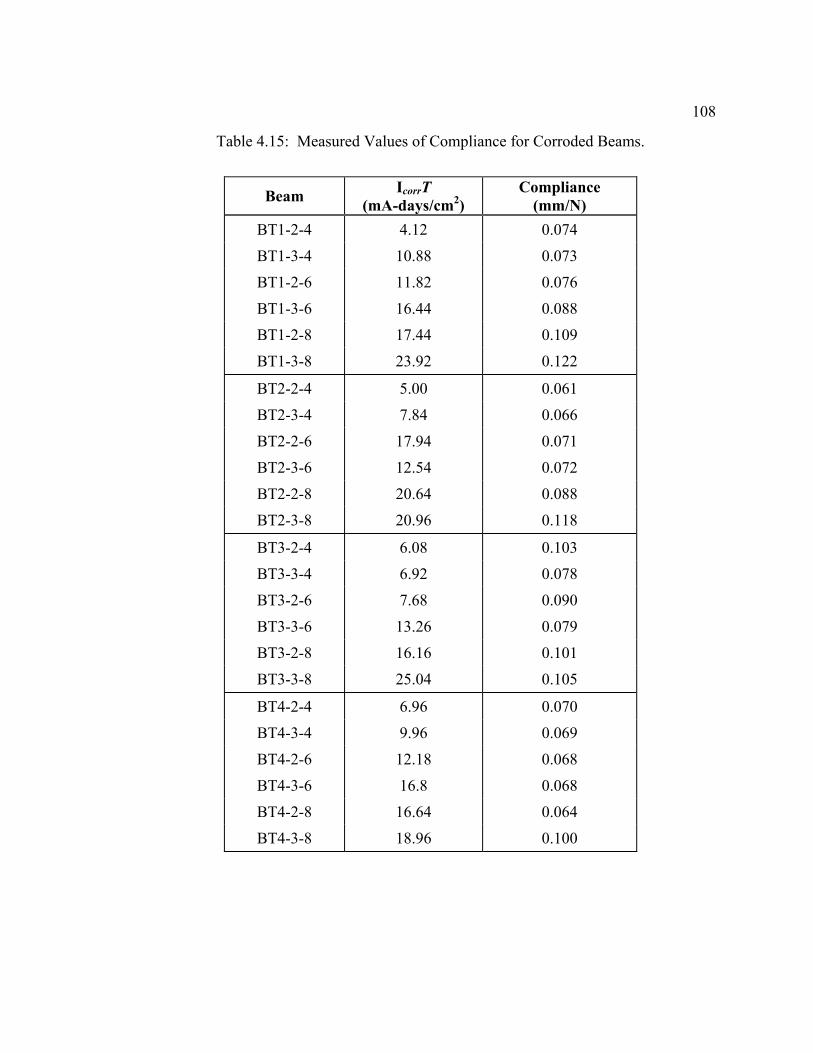
Table 4.15: Measured Values of Compliance for Corroded Beams ..............................108

Table 5.1: Values of Cf, Mth,c, Mex,c and Mres .................................................................114

Table 5.2: Comparison of the Proposed Model results with those reported

by Rodriguez et al. [12]………………………………………………......121

Table 5.3: Comparison of Proposed Model results with those of

Tachibana et al. [13] .................................................................................123

xi

LIST OF FIGURES

Figure 1.1: Effects of Reinforcement Corrosion on Reinforced Concrete Structures .....5

Figure 2.1: Micro-corrosion cell formation in reinforced concrete ..............................12

Figure 3.1: Reinforcement Details of Test Specimens. .................................................42

Figure 3.2: Arrangement for evaluating the tensile strength of steel bars .....................48

Figure 3.3: Spread of an electrical signal applied from a counter electrode [42]. ........52

Figure 3.4: Schematic representation of the set-up utilized to measure

the corrosion current density……………………………………………..53

Figure 3.5: Schematic representation of the accelerated corrosion test setup. ..............55

Figure 3.6: Beam specimens being subjected to accelerated reinforcement corrosion .58

Figure 3.7: A close-up view of the set-up utilized to accelerate reinforcement

corrosion in the beam specimens………………………………………...59

Figure 3.8: Set-up for four-point bend test of beam specimens.....................................61

Figure 3.9: Flexural strength test using Instron Universal Testing Machine.................61

Figure 3.10: Control beam specimen being tested in flexure .........................................62

Figure 3.11: A typical beam specimen being tested after 4 days of

corrosion acceleration……………………………………………………62

Figure 3.12: A typical beam specimen being tested after 6 days of

corrosion acceleration…………………………………………………..63

xii

Figure 3.13: A typical beam specimen being tested after 8 days of

corrosion acceleration………………………………………………….63

Figure 3.14: 10 mm diameter corroded bars..................................................................65

Figure 3.15: 12 mm diameter corroded bars..................................................................66

Figure 4.1: Stress-strain plot for 10 mm diameter reinforcing steel bar. .......................68

Figure 4.2: Stress-strain plot for 12 mm diameter reinforcing steel bar. .......................69

Figure 4.3: Typical Load-deflection plots for two control (BT1-C) specimens. ............73

Figure 4. 4: Typical Load-deflection plots for two control (BT3-C) specimens. ...........74

Figure 4. 5: Typical Load-deflection plots for two corroded (BT3-3-4) specimens. .....75

Figure 4. 6: Typical Load-deflection plots for two corroded (BT4-2-8) specimens. .....76

Figure 4. 7: Load-midspan deflection plot for BT1 subjected to...................................77

Figure 4. 8: Load-midspan deflection plot for BT2 subjected to...................................78

Figure 4. 9: Load-midspan deflection plot for BT3 subjected to...................................79

Figure 4. 10: Load-midspan deflection plot for BT4 subjected to.................................80

Figure 4.11: Corroded steel bars compared with original (uncorroded) bars .................84

Figure 4.12: Corroded steel bars compared with original (uncorroded) bars .................84

Figure 4.13: Corroded steel bars compared with original (uncorroded) bars .................85

Figure 4.14: Corroded steel bars compared with original (uncorroded) bars .................85

Figure 4. 15: Percentage weight loss versus IcorrT. ........................................................91

Figure 4. 16: Variation of load carrying capacity with percentage weight loss. ............94

Figure 4.17: Variation of Residual Strength with IcorrT and D. .....................................99

Figure 4.18: Variation of Cf with IcorrT and D. ..............................................................106

Figure 4. 19: Failure of a Typical Control Beam (BT1-C). ...........................................109

Figure 4. 20: Failure of a Typical Corroded Beam (BT1-3-4). .....................................110

xiii

Figure 5.1: Comparison of Measured Mres and the Predicted Mres .................................115

Figure 5.2: Relationship between MresActual-Rodriguez [12] and the Predicted Mres

using the proposed model ..........................................................................122

Figure A. 1: Load-midspan deflection plot for two BT1-C specimens .........................128

Figure A. 2: Load-midspan deflection plot for two BT2-C specimens .........................128

Figure A. 3: Load-midspan deflection plot for two BT3-C specimens .........................129

Figure A. 4: Load-midspan deflection plot for two BT4-C specimens ........................129

Figure A. 5: Load-midspan deflection plot for two BT1-2-4 specimens.......................130

Figure A. 6: Load-midspan deflection plot for two BT1-2-6 specimens.......................130

Figure A. 7: Load-midspan deflection plot for two BT1-2-8 specimens.......................131

Figure A. 8: Load-midspan deflection plot for two BT1-3-4 specimens.......................131

Figure A. 9: Load-midspan deflection plot for two BT1-3-6 specimens........................132

Figure A. 10: Load-midspan deflection plot for two BT1-3-8 specimens......................132

Figure A. 11: Load-midspan deflection plot for two BT2-2-4 specimens.....................133

Figure A. 12 : Load-midspan deflection plot for two BT2-2-6 specimens....................133

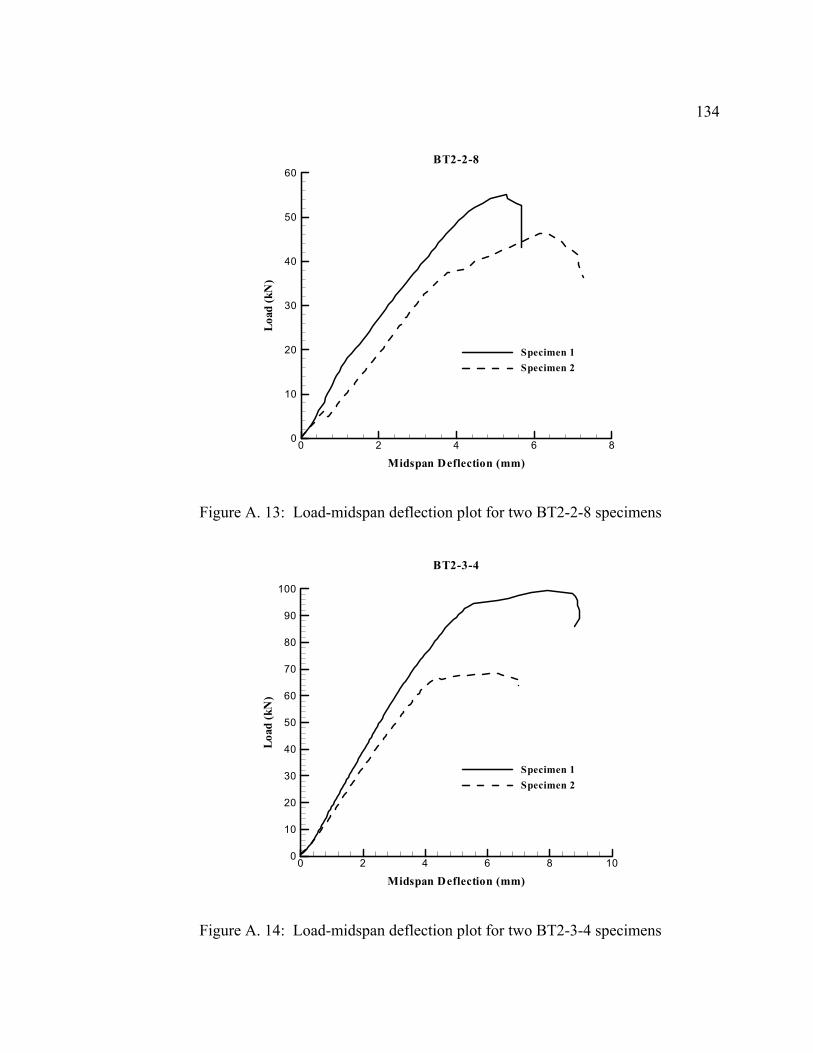
Figure A. 13: Load-midspan deflection plot for two BT2-2-8 specimens.....................134

Figure A. 14: Load-midspan deflection plot for two BT2-3-4 specimens.....................134

Figure A. 15: Load-midspan deflection plot for two BT2-3-6 specimens.....................135

Figure A. 16: Load-midspan deflection plot for two BT2-3-8 specimens.....................135

Figure A. 17: Load-midspan deflection plot for two BT3-2-4 specimens.....................136

Figure A. 18: Load-midspan deflection plot for two BT3-2-6 specimens.....................136

Figure A. 19: Load-midspan deflection plot for two BT3-2-8 specimens.....................137

Figure A. 20: Load-midspan deflection plot for two BT3-3-4 specimens.....................137

Figure A. 21: Load-midspan deflection plot for two BT3-3-6 specimens.....................138

Figure A. 22: Load-midspan deflection plot for two BT3-3-8 specimens.....................138

xiv

Figure A. 23: Load-midspan deflection plot for two BT4-2-4 specimens.....................139

Figure A. 24: Load-midspan deflection plot for two BT4-2-6 specimens.....................139

Figure A. 25: Load-midspan deflection plot for two BT4-2-8 specimens.....................140

Figure A. 26: Load-midspan deflection plot for two BT4-3-4 specimens.....................140

Figure A. 27: Load-midspan deflection plot for two BT4-3-6 specimens.....................141

Figure A. 28: Load-midspan deflection plot for two BT4-3-6 specimens.....................141

xv

THESIS ABSTRACT

Full Name SYED AYUB AZHER Title of Study A PREDICTION MODEL FOR THE RESIDUAL

FLEXURAL STRENGTH OF CORRODED REINFORCED CONCRETE BEAMS

Major Field CIVIL ENGINEERING (Structures) Date of Degree JANUARY 2005

Corrosion of reinforcing steel and subsequent concrete deterioration is a major problem faced by the construction industry. However, limited work is available for the estimation of the flexural strength of corrosion-damaged members. In the present work, an effort has been made to develop a model to predict the residual flexural strength of reinforced concrete beams with varying degree of reinforcement corrosion. The experimental variables included: applied corrosion current density, corrosion duration, rebar diameter, and thickness of concrete cover.

A total of 56 reinforced concrete beams (150 × 150 × 1100 mm) were cast using a common concrete mix, out of which 8 beams were earmarked as control beams that were not subjected to corrosion and the remaining 48 beams were subjected to corrosion by impressed current. All beams were tested in flexure in four-point bend tests. After testing in flexure the beams were broken to retrieve the reinforcing steel. The steel bars were cleaned to assess the gravimetric weight loss.

Results indicate that the product of corrosion current density and corrosion period, IcorrT, is the most significant factor affecting the flexural strength of a corroded beam. Diameter of steel bars also affected the extent of metal loss for identical IcorrT. The effect of cover thickness on the loss of flexural strength was found to be insignificant for a given beam at constant IcorrT.

Based on the experimental data, a two-step approach to predict the residual flexural strength of a corroded beam has been proposed. The usefulness of the proposed approach for prediction of the residual strength of the corroded beams for which information on corrosion current density, corrosion period, beam cross-section, and strength of materials are available has been illustrated through numerical examples. The accuracy of the proposed method has been verified by comparing the results with the test data available in the literature.

MASTER OF SCIENCE KING FAHD UNIVERSITY OF PETROLEUM AND MINERALS

Dhahran, Saudi Arabia January 2005

xvi

THESIS ABSTRACT (ARABIC)

ملخص الرسالة

سيد ايوب أزهر: الاسم

تقدير مقاومةالآنحناء المتبقية للجسور الخرسانية المسلحة المعرضة للصدا :عنوان الرسالة

"الانشاءات" الهندسة المدنية :التخصص

2005 يناير :تاريخ التخرج

وبالرغم من , لرئيسية التي تواجه صناعة التشييدالخرسانة الناتج عنها المشكلة اديد التسليح والتدهور في يعتبر صدأ ح

تم , في هذه الدراسة . ذلك لايوجد الى الأن طريقة تحليلة لتقدير مقاومة النحناء المتبقية للجسور المعرضة للضرر

تطوير طريقة لتقدير مقاومة الانحناء المتبقية للجسور الخرسانية المسلحة المعلرضة لدرجات مختلفة من صدا حديد

قطر حديد التسليح وسمك , مدة الصدأ, آثافة تيار الصدأ المستخدم : العناصر المتغيرة في هذه الدراسة هي .التسليح

.غطاء الخرسانة

من هذه الجسور لم يحدث 8, مم 150x 150 x 1100 جسر من الخرسانة المسلحة الشائعة والابعاد 56تم صب

آل الجسور أختبرت .أ حديد التسليح بعد التعرض للتيار الانودي وماتبقى من الجسور تعرضت لصد , أفيها صد

.لمقاومة الأنحناء وبعد الأختيار تم تكسير الجسور لاستخراج حديد التسليح وتنضيفه وقياس فقد الوزن فيه

على مقاومة الانحناء للجسور تؤثر بشكل رئيسي أوضحت النتائج أن حاصل ضرب آثافة تيار الصدأ ومدة الصدأ

قطر حديد التسليح يؤثر مباشرة على مدى الفقد في المعدن Tcorr Iآذلك تبين أن عند قيمة محددة , معرضة للصدأال

. تبين أن سمك غطاء الخرسانة لايؤثر على نقصان مقاومة الانحناءTcorr I آذلك عند ثبات قيمة.

وتم اثبات . مقاومة الانحناء للجسور المعرضة للصدأثم استخدام طريقة من خطوتين لتقدير , باستخدام النتائج المعملية

فائدة هذه الطريقة المقترحة وذلك باستخدام الامثلة العددية وذلك لتقدير مقاومة الانحناء للجسور المعرضة للأنحناء

حقق من وقد تم الت.أبعاد قطاع الجسر وآذلك مقاومة المواد ,مدة الصدأ, وذلك بتوفر معلومات عن آثافة تيار الصدأ

.دقة الطريقة بمقارنة النتائج مع النتائج المتوفرة في دراسات أخرى

MASTER OF SCIENCE KING FAHD UNIVERSITY OF PETROLEUM AND MINERALS

Dhahran, Saudi Arabia January 2005

xvii

CHAPTER 1

INTRODUCTION

1.1 REINFORCEMENT CORROSION

Corrosion of reinforcing steel is one of the major worldwide deterioration

problems for the reinforced concrete structures. Research in Saudi Arabia and

elsewhere in the Middle East indicated that the service life of buildings in the

Arabian Gulf is between 10 and 15 years [1]. What could be more frustrating than

knowing that corrosion was, in some cases, so severe that concrete damage

occurred even before the completion of construction? [2]. While corrosion of the

reinforcing steel is not the sole cause of all structural deficiencies, it is a

significant contributor and has therefore become a matter of major concern.

The highly alkaline environment of good quality concrete leads to the

formation of a passive film on the surface of the embedded steel, which protects it

from corrosion [3]. In addition, well-consolidated and properly cured concrete

with a low water to cement ratio has a low permeability, which minimizes

1

2

diffusion of corrosion inducing agents, such as chloride, carbon dioxide, moisture,

etc. to the steel surface. Further, the high electrical resistivity of concrete restricts

the rate of corrosion by reducing the flow of hydroxyl ions from anode to cathode.

At the outset, it must be mentioned that, usually in a properly designed,

constructed and maintained structure, there should be little or no problem of steel

corrosion during its design life.

Not all reinforced concrete structures have performed so well, however.

There have been numerous examples of durability problems arising from the

corrosion of reinforcement in concrete structures, mostly due to poor quality

concrete, inadequate cover over reinforcing steel, chlorides in the concrete or

combinations of these. These have led to various forms of corrosion-induced

damages, such as cracking and spalling and reduction in the load carrying capacity

of the structure. Indeed the scale of the problem can be judged from the size of the

concrete repair industry and the number of technical publications on the topic [4].

The basic problem associated with the deterioration of reinforced

concrete, due to reinforcement corrosion is not that the reinforcing steel itself is

reduced in mechanical strength, but rather that the products of corrosion exert

stresses within the concrete which cannot be supported by the limited tensile

strength of concrete, and therefore it cracks. This leads to a weakening of the bond

and anchorage between concrete and reinforcement which directly affects the

serviceability and ultimate strength of concrete elements within a structure [5].

3

When reinforcement corrodes, the strength of a reinforced concrete

member is undermined in several ways. Since corrosion products have a greater

volume than the parent steel, internal tensile stresses will develop in the concrete

at the steel/concrete interface. As a result, the surrounding concrete cracks and

will eventually spall away, as corrosion advances. In addition, under tensile

stresses developed during corrosion, existing fine cracks and microcracks in the

surrounding concrete tend to enlarge and form a network of interconnected cracks,

providing increased ionic transport between the surface of the concrete and the

surface of the reinforcing steel, effectively promoting the corrosion process. Crack

growth decreases concrete stiffness and tensile strength, while the formation of a

network of cracks increases concrete permeability. Thus, the structural integrity of

the reinforced concrete member is increasingly compromised as cracking

progresses. As steel is progressively lost to corrosion, its cross-section is reduced,

causing a decrease in the member’s flexural strength. Furthermore, as corrosion

advances, the bond between the steel and surrounding concrete is weakened,

adversely affecting the load transfer between the two materials. To ensure that

reinforced concrete members perform according to their design capacity and

design service life, it is important to prevent or delay the occurance of corrosion

[6].

4

1.2 EFFECT OF REINFORCEMENT CORROSION ON THE

PERFORMANCE OF REINFORCED CONCRETE

ELEMENTS

Where concrete has been carbonated to the depth of the steel

reinforcement and a small but uniform amount of moisture is present, the steel is

likely to corrode fairly uniformly. This deterioration is often indicated by fine

hairline cracking parallel to the direction of the reinforcement throughout the

length of the structural component. Fortunately, because corrosion is fairly

uniform, cracking of the concrete cover in normally reinforced or pre-tensioned

solid components usually occurs before the steel becomes excessively weak, so

giving early visual warning of the deterioration.

If chlorides are concentrated near the surface of the steel or access of water

and oxygen is restricted to a single location on the steel, severe pitting corrosion

may occur. This reduces considerably the cross-sectional area of the bars at these

locations, while the remainder of the bar may be left uncorroded. Structural

cracking, or honeycombing, can also create conditions favorable to pitting

corrosion by allowing the localized ingress of aggressive agents.

The reinforcement corrosion and concrete spalling cause a reduction in the

ultimate capacity, and more significantly, a reduction in the stiffness and ductility

of the R.C section primarily due to the loss or breakdown of the steel/concrete

5

interfacial bond. The effects of reinforcement corrosion on the behavior of

reinforced concrete elements are schematically shown in Fig.1.1.

EFFECTS OF REINFORCEMENT CORROSION

On Steel

Loss in cross-sectionand decrease in

mechanical strength

On Concrete

Rust stains, cracking, delamination and

spalling

On Steel Concrete bond

Inability to transfer the tensile strength ofsteel to concrete

IMPAIRED LOAD CARRYING CAPACITY OF REINFORCED CONCRETE STRUCTURES

Figure 1.1:Effects of Reinforcement Corrosion on Reinforced Concrete Structures.

6

1.3 EFFECT OF REINFORCEMENT CORROSION ON THE

FLEXURAL STRENGTH

The moment carrying capacity of an under-reinforced concrete beam

depends mostly on the strength of reinforcing steels. Therefore, loss of reinforcing

steel may be critical and requires special consideration. Corrosion is one of the

important causes of steel area loss. General corrosion, which appears uniformly

along the length of the reinforcement, will have two effects: firstly, it will reduce

the cross-sectional area of the steel and secondly, it will create local

discontinuities in the steel surface. These effects reduce the tensile capacity of the

steel in proportion to the loss of its cross-sectional area. Thus, as the corrosion

products increase, the cross-sectional area of steel decreases and hence, in

addition to the bond deterioration, the ultimate moment capacity of structure also

decreases, till the area of the steel becomes so small that it can no longer

withstand the load and hence results in the collapse of the structure.

Reinforcement corrosion does not affect the mechanical strength of the

bars to a large extent, but the corrosion products exert stresses within the concrete,

which cannot be supported by the limited tensile strength of concrete resulting in

the formation of cracks along the reinforcing bars. These cracks weaken the bond

and anchorage between steel and concrete, because of which stresses in concrete

cannot be transferred to the reinforcing steel properly thus affecting the

serviceability and ultimate strength of concrete elements.

7

1.4 NEED FOR THIS RESEARCH

Considerable research has been devoted to corrosion of reinforcement in

reinforced concrete dealing with various issues related to corrosion process, its

initiation and damaging effects. The prediction of time-to-corrosion cracking has

been of great interest that resulted in the proposition of several predictive models

for which several references [7-10] can be cited as representative samples of

work.

In view of the fact that corrosion damage reduces the strength of a

reinforced concrete element, it is of great interest to develop models that can be

used to predict the residual strength of a corroding concrete element. The need for

the prediction of the residual strength often arises to determine the underlying

safety of the corroding members and to decide when the repair or strengthening

must be undertaken without any further delay. Of the limited research that has

been carried out in this area, mention can be made of the works of Mangat and

Elgarf [11], Rodriguez et al. [12] and Tachibana et al. [13].

This study aims to make a contribution in the area of the prediction of the

residual strength of corroded reinforced concrete beam type members by

suggesting a predictive model that has been developed through an extended

experimental work on beams that were subjected to different degrees of corrosion

damage.

8

1.5 SCOPE AND OBJECTIVES

The scope of this work was limited to the development of an approach for

the prediction of residual strength of concrete beams using test data generated on

56 beams that were subjected to different degrees of corrosion damage.

The general objective of this work is to study the effect of reinforcement

corrosion on the residual strength of reinforced concrete beams. The specific

objectives are as follows:

i. To study the effect of corrosion on the residual strength of

reinforced concrete beams,

ii. To assess the cumulative effect of cover to reinforcement and rebar

diameter, on reinforcement corrosion, and

iii. To develop an approach for predicting the residual flexural strength

of concrete beams subjected to reinforcement corrosion, based on a

damage model that includes the corrosion rate and other applicable

parameters, such as rebar diameter and cover thickness.

CHAPTER 2

LITERATURE REVIEW

2.1 NATURE OF REINFORCEMENT CORROSION IN

CONCRETE

A few metals, notably gold, silver, and platinum, occur naturally; whereas

engineering metals, including steel, must be derived from their ores by smelting.

Ores are natural oxides, sulfides, and other reaction products of metals with the

environment. During smelting, a metal absorbs the energy required to free it from

the ore; and, this energy is retained within the metal after it is recovered.

However, this metallic state is unstable, because the metal tends to rid itself of this

extra energy by recombining with the environment to revert to its more stable and

natural state as an ore. This reversion process is known as oxidation or, more

specifically, corrosion.

9

10

A refined metal such as iron or steel has a natural tendency to corrode and thereby

return to the stable state that it exists in nature, as iron ore (typically iron oxide, Fe2O3).

The rate of steel corrosion depends on its composition, grain structure, and the presence

of entrained stress from fabrication. It also depends on the nature of the surrounding

environment, such as the availability of water, oxygen, and ionic species, pH, and

temperature.

The pore solution in a hydrated cement is highly alkaline (pH between 13

and 13.8). Thus, on ordinary reinforcing steel embedded in alkaline concrete a

thin protective oxide film (the passive film) is formed spontaneously. This passive

film is only a few nanometers thick and is composed of more or less hydrated iron

oxides with varying quantities of Fe2+ and Fe3+. The protective action of the

passive film is immune to mechanical damage of the steel surface. As long as this

film is not disturbed, it will keep the steel passive and protected from corrosion.

When a concrete structure is exposed to deicing salts, salt splashes, salt spray, or

seawater, chloride ions from these sources diffuse slowly into the concrete, mostly

through the pores in the hydrated cement paste. The chloride ions eventually reach

the steel and then accumulate to beyond a certain concentration level, at which the

protective film is destroyed and the steel begins to corrode, when oxygen and

moisture are present at the steel-concrete interface [14-15].

11

2.2 MECHANISM OF REINFORCEMENT CORROSION

Corrosion of steel embedded in concrete is an electrochemical process in

which the energy gained in the conversion of iron ore to steel is released in the

form of a direct current. The surface of the corroding steel functions as a mixed

electrode that is a composite of anodes and cathodes electrically connected

through the body of steel itself, upon which coupled anodic and cathodic reactions

take place. At anodic sites, metal atoms pass into solution as positively charged

steel ions (anodic oxidation) and the excess of electrons flow through the metal to

cathodic sites where an electron acceptor like dissolved oxygen is available to

consume them (cathodic reduction) to generate hydroxyl ions. The electrons

created in the anodic reaction must be consumed elsewhere on the steel surface

establishing the corrosion reaction. The process is completed by the transport of

ions through the aqueous phase, leading to the formation of corrosion products at

the anodic sites either soluble (e.g. ferrous chloride) or insoluble (e.g. rust,

hydrated ferric oxide). The different behavior of the same metal at two different

locations is usually found due to variations arising either during the

manufacturing, storage or transportation stages. Anodic and cathodic sites are

electronically connected as they exist on the same rod and they are ionically

connected by concrete pore water functioning as an aqueous medium, i.e., a

complex electrolyte. Therefore, a reinforcement micro-corrosion cell is formed as

shown in Figure 2.1.

12

½ O2 + H2O + 2e- → 2OH-

Concrete

Fe→Fe+++2e-

e-

H2OCor

rosi

on

Cur

rent

Anodic dissolution of Iron

O2

Reinforcing Steel

H2O(Concrete Pore Water )

CO2

Fe++ + 2OH- → Fe(OH)2

Cath

odeCl-

OH-

Figure 2.1: Micro-corrosion cell formation in reinforced concrete.

The voltage difference created between the anodic and cathodic sites

causes the electrons to flow from the anodic areas, via the body of the reinforcing

steel, to the cathodic locations.

The electrochemical mechanism of corrosion of steel can be summarized

with the following three partial processes

i. the oxidation of iron (anodic process) that liberates electrons in the

metallic phase and gives rise to the formation of iron ions (Fe →

Fe++ + 2e-);

13

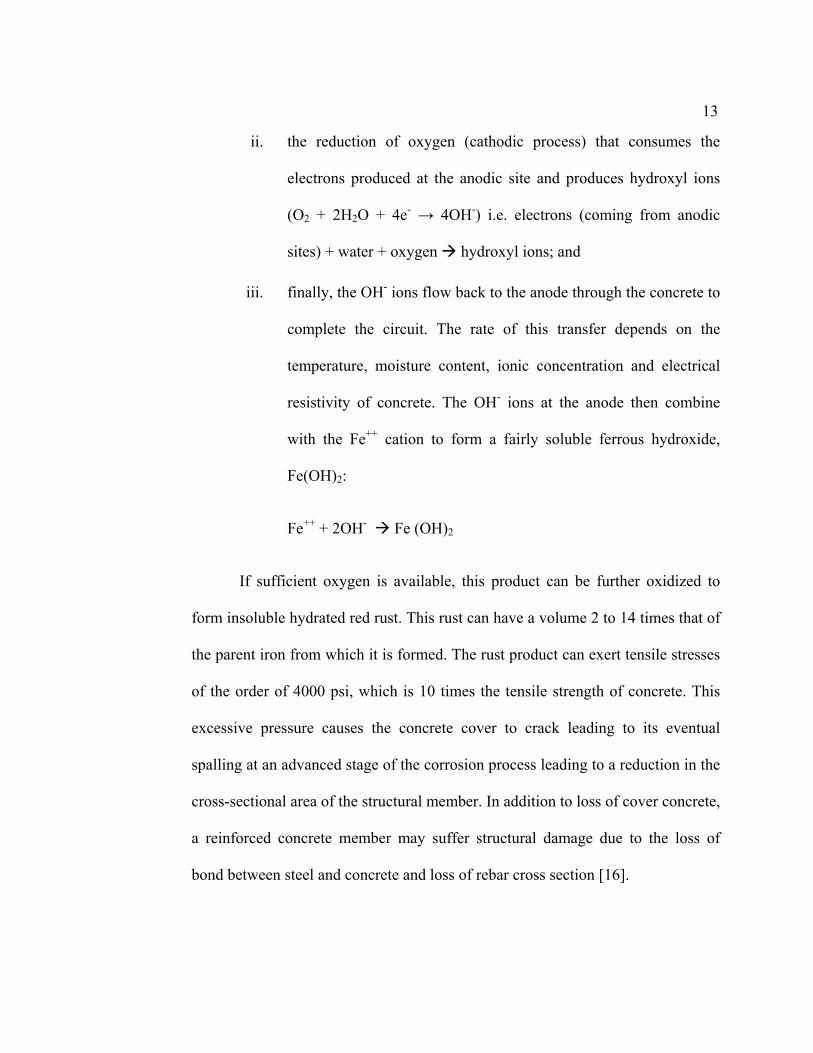
ii. the reduction of oxygen (cathodic process) that consumes the

electrons produced at the anodic site and produces hydroxyl ions

(O2 + 2H2O + 4e- → 4OH-) i.e. electrons (coming from anodic

sites) + water + oxygen hydroxyl ions; and

iii. finally, the OH- ions flow back to the anode through the concrete to

complete the circuit. The rate of this transfer depends on the

temperature, moisture content, ionic concentration and electrical

resistivity of concrete. The OH- ions at the anode then combine

with the Fe++ cation to form a fairly soluble ferrous hydroxide,

Fe(OH)2:

Fe++ + 2OH- Fe (OH)2

If sufficient oxygen is available, this product can be further oxidized to

form insoluble hydrated red rust. This rust can have a volume 2 to 14 times that of

the parent iron from which it is formed. The rust product can exert tensile stresses

of the order of 4000 psi, which is 10 times the tensile strength of concrete. This

excessive pressure causes the concrete cover to crack leading to its eventual

spalling at an advanced stage of the corrosion process leading to a reduction in the

cross-sectional area of the structural member. In addition to loss of cover concrete,

a reinforced concrete member may suffer structural damage due to the loss of

bond between steel and concrete and loss of rebar cross section [16].

14

Hence, it can be noted that oxygen and moisture are the most important

ingredients for reinforcement corrosion to occur and the ingress of these elements

through the concrete must be controlled to avoid corrosion.

Reactions at anodes and cathodes are broadly referred to as “half-cell

reactions”. The ‘anodic reaction’ is the oxidation process, which results in

dissolution or loss of metal (loss of electrons) while the ‘cathodic reaction’ is the

reduction process which results in the reduction of dissolved oxygen forming

hydroxyl ions. According to the different spatial location of anode and cathode,

corrosion of steel in concrete can occur in different forms:

i. as mircocells, where anodic and cathodic reactions are immediately

adjacent to each other, leading to uniform iron dissolution over the

whole surface. The distance between the two sites may be a

micron. Uniform corrosion is generally caused by carbonation of

concrete or by very high chloride content at the steel surface, and

ii. as macrocells, where, corroding areas of the rebar (anode) and non-

corroding, passive surfaces (cathode) are separated by a finite

distance, which may be centimeters or meters. The anode and

cathode may occur on the same bar or on different bars with

electrical continuity.

Macrocell corrosion is of great concern because the local dissolution rate

(reduction in cross-section of the rebar) may greatly be accelerated due to the

15

large cathode/anode area ratio. This rapid corrosion attack may lead to structural

safety problems.

Generally, the surface of active reinforcing steel in concrete will corrode

under the effect of a combination of many microcell and macrocell interactions.

2.3 EFFECT OF REINFORCEMENT CORROSION ON

BEHAVIOR OF CONCRETE MEMBERS

In order to review the works of earlier researchers on the topics related to

the behavior of concrete member with reinforcement corrosion, an extensive

literature survey was carried out. It has been observed that the work related to this

study has been carried out on three fronts, namely: (i) time to cover cracking of

concrete after initiation of corrosion, (ii) loss of bond between steel and concrete

due to corrosion, and (iii) flexural strength of a corroding reinforced concrete

member. The literature review is therefore presented in the following three

sections addressing the aforesaid parameters.

2.3.1 Time to Cover Cracking of Concrete Due to Corrosion

As the mechanisms producing reinforcement corrosion are time-

dependent, effective design and specifications for whole-life performance should

be based, where possible, on models of the effects of those mechanisms on service

16

life. There are several ways of predicting service life due to the corrosion damage

of reinforcement in concrete using different deterioration models. Several

researchers have documented the processes of diffusion of chloride, oxygen and

moisture through concrete, and their effects on corrosion initiation and subsequent

rate of concrete deterioration.

Fick’s second law has been used extensively to predict the initiation of

chloride-induced reinforcement corrosion in concrete. This is in spite of the fact

that the assumptions that validate this application hardly exist in the world of

reinforced concrete structures in service [17]. Results produced from a

comprehensive test program [18] have provided quantitative evidence that Fick’s

second law is not applicable to concrete structural members with crack widths of

greater than 0.1 mm and many concrete design codes and standards prescribe the

limit of crack width to greater than 0.1 mm.

Tuutti [19] suggested a model for predicting the service life of reinforced

concrete structures. The maximum acceptable corrosion level was related to the

appearance of cracks. This depicted corrosion as a two-stage process. First there is

an initiation period during which carbonation or chloride ingress occurs, starting

at the surface and progressing on a time-dependent basis to the reinforcement.

This is followed by a propagation period from the onset of corrosion to the point

at which some unacceptable level of deterioration in concrete is reached. This

might be the onset of cracking or some predetermined loss of reinforcement cross-

17

sectional area or perhaps some degree of reduction in serviceability or load-

carrying capacity.

Bazant [9] developed a simplified mathematical model to determine the

time to cracking of concrete due to chloride-induced reinforcement corrosion

based on steady-state corrosion. Bazant’s model for the prediction of corrosion

damage considers the volume expansion due to the formation of hydrated red rust,

[Fe(OH)3], over the residual rebar core. This red rust is expansive in nature and

occupies two to ten times the volume of parent steel. Thus, a uniform radial

pressure is exerted onto the surrounding concrete resulting in outward radial

deformation of concrete. This deformation increases with an increase in the

volume of rust till the cover concrete cracks and it is rendered functionally

unsatisfactory. When corrosion is in a steady-state with a constant rate, the

unacceptable deformation of concrete at cracking can be related to the duration of

steady-state corrosion.

In the Bazant’s model, the time to cracking is a function of corrosion rate,

cover depth, spacing, and certain mechanical properties of concrete, such as

tensile strength, modulus of elasticity, Poisson’s ratio and creep coefficient. A

sensitivity analysis of Bazant’s model demonstrates that for these parameters,

corrosion rate is the most significant parameter in determining the time to

cracking of the cover concrete. Unfortunately, Bazant’s model has never been

validated experimentally.

18

Based on field and laboratory data, Morinaga [7], suggested empirical

equations that can be used for predicting the time to cracking. It is assumed that

cracking of concrete will first occur when a certain quantity of the corrosion

product is formed. The model can be used to compute the amount of corrosion

products, when concrete cover cracks due to expansion by means of rust

formation on rebar surface. The calculated value of the amount of rust may be

divided by the steady-state corrosion rate to obtain the time of cover cracking.

According to Morinaga’s equations, the time to cracking is a function of the

corrosion rate, concrete cover thickness and bar diameter.

Bazant’s mathematical models and Morinaga’s empirical equations are

based on the steady state corrosion process to calculate the time to cracking. But

since, the corrosion is a dynamic process, use of a simple linear function to

describe the relationship between the growth of rust products and time may

underestimate the time to cracking of corrosion of steel in concrete.

Wang and Zhao [10] have suggested a step method of using finite element

analysis to determine the thickness of the corrosion product corresponding to the

time duration when the surface concrete cracks. Further, by analyzing a large

number of rebar corrosion data collected from laboratory studies and then by

comparing them with the results of finite element analysis, the authors have

established an empirical expression to determine the ratio of thickness of the

corrosion product to the depth of rebar penetration corresponding to the cracks in

19

cover concrete. This ratio is termed as expansion coefficient and has been

expressed as a function of cube strength of concrete.

Using the value of the thickness of corrosion product, obtained through the

finite element model, the depth of rebar penetration corresponding to cracks in

cover concrete can be obtained. Further, the depth of rebar penetration can be used

to determine the time necessary for longitudinal cracking of concrete cover.

However, the model suggested by Wang and Zhao [10] can be used only in

conjunction with the finite element model requiring the determination of the

thickness of the corrosion product.

Dagher and Kulendran [8] have also carried out finite element modeling of

corrosion damage in concrete structures. Their numerical model is rather versatile

in terms of estimating the radial bar expansion, ∆, and includes: (a) a number of

options for modeling crack formation and propagation, (b) the capacity to accept

any shape of corrosion around the rebars, (c) the ability to incorporate dead and

live load stress and initial shrinkage and temperature cracks in the analysis, and

(d) pre- and post-processing modules that offer automatic mesh generation and

visual representation of crack propagation.

In the context of service life prediction of RC structures subjected to rebar

corrosion, the model of Dagher and Kulendran [8], can be used more reliably to

determine the radial bar expansion, at which the cracks in cover concrete would

20

occur. However, their work will require extension to make it capable to predict

service life.

Above studies indicate that it is possible to determine the time of corrosion

cracking, if the data pertaining to corrosion rate, cover thickness, rebar diameter,

etc could be collected. However, the cover cracking due to reinforcement

corrosion may not be considered as an indication of the end of the service life. The

member with cracked cover may continue to be in service provided that the

residual strength of the structure is still large enough to resist the loads.

2.3.2 Effect of Reinforcement Corrosion on Bond between Steel

and Concrete

In the field of reinforced concrete, the bond between concrete and

reinforcing bar can be thought of as the property which causes hardened concrete

to grip an embedded steel bar and thus prevent the longitudinal sliding of the

reinforcing bar through the concrete. This property ensures an effective interaction

between steel and concrete. Bond stress can be defined as the force per unit of

normal surface area of the reinforcing bar acting parallel to the bar on the interface

between the bar and the surrounding concrete.

Bond stress may also be thought as the rate of transfer of load between

concrete and steel. In other words, if there is bond stress there will be a change in

steel stress and vice versa. Whenever the tensile or compressive forces in a bar

21

change, to maintain the equilibrium, this change in bar force must be resisted at

the contact surface between the steel and concrete by an equal and opposite force

produced by bond between the reinforcing bar and concrete.

Since the external load is not directly applied to the reinforcement, steel

receives its share of the load only from the surrounding concrete. The composite

action of concrete and steel as one member is assured only if there exists, a perfect

bond between steel and concrete in order to transfer the stresses from concrete to

steel. Efficient bond ensures an efficient structural behavior of a reinforced

concrete member.

Amleh and Mirza [20] studied the influence of corrosion on bond between

the reinforcing steel and concrete using a preliminary series of tests on 14 tension

specimens, each 100 mm in diameter and 1-m long and reinforced with one No.

20 bar (19 mm in diameter). 12 of the 14 specimens were placed in a tank filled

with a 5% NaCl solution. The study was carried out for seven different levels of

corrosion, ranging from no corrosion (with no cracks), to extensive corrosion,

with a 9-mm longitudinal crack caused by the bursting pressure resulting from the

volume expansion of the corrosion products. They have reported a 9% loss of

bond strength due to 4% loss of weight from corrosion accompanied by transverse

cracks, while a 17.5% weight loss with no transverse cracks before yielding of the

bar resulted in 92% loss of bond between the steel and the surrounding concrete.

22

The width of these transverse cracks increased as the corrosion level increased,

and it signified a reduction of bond between the reinforcing steel bar and concrete.

Fu and Chung [21] have reported that the corrosion of steel rebar in

concrete immersed in saturated Ca(OH)2 solution caused the bond strength to

increase while the contact resistivity increased. This behavior persisted until 5

weeks of corrosion. Further corrosion, beyond 5 weeks, caused the bond strength

to decrease while the contact resistivity continued to increase. This means that

slight corrosion (<5 weeks) increased the bond strength, whereas severe corrosion

(>5 weeks) decreased the bond strength.

Auyeung et al. [22] in their study on bond behavior of corroded

reinforcement bars have found that when the mass loss of the reinforcement due to

corrosion reaches approximately 2%, concrete cracks along the bar. A small

amount of corrosion increases both the bond strength and bond stiffness, but the

slip at failure decreases considerably. However, they stated that when the mass

loss exceeds 2%, bond stiffness decreases considerably. Therefore, failure of

specimens with corroded bars can be expected to be much more brittle compared

to control specimens with uncorroded bars. Even when there is extensive

corrosion with considerable cracking of concrete, bond is not completely

destroyed. Measurable bond strength exists even when the mass loss approaches

6%. This partially explains the fact that structures with extensively corroded

reinforcement sometimes sustain considerable loads.

23

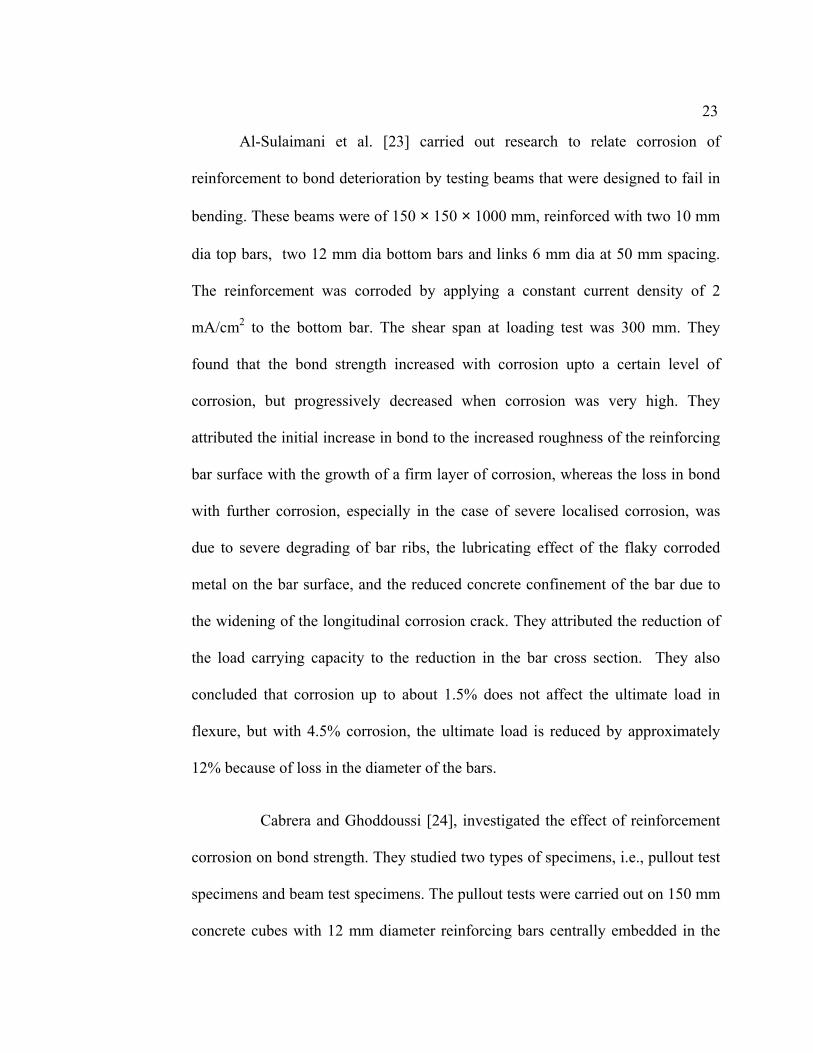
Al-Sulaimani et al. [23] carried out research to relate corrosion of

reinforcement to bond deterioration by testing beams that were designed to fail in

bending. These beams were of 150 × 150 × 1000 mm, reinforced with two 10 mm

dia top bars, two 12 mm dia bottom bars and links 6 mm dia at 50 mm spacing.

The reinforcement was corroded by applying a constant current density of 2

mA/cm2 to the bottom bar. The shear span at loading test was 300 mm. They

found that the bond strength increased with corrosion upto a certain level of

corrosion, but progressively decreased when corrosion was very high. They

attributed the initial increase in bond to the increased roughness of the reinforcing

bar surface with the growth of a firm layer of corrosion, whereas the loss in bond

with further corrosion, especially in the case of severe localised corrosion, was

due to severe degrading of bar ribs, the lubricating effect of the flaky corroded

metal on the bar surface, and the reduced concrete confinement of the bar due to

the widening of the longitudinal corrosion crack. They attributed the reduction of

the load carrying capacity to the reduction in the bar cross section. They also

concluded that corrosion up to about 1.5% does not affect the ultimate load in

flexure, but with 4.5% corrosion, the ultimate load is reduced by approximately

12% because of loss in the diameter of the bars.

Cabrera and Ghoddoussi [24], investigated the effect of reinforcement

corrosion on bond strength. They studied two types of specimens, i.e., pullout test

specimens and beam test specimens. The pullout tests were carried out on 150 mm

concrete cubes with 12 mm diameter reinforcing bars centrally embedded in the

24

cube. The beam specimens were 125 × 160 × 1000 mm, reinforced with two 10

mm plain top bars, two 12 mm bottom bars and plain links of 8 mm at 40 mm

spacing, as a web reinforcement along the shear span of 384 mm. In order to

obtain corrosion in a reasonable time, a voltage of 3 V was impressed through the

specimen bottom bars up to 40 days. Maximum reduction of the cross section

(9%) at bottom bar caused a reduction of 20% of the ultimate bending moment,

and an increase of 40% of the deflection at mid-span corresponding to the service

load.

Almusallam et al. [25] investigated the effect of reinforcement

corrosion on the bond strength between steel and concrete. They noticed that in

the precracking stage (0-4% corrosion) the ultimate bond strength increases.

When reinforcement corrosion is in the range of 4 to 6%, the bond failure occurs

suddenly at a very low free-end slip. Beyond 6% rebar corrosion, the bond failure

resulted from a continuous slippage of rebars. The ultimate bond strength initially

increased with an increase in the degree of corrosion, until it attained a maximum

value of 4% rebar corrosion after which there was a sharp decrease in the ultimate

bond strength up to 6% rebar corrosion. Beyond the 6% rebar corrosion level the

ultimate bond strength did not vary very much even up to 80% corrosion.

The above researchers have correlated reinforcement corrosion with the

loss of bond between steel and concrete. Corrosion of steel embedded in concrete

is not visually evident until the damage reaches to the external signs of

25

deterioration as rust spots, cracks or spalling. In order to predict the corrosion

service life of reinforced concrete structures, it is therefore more useful to

determine the residual load carrying capacity of a corroding reinforced concrete

member than the loss of bond.

2.3.3 Flexural Strength of a Corroding Reinforced Concrete

Member

From the available literature it has been observed that research related to

the determination of flexural strength of corroding reinforced concrete members

has been carried out mostly on two fronts: (i) corrosion of steel in concrete in

relation to bar diameter and cover thickness, and (ii) residual flexural strength of

corroding reinforced concrete structures. These aspects are discussed in the

following subsections.

2.3.3.1 Corrosion of steel in concrete in relation to bar diameter and cover

thickness

The concrete cover over reinforcing steel is one among the factors that

significantly controls the durability performance of reinforced concrete structures.

It influences the time for the ingress of the aggressive species to the steel surface.

Non-uniform cover leads to the formation of concentration cells that may lead to

corrosion initiation. Cover also plays a significant role in determining the extent

of cracking in fresh concrete occuring over top reinforcement due to restraint

26

provided by the top bars to the settlement of concrete. Results of some long-term

exposure tests in seawater or in sprayed salt solution also indicated significant

eduction of corrosion, as the cover was progressively increased from ½ in. to 1.5

in., and almost no corrosion at a cover of 2 in.

Ravindrarajah and Ong [26] investigated the effect of the diameter of the

steel bar, and the thickness of the cover on the degree of corrosion of mild steel

bars embedded in mortar. The main parameters of the study were the quality of

cover mortar, the diameter of the steel bar, and the thickness of the cover. The

specimens were cylindrical in shape and each specimen consisted of a single mild

teel bar placed centrally. All the corrosion specimens were partially submerged in

a 5% sodium chloride solution. The current was impressed on the steel bars from a

DC rectifier of a constant voltage. A 5V supply was selected to cause a significant

intensity of corrosion in steel bars within a reasonable period. They found that

there is a significant effect of rebar diameter, cover thickness, and specimen size

on the corrosion intensity. The intensity of corrosion of reinforcing steel in

concrete was found to increase with an increase in the bar diameter. With the

increase in the bar diameter the cover thickness reduces and the corrosion

resistance decreases. This is expected since larger bar size have lower electrical

resistance and smaller cover thickness shortens the diffusion path for the chloride

ions. The relationship between the iron loss and cover/bar diameter was found to

be linear. For the same diameter of bar, the corrosion intensity of steel increased

when the cover thickness was decreased. The surface area of the corrosion

27

specimen through which the chloride ions diffuse was also found to be an

important parameter in determining the rate and extent of corrosion of embedded

steel in concrete.

From condition surveys and laboratory and exposure site studies,

Rasheeduzzafar et al. [27-28] indicated that the cover over reinforcement has the

most significant effect on the extent of rebar corrosion. In condition surveys on 42

reinforced concrete framed structures, 15 to 20 years old and located in Eastern

Saudi Arabia, 76 spalls of varying dimensions and severity were observed during

168 observations covering approximately 12,000 square feet of concrete area. In

68% of the observed spalls, the thickness of concrete cover was less than ½ in.;

while in 53%, it was less than 3/8 in.; and in 18% of observations, it was less than

¼ in. There were seven cases (9.2%) where there was almost no cover over

reinforcing steel. Cover measurements on several partially spalled floor slabs

showed that spalls were invariably located in regions of insufficient cover.

Rasheeduzzafar et al. [29], based on their field and laboratory results,

recommended the following cover for structures serving in various environments

of the Arabian Gulf:

i. Building components which are permanently exposed to the salt-laden

corrosive atmosphere: 2.0 inch

ii. Building components which are protected against weather and the

aggressive conditions of exposure: 1.0 to 1.5 inch

28

iii. Concrete components exposed to seawater and footings as well as

other main structural members cast against the ground: 3.0 inch.

Tarek Uddin et al. [30], studied the influence of crack width and type of

bars (plain and deformed) on corrosion of steel bars in cracked concrete.

Microcell and macrocell corrosions of plain and deformed steel bars were

investigated on 100 × 100 × 400 mm, single cracked specimens with crack widths

of 0.1 mm, 0.3 mm and 0.7 mm. Electrochemical investigations were also

conducted on 150 × 150 × 1250 mm multicracked specimens with plain and

deformed bars. For these specimens, crack widths were varied from 0.1 to 0.4

mm. After electrochemical investigations, the chloride ions in concrete, the

corroded areas, the weight loss of the rebar and pit diameters of the steel bars were

investigated. It was observed that deformed bars showed more current densities

than plain bars. The results indicate that the corrosion rate of plain bars is less than

the corrosion rate of deformed bars. Also, for the same crack width, the specimens

with deformed bars showed higher oxygen permeability than the specimens with

plain bars.

29

2.3.3.2 Residual flexural strength of corroding reinforced concrete structures

The moment carrying capacity of a reinforced concrete beam depends

mainly on the strength of reinforcing steel. Therefore, loss of reinforcing steel area

may be critical and requires special consideration. Corrosion is one of the

important causes of steel area loss. The strength reduction due to the reinforcing

steel area loss is a linear function of the loss of material [31].

Ting and Nowak [31] developed a method for calculation of the effect of

reinforcing steel area loss (due to corrosion or other causes like mechanical

damage) on the moment carrying capacity of corroded reinforced concrete beams.

They developed a numerical procedure using finite difference method by

considering various types of concrete members including a solid slab, void slab,

rectangular beam, T-beam and box beam. The procedure was demonstrated on

evaluation of the reinforcing steel area loss effect for a typical reinforced concrete

bridge girder. According to their approach, the reinforcing steel area loss is a

linear function of the loss of material. This is in contrast to the results of Uomoto

and Misra [32], who found that the deterioration of structures caused by the

reinforcement corrosion is not always directly related to the loss of strength of the

bars due to a reduction in cross-sectional area, but some other factors, such as

crack formation in concrete and loss of bond could lead to greater reduction in

strength of the structure.

30

Huang and Yang [33] carried out experiments on 32 corroded reinforced

concrete beams, of dimensions 15 × 15 × 50 cm, of which 16 had predetermined

cracks, so as to study the effect of reinforcing steel area loss on flexural behaviour

of reinforced concrete beams. Two # 4 bars were used as flexural reinforcement

and no shear reinforcement was provided. An impressed current was applied to

the beams in order to accelerate steel corrosion. The load carrying capacity of RC

beams decreased as the corrosion product increased. The percentage reduction in

the loading capacity of the RC beam subjected to corrosion was approximated by

the calculated loss of rebar diameter. Based on the results, it was found that for a

10% reduction in the loading capacity of an RC beam, the calculated loss of

thickness of steel ranged from about 0.2 µm to 1.44 µm. By comparing the loss of

steel thickness with the reduction of the stiffness or loading capacity of the RC

beams, they concluded that a small loss of thickness may cause a significant

reduction in the load carrying capacity for high strength concrete beams or

defective beams.

Yoon et al. [34] investigated concrete beam specimens having dimensions

100 mm × 150 mm × 1170 mm, reinforced with a single standard No. 6 (19 mm

diameter) Grade 60 reinforcing steel bar. The cover of the reinforcing steel was 30

mm. To avoid excessive corrosion at the ends of the reinforcing bar, the ends of

60 mm length of the bar was coated with epoxy. A normal strength concrete

(water-cement ratio of 0.5) was used in the investigation. The effect of the extent

31

of steel corrosion on remaining loading capacity of the concrete beams was

studied relating the remaining flexural loading to the percentage weight loss of

reinforcing steel. A four-point loading configuration was used with the distance

between two end supports of concrete beam specimens as 1050 mm, and a pure

bending moment was generated within a region of 230 mm in the middle part of

the beams. It was found that, for the beams having a degree of corrosion ≥ 3%

weight loss of steel, the remaining loading capacity of the beams decreased as the

percentage weight loss of the reinforcing steel increased indicating that the loss of

the loading capacity might be primarily due to the loss of steel-concrete bond.

They also stated that as the degree of steel corrosion increased, the failure mode of

the reinforced concrete beams shifted from a shear failure to bond splitting failure.

In fact, the lower the remaining load carrying capacity of a beam, the clearer the

steel-concrete bond failure was seen from the flexure testing.

Cabrera [5] carried out loading tests with six corroded beams having a

cross section of 125 × 160 mm, reinforced with two 10 mm plain top bars, two 12

mm bottom bars and plain links of 8 mm at 40 mm spacing, as a web

reinforcement along the shear span of 384 mm. Around 2% chloride was added to

the concrete to accelerate the corrosion process. The specimens were kept partially

immersed in a chloride solution during the corrosion acceleration process which

was achieved by applying a voltage of 3 V versus saturated calomel electrode

(SCE) between external counter electrodes and the bars. The amount of steel loss

32

was estimated by the gravimetric mass-loss method. The beam specimens were

tested as simply supported beams with two concentrated loads using an Instron

testing machine. When the percent mass loss was smaller than 2%, the moment

capacity increased almost 20%. Otherwise, an approximately linear decrease

occurred in the moment capacity when the percent of mass loss increased.

Maximum reduction of the cross section (9%) at bottom bar caused a reduction of

20% of the ultimate bending moment and an increase of 50% of the deflection at

mid-span corresponding to the service load.

Rodriguez et al. [12] carried out experiments on six different types of

reinforced concrete beams of 150 × 200 × 2300 mm. A constant anodic current of

0.1 mA/cm2 was applied for a period of time ranging between 100 and 200 days.

After the corrosion-acceleration stage, the beams were tested under bending by a

four-point loading test using 400 mm spacing between the loads. The bending

moment capacity of the control beams was about 37 KN-m. After 100 days of

accelerated corrosion, the capacity was reduced to 26 KN-m (30% decrease).

After 200 days, the capacity was reduced to 20 KN-m (46% decrease). They

found that the experimental value of the bending moment at maximum load, in

beam with only bottom bars corroded, was close to the calculated value, using the

reduced section of the bottom bars. No damage occurred at the top concrete cover

because neither the top bars nor the links were corroded in the beam. They

concluded that, it is possible to predict a conservative value of either the ultimate

bending moment or the ultimate shear force, for high levels of corrosion, by

33

means of using RC conventional models and considering the reduced section of

both steel and concrete.

Uomoto and Misra [32] carried out a large experimental work with

corroded beams and columns so as to study the load carrying capacity of concrete

structures with corroded reinforcement. Accelerated corrosion was induced by

adding sodium chloride to the mixing water and applying a constant current

density to the reinforcement ranging from 280 to 380 µA/cm2 for a period ranging

from 7 to 14 days. Beam specimens 100 × 100 × 700 mm, reinforced with two 10

mm dia bottom bars, were tested and it was observed that most beams failed in

shear. Also, beams measuring 200 × 100 × 2100 mm, reinforced with two 6mm

dia top bars, 2-16mm dia bottom bars and links 6mm dia at 170 mm spacing, were

tested, resulting in compression failure of concrete, with buckling of the top bars

(no links existed at the constant moment span). They concluded that the reduction

in the load-carrying capacity of the beams was not caused simply by the reduction

in the effective area or the reduction in strength of reinforcing bars, but by the

cracks formed by the corrosion process. Weight loss of 1% to 2.4 % in the main

reinforcing bars (16 mm dia) corresponded to 4% to 17 % of reduction in the load

carrying capacity.

Tachibana et al. [13] carried out tests with corroded beams of 200 × 150 ×

2000 mm. The beams had no shear reinforcement but were reinforced

longitudinally with two 16 mm diameter bottom bars. All specimens, except the

34

control were corroded by applying an anodic current density of 0.5 mA/cm2 for 0-

day (non-corroded), 3, 6, 10 and 15 days. The specimens were fully immersed in a

3.5 % sodium chloride solution. The results of the loading tests showed that, non-

corroded and mildly corroded specimens for the current period of 3 days had a

normal behavior and failed in flexure with yielding of steel bars. On the other

hand, the specimens for the current period of 10 days and 15 days showed

deteriorated behaviour and failed in a brittle manner, and the reduction in stiffness

and the load carrying capacity occurred, and specimens for the current period of 6

days showed intermediate behaviour. A 16% loss of capacity in the beams was

reported after 15 days of current application. The maximum percentage weight

loss of reinforcement was about 5%. With regard to the load carrying capacity of

the RC beams with stirrups, they concluded that the reduction in load-carrying

capacity of RC beams with stirrups will not be remarkable, as the transmission of

shear stress between concrete and reinforcement will be secured through the

stirrups even when bond of reinforcement has deteriorated.

Nokhasteh et al. [35], conducted preliminary flexural tests on three simply

supported RC beams. The specimens were of dimensions 130 × 200 × 2350 mm

with 16 mm smooth mild black steel bars. All beams carried two 6 mm mild steel

bars as top steel. The ultimate load capacity of the control specimens was

calculated theoretically using the stress-block factors derived from the empirically

determined relationships of Hognestad et al. [36] suitably modified for use with

concrete cube strengths. All three beams failed in a ductile manner, they all

35

suffered from fewer but wider cracks, larger central deflections and finally from a

reduction in the ultimate load capacity. The authors developed a two-dimensional

finite element model for the damaged beam. The load-central deflection curves

derived from the FE analysis showed a decrease in stiffness of the damaged beams

as compared with their undamaged counterparts. They concluded that corrosion of

link reinforcement is likely to be more significant than the main bars because: (i)

there is less cover to link reinforcement, (ii) stressing due to bending of the bars

increases corrosion, and (iii) the links are smaller in diameter.

Aziz [37] investigated the effect of reinforcement corrosion on the flexural

strength of a uniformly loaded and simply supported one-way slab. The slab

dimensions were 305 × 711 × 63.5 mm, with a center-to-center span of 610 mm.

Five # 2 (6 mm diameter) bars were used as the main reinforcement and were

placed in the slab with a 57 mm center-to-center spacing and with a 9.5 mm clear

cover. The specimens were partially immersed in a 5% sodium chloride solution

and a constant current of 2 A was applied to all the specimens. They have reported

a sharp reduction in the ultimate flexural strength of slabs with up to 20%

reinforcement corrosion; thereafter, the strength decreased at a somewhat reduced

rate with further increase in reinforcement corrosion. The reduction in the ultimate

flexural strength of slabs with 5% reinforcement corrosion was 25%, while it was

60% in the slabs with 25% reinforcement corrosion.

36

Mangat and Elgarf [11] have carried out research work on developing a

relationship between the degree of reinforcement corrosion and the residual

strength of flexural members through an experimental scheme. The beam

dimensions were 100 × 150 × 910 mm. Four different current densities from 1

mA/cm2 to 4 mA/cm2 were applied to induce different degree of accelerated

reinforcement corrosion, without representing countervailing interactions with

shear reinforcement since the shear reinforcement was provided externally.

Exposure time was between 15 and 18 days. After the corrosion-acceleration

period, the specimens were tested in flexure under four-point loading with the

distance between the loading points being 300 mm. Up to a degree of corrosion

(percentage reduction in reinforcement bar diameter) of 3.75%, there was very

little effect of corrosion rate on flexural load capacity. However, at a corrosion

degree of 5 % and beyond, the flexural load capacity decreased significantly with

increasing corrosion rate. The study obtained a 75% decrease in load capacity for

a 10% diameter reduction. They found that reinforcement corrosion in concrete

has a marked effect on both the flexural load capacity and deflection of beams.

Also, the reduction in reinforcing bar cross-section due to corrosion has an

insignificant effect on the residual flexural strength of the beams. The reduction in

residual strength was primarily attributed to the loss or breakdown of the

steel/concrete interfacial bond. A trigonometric function, in terms of the rate of

corrosion, corrosion time and bar diameter, was proposed to predict the residual

strength of corroded beams.

37

Jin and Zhao [38] carried out beam tests to study the effect of

reinforcement corrosion on the bending strength of reinforced concrete beams.

Bending tests were carried out on beam specimens, which were 150 mm × 150

mm in cross section and 1140 mm in length. Each beam was reinforced with two

12 mm bottom bars, two 6 mm top bars and 6 mm closed stirrups spaced at 100

mm. Insulating rubberized fabrics and epoxy resin were used to isolate the 12 mm

bottom bars from the rest of the reinforcement cage, so that 12 mm bottom bars

underwent independent corrosion induced through the electrochemical corrosion

technique. Direct Current was impressed to obtain the desired levels of

reinforcement corrosion by controlling the current intensity and the electrifying

time. The beam specimens were then tested as simply supported beams under a

two-point load with a total span of 900 mm and shear span of 300 mm, using the

hydraulic system. They observed that with the increase of the bar corrosion, the

failure mode of corroded RC beams changed from ductile mode to brittle mode

similar to that of under reinforced beams, and the distribution of cracks of

corroded RC beams became concentrated instead of scattered. They developed an

empirical model for determining the percentage residual flexural strength of the

corroded beams in terms of the percentage reinforcement corrosion. They also

developed expressions for calculating the reduced steel cross-sectional area,

reduced yield strength and reduced bond strength.

It may be noted that researchers have attempted to empirically correlate

the residual load-carrying capacity of a corroded reinforced concrete structure

38

with the degree of reinforcement corrosion and other parameters, such as rebar

diameter and cover thickness.

In the present study, an attempt has been made to predict the residual

flexural strength of a corroded beam through the use of conventional flexural

formula by taking into account the loss of metal due to corrosion and applying an

applicable correction factor, which is a function of corrosion current density and

the corrosion time, and the rebar diameter.

CHAPTER 3

METHODOLOGY OF RESEARCH

3.1 EXPERIMENTAL PROGRAM

The present study involves casting, corroding and flexure testing of a series

of reinforced concrete beam specimens. Beams with different bar diameters and

cover thicknesses were subjected to reinforcement corrosion under impressed

current of varying intensity and time periods to induce loss of metal. Results from

the flexure test of corroded beams are used in relating the residual flexural

strength to corrosion rate, time of corrosion, and rebar diameter.

3.2 EXPERIMENTAL VARIABLES

The following variables were used in this experimental program:

i. Two different tension bar diameters: 10 mm and 12 mm

ii. Two different clear covers to the tension reinforcement: 25 mm and

40 mm

39

40

iii. Two different levels of impressed corrosion current intensities : 2

mA/cm2 and 3 mA/cm2

iv. Three different corrosion durations: 4 days , 6 days and 8 days

3.3 TEST SPECIMENS

A total of 56 reinforced concrete beam specimens were cast to include all

variables mentioned in Section 3.2. All tests were repeated twice, including the

tests on control specimens. Table 3.1 shows the test variables and the

corresponding number of beams cast and tested.

Table 3.1: Test variables and specimens.

Number of test specimens for Variables Levels

T0 T1 T2 T3

I 2

T 3

D 2

Cv 2

(D1 +D2) ×

(Cv1 +

Cv2)×2

Repetition =

8 Control

Specimens

(I1 +I2) ×

(D1 +D2) ×

(Cv1 + Cv2)×

2 Repetition

= 16

(I1 +I2) ×

(D1 +D2) ×

(Cv1 + Cv2)×

2 Repetition

= 16

(I1 +I2) ×

(D1 +D2) ×

(Cv1 + Cv2)×

2 Repetition

= 16

Total number of

specimens 8 + 16 + 16 + 16 = 56

41

The following nomenclature applies to the parameters shown in Table 3.1.

I = impressed corrosion current intensity, mA/cm2

T = impressed corrosion duration, days

D = diameter of tension bars, mm

Cv = clear cover to the tension bars, mm

3.4 DETAILS OF TEST SPECIMENS

Rectangular reinforced concrete beam specimens of size 150 × 150 × 1100

mm were used for this study. All beams were designed to fail in flexure by

providing ample vertical shear reinforcement to exclude premature shear failure.

The reinforcement details of the test specimens are shown in Fig. 3.1.

The chosen clear covers were 25 mm and 40 mm. The tension

reinforcement consisted of a pair of 10 mm or a pair of 12 mm diameter steel bars.

The vertical stirrups were of double-legged 6mm diameter steel bars spaced

uniformly at 90 mm centers throughout the length of each beam. Deformed bars

were used as reinforcement. While the top two 8 mm diameter bars used to serve

as stirrup-holders were epoxy-coated to avoid corrosion, the stirrups were left

uncoated so that they would be affected by corrosion along with the main tension

bars. By allowing the stirrups to corrode, the corrosion damage of the test beams

reflects the practical case in which all bars are subjected to corrosion.

42

1100 mm

6 mm stirrups @ 90 mm c/cr 2-12mm main bars8 mm

150 mm

150 mm

Electric Wire

Anchor bars 2-10mm o

Figure 3.1: Reinforcement Details of Test Specimens.

3.5 CONCRETE CONSTITUENTS

ASTM C 150 Type I Portland cement, which is extensively used in Saudi

Arabia, was used in the preparation of concrete specimens. The coarse aggregate

for this study was crushed limestone processed from the quarries on Riyadh Road.

The average values of specific gravity and absorption of the coarse aggregates,

determined in accordance with ASTM C 127, were 2.5, and 1.3 %, respectively.

Medium coarse sand was used as fine aggregate. The specific gravity and

absorption of the fine aggregates were 2.6 and 0.40 %, respectively. Potable water

was used for mixing and curing of concrete.

43

3.6 PREPARATION OF BEAM SPECIMENS

3.6.1 Concrete Mix Proportions

Mix design parameters of concrete such as water-cement ratio, cement

content, grading of coarse aggregate, and coarse to fine aggregate ratio were same

for all the concrete mixtures. The following mix proportions were used:

Water-cement ratio = 0.45

Cement content = 350 kg/m3

Coarse to fine aggregate ratio = 1.65

The grading of coarse aggregate is shown in Table 3.2.

Two percent sodium chloride (NaCl) by weight of cement was mixed in

the concrete to facilitate the flow of current in the specimens.

Calculations for the weight of each ingredient were made using the above

specification. Calculated weights of the constituents are presented in Table 3.3.

Table 3.2: Grading of Coarse Aggregates.

Sieve opening % Weight Retained

1/2'' 35

3/8'' 35

3/16'' 20

3/32'' 10

44

Table 3.3: Weight of constituents in one cubic meter of concrete.

Constituent Weight (kg)

Cement 350.00

Water 157.50

Fine aggregate 751.82

1/2 in. 434.10

3/8 in. 434.10

3/16 in. 248.20 Coarse aggregate

3/32 in. 124.00

3.6.2 Casting and Curing of Beam Specimens

Casting of 56 beam specimens was carried out in 10 batches. Three

cylindrical concrete specimens were also cast from each batch of concrete mix to

determine the corresponding compressive strength. The concrete ingredients were

mixed in a revolving drum type mixer till it was uniform. The moulds were oiled

and the steel reinforcement cages prepared beforehand were placed securely in

their proper position in the moulds. The moulds were filled with concrete in three

layers. After placement of each layer, the concrete was vibrated to ensure proper

consolidation. After casting, the specimens were covered with plastic sheet to

avoid loss of water due to evaporation. The specimens were demolded after 24

hours of casting and then covered with wet towels to cure at laboratory

45

temperature of 18 to 20°C. The towels were wetted from time to time. Moist

curing was carried out for a period of seven days followed by air curing at room

temperature.

3.7 DESIGNATION FOR BEAM SPECIMENS

Fifty six beam specimens were divided into four basic groups, BT1 to BT4,

based on the clear cover to the tension reinforcement and the rebar diameter. Table

3.4 shows the designation of the control beam specimens that were not subjected

to accelerated corrosion.

Table 3.4: Designation for control specimens.

Bar diameter, mm Cover, mm Designation

10 25 BT 1-C

12 25 BT 2-C

10 40 BT 3-C

12 40 BT 4-C

The designation for the corroded beams is shown in Table 3.5. For clarity,

a designation indicates the intensity and the duration of the applied current for

inducing corrosion. As an explanation of the designation used for a corroded

beam, BT1-2-4 implies a beam of group BT1 that was subjected to an applied

current intensity of 2mA/cm2 for a period of 4 days.

46

Table 3.5: Designation for corroded specimens.

Diameter, mm

Cover, mm

Applied current, mA/cm2

Time, days

Designation

10 25 2 4 BT1-2-4

10 25 2 6 BT1-2-6

10 25 2 8 BT1-2-8

10 25 3 4 BT1-3-4

10 25 3 6 BT1-3-6

10 25 3 8 BT1-3-8

12 25 2 4 BT2-2-4

12 25 2 6 BT2-2-6

12 25 2 8 BT2-2-8

12 25 3 4 BT2-3-4

12 25 3 6 BT2-3-6

12 25 3 8 BT2-3-8

10 40 2 4 BT3-2-4

10 40 2 6 BT3-2-6

10 40 2 8 BT3-2-8

10 40 3 4 BT3-3-4

10 40 3 6 BT3-3-6

10 40 3 8 BT3-3-8

12 40 2 4 BT4-2-4

12 40 2 6 BT4-2-6

12 40 2 8 BT4-2-8

12 40 3 4 BT4-3-4

12 40 3 6 BT4-3-6

12 40 3 8 BT4-3-8

47

3.8 EXPERIMENTAL TECHNIQUES

3.8.1 Compressive Strength of Concrete

The 28 day compressive strength of concrete, fc′ was determined by testing

75 × 150 mm cylindrical specimens in accordance with ASTM C39. The average

of the three cylinders cast from each batch was taken as the applicable value of fc′

for that concrete.

3.8.2 Tensile Strength of Reinforcing Bars

For determination of yield and tensile strength of tension bars, bar

specimens of 10 mm and 12 mm diameter were tested in tension in an Universal

Testing Machine and the complete load-elongation, hence stress-strain plots, were

obtained. From the stress-strain plots, yield strength and tensile strength of the

bars were determined. An extensometer, of 50 mm gauge length, was used to

measure the extension of the bars during the test and a data logger connected to a

computer recorded the load and the corresponding extension of the bar as the test

progressed. The test arrangement is shown in Figure 3.2.

48

Figure 3.2: Arrangement for evaluating the tensile strength of steel bars.

49

3.8.3 Corrosion Rate Measurements

The RC beam specimens were tested for determining the corrosion current

density, Icorr, using the linear polarization resistance measurement (LPRM)

technique [39-40].

The LPRM procedure is based on the Stern-Geary characterization of the

typical polarization curve for the corroding metal. In this method, a linear

relationship is described mathematically for a region on the polarization curve in

which slight change in the current applied to the corroding metal in an ionic

solution causes corresponding change in the potential of the metal. In other words,

if a large current is required to change the potentials by a given amount, the

corrosion rate is high and on the other hand, if only a small current is required, the

corrosion rate is low.

The corrosion cell consisted of a reference electrode, a working electrode

which was the reinforcing steel embedded in the concrete specimen, and a counter

electrode which was placed in the salt solution around the concrete specimen. The

reinforcing steel bar was polarized by applying a small potential shift to it (∆E =

10 mV) and the resultant current (∆I) between the working electrode and the

counter electrode was measured.

50

The linear polarization resistance, Rp, was determined from the slope of the

plot of applied potential versus the measured current. The corrosion current

density was then calculated by using the Stern-Geary formula [41].

Icorr = IE

∆∆ =

pRB , (3.1)

Where:

Icorr is the corrosion current density (µA/cm2),

Rp is the polarization resistance (kΩ cm2),

B = )().(3.

ca

ca

ββ2 ββ

+ (3.2)

βa is the anodic Tafel constant,

βc is the cathodic Tafel constant

The values of βa and βc are determined from the Tafel plot. However, in the

absence of sufficient data on βa and βc for steel in concrete, a value of B equal to

52 mV for steel in passive condition and a value equal to 26 mV for steel in active

condition are normally used. For steel in aqueous media, values of βa and βc equal

to 120 mV are normally used.

A major uncertainty in obtaining the polarization resistance is the area of

the steel bar that is affected by the current flowing from the counter electrode.

∆E/∆I measurements using a small counter electrode provides an apparent

51

polarization resistance that differs from the true Rp value depending on the

experimental conditions. Thus, if the metal is actively corroding, the current

applied from a small counter electrode located on the concrete surface is ‘drained’

very efficiently by the rebars and it tends to confine itself on a small surface area

as shown in Fig. 3.3. Conversely, if the metal is passive and Rp is high, the current

applied tends to spread far away from the application point (right part on the rebar

in Fig 3.3.) [42].

Therefore, in an effort to better control the current path from the counter

electrode to the bar, counter electrode was prepared such that it covered both the

sides of the specimen throughout the length and it is assumed while evaluating Icorr

that corrosion is occurring uniformly over the entire steel area. Figure 3.4 shows

the schematic representation of the test set-up used to measure the corrosion

current density.

One of the most important problems in evaluating Icorr in the field lies in

evaluating the area of reinforcing bar that is being polarized by the test. It is

impractical to polarize the entire reinforcement system in a concrete structure. The

area that is actually polarized by a small auxiliary electrode will be influenced by

the resistance of the concrete and by the polarization resistance of the steel

reinforcement. This area cannot be easily quantified [43].

The test beam was half immersed in the electrolyte during the corrosion

rate measurements. The surface area of the steel polarized, considered for

52

calculating Icorr was therefore, taken as the area of the main tension bars plus half

of the area of the stirrups, i.e. only the submerged area of all steel reinforcement.

C o u n te r E le c tro d e

C o rro d in gA re a

A re a a ffe c te d b y th e s ig n a l

Figure 3.3: Spread of an electrical signal applied from a counter electrode [42].

53

ComputerPotentiostat /Galvanostat Lead Wires

5% NaCl Solution

5% NaCl Solution

Steel bar (Working electrode)

Stainless Steel Plate (Counter

Electrode)

Supports

RC Beam Specimen

Reference electrode

(SCE)

Figure 3.4: Schematic representation of the set-up utilized to measure

the corrosion current density.

54

3.8.4 Test Setup for Inducing Reinforcement Corrosion

After completion of curing and measurement of the initial corrosion

current density, the specimens were subjected to accelerated corrosion by applying

anodic current of specified intensities and for specified time periods. This was

achieved through a small DC power supply with a built-in ammeter to monitor the

current and a potentiometer to control the current intensity. The concrete

specimens were partially immersed in 5% sodium chloride solution in a tank such

that the base of the specimen was just in contact with water. The direction of the

current was adjusted so that the reinforcing steel became an anode and a stainless

steel plate placed on the concrete specimen served as a cathode. The stainless steel

plate was placed in the tank in such a manner that it covered both the sides of the

specimen throughout the length. This arrangement ensured a uniform distribution

of the corrosion current along the whole length of the bar. A schematic

representation of the test set-up is shown in Fig. 3.5.

Though accelerated corrosion does corrode the bars and leads to crack

formation, it differs considerably from the actual corrosion in structures, in rate

and characteristics. The corrosion in existing structures is extremely slow and

hence; even when the bars corrode and expand; cracks may not always form in

surrounding concrete because of concrete creep [32].

55

5% NaCl Solution

5% NaCl Solution

Steel bars (Anode )

Stainless Steel (Cathode )

Supports

RC Beam Specimen

D

-+

Stirrup

Epoxy-coatedHanger Bars

C Power source

Figure 3.5: Schematic representation of the accelerated corrosion test setup.

56

Another difference lies in the fact that in Galvanostatic corrosion, the

reinforcement is forced to corrode by impressing direct current and this results in

all the reinforcing bars becoming anodic to external cathode (in this series of

experiments a stainless steel plate). This entails overall corrosion, at an almost

uniform rate. This may not be the case in existing structures, where we see a

difference in the degree of corrosion of rebars depending upon various factors,

such as, their distance from the concrete surface.

However, it has been found by some investigators [32], that the cracks

formed by accelerated corrosion are quite similar to those formed during exposure

tests. This justifies the choice of the accelerated corrosion induction method to

cause a significant amount of corrosion in a short span of time in laboratory tests.

It is observed from the previous accelerated corrosion tests on reinforced

concrete members that the applied impressed current densities have typically

ranged from, as low as 0.1 mA/cm2 [12] to as high as 4 mA/cm2 [11]. So as to

complete the experiments within a reasonable amount of time, impressed current

intensities chosen were 2 mA/cm2 and 3 mA/cm2.

The total current required for each type of beam specimen was calculated

based on their respective steel surface area, as shown in Table 3.6.

57

Table 3.6: Total current applied to beam specimens.

Beam

Type

D

(mm)

Cv

(mm)

Total surface area

of tension steel

and stirrups (cm2)

Total current

I (Amps)

@ 2mA/cm2

Total current

I (Amps)

@ 3mA/cm2

BT 1 10 25 1762.43 3.53 5.29

BT 2 12 25 1928.30 3.86 5.80

BT 3 10 40 1472.15 2.94 4.42

BT 4 12 40 1638.02 3.28 4.92

The current supplied to each concrete specimen was checked on a regular

basis and any drift was corrected. Typical beam specimens subjected to

accelerated corrosion are shown in Fig. 3.6. A close-up view of the corrosion

acceleration is shown in Fig. 3.7.

58

Figure 3.6: Beam specimens being subjected to accelerated

reinforcement corrosion.

59

Figure 3.7: A close-up view of the set-up utilized to accelerate

reinforcement corrosion in the beam specimens.

60

3.8.5 Flexure testing of Beam Specimens

After curing, a set of 8 beam specimens was kept in control condition to

prevent reinforcement corrosion. These eight control beam specimens were tested

for determining the reference flexural strength.

The other 48 beam specimens that were subjected to accelerated

reinforcement corrosion were tested to determine their residual flexural strength.

The beam specimens were tested as simply supported beams under a four-

point loading system with a total span of 900 mm and a shear span of 350 mm. A

schematic representation of the test set-up is shown in Fig. 3.8.

The flexure test was conducted using an Instron Universal Testing

Machine of 250KN capacity at a slow loading rate of 1 mm/min. Fig. 3.9 shows

test set-up. The load and midspan deflection data for each specimen was recorded

using a computerized data acquisition system at pre-determined load intervals till

failure. The data so generated was utilized to plot load-deflection curves for each

of the tested specimens.

The control specimens and those corroded for different specified time

periods (4, 6, and 8 days) are shown in Figs. 3.10 through 3.13.

61

P P350 mm 200 mm

1100 mm

900 mm

350 mm

Figure 3.8: Set-up for four-point bend test of beam specimens.

Figure 3.9: Flexural strength test using Instron Universal Testing Machine.

62

Figure 3.10: Control beam specimen being tested in flexure.

Figure 3.11: A typical beam specimen being tested after

4 days of corrosion acceleration.

63

Figure 3.12: A typical beam specimen being tested after

6 days of corrosion acceleration.

Figure 3.13: A typical beam specimen being tested after

8 days of corrosion acceleration.

64

3.8.6 Gravimetric Weight loss

Following the flexure test on a corroded beam, it was broken to remove the

two corroded tension bars to measure the gravimetric weight loss due to induced

corrosion. The bars were cleaned to remove the entire rust product using Clarke’s

solution and then they were weighed to determine the net weight of steel.

Preparation, cleaning and evaluation of weight loss were carried out in accordance

with ASTM G1 [44].

The percentage weight loss was calculated as:

Percentage weight loss = 100×i

fi

W−WW

(3.3)

Where:

Wi = initial weight of the bar before corrosion

Wf = weight after corrosion.

Since the current was applied through the stainless steel plates covering the

entire length of the corroding bar, ensuring the efficient distribution of the current,

it can be expected that the corrosion will be uniform along the entire embedded

length. However, the presence of deformations and variation in permeability of the

concrete results in some non-uniformity. Samples of corroded rebars after

evaluating the gravimetric weight loss are shown in Figs. 3.14 and 3.15. These

65

figures reaffirm the general perception that corrosion, in general, is not expected to

be uniform throughout the length of the bar, as the loss of rebar at some section is

considerably higher than that at other sections.

Figure 3.14: 10 mm diameter corroded bars.

66

Figure 3.15: 12 mm diameter corroded bars.

CHAPTER 4

RESULTS AND DISCUSSION

4.1 COMPRESSIVE STRENGTH OF CONCRETE

The average values of 28-day compressive strength of concrete, f′c, for

each batch are shown in Table 4.1. It is observed that f′c values varied from batch

to batch, despite the use of same mix proportions, same materials, and similar

casting procedure. The recorded values, average of three cylinders, varied from

33.4 MPa to 46.5 MPa with a standard deviation of 4.95.

4.2 TENSILE STRENGTH OF REINFORCING STEEL BARS

The stress-strain curves for the 10 mm and 12 mm reinforcing steel bars

were obtained by plotting the tension test data. Typical stress-strain curves are

shown in Figures 4.1 and 4.2. The values of yield and ultimate strengths (fy and fu)

and the corresponding strains (εy and εu) for both bars, obtained from Figures 4.1

and 4.2, are presented in Table 4.2.

67

68

Table 4.1: Average 28-day compressive strength of concrete, for 10 batches.

Batch Number Compressive Strength, f′c (MPa)

1 37.7

2 44.7

3 44.2

4 35.7

5 36.9

6 33.4

7 40.9

8 46.5

9 46.5

10 45.8

Strain (mm/mm)

Stre

ss(M

Pa)

0 0.02 0.04 0.06 0.08 0.10

100

200

300

400

500

600

Figure 4.1: Stress-strain plot for 10 mm diameter reinforcing steel bar.

69

Strain (mm/mm)

Stre

ss(M

Pa)

0 0.02 0.04 0.06 0.08 0.1 0.12 0.140

100

200

300

400

500

600

700

800

Figure 4.2: Stress-strain plot for 12 mm diameter reinforcing steel bar.

Table 4.2: Yield and Tensile strength and strain of steel bars.

Diameter, D (mm)

Yield Strength, fy

(MPa)

Yield Strain, εy (mm/mm)

Tensile Strength, fu

(MPa)

Tensile Strain, εu

(mm/mm)

10 520 0.0054 551 0.0130

12 590 0.0030 700 0.0508

70

The stress-strain plots in Figures 4.1 and 4.2 indicate that the 12 mm

diameter steel bar has a sharp yield point with distinct elastic, plastic and strain-

hardening zones. The 10 mm diameter steel bar, however, shows no sharp yield.

The yield stress for 10 mm diameter bars is calculated as 520 MPa, using offset

method with a strain of 0.002.

4.3 FLEXURAL STRENGTH OF BEAM SPECIMENS

The average failure load, 2P, and the corresponding midspan deflection for

the beam specimens were obtained by averaging the results of two beams tested in

each case and are presented in Tables 4.3 and 4.4 for control and the corroded

beams, respectively.

Table 4.3: Flexure Test Results of Control Beams.

Beam fc′ (MPa) Failure Load, 2P (KN) Midspan Deflection (mm)

BT1-C 45.8 66.52 9.49

BT2-C 36.3 84.55 7.52

BT3-C 46.5 67.20 6.29

BT4-C 46.2 75.00 5.94

As expected, the load carrying capacity of the RC beam increased with an

increase in the bar diameter. The highest load was noted in specimen BT2 (12 mm

diameter rebar with a cover of 25 mm), while it was the least in the specimen BT1

(10 mm diameter rebar with a cover of 25 mm).

71

Table 4.4: Flexure Test Results of Corroded Beams.

Beam fc′ (MPa) Failure Load 2P (KN) Midspan Deflection (mm)

BT1-2-4 38.9 61.00 7.69

BT1-3-4 36.9 58.00 9.40

BT1-2-6 45.8 59.79 6.31

BT1-3-6 46.5 52.30 8.22

BT1-2-8 33.4 44.70 6.29

BT1-3-8 46.5 37.02 4.24

BT2-2-4 39.9 72.93 5.86

BT2-3-4 35.7 68.39 6.35

BT2-2-6 44.5 59.57 4.36

BT2-3-6 44.2 60.28 6.29

BT2-2-8 44.7 50.76 5.71

BT2-3-8 37.7 48.51 4.74

BT3-2-4 40.2 62.42 9.70

BT3-3-4 35.7 58.24 7.43

BT3-2-6 33.4 56.44 4.33

BT3-3-6 44.2 53.05 6.28

BT3-2-8 33.4 52.10 5.61

BT3-3-8 33.4 37.70 5.51

BT4-2-4 36.9 68.74 5.98

BT4-3-4 46.5 62.47 6.83

BT4-2-6 46.5 57.26 6.64

BT4-3-6 40.9 51.30 5.65

BT4-2-8 40.9 51.41 4.28

BT4-3-8 37.7 43.24 4.96

72

Table 4.4 shows that both the failure loads and the mid-span deflections

are affected by the duration and intensity of the applied current.

4.4 EFFECT OF CORROSION ON LOAD-DEFLECTION

BEHAVIOR OF BEAMS

Typical load-deflection curves for both control and the corroded beam

specimens are shown in Figures 4.3 through 4.6. The load-deflection curves for all

control and corroded beams arranged with respect to the applied current and the

duration are shown in Appendix I. The load-deflection curves representing the

average of two specimens tested in each case for both the control specimens and

the corroded reinforcement are compared in Figures 4.7 through 4.10. These data

indicate that reinforcement corrosion has a marked influence on the flexural

behavior of the concrete specimen. As expected the corroded beams had higher

deflection than the corresponding control beams due to degrading stiffness of the

beams. For example, at a load of 37 KN, beam BT1-3-8 recorded a midspan

deflection of 4.20 mm, compared to 3.01 mm for the control beam BT1-C. The

ultimate deflection of the beams, however, decreased with increasing

reinforcement corrosion, leading to a reduction in the ductility of the beams.

73

Midspan Deflection (mm)

Load

(kN

)

0 2 4 6 8 10 120

10

20

30

40

50

60

70

80

Specimen 1Specimen 2

BT1-C

Figure 4.3: Typical Load-deflection plots for two control (BT1-C) specimens.

74

Midspan Deflection (mm)

Load

(kN

)

0 2 4 6 80

10

20

30

40

50

60

70

80

Specimen 1Specimen 2

BT3-C

Figure 4. 4: Typical Load-deflection plots for two control (BT3-C) specimens.

75

Midspan Deflection (mm)

Load

(kN

)

0 2 4 6 8 10 120

10

20

30

40

50

60

70

Specimen 1Specimen 2

BT3-3-4

Figure 4. 5: Typical Load-deflection plots for two corroded (BT3-3-4) specimens.

76

Midspan Deflection (mm)

Load

(kN

)

0 2 4 60

10

20

30

40

50

60

Specimen 1Specimen 2

BT4-2-8

Figure 4. 6: Typical Load-deflection plots for two corroded (BT4-2-8) specimens.

77

Midspan Deflection (mm)

Load

(kN

)

0 2 4 6 8 10 120

10

20

30

40

50

60

70

80 BT1-CBT1-2-4BT1-2-6BT1-2-8BT1-3-4BT1-3-6BT1-3-8

Figure 4. 7: Load-midspan deflection plot for BT1 subjected to

different corrosion intensities.

78

Midspan Deflection (mm)

Load

(kN

)

0 2 4 6 8 100

10

20

30

40

50

60

70

80

90

100 BT2-CBT2-2-4BT2-2-6BT2-2-8BT2-3-4BT2-3-6BT2-3-8

Figure 4. 8: Load-midspan deflection plot for BT2 subjected to

different corrosion intensities.

79

Midspan Deflection (mm)

Load

(kN

)

0 2 4 6 8 100

10

20

30

40

50

60

70

80 BT3-CBT3-2-4BT3-2-6BT3-2-8BT3-3-4BT3-3-6BT3-3-8

Figure 4. 9: Load-midspan deflection plot for BT3 subjected to

different corrosion intensities.

80

Midspan Deflection (mm)

Load

(kN

)

0 2 4 6 80

10

20

30

40

50

60

70

80 BT4-CBT4-2-4BT4-2-6BT4-2-8BT4-3-4BT4-3-6BT4-3-8

Figure 4. 10: Load-midspan deflection plot for BT4 subjected to

different corrosion intensities.

81

Figures 4.7 through 4.10 show that load-deflection plots are virtually linear

up to about 70 percent of the ultimate load and that the degradation or loss of

stiffness of beams increases with increasing corrosion activity.

Apart from the loss of flexural capacity, reinforcement corrosion also

produces higher deflection that my lead to serviceability problems. Both strength

and serviceability, major concern for a corroding beam, get progressively impaired

with increasing corrosion intensity.

4.5 EFFECT OF CORROSION ON THE DUCTILITY OF

BEAMS

From the data in Figures 4.7 through 4.10, it is clear that as the corrosion

intensity increases, there is a corresponding decrease in the ultimate deflection of

the beams. This implies that the area under the load-deflection curves decreases

with an increase in the corrosion intensity. Since the area under the load-deflection

curve is an indication of the absorbed energy and ductility, the increase in the

corrosion intensity decreases the absorbed energy and hence the ductility of the

beams. This indicates that the corrosion not only affects the strength of the beams

but also induces brittleness in their behavior. Hence, the large deformations, which

occur in under-reinforced flexural members prior to failure, will not occur in the

case of severely corroded reinforcement, thereby eliminating the most desirable

warning before failure of the structure. Reduction in the ductility of beams made

82

with bars corroded to different intensities has also been reported by Uomoto et al.

[45] and Uomoto and Misra [32].

4.6 WEIGHT LOSS OF BARS AND EQUIVALENT

CORROSION CURRENT DENSITY

Corroded tensile steel bars from each of the four types of beams are

compared with the original (uncorroded) bars in Figs. 4.11 through 4.14. The

highest weight loss (34.8%) was in corroded rebars from BT3, while it was the

lowest (20.7%) in BT4.

The measured weight loss was used to calculate the instantaneous

corrosion rate (Jr) as follows:

periodcorrosion bar of area surfacelossweight

×=rJ (4.1)

Calculated values of Jr were used to determine the equivalent corrosion

current density (Icorr), using the following expression [46]:

corrr IFWJ

= (4.2)

where

W = equivalent weight of steel

F = Faraday’s constant

83

Substituting W = 55.85/2 = 27.925 g and F = 96487 Coulombs (A-sec) in

Eq. (4.2), the following simplified equation for calculating Icorr from the value of Jr

is obtained:

Icorr = 0.1096 Jr (4.3)

where: Icorr is in mA/cm2 and Jr is in gm/cm2/year.

From Eqs. (4.1) and (4.2), the weight loss of a bar can be expressed as

Weight loss/surface area of a bar = TFW

corrI

= 0.289 IcorT (4.4)

where: Icorr is in mA/cm2 and T is in seconds.

The weight loss of a given bar is directly proportional to IcorrT, as W/F for

steel is a constant.

The calculated values of equivalent Icorr from Eq. (4.3) are shown

collectively for all corroded beams in Table 4.5. It is observed that the equivalent

Icorr values established from gravimetric analysis are lower than the applied

corrosion current density, Iapp. Similar observations have been reported by other

researchers [47-48]. The difference between Icorr and Iapp can be attributed to

several factors among which mention can be made of the concrete cover around

the bars, quality of concrete, non-uniform corrosion rate along the length of the

bars and the diameter of bars.

84

Figure 4.11: Corroded steel bars compared with original (uncorroded) bars

from BT1 group. (Maximum Weight loss - 31 %).

Figure 4.12: Corroded steel bars compared with original (uncorroded) bars

from BT2 group. (Maximum Weight loss - 25.5 %).

85

Figure 4.13: Corroded steel bars compared with original (uncorroded) bars

from BT3 group. (Maximum Weight loss - 34.8 %).

Figure 4.14: Corroded steel bars compared with original (uncorroded) bars

from BT4 group. (Maximum Weight loss - 20.7 %).

86

Table 4.5: Gravimetric weight loss and their conversion to Icorr.

Conversion of weight loss into Icorr Gravimetric test results

Beam D, mm

Iapp, mA/cm2

Td

Ave. length of sample,

cm

Ave. original wt. of

sample, g

Ave wt.

Loss, g

ρ, % wt.

loss

Jr (Eq. 4.1) g/cm2/yr

Icorr (Eq.4.3) mA/cm2

BT1-2-4 10 2 4 41.77 249.95 13.5 5.40 9.37 1.03

BT1-3-4 10 3 4 38.90 232.78 33.0 14.20 24.83 2.72

BT1-2-6 10 2 6 46.10 275.86 42.0 15.20 17.96 1.97

BT1-3-6 10 3 6 42.20 252.52 54.0 21.40 25.00 2.74

BT1-2-8 10 2 8 39.65 237.26 51.0 21.50 19.94 2.18

BT1-3-8 10 3 8 46.40 277.66 86.0 31.00 27.33 2.99

BT2-2-4 12 2 4 41.07 350.74 19.5 5.50 11.40 1.25

BT2-3-4 12 3 4 42.10 359.53 31.5 8.80 17.92 1.96

BT2-2-6 12 2 6 47.12 402.40 80.9 20.10 27.35 2.99

BT2-3-6 12 3 6 45.00 384.30 53.9 14.00 19.07 2.09

BT2-2-8 12 2 8 43.70 373.20 85.3 22.90 23.53 2.58

BT2-3-8 12 3 8 50.90 434.70 111 25.50 23.88 2.62

BT3-2-4 10 2 4 41.47 248.16 19.8 8.00 13.88 1.52

BT3-3-4 10 3 4 43.75 261.80 23.7 9.10 15.75 1.73

BT3-2-6 10 2 6 44.85 268.40 27.2 10.10 11.72 1.28

BT3-3-6 10 3 6 44.20 264.50 46.5 17.60 20.18 2.21

BT3-2-8 10 2 8 47.40 283.64 60.7 21.40 18.41 2.02

BT3-3-8 10 3 8 45.35 271.37 94.4 34.80 28.54 3.13

BT4-2-4 12 2 4 38.62 329.80 26.1 7.90 15.81 1.74

BT4-3-4 12 3 4 41.05 350.60 38.3 10.90 22.69 2.49

BT4-2-6 12 2 6 45.05 384.73 51.4 13.40 18.52 2.03

BT4-3-6 12 3 6 40.85 348.86 64.8 18.60 25.60 2.80

BT4-2-8 12 2 8 42.95 366.80 66.0 18.00 19.01 2.08

BT4-3-8 12 3 8 39.30 335.62 69.6 20.70 21.60 2.37

87

4.7 RELATIONSHIP BETWEEN Icorr AND Iapp

In theoretical prediction, it is assumed that corrosion starts as soon as the

electrical energy is applied. This is true for bars suspended in liquid. But when the

bars are embedded in concrete, because of the resistance provided by the concrete,

certain amount of energy is needed to initiate the corrosion [47]. Hence, for

laboratory tests using impressed current technique, Icorr calculated using

gravimetric method will be less than the applied current density, Iapp, as is evident

from Table 4.5.

By comparing the values of Icorr, determined from the gravimetric weight

loss method and the applied current density, Iapp, an attempt has been made to

relate Icorr and the Iapp with the current efficiency, η, as

100×==app

corr

II

currentappliedtheofEfficiencyη (4.5)

The average current efficiency, η is calculated for both 10 mm and 12 mm

diameter bars and is presented in Table 4.6.

From Table 4.6, the average value of η for 10 mm and 12 mm diameter

bars is found to be 0.848 and 0.926, respectively. Yubun et al., [47] have reported

a current efficiency of 0.293 for 19 mm diameter. Using this data, Table 4.7 is

prepared to list the variation in current efficiency with rebar diameter.

88

Table 4.6: Relationship between Icorr and Iapp.

Beam %Weight Loss (Gravimetric)

Icorr (mA/cm2)

Iapp (mA/cm2)

Current Efficiency η(%)

Average Efficiency η(%)

BT1-2-4 5.40 1.03 2 51.50

BT1-3-4 14.20 2.72 3 90.67

BT1-2-6 15.20 1.97 2 98.50

BT1-3-6 21.40 2.74 3 91.34

BT1-2-8 21.50 2.18 2 109.00

BT1-3-8 31.00 2.99 3 99.67

90.11

BT2-2-4 5.50 1.25 2 62.50

BT2-3-4 8.80 1.96 3 65.34

BT2-2-6 20.10 2.99 2 149.50

BT2-3-6 14.00 2.09 3 69.67

BT2-2-8 22.90 2.58 2 129.00

BT2-3-8 25.50 2.62 3 87.34

93.89

BT3-2-4 8.00 1.52 2 76.00

BT3-3-4 9.10 1.73 3 57.67

BT3-2-6 10.10 1.28 2 64.00

BT3-3-6 17.60 2.21 3 73.67

BT3-2-8 21.40 2.02 2 101.00

BT3-3-8 34.80 3.13 3 104.33

79.44

BT4-2-4 7.90 1.74 2 87.00

BT4-3-4 10.90 2.49 3 83.00

BT4-2-6 13.40 2.03 2 101.50

BT4-3-6 18.60 2.80 3 93.33

BT4-2-8 18.00 2.08 2 104.00

BT4-3-8 20.74 2.37 3 79.00

91.30

89

Table 4.7: Variation in Current efficiency with the rebar diameter.

D (mm) Current Efficiency (η) Source

10 0.848 Present Study

12 0.926 Present Study

19 0.293 Yabun et al. [47]

Using the data from Table 4.7, the value of η in terms of D, is obtained as

η = 66.81 D-1.82

Hence, Icorr = 66.81 D-1.82 Iapp (4.6)

As gravimetric weight loss for all the corroded bars was determined, the Icorr

obtained using the measured weight loss, was used in this study.

4.8 EFFECT OF CHOSEN VARIABLES ON

REINFORCEMENT CORROSION

The variables chosen in this study include: the applied current intensity,

Iapp; duration of current application, T; reinforcement diameter, D; and the concrete

cover, Cv. As discussed in Section 4.6, a difference exists between the applied

current intensity, Iapp, and the measured corrosion intensity, Icorr, in accelerated

corrosion tests. In laboratory or field tests on corroded beams, Icorr is determined

through Galvanostatic or Potentiostatic measurement and it is regarded as the key

parameter of corrosion activity. In view of this, Icorr as determined through

90

gravimetric analysis is taken as the applicable value of corrosion current density

for all computations.

From Eq. (4.4), it is noted that the weight loss of a bar is directly

proportional to the product IcorrT, implying that a higher corrosion current density,

Icorr for a lesser period of corrosion would be as damaging as a lesser value of Icorr

for a longer corrosion period in terms of metal loss of a corroding bar. The

product IcorrT can be termed as ‘corrosion activity index’.

The values of IcorrT and percentage weight loss, ρ of all beams, taken from

Table 4.5, are presented in Table 4.8, in four groups with respect to diameter D

and cover Cv.

The percentage weight loss of tension bars in each beam, ρ, is plotted with

respect to IcorrT in Fig. 4.15 for each group of data in Table 4.8.

Table 4.8: IcorrT versus ρ Data for all Sets of Cv and D Values.

D=10mm;Cv=25mm D=10mm;Cv=40mm D=12mm;Cv=25mm D=12mm;Cv=40mm

IcorrT (mA-

days/cm2)

ρ (%

wt.loss)

IcorrT (mA-

days/cm2)

ρ (%

wt.loss)

IcorrT (mA-

days/cm2)

ρ (%

wt.loss)

IcorrT (mA-

days/cm2)

ρ (%

wt.loss) 4.12 5.40 6.08 7.96 5.00 5.55 6.96 7.91

10.88 14.18 6.92 9.05 7.84 8.76 9.96 10.92

11.82 15.23 7.68 10.13 17.94 20.12 12.18 13.37

16.44 21.38 13.26 17.58 12.54 14.03 16.80 18.56

17.44 21.50 16.16 21.40 20.64 22.87 16.64 17.99

23.92 30.97 25.04 34.79 20.96 25.51 18.96 20.74

91

0

5

10

15

20

25

30

35

40

0 5 10 15 20 25 30IcorT (mA-days/sq.cm)

ρ (%

wei

ght l

oss)

D = 10 mm; Cv = 25 mmD = 10 mm; Cv = 40 mmD = 12 mm; Cv = 25 mmD = 12 mm; Cv = 40 mm

Figure 4. 15: Percentage weight loss versus IcorrT.

The following observations are made from Fig. 4.15:

(i) The plots of IcorrT versus ρ (corrosion activity index versus

percentage weight loss of bars) for the four groups of beams affirm

a linear relationship between IcorrT and ρ.

(ii) For a given IcorrT, ρ for a beam with 12mm diameter bars is less

than that with 10mm diameter bars. This implies that percentage-

wise metal loss will be smaller for higher diameter bars at a given

value of IcorrT.

92

(iii) The effect of cover Cv on percentage weight loss appears to be

insignificant.

Rasheeduzzafar et al. [28] have also reported that, although an increase in

cover leads to a sharp reduction in corrosion in the range of ½ in. (12.7 mm) to 1

in. (25.4 mm) cover, no significant reduction in corrosion was indicated beyond

the cover thickness of the order of 1.25 in. (32 mm).

4.9 EFFECT OF CORROSION ON LOAD CARRYING

CAPACITY OF BEAMS

Using data from Table 4.4, and Table 4.5, Table 4.9 is prepared to list the

strength of the corroded beams with respect to the control beams for varying

degrees of corrosion (% weight loss). Table 4.9 shows that the degree of corrosion

has a marked influence on the load carrying capacity of the beam specimens.

Figure 4.16 shows the effect of the weight loss on the reduction in the load

carrying capacity.

It can be observed from Fig. 4.16, that, there is a relatively sharp reduction

in the load carrying capacity of a beam with increasing weight loss for both 10

mm and 12 mm diameter bars, the loss being comparatively more in 12 mm than

in 10 mm diameter bars. Similar sharp reduction in strength with increasing

weight loss has also been reported by Aziz [37] for slab specimens.

93

Table 4.9: Effect of percentage weight loss on Load carrying

capacity of corroded beams.

Beam % Weight

Loss Failure Load, 2P

(KN) Load

(% of Control) % Loss in load

BT1-2-4 5.40 61.00 91.70 8.30

BT1-3-4 14.20 58.00 87.19 12.81

BT1-2-6 15.20 59.79 89.88 10.12

BT1-3-6 21.40 52.30 78.62 21.38

BT1-2-8 21.50 44.70 67.20 32.80

BT1-3-8 31.00 37.02 55.65 44.35

BT2-2-4 5.50 72.93 86.26 13.74

BT2-3-4 8.80 68.39 80.89 19.11

BT2-2-6 20.10 59.57 70.46 29.54

BT2-3-6 14.00 60.28 71.30 28.70

BT2-2-8 22.90 50.76 60.04 39.96

BT2-3-8 25.50 48.51 57.37 42.63

BT3-2-4 8.00 62.42 92.89 7.11

BT3-3-4 9.10 58.24 86.67 13.33

BT3-2-6 10.10 56.44 83.99 16.01

BT3-3-6 17.60 53.05 78.94 21.06

BT3-2-8 21.40 52.10 77.53 22.47

BT3-3-8 34.80 37.70 56.10 43.90

BT4-2-4 7.90 68.74 91.65 8.35

BT4-3-4 10.90 62.47 83.30 16.70

BT4-2-6 13.40 57.26 76.35 23.65

BT4-3-6 18.60 51.30 68.40 31.60

BT4-2-8 18.00 51.41 68.55 31.45

BT4-3-8 20.70 43.24 57.65 42.35

94

40

50

60

70

80

90

100

0 5 10 15 20 25 30 35 40

Weight loss (%)

Loa

d (%

of C

ontr

ol)

D = 10 mmD = 12 mm

Figure 4. 16: Variation of load carrying capacity with percentage weight loss.

It can also be seen that in case of beams with 10 mm diameter bars, for

about 30 % weight loss, the reduction in strength is around 40%, whereas a similar

strength reduction is observed, in beams with 12 mm diameter bars at just around

20% weight loss. This implies that the strength of a corroded beam is significantly

affected by the reinforcing bar diameter. The cover to the tension reinforcement,

however, did not show any significant effect on the strength of a corroded beam

for the range of cover investigated in this study.

95

4.10 EXPERIMENTAL FLEXURAL CAPACITY OF

CONTROL BEAMS

Experimental values of ultimate moment capacity, Mex,uc, for each control

beam (BT1 to BT4) were calculated from simple statics as Mex,uc = 350P kN-mm,

where P is the load applied to the beam (Fig. 3.7) at failure in kN and 350 mm is

the shear span, i.e., the distance between the center of support and the load P. For

each control beam, the average of two test beams was taken as the representative

value of Mex,uc.

The values of Mex,uc, for the four control beams with varying Cv and D, are

presented in Table 4.10.

Table 4.10: Average Experimental Moment Capacity of Control Beams.

Beam fc′ (MPa)

P (kN)

Mex,uc (kN-mm)

BT1-C 45.8 36.25 11640

BT2-C 36.3 42.27 14795

BT3-C 46.5 33.60 11760

BT4-C 46.1 37.50 13125

96

4.11 EXPERIMENTAL FLEXURAL CAPACITY OF

CORRODED BEAMS

The experimentally determined values of flexural strength of the corroded

beams, Mex,c, calculated in the same manner as for the control beams (i.e. Mex,c =

350P kN-mm), are shown collectively for all beams in Table 4.11. These values

are the average of two test results.

The ratio of Mex,c/Mex,uc multiplied by 100, designated as R, is indicative of

the percentage residual strength, after loss due to reinforcement corrosion. The

values of R for all corroded beams are shown in Table 4.11.

The values of fc′ as determined for all the batches (Table 4.1) show that

corroded beams had values of fc′ somewhat different from the corresponding

control beams. However, for calculation of R, the experimentally determined

moment capacity for a control beam is assumed to be the same for all beams in the

same group.

97

Table 4.11: Relationship between Experimental Moment Capacity Of

Corroded and Uncorroded Beams.

Beam Mex,c (KN-mm)

Mex,uc (KN-mm)

(from Table 4.10) 100

,

,×=

ucexMcexM

R

BT1-2-4 10675 11640 92

BT1-3-4 10150 11640 87

BT1-2-6 10463 11640 90

BT1-3-6 9152 11640 79

BT1-2-8 7823 11640 67

BT1-3-8 6478 11640 56

BT2-2-4 12762 14795

BT2-3-4 11968 14795 81

BT2-2-6 10433 14795 71

BT2-3-6 10549 14795 71

BT2-2-8 8883 14795 60

BT2-3-8 8489 14795 57

BT3-2-4 10923 11760 93

BT3-3-4 10192 11760 87

BT3-2-6 9875 11760 84

BT3-3-6 9284 11760 79

BT3-2-8 9118 11760 78

BT3-3-8 6598 11760 56

BT4-2-4 12030 13125 92

BT4-3-4 10932 13125 83

BT4-2-6 10021 13125 76

BT4-3-6 8978 13125 68

BT4-2-8 8997 13125 69

BT4-3-8 7567 13125 58

86

98

4.12 EFFECT OF CORROSION ACTIVITY INDEX ON

RESIDUAL STRENGTH OF CORRODED BEAMS

Using data from Tables 4.5 and 4.10, Table 4.12 is prepared to list the

values of IcorrT and the percentage residual strength, R for all corroded beams,

arranged into four groups with respect to D and Cv.

The values of R are plotted with respect to IcorrT in Fig. 4.17 for each group

of data in Table 4.12. As expected, R decreased with increasing IcorrT. With

increasing IcorrT, the metal loss will be higher and this inevitably will reduce the

residual flexural strength. As an example, for beams with D = 10 mm and Cv = 25

mm, the value of R decreased from 92% to 56% when IcorrT increased from 4.12 to

23.92 mA-days/cm2.

Table 4.12: IcorrT versus R Data for all Sets of Cv and D Values.

D=10mm;Cv=25mm D=10mm;Cv=40mm D=12mm;Cv=25mm D=12mm;Cv=40mm

IcorrT (mA-

days/cm2)

R (% residual

strength)

IcorrT (mA-

days/cm2)

R (% residual

strength)

IcorrT (mA-

days/cm2)

R (% residual

strength)

IcorrT (mA-

days/cm2)

R (% residual

strength)

4.12 92 6.08 93 5.00 86 6.96 92

10.88 87 6.92 87 7.84 81 9.96 83

11.82 90 7.68 84 17.94 71 12.18 76

16.44 79 13.26 79 12.54 71 16.80 68

17.44 67 16.16 78 20.64 60 16.64 69

23.92 56 25.04 56 20.96 57 18.96 58

99

50

55

60

65

70

75

80

85

90

95

0 5 10 15 20 25 30

IcorrT (mA-days/sq. cm)

R (%

)D = 10 mm; Cv = 25 mm (Gr.1)D = 10 mm; Cv = 40 mm (Gr.2)D = 12 mm; Cv = 25 mm (Gr.3)D = 12 mm; Cv = 40 mm (Gr.4)

Gr.2Gr.1

Gr.3Gr.4

Figure 4.17: Variation of Residual Strength with IcorrT and D.

A comparison of the plots for Gr.1 and Gr.2 (D = 10 mm, Cv = 25mm and

D = 10mm, Cv = 40mm) and those for Gr.3 and Gr.4 shows that the value of R is

not significantly affected by Cv, within the range of Cv considered, when IcorrT

exceeds say 12 mA-days/cm2.

100

4.13 THEORETICAL FLEXURAL CAPACITY OF CONTROL

BEAMS

The theoretical values of ultimate moment capacity of the control beams,

Mth,uc, were calculated using conventional strength theory based on strain

compatibility analysis, as the location of the top 8 mm bars was found to be within

the tension zone and 10 mm bars showed nonlinear stress-strain relationship after

the proportional limit. A typical calculation of Mth,uc is presented in Appendix-II.

Table 4.13 lists the values of Mth,uc as calculated together with the

experimentally determined moment capacities, Mex,uc for the four control beams

and the ratio of Mex,uc/Mth,uc, designated as Cc.

Table 4.13: Mex,uc, Mth,uc, and Cc for Four Control Beams.

Beam fc′ MPa

Mth,uc kN-mm

Mex,uc N-mm

Cc = ucth

ucex

MM

,

,

BT1-C 45.77 10476 11640 1.11

BT2-C 36.28 14015 14795 1.06

BT3-C 46.49 10146 11760 1.16

BT4-C 46.11 13404 13125 0.98

The results show that for beams with 12 mm diameter tension bars (BT2-C

and BT4-C), Cc is close to 1.0, indicating high degree of accuracy for the

theoretical predictions. However, for beams with 10 mm diameter bars (BT1-C

and BT3-C), the values of Cc exceed 1.0 by over 10%, implying that the

theoretical prediction was somewhat smaller than the actual strength.

101

4.14 FLEXURAL STRENGTH OF CORRODED BEAMS

The flexural strength of a corroded beam at a given value of IcorrT is

affected predominately by the following two phenomena:

(i) The loss of metal due to corrosion. The net cross-sectional area of

a bar decreases with the loss of metal and this in turn would reduce the

moment capacity of the beam.

(ii) Degradation of bond between reinforcement and concrete due to

corrosion. Past research has emphatically shown that reinforcement

corrosion leads to degradation of bond, following a small increase in

strength at the early stage of corrosion. The loss of bond strength adversely

affects the moment capacity of a corroded beam.

Additionally, Zhang et al. [49], Xi et al. [50], and Jin and Zhao [38] have

reported that yield of a corroded bar is expected to increase. Uomoto et al. [45]

evaluated the tensile strength of steel bars obtained from structures affected by

reinforcement corrosion and reported that both the yield and ultimate strengths of

corroded steel bars were within the range of 90-95% of the non-corroded bars.

Also, Uomoto and Misra [32] conducted strength tests on the corroded bars from

beams and columns exposed to marine environment for different periods and

reported that the reduction in both the yield strength and the ultimate strength of

steel bars ranged from 5 to 10 % of the original bars. Aziz [37] investigated the

102

effect of corrosion on the tensile strength of reinforcing bars and found that net

tensile strength of bars is marginally affected due to corrosion. Almusallam [51]

stated that the yield strength of the clean bars and those corroded to 75% weight

loss as 796 MPa and 741 MPa, respectively. In view of the past contradicting

findings, the original yield strength of bars has been used in all calculations.

The flexural capacity of a corroded beam is first calculated in the same

manner as the control beams but using reduced diameter of tension bars D′ due to

corrosion in place of the original diameter, D. Any adverse implication of possible

bond loss between reinforcement and concrete from corrosion on moment capacity

has been ignored for this calculation.

The reduced diameter D′ is calculated from the well-known formula for

metal loss rate or penetration rate, Pr, given as [46]:

Pr = corrst

IFWγ

= st

rJγ

(4.7)

Where:

γst = density of steel = 7.85 g/cm3,

Jr = instantaneous corrosion rate, in g/cm2/year,

W = equivalent weight of steel = 55.85/2 = 27.925 g, and

F = Faraday’s constant = 96487 Coulombs (Amp-sec).

103

The reduction in bar diameter in active corrosion with steady-state

corrosion current density Icorr for corrosion period T is 2PrT and the percentage

reduction in diameter of bar is 100r

2PT , where D is the original bar diameter.

The reduced net diameter of a corroded bar, D′, is then written as:

−=′

DTPDD r21 (4.8)

In terms of cross-sectional area, Eq. (4.8) can be recast for calculating the

reduced cross-sectional area As′ as:

(4.9) (1 α−=′ ss AA )2

where As is the original cross-sectional area of the bar and α = 2PrT/D, which can

be better termed as ‘metal loss factor’.

From Eqs. (4.4) and (4.7), the percentage weight loss ρ can be shown to be

equal to (2α) times 100. In other words, the ratio of weight loss to the original

weight of a bar equals 2α or twice the metal loss factor.

Using As′ in place of As, Mth,c values of all corroded beams were calculated

using strain compatibility analysis for which a sample calculation is shown in

104

Appendix-II. The calculated values of Mth,c are presented in Table 4.14 along with

the values of Cf, which is the ratio of cth,Mcex,M

.

Two important observations can be made from the trend of the values of Cf

for beams. Firstly, Cf value progressively declines with increasing IcorrT for each

type of beam BT1 to BT4. This implies that the prediction of flexural strength,

based only on the use of reduced cross-sectional area of steel reinforcement As′,

calculated from Eq. (4.8), would not yield satisfactory results for higher values of

IcorrT, i.e. with higher degree of corrosion or metal loss. Higher IcorrT will cause

more corrosion damage that would result in loss of bond between steel and

concrete. The moment capacity of a corroded beam, therefore, cannot be

calculated simply on the basis of As′ alone at a higher IcorrT, for which bond effect

must be taken into account.

Secondly, it is also observed that Cf values at lower IcorrT (Table 4.14) are

closer to 1.0, or greater than 1.0 for beams reinforced with 10 mm diameter bars

(BT1 and BT3 groups). This observation lends support to the postulation that

moment capacity of a corroded beam at a low value of IcorrT can be calculated with

an acceptable degree of accuracy using only As′ from Eq. (4.9) and ignoring any

implication of bond. This is consistent with the prevailing notion that at the early

stage of corrosion, bond loss is minimal or there may be a small increase in bond

strength.

105

Table 4.14: D′, Mex,c, Mth,c and Cf for the Corroded Beams.

Beam Cv (mm)

D (mm)

IcorrT (mA-

d/cm2)

f′c (MPa)

D′ (Eq.4.8)

(mm)

Mth,c (KN-mm)

Mex,c (KN-mm)

Cf

=cth,Mcex,M

BT1-2-4 25 10 4.12 38.9 9.74 9685 10675 1.10

BT1-3-4 25 10 10.88 36.9 9.31 8952 10150 1.13

BT1-2-6 25 10 11.82 45.8 9.25 9380 10463 1.11

BT1-3-6 25 10 16.44 46.5 8.95 8998 9152 1.01

BT1-2-8 25 10 17.44 33.4 8.89 8167 7823 0.95

BT1-3-8 25 10 23.92 46.5 8.47 8353 6478 0.77

BT2-2-4 25 12 5.00 39.9 11.68 13654 12762 0.93

BT2-3-4 25 12 7.84 35.7 11.50 13039 11968 0.92

BT2-2-6 25 12 17.94 44.5 10.85 12398 10433 0.84

BT2-3-6 25 12 12.54 44.2 11.20 13018 10549 0.81

BT2-2-8 25 12 20.64 44.7 10.69 12128 8883 0.73

BT2-3-8 25 12 20.96 37.7 10.67 11687 8489 0.72

BT3-2-4 40 10 6.08 40.2 9.61 9324 10923 1.17

BT3-3-4 40 10 6.92 35.7 9.56 8828 10192 1.15

BT3-2-6 40 10 7.68 33.4 9.51 8540 9875 1.15

BT3-3-6 40 10 13.26 44.2 9.15 8959 9284 1.03

BT3-2-8 40 10 16.16 33.4 8.97 8038 9118 1.13

BT3-3-8 40 10 25.04 33.4 8.41 7547 6598 0.87

BT4-2-4 40 12 6.96 36.9 11.56 11923 12030 1.01

BT4-3-4 40 12 9.96 46.5 11.37 12540 10932 0.87

BT4-2-6 40 12 12.18 46.5 11.22 12333 10021 0.81

BT4-3-6 40 12 16.80 40.9 10.93 11462 8978 0.78

BT4-2-8 40 12 16.64 40.9 10.94 11475 8997 0.78

BT4-3-8 40 12 18.96 37.7 10.79 10979 7567 0.69

106

The values of Cf and IcorrT from Table 4.14 are plotted in Fig. 4.18 for each

group of beams to show the decline in Cf values with IcorrT.

0.6

0.7

0.8

0.9

1

1.1

1.2

0 5 10 15 20 25 30

IcorrT (mA-days/sq. cm)

Cf (

%)

D = 10 mm; Cv = 25 mm (Gr.1) D = 10 mm; Cv = 40 mm (Gr.2)D = 12 mm; Cv = 25 mm (Gr.3) D = 12 mm; Cv = 40 mm (Gr.4)

Gr.2

Gr.1

Gr.3Gr.4

Figure 4.18: Variation of Cf with IcorrT and D.

The comparison of two plots of beam groups BT1 and BT3 (beams with 10

mm diameter bars) and of the plots for beam groups BT2 and BT4 (beams with 12

mm diameter bars) shows that the effect of cover Cv does not have appreciable

effect on Cf values within the range of IcorrT between 8 and 20 mA-days/cm2.

107

4.15 POST-CRACKING COMPLIANCE OF CORRODED

BEAMS

An attempt has been made to compute the post-cracking compliance

(inverse of the slope of the linear part of P-δ plots ) of the beam at the linear part

of the load-deflection plot to see how the compliance is affected through corrosion

induced damage.

The measured values of compliance in mm/N are shown in Table 4.15 for

all beams. Results show that compliance increases with increasing IcorrT, as the

beam stiffness gradually degrades. For the beam type BT1, the compliance

increased from 0.074 to 0.122 mm/N, when IcorrT was increased from 4 to 24 mA-

days/cm2.

4.16 MODE OF FAILURE OF CONTROL AND CORRODED

BEAMS

Figures 4.19 and 4.20 show the crack pattern in a control beam and a

corroded beam prior to failure. Essentially a flexure or flexure-shear type failure

was observed in all the beams, in which the cracks advanced towards the top with

new cracks emerging. Failure was assumed to occur when the applied load on the

beams began to drop, with increasing midspan deflection.

108

Table 4.15: Measured Values of Compliance for Corroded Beams.

Beam IcorrT (mA-days/cm2)

Compliance (mm/N)

BT1-2-4 4.12 0.074

BT1-3-4 10.88 0.073

BT1-2-6 11.82 0.076

BT1-3-6 16.44 0.088

BT1-2-8 17.44 0.109

BT1-3-8 23.92 0.122

BT2-2-4 5.00 0.061

BT2-3-4 7.84 0.066

BT2-2-6 17.94 0.071

BT2-3-6 12.54 0.072

BT2-2-8 20.64 0.088

BT2-3-8 20.96 0.118

BT3-2-4 6.08 0.103

BT3-3-4 6.92 0.078

BT3-2-6 7.68 0.090

BT3-3-6 13.26 0.079

BT3-2-8 16.16 0.101

BT3-3-8 25.04 0.105

BT4-2-4 6.96 0.070

BT4-3-4 9.96 0.069

BT4-2-6 12.18 0.068

BT4-3-6 16.8 0.068

BT4-2-8 16.64 0.064

BT4-3-8 18.96 0.100

109

The vertical shear reinforcement provided throughout the length of the

specimens served its purpose by safeguarding against any unwanted premature

shear failure. As the tension bars were anchored well at ends, no premature slip of

bars occurred in any of the beams tested.

Figure 4. 19: Failure of a Typical Control Beam (BT1-C).

110

Figure 4. 20: Failure of a Typical Corroded Beam (BT1-3-4).

CHAPTER 5

PREDICTION OF RESIDUAL FLEXURAL STRENGTH

OF CORRODED BEAMS

An attempt has been made to utilize the experimental data gathered in this

study for proposing a predictive model for the estimation of the residual flexural

strength of beams that are subjected to reinforcement corrosion.

5.1 BASIS FOR THE DEVELOPMENT OF THE MODEL

The prediction model for the residual flexural strength of corroded

reinforced concrete beams was developed on the basis of the following

observations, as discussed in Chapter 4:

(i) Degree of corrosion increases with increasing corrosion activity

index, IcorrT, and consequently flexural strength of a corroded beam

decreases with increasing IcorrT.

111

112

(ii) For a constant IcorrT, the percentage loss of metal and hence the

cross-sectional area is smaller for a large diameter bars compared to the

smaller diameter bars.

(iii) The effect of reinforcement cover, within the range considered in

this study, has a small effect on metal loss at a constant IcorrT.

(iv) The values of Cf, determined on the basis of theoretical moment

capacity, calculated using reduced cross-sectional area As′ from Eq. (4.9),

shows that such theoretical prediction would be inaccurate at higher IcorrT, if

loss of bond is not addressed.

5.2 STRENGTH PREDICTION MODEL

The following two-step procedure is proposed to predict the residual

strength of a corroded beam for which the cross-sectional details, materials

strengths, corrosion activity index, IcorrT and diameter of rebar, D are known:

(i) First, moment capacity, Mth,c is calculated using reduced cross-

sectional area of tensile reinforcement, As′, calculated from Eq. (4.9).

(ii) The computed value of Mth,c is then multiplied by a correction

factor, Cf to obtain the predicted residual strength of the beam, Mres, as

follows:

(5.1) cthfres MCM ,=

113

The value of Cf reflects the effect of bond and the necessary correlation between

Mres and Mth,c.

The proposed value of Cf is taken as a function of two important variables

namely, IcorrT and D. Based on the experimental observations and several trials, Cf

is taken in the following empirical form

nmcorr

f DTIA)(

=C (5.2)

A, m and n are constants that are determined through a multi-level regression of

test data for Cf (Table 4.13).

Regression analysis with a best fit (regression coefficient = 0.906) yielded

the values of constants as: A = 14.7, m = 0.15 and n = 1.0. Thus, the proposed

equation for Cf is:

15.0)(7.14TID corr

f =C (5.3)

where, D = diameter of rebar in mm; Icorr = corrosion current density in mA/cm2

and T = duration of corrosion in days

The Cf values for all the 24 corroded beams are calculated by substituting

IcorrT and D values in Eq. (5.3). The residual flexural strength, Mres, for all the 24

corroded beams are calculated from Eq. (5.1) using the values of Mth,c (Table

4.11). The values of Cf, Mex,c and predicted Mres for all the 24 corroded beams are

presented in Table 5.1.

114

Table 5.1: Values of Cf, Mth,c, Mex,c and Mres.

Beam Cf (Eq.5.3)

Mth,c (KN-mm)

Measured Mres = Mex,c (KN-mm)

Predicted Mres

(KN-mm)

% Error ( )

100,

, ×−

cex

rescex

MMM

BT1-2-4 1.19 9685 10675 11525 -7.96

BT1-3-4 1.03 8952 10150 9221 9.16

BT1-2-6 1.01 9380 10463 9474 9.45

BT1-3-6 0.97 8998 9152 8728 4.63

BT1-2-8 0.96 8167 7823 7840 -0.22

BT1-3-8 0.91 8353 6478 7601 -17.34

BT2-2-4 0.96 13654 12762 13108 -2.71

BT2-3-4 0.90 13039 11968 11735 1.95

BT2-2-6 0.79 12398 10433 9794 6.12

BT2-3-6 0.84 13018 10549 10935 -3.66

BT2-2-8 0.78 12128 8883 9460 -6.49

BT2-3-8 0.78 11687 8489 9116 -7.38

BT3-2-4 1.12 9324 10923 10443 4.40

BT3-3-4 1.10 8828 10192 9711 4.72

BT3-2-6 1.08 8540 9875 9223 6.60

BT3-3-6 1.00 8959 9284 8959 3.50

BT3-2-8 0.97 8038 9118 7797 14.49

BT3-3-8 0.91 7547 6598 6868 -4.09

BT4-2-4 0.92 11923 12030 10969 8.82

BT4-3-4 0.87 12540 10932 10910 0.20

BT4-2-6 0.84 12333 10021 10360 -3.38

BT4-3-6 0.80 11462 8978 9170 -2.13

BT4-2-8 0.80 11475 8997 9180 -2.03

BT4-3-8 0.79 10979 7567 8673 -14.62

115

6.0

7.0

8.0

9.0

10.0

11.0

12.0

13.0

14.0

6.0 7.0 8.0 9.0 10.0 11.0 12.0 13.0 14.0

Predicted Mres (kN-m)

Mea

sure

d M

res (

kN-m

)

Figure 5.1: Comparison of Measured Mres and the Predicted Mres.

From Table 5.1, it is to be noted that out of total 24 predicted values of

Mres, 21 values have less than 10% error. In more than 50% cases, the error is less

than 5%. Also, the measured values of the residual strength Mres and the predicted

values of Mres for all corroded beams that are plotted in Fig. 5.1, shows a

reasonably good correlation between the predicted and measured values of Mres.

The proposed strength prediction model can be utilized either to find the

residual flexural capacity of a beam that has suffered corrosion damage or to find

the limit of Icorr for a given corrosion period that can be permitted for a beam at a

116

lowest level of compromised safety. The latter has practical significance, as Icorr is

measured in-situ for a beam to determine the level of corrosion activity. The

proposed model allows to predetermine the maximum level of IcorrT or Icorr for a

given T at which the residual moment capacity of a beam is expected to reach the

minimum safe value.

The utility of the proposed strength prediction model can be explained

through the following two examples:

Example # 1

A reinforced concrete beam (effective depth = 250mm, width = 200mm, As

= 4 bars of 12 mm each, fc′ = 40 N/mm2 and fy = 500 N/mm2) has been subjected

to an active corrosion for a period of 25 years. The measured Icorr = 1 µA/cm2.

Determine the percentage residual flexural strength of the beam.

Solution:

T = 25 years = 9125 days

Icorr = 1 µA/cm2 = 0.001 mA/cm2

IcorrT = 0.001 × 9125 = 9.125 mA-days/cm2

D = 12 mm

As = 4 × 4π (12)2 = 452.4 mm2

117

××××−×=

−=

−=

4020085.04.4525005.02504.452500

'85.05.0

2,c

sysysyucth bf

AfdAfadAfM

= 52.78 × 10⁶ N-mm = 52.78 kN-m

From Eq. (4.7), Pr = 3.1854 × 10⁻⁵ mm/d

α = 2 PrT/D = 0.0484

From Eq. (4.9), As′ = 410 mm2

××××−×=

−′=

−′=

4020085.04105005.0250410500

85.05.0

2,c

sysysycth fb

AfdAfadAfM

= 48.16 × 10⁶ N-mm = 48.16 kN-m

From Eq. (5.3), correction factor Cf is calculated as: Cf = 0.879

From Eq. (5.1), the predicted residual strength of the beam,

Mres = 48.16 × 0.879 = 42.34 kN-m.

Percentage residual flexural strength of the beam is calculated as:

R = (Mres/Mth,uc)100 = (42.34/52.78) 100 = 80.22%

118

Example # 2

Specify the permissible limit of Icorr so that the flexural strength of a beam

(effective depth = 250 mm, breadth = 200 mm, As = 4 bars of 12 mm each, fc′ = 40

N/mm2 and fy = 500 N/mm2) would not fall below 85% due to reinforcement

corrosion during a corrosion period of 50 years.

Solution:

T = 50 years = 18250 days

Icorr = ?

D = 12 mm

R = 85%

As = 4 × 4π (12)2 = 452.4 mm2

××××−×=

−=

−=

4020085.04.4525005.02504.452500

'85.05.0

2,c

sysysyucth bf

AfdAfadAfM

= 52.78 × 10⁶ N-mm = 52.78 kN-m

R = (Mres/Mth,uc)100 = 85 (given)

⇒ Mres = 0.85 × Mth,uc = 0.85 × 52.78 = 44.86 kN-m

From Eq. (4.7), Pr = 0.03185 Icor (mm/d), where Icorr is in mA/cm2

α = 2 PrT/D = 2 × 0.03185 Icor × 18250/12 = 96.877 Icor

⇒ Icorr = 0.0103α (i)

119

From Eq. (5.3), correction factor Cf is calculated as:

15.015.05585.0

)182500103.0(127.14

α=

×α=fC

From Eq. (5.1)

15.0

15.0

, 32.805585.0

86.44 α=

α

==f

rescth C

MM (ii)

From Eq. (4.9)

As′ = As (1 – α)2 = 452.4 (1 – α)2 mm2

′′

−′=

−′=c

sysysycth fb

AfdAfadAfM

85.05.0

2,

××

α−××−α−×=4020085.0

)1(4.4525005.0250)1(4.4525002

2

4626 )1(1076.3)1(1055.56 α−×−α−×=

(iii)

Equating Eqs. (ii) and (iii):

462615.0 )1(1076.3)1(1055.5632.80 ααα −×−−×=

Solving the above equation by trial and error, the value of α is calculated as:

α = 0.0382

Substituting the value of α in Eq. (i), the value of Icor is calculated as:

Icorr = 0.0103 × 0.0382 = 3.93 × 10⁻⁴ mA/cm2 (0.393 µA/cm2)

120

5.3 A VERIFICATION OF THE ACCURACY OF PROPOSED

METHOD WITH THE AVAILABLE DATA

To verify the accuracy of the proposed model, the results are compared

with the data reported by other researchers. The test data reported by Rodriguez et

al., [12], Tachibana et al., [13] and Mangat and Elgarf [11], are used for the

comparison, as their data provide information on Icorr, T, D, the cross-section of

the beam and material properties.

Rodriguez et al. [12], carried out experiments on beams of dimensions

2300 × 200 × 150 mm. Compressive strength varied from 34 MPa to 37 MPa, and

the yield strength of the reinforcement varied from 575 MPa to 585 MPa,

depending on the beam type. A constant current density of about, 100 µA/cm2 was

applied to the rebars for a period of time ranging between 100 and 200 days

approximately. The details of the comparison are shown in Table 5.2.

A curve is plotted between the experimental moment as given by

Rodriguez et al. [12], and the moment predicted by the proposed model in Fig 5.2.

From Fig. 5.2, it is clear that the proposed model predicts well the

experimental results reported by Rodriguez et al. [12].

121

Table 5.2: Comparison of the Proposed Model results with

those reported by Rodriguez et al. [12].

Icorr (mA/cm2)

T (days)

Tension Steel

fc’

(MPa) fy

(MPa) Mex-

Rodriguez (KN-mm)

Mpred. using proposed

model (KN-mm)

% Error

0.1 101 2-10ø 34 575 11600 13220 13.96

0.1 117 2-10ø 34 575 10500 12660 20.57

0.1 160 2-10ø 34 575 10100 11420 13.07

0.1 190 2-10ø 34 575 8600 10683 24.22

0.1 104 4-12ø 35 585 29000 29229 0.79

0.1 115 4-12ø 35 585 27200 28497 4.77

0.1 163 4-12ø 35 585 20400 21450 5.15

0.1 175 4-12ø 35 585 22900 21035 -8.14

0.1 108 4-12ø 35 585 28200 28952 2.67

0.1 127 4-12ø 35 585 26400 27773 5.20

0.1 154 4-12ø 35 585 19400 26306 -35.59

0.1 181 4-12ø 35 585 20900 25009 19.66

0.1 111 4-12ø 37 585 28200 29048 3.01

0.1 128 4-12ø 37 585 28500 27991 -1.78

0.1 164 4-12ø 37 585 27500 26035 -5.33

0.1 190 4-12ø 37 585 20200 25376 25.62

122

R2 = 0.9049

0

5000

10000

15000

20000

25000

30000

35000

0 5000 10000 15000 20000 25000 30000 35000

MresPredicted (KN-mm)

Mre

s-Ro

drig

uez

(KN

-mm

)

Figure 5.2: Relationship between MresActual-Rodriguez [12] and Predicted Mres

using the proposed model.

Tachibana et al. [13] in their study on the mechanical behavior of RC

beams damaged by corrosion of reinforcement, used beam specimens of cross-

section 150 × 200 mm. The concrete strength was 35.6 MPa and the

reinforcement was two 16 mm diameter bars of yield strength 353 MPa. A

current density of, 0.5 mA/cm2 was applied for 3, 6, 10, and 15 days. The results

reported by Tachibana et al. [13] are compared with those calculated by the

proposed model. The details of the comparison are shown in Table 5.3.

123

Table 5.3 : Comparison of Proposed Model results with

those of Tachibana et al. [13].

Icorr (mA/cm2)

T (days)

Tension Steel

fc’

(MPa) fy

(MPa) Mex-

Tachibana (KN-mm)

Mpred. using proposed

model (KN-mm)

% Error

0.5 3 2-16ø 35.6 353 21128 18740 11.30

0.5 6 2-16ø 35.6 353 19035 16709 12.21

0.5 10 2-16ø 35.6 353 18055* 15251 15.53

0.5 15 2-16ø 35.6 353 18731* 14087 24.79

* Bond shear type failure.

Disregarding the results of the two sets of beams that failed in bond shear,

as the proposed model is based on flexure dominated failure, it can be seen that the

model predicted the experimental moment of Tachibana et al. [13], within an error

of 12 %.

However, with regard to the test data reported by Mangat and Elgarf [11],

the proposed model does not yield satisfactory results. This is presumably due to

the fact that the researchers have reported a significant reduction in the flexural

strength caused by a relatively small weight loss of metal, contrary to the findings

of the present and other past studies [12-13].

In view of the fact that the proposed method is able to predict the residual

strength of the corroded beams that have been reported by two researchers with

reasonable accuracy, the method appears to have practical appeal.

CHAPTER 6

CONCLUSIONS AND RECOMMENDATIONS

In this experimental study, 48 reinforced concrete beam specimens were

subjected to accelerated corrosion using impressed current and then they were

tested in a four-point bend test to determine their residual flexural strength. The

following variables were used: two levels of applied impressed current density,

three levels of corrosion period and two different diameter of tension

reinforcement with two different concrete cover thicknesses. Based on test data, a

two-step procedure has been proposed to predict the flexure strength of corroded

beams.

6.1 CONCLUSIONS

Based on the data developed in this study, the following conclusions are

drawn:

1. Measured values of the corrosion current density, Icorr are less than

the applied current density, Iapp due to the resistance and the

electrolytic properties of concrete surrounding the rebars.

124

125

2. The product of corrosion current density and the corrosion period,

IcorrT, defined in this work as the ‘Corrosion Activity Index’, is the

key measure of corrosion damage. The percentage metal loss and

the loss of flexural strength increase with increasing IcorrT.

3. The effect of reinforcement cover on degree of corrosion at a

constant value of IcorrT is found to be small.

4. The percentage-wise loss of metal is smaller for a large diameter

bar compared to that for smaller diameter bar at a constant IcorrT.

5. At a lower value of IcorrT, the residual flexural strength of a

corroded beam can be predicted with a reasonable accuracy by

considering only the reduced cross-sectional area of tension

reinforcement As′ from Eq. (4.9). However, at a higher value of

IcorrT, the increasing adverse effect of bond cannot be ignored in

determining the residual flexural capacity.

6. Based on the experimental data, an approach has been proposed to

predict the residual flexural strength of a corroded beam for which

IcorrT, rebar diameter D, cross-sectional details and material

strengths are known. The proposed two-step approach consists of

determination of a correction factor, Cf, that should be applied to

correct the theoretical moment capacity of a corroded beam,

126

calculated on the basis of reduced cross-sectional area, As′. This

approach appears to produce satisfactory results within the range of

IcorrT used in this study.

7. A comparison of the residual strengths of corroded beams predicted

by the proposed model with those reported by other researchers

shows a reasonably good agreement.

8. A corroded beam shows higher deflection than an un-corroded one,

due to degradation in the flexural stiffness due to corrosion that

increases with increasing IcorrT. The compliance of a corroded

beam determined at the linear part of load-deflection response

increases, albeit slowly, with increasing IcorrT.

6.2 SUGGESTIONS FOR FUTURE STUDY

The following studies are recommended to further strengthen the findings

of this study:

1. The predictive model is developed on the basis of test data

generated from beams of same size. Tests should be carried out on

different beam sizes to verify the accuracy of the proposed method

and to observe the size effect.

127

2. More tests are required to find out the maximum level of IcorrT

below which bond loss can be ignored and the strength prediction

can be made simply by using As′ from Eq. (4.9).

3. In the present study, corrosion of reinforcement was accelerated by

the impressed current, for the specified duration and then tests were

carried out on the corroded specimens to monitor its effects on

flexural strength. In real structures, the corrosion of reinforcement

takes with reinforcements being under stress. Hence, tests should

be carried out to observe the simultaneous effect of stress-

reinforcement corrosion on the flexural strength.

128

APPENDIX A

Load - Deflection Curves

Midspan Deflection (mm)

Load

(kN

)

0 2 4 6 8 10 120

10

20

30

40

50

60

70

80

Specimen 1Specimen 2

BT1-C

Figure A. 1: Load-midspan deflection plot for two BT1-C specimens

Midspan Deflection (mm)

Load

(kN

)

0 2 4 6 8 100

10

20

30

40

50

60

70

80

90

100

Specimen 1Specimen 2

BT2-C

Figure A. 2: Load-midspan deflection plot for two BT2-C specimens

129

Midspan Deflection (mm)

Load

(kN

)

0 2 4 6 80

10

20

30

40

50

60

70

80

Specimen 1Specimen 2

BT3-C

Figure A. 3: Load-midspan deflection plot for two BT3-C specimens

Midspan Deflection (mm)

Load

(kN

)

0 2 4 6 80

10

20

30

40

50

60

70

80

Specimen 1Specimen 2

BT4-C

Figure A. 4: Load-midspan deflection plot for two BT4-C specimens

130

Midspan Deflection (mm)

Load

(kN

)

0 2 4 6 8 10 120

10

20

30

40

50

60

70

Specimen 1Specimen 2

BT1-2-4

Figure A. 5: Load-midspan deflection plot for two BT1-2-4 specimens

Midspan Deflection (mm)

Load

(kN

)

0 2 4 6 8 100

10

20

30

40

50

60

Specimen 1Specimen 2

BT1-2-6

Figure A. 6: Load-midspan deflection plot for two BT1-2-6 specimens

131

Midspan Deflection (mm)

Load

(kN

)

0 2 4 6 8 10 120

10

20

30

40

50

60

Specimen 1Specimen 2

BT1-2-8

Figure A. 7: Load-midspan deflection plot for two BT1-2-8 specimens

Midspan Deflection (mm)

Load

(kN

)

0 2 4 6 8 10 120

10

20

30

40

50

60

Specimen 1Specimen 2

BT1-3-4

Figure A. 8: Load-midspan deflection plot for two BT1-3-4 specimens

132

Midspan Deflection (mm)

Load

(kN

)

0 2 4 6 8 10 120

10

20

30

40

50

60

Specimen 1Specimen 2

BT1-3-6

Figure A. 9: Load-midspan deflection plot for two BT1-3-6 specimens

Midspan Deflection (mm)

Load

(kN

)

0 2 4 6 80

10

20

30

40

50

Specimen 1Specimen 2

BT1-3-8

Figure A. 10: Load-midspan deflection plot for two BT1-3-8 specimens

133

Midspan Deflection (mm)

Load

(kN

)

0 2 4 6 8 100

10

20

30

40

50

60

70

80

Specimen 1Specimen 2

BT2-2-4

Figure A. 11: Load-midspan deflection plot for two BT2-2-4 specimens

Midspan Deflection (mm)

Load

(kN

)

0 2 4 6 80

10

20

30

40

50

60

70

Specimen 1Specimen 2

BT2-2-6

Figure A. 12 : Load-midspan deflection plot for two BT2-2-6 specimens

134

Midspan Deflection (mm)

Load

(kN

)

0 2 4 6 80

10

20

30

40

50

60

Specimen 1Specimen 2

BT2-2-8

Figure A. 13: Load-midspan deflection plot for two BT2-2-8 specimens

Midspan Deflection (mm)

Load

(kN

)

0 2 4 6 8 100

10

20

30

40

50

60

70

80

90

100

Specimen 1Specimen 2

BT2-3-4

Figure A. 14: Load-midspan deflection plot for two BT2-3-4 specimens

135

Midspan Deflection (mm)

Load

(kN

)

0 2 4 6 8 100

10

20

30

40

50

60

70

80

90

Specimen 1Specimen 2

BT2-3-6

Figure A. 15: Load-midspan deflection plot for two BT2-3-6 specimens

Midspan Deflection (mm)

Load

(kN

)

0 2 4 60

10

20

30

40

50

Specimen 1Specimen 2

BT2-3-8

Figure A. 16: Load-midspan deflection plot for two BT2-3-8 specimens

136

Midspan Deflection (mm)

Load

(kN

)

0 2 4 6 8 10 12 140

10

20

30

40

50

60

70

Specimen 1Specimen 2

BT3-2-4

Figure A. 17: Load-midspan deflection plot for two BT3-2-4 specimens

Midspan Deflection (mm)

Load

(kN

)

0 2 4 6 8 100

10

20

30

40

50

60

70

Specimen 1Specimen 2

BT3-2-6

Figure A. 18: Load-midspan deflection plot for two BT3-2-6 specimens

137

Midspan Deflection (mm)

Load

(kN

)

0 2 4 6 80

10

20

30

40

50

60

Specimen 1Specimen 2

BT3-2-8

Figure A. 19: Load-midspan deflection plot for two BT3-2-8 specimens

Midspan Deflection (mm)

Load

(kN

)

0 2 4 6 8 10 120

10

20

30

40

50

60

70

Specimen 1Specimen 2

BT3-3-4

Figure A. 20: Load-midspan deflection plot for two BT3-3-4 specimens

138

Midspan Deflection (mm)

Load

(kN

)

0 2 4 6 8 100

10

20

30

40

50

60

Specimen 1Specimen 2

BT3-3-6

Figure A. 21: Load-midspan deflection plot for two BT3-3-6 specimens

Midspan Deflection (mm)

Load

(kN

)

0 2 4 6 80

10

20

30

40

50

Specimen 1Specimen 2

BT3-3-8

Figure A. 22: Load-midspan deflection plot for two BT3-3-8 specimens

139

Midspan Deflection (mm)

Load

(kN

)

0 2 4 6 8 100

10

20

30

40

50

60

70

80

Specimen 1Specimen 2

BT4-2-4

Figure A. 23: Load-midspan deflection plot for two BT4-2-4 specimens

Midspan Deflection (mm)

Load

(kN

)

0 2 4 6 80

10

20

30

40

50

60

70

Specimen 1Specimen 2

BT4-2-6

Figure A. 24: Load-midspan deflection plot for two BT4-2-6 specimens

140

Midspan Deflection (mm)

Load

(kN

)

0 2 4 60

10

20

30

40

50

60

Specimen 1Specimen 2

BT4-2-8

Figure A. 25: Load-midspan deflection plot for two BT4-2-8 specimens

Midspan Deflection (mm)

Load

(kN

)

0 2 4 6 80

10

20

30

40

50

60

70

Specimen 1Specimen 2

BT4-3-4

Figure A. 26: Load-midspan deflection plot for two BT4-3-4 specimens

141

Midspan Deflection (mm)

Load

(kN

)

0 2 4 6 80

10

20

30

40

50

60

70

80

Specimen 1Specimen 2

BT4-3-6

Figure A. 27: Load-midspan deflection plot for two BT4-3-6 specimens

Midspan Deflection (mm)

Load

(kN

)

0 2 4 60

10

20

30

40

50

60

Specimen 1Specimen 2

BT4-3-8

Figure A. 28: Load-midspan deflection plot for two BT4-3-6 specimens

142

APPENDIX B

Sample Calculations of Theoretical Flexural Strengths of Both

Control and Corroded Beams Using Strain Compatibility Analysis

1. CONTROL BEAMS

Case 1: BT1-C

Diameter of tension reinforcement, D = 10 mm

Area of tension reinforcement, As= ××π24

102

= 157 mm2

Clear cover to tension reinforcement, Cv = 25 mm

Diameter of hanger bars = 8 mm

Area of the hanger bars, As′ = ××π24

82

= 100.53 mm2

Compressive strength of the concrete, f′c = 45.8 MPa

Effective depth, d = 150 – Cv – 2D = 150 – 25 –

210 = 120 mm

Width of the beam, b = 150 mm

CG of hanger bar from top, h = 41 mm

143

Strain Compatibility and Equilibrium Analysis

The value of the neutral axis depth, c is calculated using trial-and-error approach

to satisfy strain-compatibility and equilibrium equation. With c = 25.9 mm, from

Fig. B.1, c003.0 =

)('

chs

−ε

Hence, strain in the compression steel, εs′ =

−×

cch )(003.0 = 0.00175

The corresponding stress, fs′ = 0.00175 × 2 × 105 = 349.81 MPa (which is less than

the yield stress of 8 mm bar, 500 MPa)

0.003 0.85f′c

a C c

h

T1 εs′

T2 εs

Figure B.1 Figure B.2

144

Also from Fig. B.1, c003.0 =

)( cds

−ε

Hence, strain in the tension steel, εs =

−×

ccd )(003.0 = 0.0109

The corresponding stress, fs from the stress strain plot is 546 MPa.

From Fig. B.2,

T1 = As′ fs′ = 100.53 × 349.81 = 35185.5N

T2 = As fs = 157 × 546= 85722 N

a = bf

TT

c '85.0)( 21 + = 20.719 mm

c = 8.0

a = 1.25 × a = 25.9 (same as the assumed value of 25.9 mm)

Now, the theoretical flexural strength of control beam,

Mth-uc = T1 (h-a/2) + T2 (d-a/2)

= 35185.5 (41-20.719/2) + 85722 (120-20.719/2)

= 10476704.25 N mm = 10.48 KN-m

Case 2: BT2-C

Diameter of tension reinforcement, D = 12 mm

Area of tension reinforcement, As= 2 × π × 144/ 4 = 226.1 mm2

Clear cover to tension reinforcement, Cv = 25 mm

145

Diameter of hanger bars = 8 mm

Area of the hanger bars, As′ = 2 × π × 64/ 4 = 100.53 mm2

Compressive strength of the concrete, f′c = 36.3 MPa

Effective depth, d = 150 – Cv – D/2

= 150 – 25 – 12/2 = 119 mm

Width of the beam, b = 150 mm

CG of hanger bar from top, h = 41 mm

Strain Compatibility and Equilibrium Analysis

The value of the neutral axis depth, c is calculated using trial-and-error approach

to satisfy strain-compatibility and equilibrium equation. With c = 37.54 mm from

Fig. B.1, c003.0 =

)('

chs

−ε

Hence, strain in the compression steel, εs′ =

−×

cch )(003.0 = 0.000276

The corresponding stress, fs′ = 0.000276 × 2 × 105 = 55.30 MPa (which is less than

the yield stress of 8 mm bar, 500 MPa)

Also from Fig. B.1, c003.0 =

)( cds

−ε

Hence, strain in the tension steel, εs =

−×

ccd )(003.0 = 0.00651 (which is

greater than the yielding strain 0.003, hence considering the yielding strain)

146

The corresponding stress at yield, fy from the stress strain plot is 590 MPa.

From Fig. B.2,

T1 = As′fs′ = 100.53 × 55.30 = 5559.31 N

T2 = Asfs = 226.1 × 590 = 133399 N

a = bf

TT

c '85.0)21 +( = 30.04 mm

c = 8.0

a = 1.25 × a = 37.55 (which is almost the same as the assumed value of

37.54 mm)

Now, the theoretical flexural strength of control beam,

Mth-uc = T1 (h-a/2) + T2 (d-a/2)

= 5559.31 (41-30.04/2) + 133399 (119-30.04/2)

= 14015259 N mm = 14.02 KN m

2. CORRODED BEAMS

Case 1: BT1-3-6

The reduced cross sectional area of the corroded bar As′ is calculated using Eq.

(4.9) as, As′ = As (1-α )2

where As is the original cross-sectional area of the bar and α = 2PrT/D

From Eq (4.7) the penetration rate, due to corrosion, Pr = 25/7.85 = 3.185 cm/year

Corrosion period = 6 days = 0.01644 years and

147

Diameter of the rebar, D=10 mm = 1 cm

α = 2 × 3.185 × 0.01644 / 1 = 0.105

Hence the reduced cross sectional area, As′ = (2 × π × 100/ 4)(1-0.105)2 = 125.8

mm2

Clear cover to tension reinforcement, Cv = 25 mm

Diameter of hanger bars = 8 mm

Area of the hanger bars As′′ = 2 × π × 64/ 4 = 100.53 mm2

Compressive strength of the concrete, f′c = 46.5 MPa

Effective depth, d = 150 – Cv – D/2 = 150 – 25 – 10/2 = 120 mm

Width of the beam, b = 150 mm

CG of hanger bar from top, h = 41 mm

Strain Compatibility and Equilibrium Analysis

The value of the neutral axis depth, c is calculated using trial-and-error approach

to satisfy strain-compatibility and equilibrium equation. With c = 23.78 mm, from

Fig. B.1, c003.0 =

)('

chs

−ε

Hence, strain in the compression steel, εs′ =

−×

cch )(003.0 = 0.002172

The corresponding stress, fs′ = 0.002172 × 2 × 105 = 434.4 MPa (which is less than

the yield stress of 8 mm bar, 500 MPa)

148

Also from Fig. B.1, c003.0 =

)( cds

−ε

Hence, strain in the tension steel, εs =

−×

ccd )(003.0 = 0.01214

The corresponding stress, fs from the stress strain plot is 548.6 MPa.

From Fig. B.2,

T1 = As′′fs′ = 100.53 × 434.4 = 43670.23 N

T2 = As′fs = 125.8 × 548.6 = 69014 N

a = bf

TT

c '85.0)21 +( = 19.027 mm

c = 8.0

a = 1.25 × a = 23.78 mm (which is the same as the assumed value of 23.78

mm)

Now, the theoretical flexural strength of corroded beam,

Mth-c = T1 (h-a/2) + T2 (d-a/2)

= 43670.23 (41-19.027/2) + 69014 (120-19.027/2)

= 9000138 N mm = 9.00 kN m

149

LIST OF NOTATIONS

As = cross-sectional area area of uncorroded reinforcement

A's = cross-sectional area of corroded reinforcement

b = width of beam

Cf = correction factor (Mex,c/Mth,c)

Cc = Mex,uc/Mth,uc

Cv = concrete cover thickness

D' = diameter of corroded rebar

D = diameter of uncorroded rebar

d = effective depth of beam

F = Faraday's constant (96487 A-sec)

f'c = 28-day compressive strength of concrete

fy = yield strength of reinforcing bar

Iapp = applied corrosion current density

Icorr = actual corrosion current density

IcorrT = corrosion activity index

Jr = corrosion rate, i.e. loss of metal per unit surface area per unit time

Mex, c = experimental ultimate moment capacity of corroded beams

Mex,uc = experimental ultimate moment capacity of uncorroded beams

150

Mth,c = theoretical ultimate moment capacity of corroded beams

Mth,uc = theoretical ultimate moment capacity of uncorroded beams

Pr = penetration rate, i.e. reduction in the rebar diameter per unit time

R = percentage residual strength of a corroded beam

T = corrosion duration

W = equivalent weight of steel (27.9 g)

α = metal loss factor = 2PrT/D

γst = density of steel (7.85 g/cm3)

ρ = percentage weight loss, i.e. degree of corrosion induced through

accelerated test

151

REFERENCES

[1] “As Solid as Concrete,” Middle East Construction, April/May 1987, pp. 20-

21.

[2] Schutt, W. R., “Cathodic Protection of New High- Rise Buildings in Abu-

Dhabi,” Concrete International, May 1992, pp. 45-46.

[3] Page, C. L., and Treadway, K. W. J., “Aspects of Electrochemistry of steel

in concrete- Nature,” Vol. 297, 1982, pp. 109-115.

[4] Concrete Repair Manual, “ACI International, BRE, Concrete society, and

International Concrete Repair Institute (ICRI)”; Second edition, Vol. 1,

May 2003.

[5] Cabrera, J. G., “Deterioration of Concrete Due to Reinforcement Steel

Corrosion,” Cement & Concrete Composites, 18 (1996), pp. 47-59.

[6] Kimberly, E. K., and Mehta, P. K., “A Critical Review of Deterioration of

Concrete Due to Corrosion of Reinforcing Steel”, Proceedings, Fourth

CANMET/ACI International conference on Durability of Concrete,

Sydney, Australia, 1997, pp. 535-554.

[7] Morinaga, S., “Prediction of service lives of reinforced concrete buildings

based on the corrosion rate of reinforcing steel”, Proceedings, Building

Materials and Components, Brighton, UK, 7-9 November 1990, pp. 5-16.

152

[8] Dagher, H. J., and Kulendran, S., “Finite element model of corrosion

damage in concrete structures,” ACI Structural Journal, Vol. 89, No. 6,

1992, pp. 699-708.

[9] Bazant, Z. P., “Physical model for steel corrosion in concrete sea

structures-application,” ASCE Journal of Structural Division, Vol. 105,

1979, pp. 1155-1166.

[10] Wang, X. M., and Zhao, H. Y., “The residual service life prediction of R.C.

structures,” Durability of Building Materials and Components 6, Edited by

Nagataki S, et al., E & FN Spon, 1993, pp. 1107-1114.

[11] Mangat, P.S., and Elgarf, M.S., “Flexural strength of concrete beams with

corroding reinforcement,” ACI Structural Journal, Vol. 96, No. 1, January-

February 1999, pp. 149-158.

[12] Rodriguez, J., Ortega, L.M., and Casal, J., “Load carrying capacity of

concrete structures with corroded reinforcement,” Construction and

Building Materials, Vol. 11, No. 4, 1997, pp. 239-248.

[13] Tachibana, Y., Maeda, K. I., Kajikawa, Y., and Kawamura, M.,

“Mechanical behaviour of RC beams damaged by corrosion of

reinforcement”, Third International Symposium on Corrosion of

reinforcement in Concrete Construction, Wishaw, UK, 1990, pp. 178-187.

[14] Townsend, H. E., Cleary, H. J., and Allegra, L., “Breakdown of Oxide

films in steel exposure to chloride solutions,” Corrosion- NACE, Vol 37,

1981, pp. 384-391.

153

[15] Verbeck, G. J., (1975). “Mechanism of corrosion in concrete,” Corrosion

of metals in concrete, ACI SP –49.

[16] Mehta, P. K., (1993). “Concrete Structures, Properties and Materials,”

Prentice-Hall Inc.

[17] Li, C. Q., “Initiation of Chloride-Induced Reinforcement Corrosion in

Concrete Structural Members-Prediction”, ACI Structural Journal, Vol.

99, No.2, March-April 2002, pp. 133-141.

[18] Li, C. Q., “Initiation of Chloride-Induced Reinforcement Corrosion in

Concrete Structural Members-Experimentation”, ACI Structural Journal,

Vol 98 (4), July-August 2001, pp. 502-510.

[19] Tuutti, K., “Corrosion of Steel in Concrete”, 1st edition. Swedish Cement

and Concrete Research Institute, Stockholm, Sweden, 1982.

[20] Amleh, L., and Mirza, S., “Corrosion influence on bond between steel and

concrete,” ACI Structural Journal, Vol. 96, No.3, May-June 1999, pp. 415-

423.

[21] Fu, X., and Chung, D. D. L., “Effect of corrosion on the bond between

concrete and steel rebar,” Cement and Concrete Research, Vol. 27, No. 12,

1997, pp. 1811-1815.

[22] Auyeung, Y., Balaguru, P., and Chung, L., “Bond behavior of corroded

reinforcement bars,” ACI Materials Journal, Vol. 97, No. 2, March-April,

2000, pp. 214-220.

154

[23] Al-Sulaimani, G. J., Kaleemullah, M., Basunbul, I. A., and

Rasheeduzzafar., “Influence of corrosion and cracking on bond behaviour

and strength of reinforced concrete members,” ACI Structural Journal,

Vol. 87, No.2, March-April 1990, pp. 220-231.

[24] Cabrera, J. G., and Ghoddoussi, P., “The effect of reinforcement corrosion

on the strength of the steel/concrete interface”, Proceedings, International

Conference on Bond in Concrete, Riga, Latvia, October 15-17, 1992, pp.

10/11 to 10/24.

[25] Almusallam, A. A., Al-Gahtani, A. S., Aziz, A.R., and Rasheeduzzafar.,

“Effect of reinforcement corrosion on bond strength,” Construction and

Building Materials, Vol. 10, No.2, 1996, pp. 123-129.

[26] Ravindrarajah, R., and Ong, K., “Corrosion of Steel in Concrete in

Relation to Bar Diameter and Cover Thickness”, ACI Special Publication,

Volume 100/4, April 1987, pp. 1667-1678.

[27] Rasheeduzzafar., and Dakhil, F. H., “Field studies on the durability of

concrete construction in a high chloride-sulphate environment”,

International Journal of Housing Science, Vol. 4, 1980, pp. 203-232.

[28] Rasheeduzzafar., Dakhil, F. H., and Al-Gahtani, A. S., “Corrosion of

reinforcement in concrete structures in the middle east”, Concrete

International; American Concrete Institute, Vol.7, No.9, Sept.1985, pp.

48-55.

155

[29] Rasheeduzzafar., Dakhil, F. H., and Bader, M. A., “Toward solving the

concrete deterioration problem in the Arabian Gulf region”, The Arabian

Journal for science and Engineering, Vol. 11, No.2, 1986, pp. 129-146.

[30] Tarek Uddin, M., Nobuaki, O., Makota, H., and Tsunenori, S., “Effect of

crack width and bar types on corrosion of steel in concrete”, Journal of

Materials in Civil Engineering, Vol. 13, No. 3, May/June, 2001, pp. 194-

201.

[31] Ting, S.C., and Nowak, A. S., “Effect of Reinforcing Steel Area Loss on

Flexural Behavior of Reinforced Concrete Beams,” ACI Structural

Journal, May-June 1991, pp. 309-314.

[32] Uomoto, T., and Misra, S., “Behaviour of concrete beams and columns in

marine environment when corrosion of reinforcing bars take place,” ACI

Special Publication SP-109-6, 1988, pp. 127-145.

[33] Huang, R., and Yang, C. C., “Condition Assessment of Reinforced

Concrete Beams Relative to Reinforcement Corrosion,” Cement and

Concrete Composites, 19 (1997), pp. 131-137.

[34] Yoon, S., Wang, K., Weiss W. J., and Shah, S. P., “Interaction between

Loading, Corrosion, and Serviceability of Reinforced Concrete”, ACI

Materials Journal, Vol. 97, No. 6, November-December 2000, pp. 637-

644.

[35] Nokhasteh, M. A., Eyre, J. R., and Mcleish, A., “The effect of

reinforcement corrosion on the strength of reinforced concrete members”,

156

Structural Integrity Assessment, Elsevier Applied Science, 1992, pp. 314-

325.

[36] Hognestad, E., Hanson, N. W., and McHenry, D., “Concrete stress

distribution in ultimate strength design”, Proceedings, American Concrete

Institute, Vol. 52, 1955-56, pp. 455-479.

[37] Aziz, A.R., “Reduction in bond and the strength of slabs due to corrosion

of reinforcement”, M.S.Thesis, King Fahd University of Petroleum and

Minerals, June, 1994.

[38] Jin, W.L., and Zhao, Y. X., “Effect of corrosion on bond behavior and

bending strength of reinforced concrete beams”, Journal of Zheijang

University (SCIENCE), Vol. 2, No. 3, July-September 2001, pp. 298-308.

[39] Escalante, E., Ito, S., and Cohen, M., “Measuring the Rate of Corrosion of

Steel in Concrete”, Annual Report NBSIR 80-2012, National Bureau of

Standards, Gaithersburg, Md., March 1980, pp. 1-26.

[40] Escalante, E., Whitenton, E., and Qui, F., “Measuring the Rate of

Corrosion of Reinforcing Steel in Concrete”, Final Report NBSIR 86-3456,

National Bureau of Standards, Gaithersburg, Md., Oct. 1986, pp. 1-27.

[41] Stern, M., and Geary, A. L., “Electrochemical polarization, theoretical

analysis of the shape of polarization curves”, Journal of Electrochemical

Society, Vol. 104, No. 1, 1957, pp. 56-63.

157

[42] Andrade, C., and Alonso, C., “On-Site Measurements of Corrosion Rate of

Reinforcements”, Construction and Building Materials, March, 2001, pp.

171-183.

[43] Millard, S. G., “Corrosion rate measurement of in-situ reinforced concrete

structures”, Proceedings, Institution of Civil Engineers, Structures and

Buildings, Vol. 99, Feb. 1993, pp. 84-88.

[44] ASTM G-1, “Standard Practice for Preparing, Cleaning and Evaluating

Corrosion Test Specimens”. Annual Book of ASTM Standards, Vol. 01.05,

American Society for Testing and Materials, Philadelphia, PA.

[45] Uomoto, T., Tsoji, K, and Kakizawa, T., “Deterioration mechanism of

concrete structures caused by corrosion of reinforcing bars”, Transactions

of Japan Concrete Institute, Vol. 6, 1984, pp. 163-170.

[46] Ijsseling, F. P., "Application of electrochemical methods of corrosion rate

determination to system involving corrosion product layers," British

Corrosion Journal, Vol. 21, No. 2, 1986, pp. 95-101.

[47] Yubun, A., Balaguru, P., and Lan, C., “Bond behavior of corroded

reinforcement bars”, ACI Materials Journal, Vol. 97, No.2, March-April

2000, pp. 214-220.

[48] Ballim, Y., and Reid, J. C., “Reinforcement corrosion and deflection of RC

beams- an experimental critique of current test methods”, Cement and

Concrete Composites, Vol. 25, 2003, pp. 625-632.

158

[49] Zhang, P. S., Lu, M., and Li, X.Y., “Mechanical property of rustiness in

reinforcement steel”, Industrial Construction, 25, 1995, pp. 41-44.

[50] Xi, W.L., Li, R., Lin, Z. S., et al., “Experimental studies on the property

before and after reinforcement corrosions in basic concrete members”,

Industrial Construction, 27, 1997, pp. 14-18.

[51] Almusallam, A. A., “Effect of degree of corrosion on the properties of

reinforcing steel bars”, Construction and Building Materials, Vol. 15,

2001, pp. 361-368.

159

VITA

NAME: Syed Ayub Azher

ADDRESS: H.No: 5-2-255, Idgah, Hanamkonda,

Warangal – 506001

Andhra Pradesh, INDIA

E-MAIL: [email protected]

EDUCATIONAL QUALIFICATIONS

Master of Science in Civil Engineering (Structures)

Sept. 2002 – Jan. 2005

King Fahd University of Petroleum and Minerals, Dhahran, Saudi Arabia

GPA – 3.31/4.0

Bachelor of Engineering (Civil)

Aug. 1998 – Feb. 2001

Osmania University, Hyderabad, India

First Class with Distinction

Diploma in Civil Engineering

Jan. 1994 – June 1996

Government Polytechnic, Warangal, India

First Division with Distinction.


Recommended