A preliminary assessment of the financial feasibility of basic income in Belgium Emily Van de Walle Academic year 2015-2016 University of Antwerp Faculty of Applied Economics Promoter: Prof. dr. Erreygers G. Master’s thesis submitted to obtain the degree of: Master of Applied Economic Sciences: Economic Policy
Transcript
A preliminary assessment of the
financial feasibility of basic income in Belgium
Emily Van de Walle
Academic year 2015-2016
University of Antwerp
Faculty of Applied Economics
Promoter:
Prof. dr. Erreygers G.
Master’s thesis submitted to obtain the
degree of:
Master of Applied Economic Sciences:
Economic Policy
1 | P a g e
Preface
Basic income has received much attention in the media in recent years and it was also in
this manner that I was first brought into contact with basic income. Admittedly, at first I
was dubious yet interested in the possible advantages of unconditionally granting all
citizens an income. During my bachelor’s year, I was thrilled to find basic income as one of
the topics for the final task of the bachelor’s project and thus wrote a paper on the
futurology and feasibility of basic income. By reading up on the literature about basic
income, my interest for the proposal had grown but at the same time I found myself
bothered by the lack of transparency in the methodology applied by basic income
proponents to assess how basic income may be possibly financed in Belgium. For this
reason, I decided to take up the challenge to personally assess the financial feasibility of
basic income in Belgium and this master’s dissertation is the final product towards that
end.
I could not have made it through this challenging journey without the support of a number
of people. First, I would like to express my deepest gratitude to my promoter prof. dr.
Erreygers Guido. I am not only grateful for his advice, comments, corrections, and his
guidance, but also for giving me the opportunity to write on a subject that I am passionate
about. Second, I am also thankful to my partner for his unconditional support,
encouragement, and for reading my master’s thesis. Third, I would like to thank my parents
and friends for their support from start to finish.
Emily Van de Walle
2 | P a g e
Abstract
The costs of unconditionally granting every citizen an equal fixed monthly income, known
as basic income, are substantial. In Belgium, advocates have attempted to ascertain the
financial feasibility of the proposal; however, the contributions are not only limited in
number but the applied methodology is also lacking in transparency. This dissertation
provides a preliminary assessment of whether basic income is financially feasible in
Belgium for the year 2010. The yearly costs of five basic income proposals including the
costs of the remaining social protection system are estimated. The cost of unconditional
basic income is estimated by multiplying the level of basic income with the number of
beneficiaries and the cost of the social protection system is estimated as prescribed in the
proposal. The basic income proposals covered a range between two extremes, basic income
as a substitute and basic income as a complement to the social protection system. The costs
vary greatly in magnitude depending on the characteristics of each proposal. Proposals
leaning towards the first extreme are naturally more financially feasible due to lower costs
and the opposite is applicable to the second extreme. I suggest a proposal that is financially
feasible as well as socially desirable with respect to beneficiaries of social benefits. The
financing of this proposal was assessed by determining the costs of social benefits that
would be made redundant by implementing basic income. I applied a criterion in which
basic income entirely replaces social benefits that are on average lower than basic income
and partially when higher than the level of basic income. The cost savings on the
replacement of social benefits are determined to be considerable in size and largely
contribute to financing basic income. The financing of the remaining cost of basic income
after accounting for the cost savings is beyond this paper. According to proponents, it is
technically feasible to finance the remaining cost gap with tax reforms. However, besides
improving the techniques to assess the financial feasibility of basic income there are other
concerns that have to be addressed in the context of Belgium, such as political feasibility,
sustainability, distributional effects and behavioral effects which follow from basic income
and the suggested tax reforms. These are the next steps that have to be taken before we can
contemplate implementing basic income in Belgium.
3 | P a g e
Executive summary
The proposal that unconditionally grants every citizen an equal fixed monthly income,
known as basic income, has recently received much attention in the media. In Europe, a
growing number of individuals, academics, policymakers, and interest groups have shown
interest in the proposal thanks to the solutions it has to offer in order to overcome a
number of obstacles. With respect to the high unemployment rates, basic income provides
the unemployed a wider scope of opportunities by granting them income security, enabling
individuals to look for a job they desire. Basic income is said to also stimulate
entrepreneurship. Furthermore, the disincentives to work implied by the conditionality of
unemployment benefits are eliminated as basic income is granted regardless of income.
Last but not least, basic income is said to also emancipate the poor and ensures “real
freedom for all” (Van Parijs, 1995). (Groot, 2004, p. 17-21; Soininvaara, 200, p. 7-8)
The contributions to the literature have been steadily increasing, covering a wide range of
topics varying from, but not limited to the social desirability, the political feasibility, and
the financial feasibility of basic income. In Belgium, there has also been a growing interest
in the radical proposal by academics and politicians alike. The contributions, however, are
limited to only a small number of topics and the financial feasibility of basic income is
unfortunately not one of them. Proponents of basic income have only provided rough
calculations of how to finance basic income with a lack of transparency on the
methodologies of how the calculations were obtained. I, therefore, took up the challenge to
provide a preliminary assessment of the financial feasibility of basic income by providing
an answer to the following two research questions in the context of Belgium, given a
dataset of the year 2010: ‘How much would a scheme of basic income cost?’ and ‘How much
are the cost savings that are realized by basic income replacing social benefits?’
4 | P a g e
Cost of basic income
Aside from the three main features of every basic income, unconditionality, individuality,
and without means test or work requirement, basic income schemes come in all shapes and
sizes, and as a consequence, so do their costs (Peña-Miguel, De la Peña Esteban, &
Fernandez-Sainz, 2014, p. 96). To acknowledge the variety of basic income proposals, five
basic income proposals are discussed that can be placed between two extremes, the ‘basic-
income-to-substitute-everything’ scheme, a low-cost benchmark, and the ‘basic-income-
purely-as-a-complement’ scheme, a high-cost benchmark (Melzochová & Špecián, 2015 p.
555-556).
The first basic income proposal to be considered is of the extreme ‘basic-income-to-
substitute-everything’ and is determined to be the most financially feasible due to the
substantial cost savings implied by the complete abolishment of the social protection
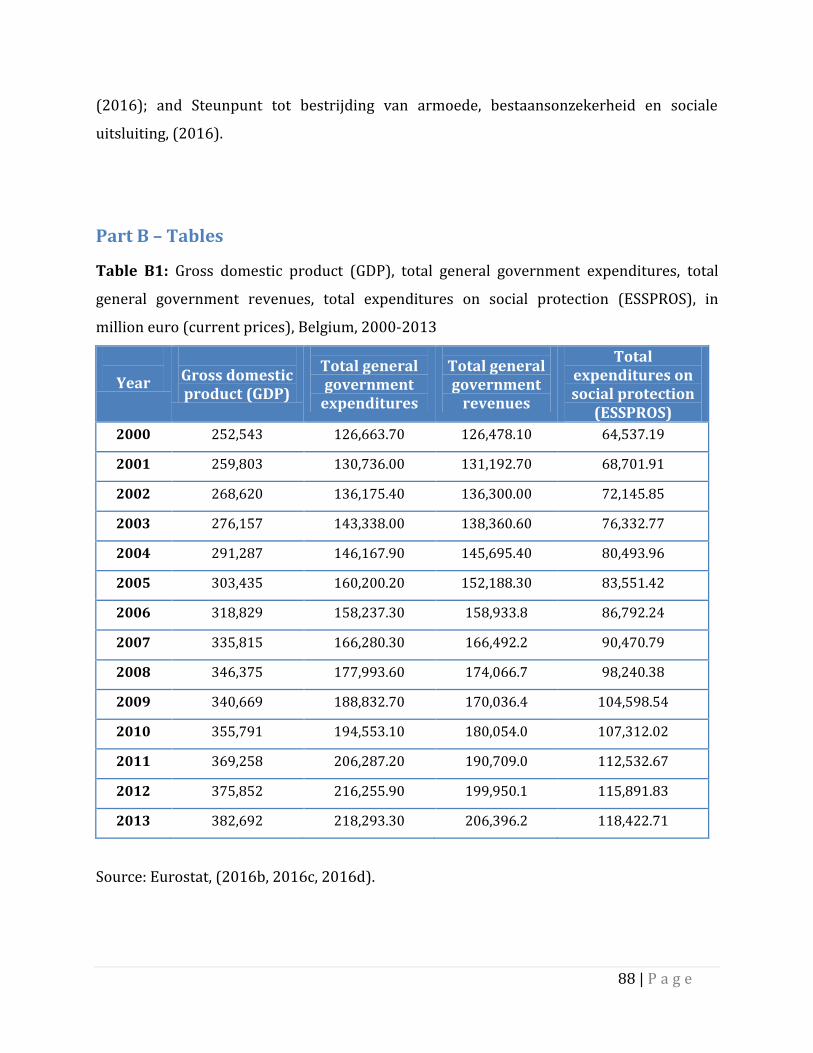
system. Given a breakeven of the costs of basic income and the current expenditures of the
social protection system of €95 billion in 2010, Belgium can afford to grant every adult
citizen a basic income of €911 per month. However, while the extreme proposal is
financially feasible, a number of vulnerable social groups would be worse off under the
scheme of basic income as the level of certain social benefits are higher than the basic
income level, making the proposal socially undesirable. Accounting for social desirability,
the following three discussed basic income proposals partially maintained the social
protection system and the last proposal, which is by the authors Raventos et al., can be
considered to lean closely to the second extreme, ‘basic-income-purely-as-a-complement’.
Raventos et al. namely set the level of basic income so that it is “topped up to an equal
quantity when the public cash benefit is of a greater amount” (Arcarons, Raventos Pañella
& Torrens Mèlich, 2014, p. 82) for current beneficiaries of social benefits. However, given
the great complement to the social protection system, the scheme has considerable costs
and is considered to be less financially feasible. A trade-off is thus identified between
financial feasibility and social desirability: basic income schemes that incorporate the
ethical principles of the social protection system by granting the socially vulnerable groups
a higher level of basic income, is socially desirable, but leads to higher costs. To enhance
the financial feasibility of the proposal by Raventos et al., I modified the proposal and
5 | P a g e
adjusted the level of basic income downwards. This modified proposal grants every adult
€600 per month and every minor €150 per month while ensuring that recipients of social
benefits are at least as well off under the scheme of basic income compared to the current
social protection system. This modified proposal is estimated to cost Belgium €114 billion,
including the cost of health care and the retained social benefits, with a ceteris paribus
assumption for the year 2010. Placing this number in perspective, the total cost is 120% of
what we spent on the social protections system in 2010. The next research question to be
addressed is how to finance this enormous cost. (B.U.B., 2016; FOD Sociale Zekerheid,
2011; Melzochová & Špecián, 2015 p. 555-556)
Financing basic income
There are two main methods through which basic income may be financed, cost savings
and extra government revenues generated through tax reforms. This paper focuses on the
former method, assessing the cost savings that are realized by the replacement of social
benefits by basic income for the modified basic income proposal by Raventos et al. In order
to determine which social benefits are entirely or partially replaced by basic income, I
made a comparison between the average level of social benefits to the level of basic income
while applying the criterion by Raventos et al. that prescribes to entirely replace social
benefits of a lower level by basic income and to partially replace social benefits of a higher
level, up to the level of basic income. So that beneficiaries of social benefits do not receive
the level of basic income on top of what they currently receive. The cost savings that are
realized are concluded to be significant in size. Concerning the modified basic income
proposal by Raventos et al., the cost savings of the proposal is €79 billion, the summation
of the initial total expenditures of all social benefits and health care. The remaining cost gap
of €36 billion can technically be financed through tax reforms suggested by Belgian basic
income proponents. However, the calculations of these tax reforms have to be improved in
quality, applying a transparent and reliable methodology by using micro-simulation models
that allow integrating the behavioral effects as well as the distributional effects of basic
income and the implemented tax reforms. Only then will the picture on the financial
feasibility of basic income truly be complete. (Arcarons et al., 2014)
2.Basic income ...................................................................................................................................... 16
2.1 Defining basic income .......................................................................................................................... 16
2.2 Basic income in Europe ....................................................................................................................... 19
2.2.1 The two obstacles .......................................................................................................................... 19
2.2.2 Overcoming the obstacles .......................................................................................................... 22
2.2.3 The administrative efficiency argument............................................................................... 23
2.3 Basic income in Belgium ..................................................................................................................... 24
3.Financial feasibility of basic income ......................................................................................... 27
3.1 An introductory assessment of the costs of basic income ..................................................... 27
3.2 Review of the literature ....................................................................................................................... 31
3.3 Preliminary themes to consider ....................................................................................................... 33
3.3.1 Social protection in Belgium ..................................................................................................... 33
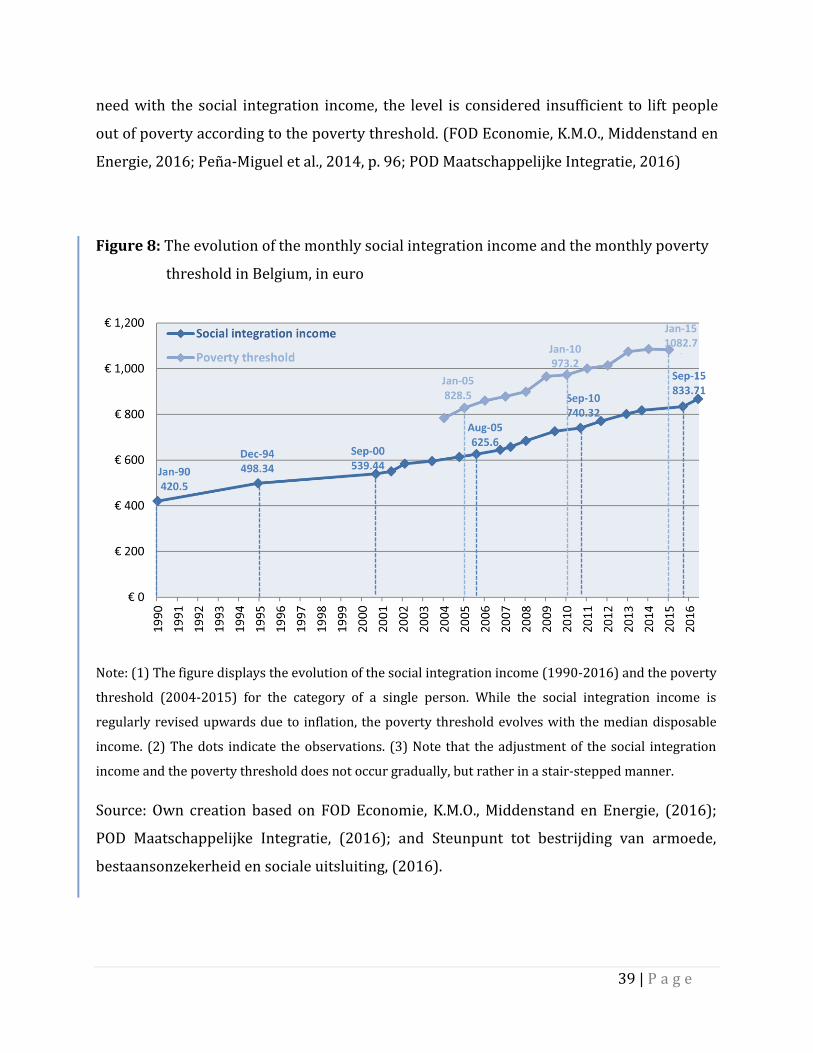
3.3.2 The social integration income and the poverty threshold ............................................ 39
3.3.3 The demographics of Belgium .................................................................................................. 41
3.4 Basic income proposals ....................................................................................................................... 42
3.4.1 The B.U.B. proposal ....................................................................................................................... 44
3.4.2 The Vivant proposal ..................................................................................................................... 48
3.4.3 The proposal by Defeyt ............................................................................................................... 52
3.4.4 The proposal by Raventos et al. ............................................................................................... 55
3.4.5 A modification of the proposal by Raventos et al. ............................................................ 59
3.4.6 An overview of the considered basic income proposals ................................................ 61
Part A - Figures ............................................................................................................................................... 91
Part B – Tables ................................................................................................................................................ 92
Part C - The key figures on social protection expenditures .......................................................... 95
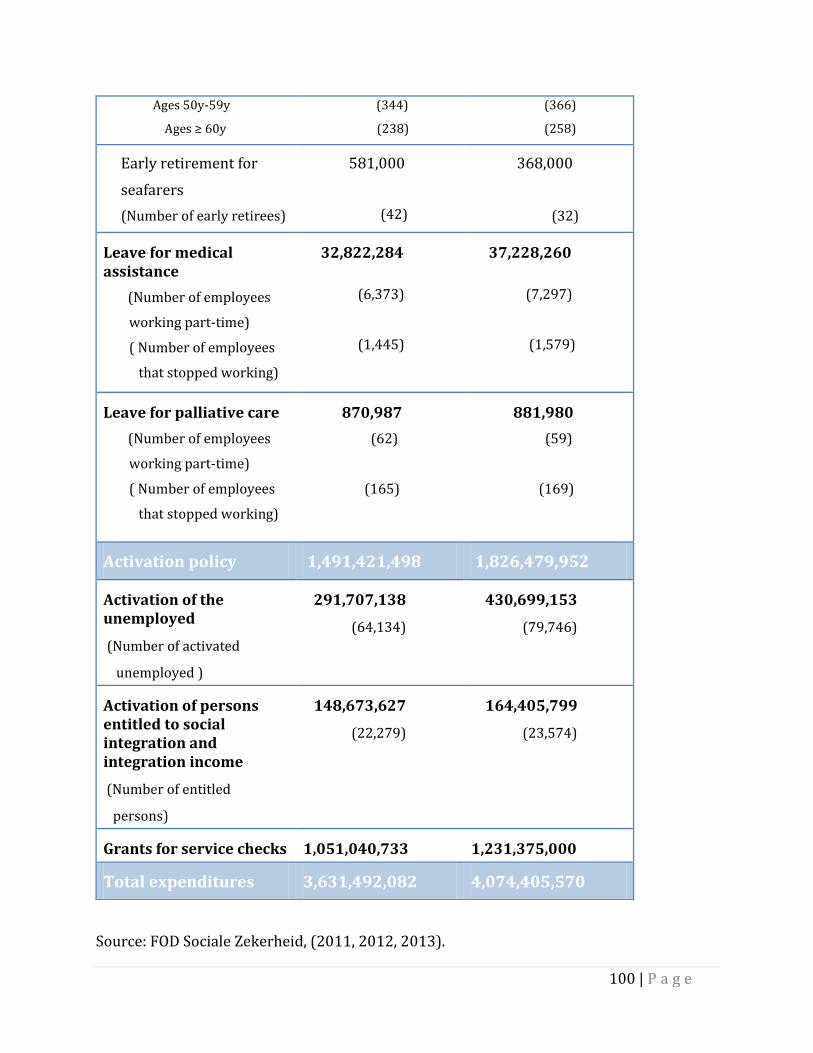
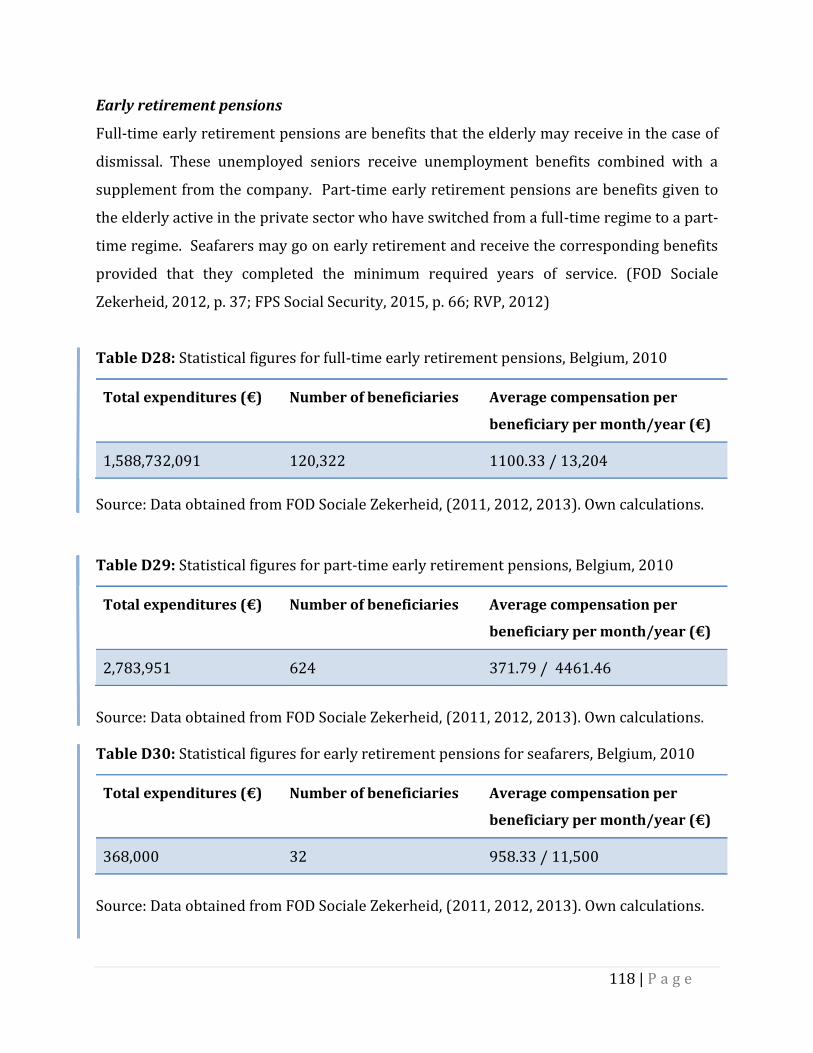
Part D – Statistical figures of social benefits ..................................................................................... 106
Part E – Cost estimations of the basic income proposals............................................................. 126
Figure 5: A Belgian subdivision of the Belgian social protection system ......................................
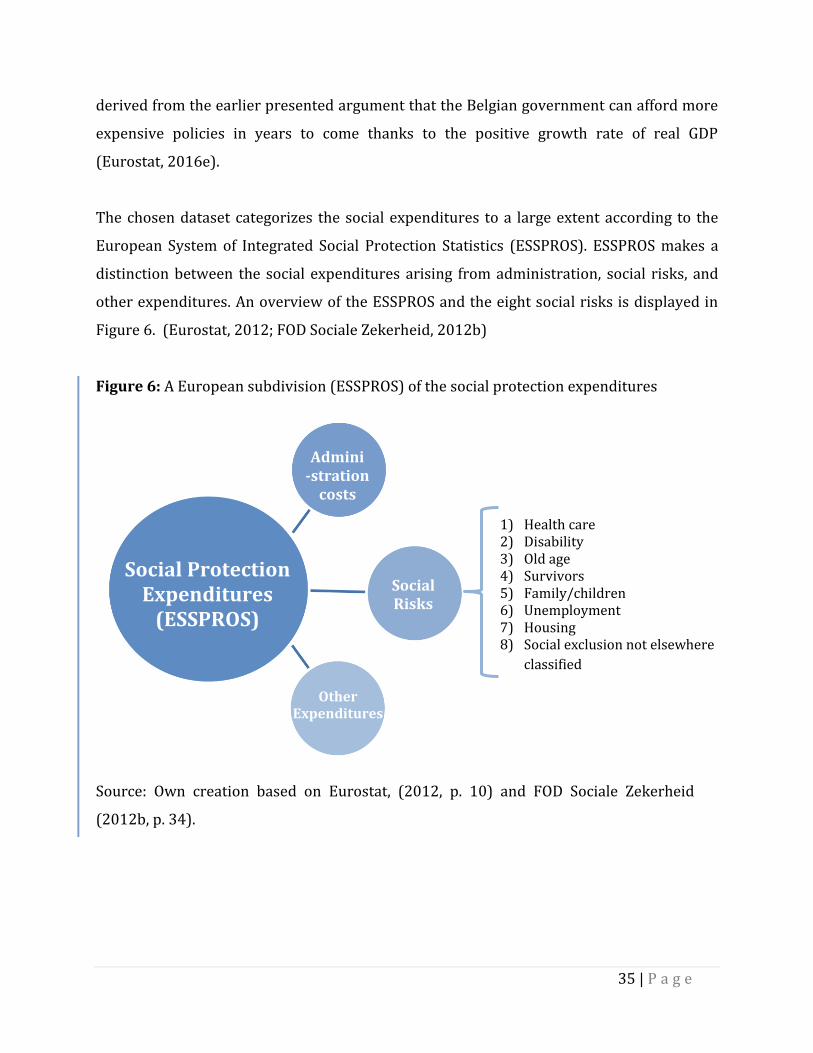
Figure 6: A European subdivision (ESSPROS) of the social protection expenditures ..............
Figure 7: Social protection expenditures, in percentages (%), Belgium, 2010 ...........................
Figure 8: The evolution of the monthly social integration income and the monthly
poverty threshold in Belgium, in euro ......................................................................................................
Figure 9: Basic income proposals placed between two extremes ....................................................
Figure 10: Total yearly cost of the considered basic income proposals, including social
benefits and health care if applicable, in million euro, Belgium, 2010 ..........................................
Figure 11: Total yearly cost of the modified basic income proposal by Raventos et al., in
million euro, Belgium, 2010 ............................................................................................................................
Figure 12: Comparison of the cost savings and the grand total cost of the basic income
proposal by Raventos et al., in million euro, Belgium, 2010 ..............................................................
Figure 13: The Laffer curve .............................................................................................................................
Appendix: Part A - Figures………………………………………………………………………………………….
Figure A1: Slope of the linear functions: total expenditures on social protection and the
cost of the basic income based on the social integration income, in million euro, Belgium,
Table E2: Regular recurring social benefits, taking time off work, comparison on a yearly
basis, in euro, Belgium, 2010 ..........................................................................................................................
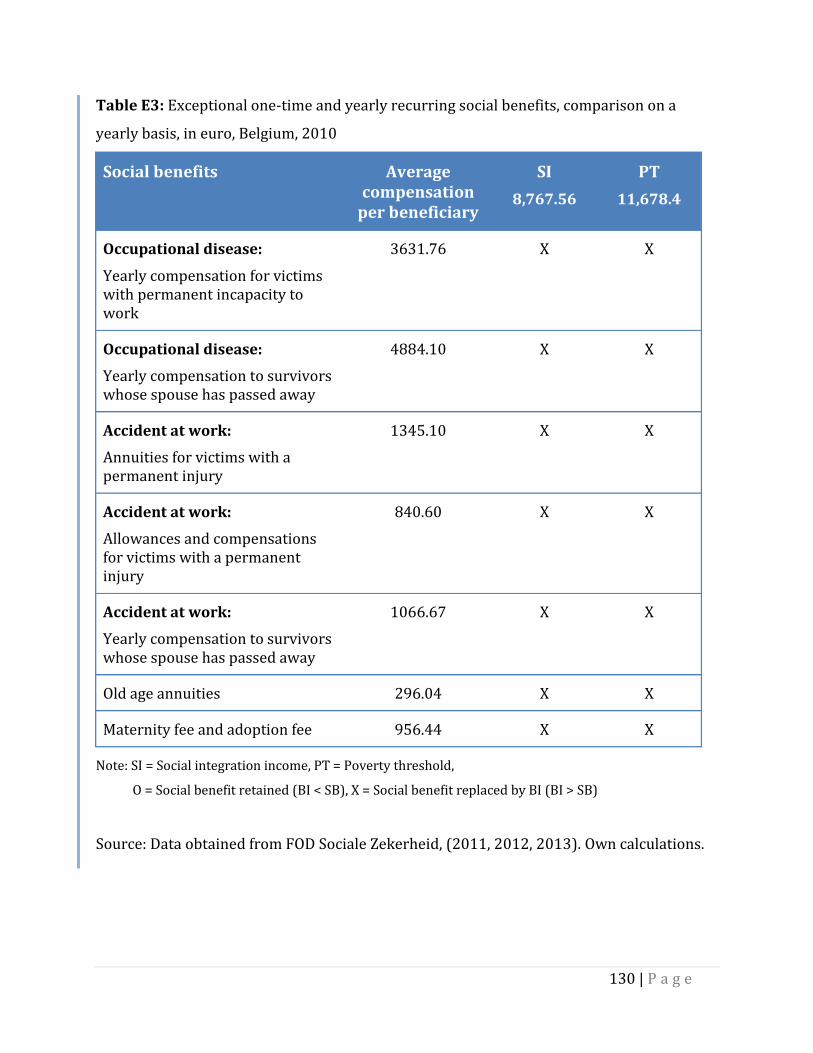
Table E3: Exceptional one-time and yearly recurring social benefits, comparison on a
yearly basis, in euro, Belgium, 2010 ............................................................................................................
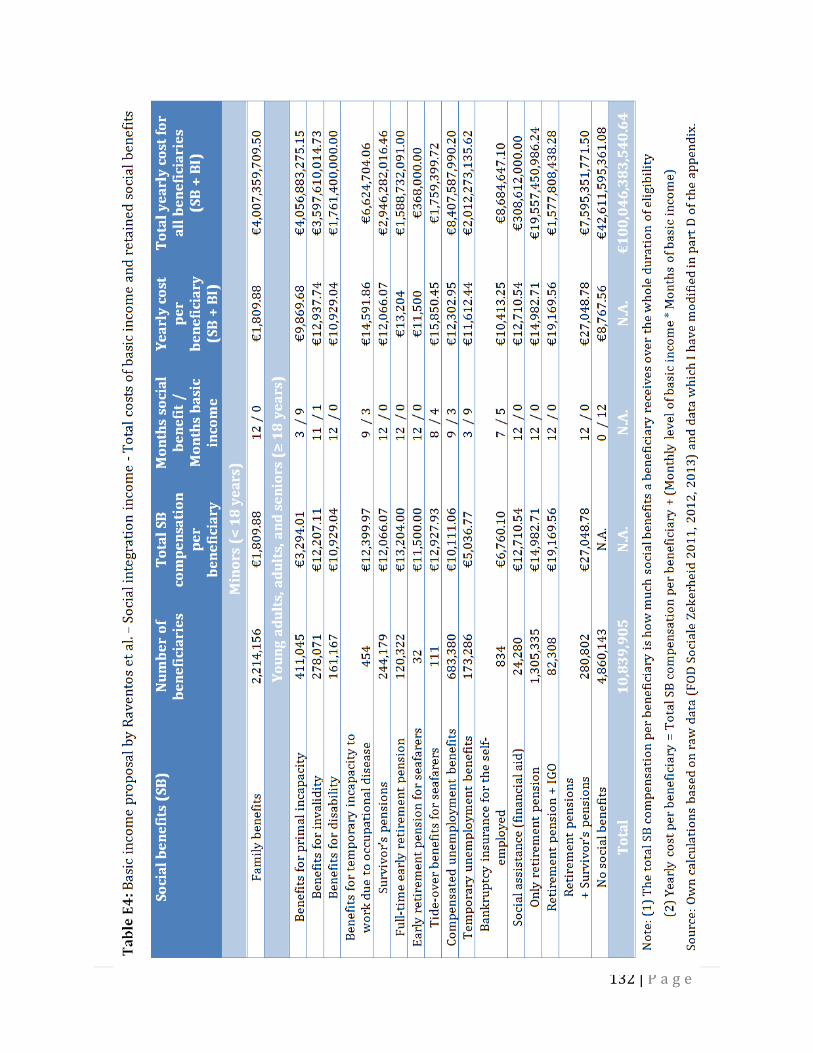
Table E4: Basic income proposal by Raventos et al. – Social integration income – Total
costs of basic income and retained social benefits.................................................................................
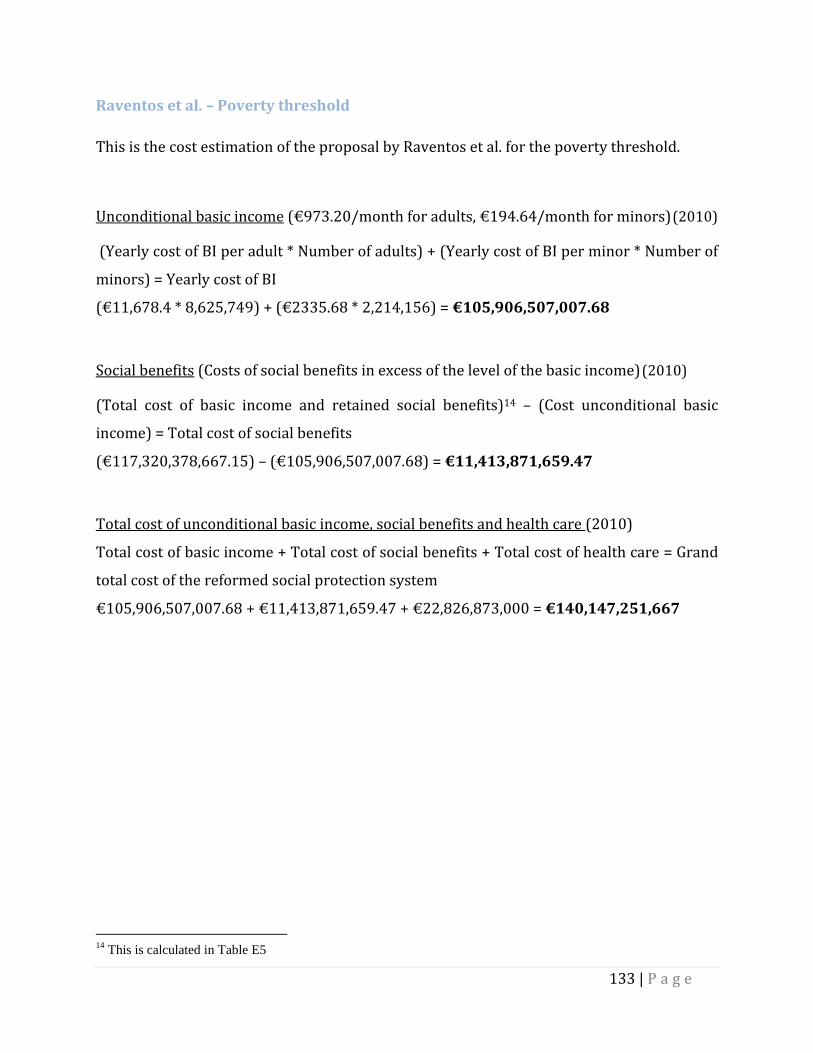
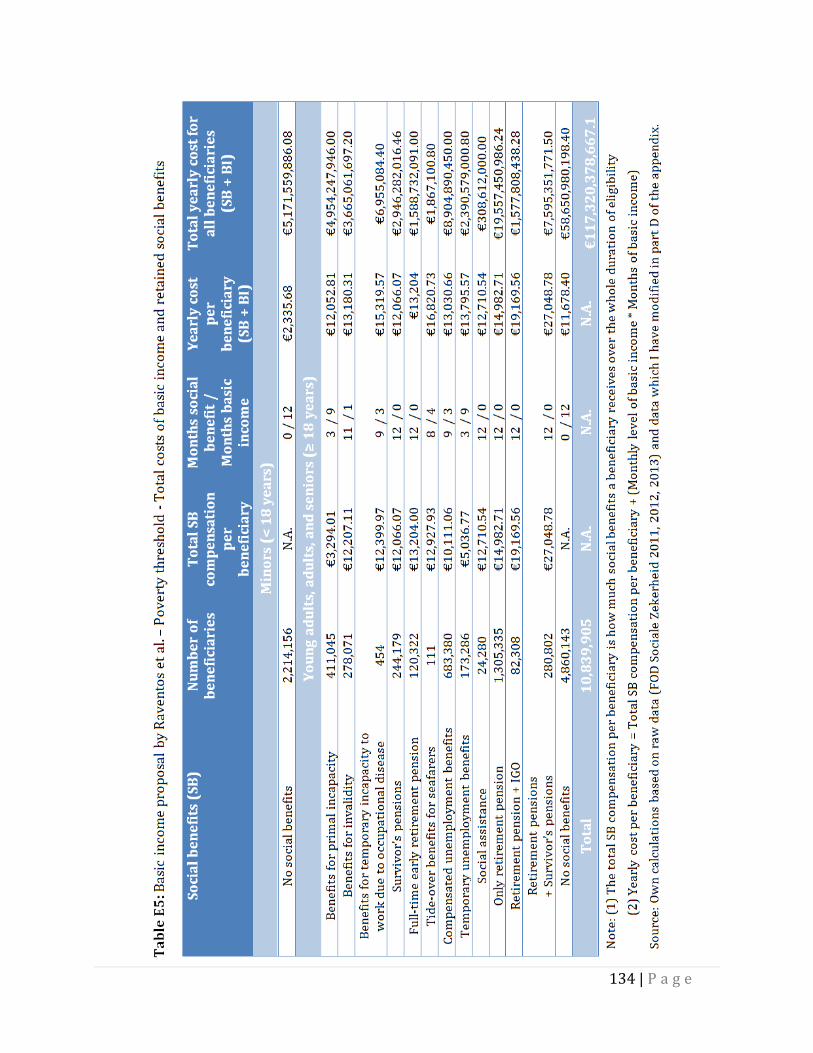
Table E5: Basic income proposal by Raventos et al. – Poverty threshold – Total costs of
basic income and retained social benefits .................................................................................................
Table E6: A modification of the proposal by Raventos et al. - Total costs of basic income
and retained social benefits ............................................................................................................................
Table E7: List of references, categorized by the type of data .............................................................
13 | P a g e
1. Introduction
The idea of unconditionally granting a benefit to every citizen (or resident) at a regular
interval, a basic income, can be traced back as early as 1797 to the plan of the agrarian
radical, Thomas Spence, in The Rights of Infants. Spence propagated “the ownership of
natural resources, such as land, by local parish communities, who would then proceed to
lease these resources to the highest bidder. [The obtained revenues would contribute to
the financing of] public goods, the national government, and the residual income would be
distributed equally between all members of the parish at quarterly intervals” (Cunliffe &
Erreygers, 2004, p.81), clearly indicating a scheme of basic income. (Cunliffe & Erreygers,
2004, p. 81; Melzochová & Špecián, 2015, p. 550)
The concept of basic income is thus far from being a novel idea in contemporary society. As
a matter of fact, proposals of basic income have kept reappearing throughout the past two
centuries and notably; according to Cunliffe & Erreygers (2004, p. xiii) this has occurred
independently. The appealing characteristics of basic income have again led basic income
to resurface as strong as ever in the twenty-first century. This can be witnessed from the
promising upcoming experiments concerning basic income, such as in Finland, the recently
rejected but meaningful referendum of Switzerland, and the numerous discussions
surrounding basic income by academics, policymakers, and interest groups all over the
world (Agence France-Presse, 2016; Cunliffe & Erreygers, 2004, p. xiii; Soininvaara, 2000;
Laterza, 2015, p. 7).
However, the appealing concept of basic income nevertheless warrants a comprehensive
analysis: basic income remains as radical as it was back in 1797. Namely, the
unconditionality aspect of basic income is grandly opposed to conventional minimum
income schemes which are conditional of nature. This causes basic income to be considered
as “a threat to the primacy of paid work, as the central source of legitimate security”
(Soininvaara, 2000, p. 7). (Cunliffe & Erreygers, 2004, p. 81; Solow, 2000, p. ix)
14 | P a g e
A first traditional approach towards analyzing basic income, according to Solow (2000, p.
ix-x), would be to address the question of the feasibility of basic income on the one hand,
and that of the desirability of basic income and its consequences on the other. Although
both questions are vital in assessing the potential of basic income as a reformation of the
existing social protection system, the focus of this paper will lie on the former aspect: the
financial feasibility of basic income.
Specifically, this paper wishes to contribute to the debate of financial feasibility, by
providing answers to the following two research questions in the context of Belgium: ‘How
much would a scheme of basic income cost?’ and ‘How much are the cost savings that are
realized by basic income replacing social benefits?’
The first research question is a natural starting point when assessing the financial
feasibility of basic income. Basic income proposals come in all shapes and sizes, and
consequently so do the costs of basic income. For this reason, static cost estimations will
be provided for a range of basic income proposals for Belgium. Additionally, the current
social protection system will be analyzed and its costs will be compared to those of the
various basic income schemes in order to have a better perspective of the magnitude of the
costs. (Melzochová & Špecián, 2015, p.554-556)
The second research question contributes directly to the financial feasibility of basic
income. Basic income is namely financed by two methods. On the one hand, the cost savings
realized by basic income replacing social benefits reduces the total costs of basic income.
On the other hand, the remaining costs of basic income are principally financed by a tax
reform. (Monnier & Vercellone, 2014, p. 71-73)
The cost savings are dependent on the specific basic income scheme, but generally,
proponents at least advocate for a partial replacement of social benefits due to the
implausibility of simultaneously sustaining the costs of the social protection system and a
scheme of basic income. In order to concretely assess the cost savings, a criterion is
required to distinguish social benefits that are retained and social benefits that are
15 | P a g e
dissolved with the introduction of basic income. The criterion prescribed by Raventos et al.,
which instructs to completely replace social benefits of a lower level than basic income and
to partially replace social benefits of a higher level than basic income, will be applied for a
specific basic income scheme (Arcarons, Raventos Pañella & Torrens Mèlich, 2014, p. 82).
After accounting for cost savings, the next step is to finance the remaining cost gap. The
most conventional method is to generate extra revenue by tax reforms. A number of tax
reforms suggested by Belgian proponents of basic income will be presented. A formal
analysis of these tax reforms is beyond the scope of this paper; however, this is a step that
needs to be taken in order to complete the picture on financing basic income.
In order to provide an answer to these research questions, the paper is largely composed of
two chapters.
The first chapter allows an understanding of basic income by providing a definition of basic
income as well as by emphasizing its particularities by comparing basic income to
conventional minimum income schemes. Furthermore, the most relevant arguments for
basic income in Europe are discussed before situating the basic income debate in the
context of the political and academic sphere of Belgium.
The second chapter focuses on the financial feasibility of basic income. First, a literature
review will be presented and a number of preliminary themes will be covered, building
towards the cost estimations for a range of basic income proposals for Belgium.
Subsequently, the financing of the cost of basic income will be analyzed. The two research
questions will be addressed and an answer will be formulated in this chapter.
16 | P a g e
2. Basic income
2.1 Defining basic income
Hereby, I introduce two accessible definitions of basic income which jointly reflect the
cornerstone of every basic income proposal.
The first definition of basic income put forward by the Basic Income Earth Network (n.d. a)
draws special attention to three features which distinguish basic income from conventional
minimum income guarantees (Peña-Miguel, De la Peña Esteban, & Fernandez-Sainz, 2014,
p.96):
1.) Unconditionality; “basic income is to be considered a fundamental right”
(Melzochová & Špecián, 2015, p.551) regardless of a person’s background.
2.) Individuality; basic income is granted to every individual citizen (or resident)
irrespective of their household situation. (Melzochová & Špecián, 2015, p.551)
3.) Without means test or work requirement; further emphasizes that unconditionality
also implies that basic income is unconditional on any (work) requirement or
income level.
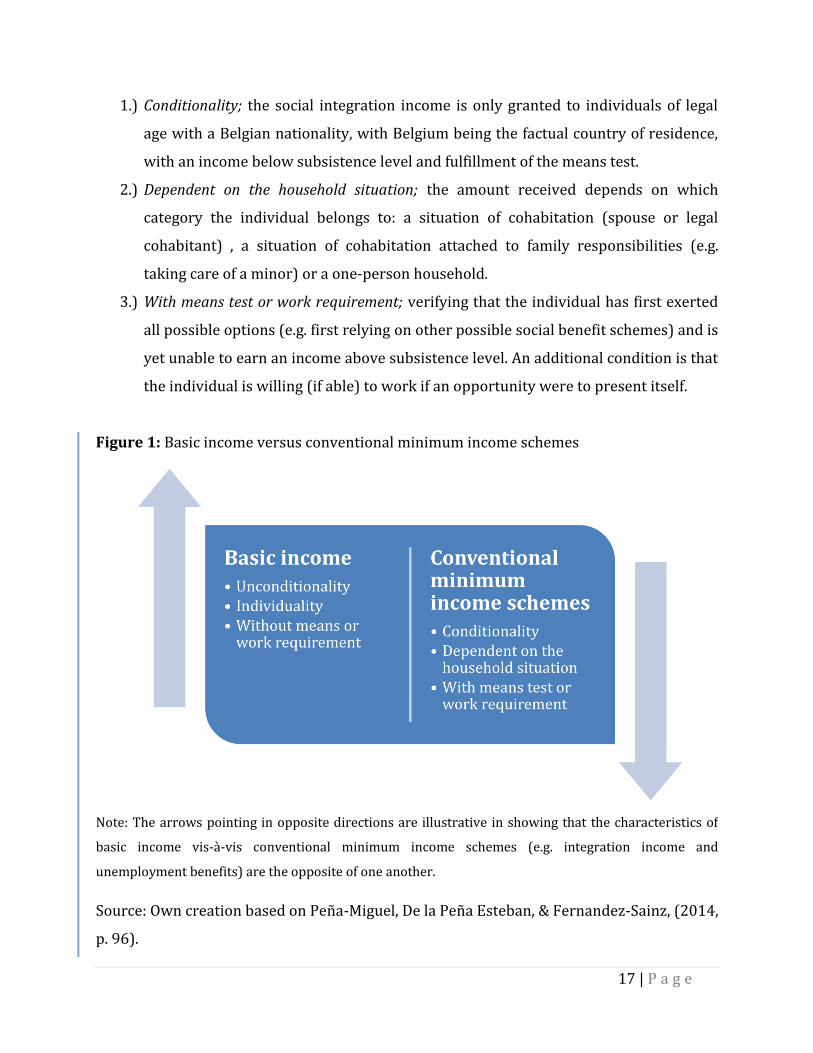
In comparison to conventional minimum income schemes which are conditional of nature,
these three features are exactly the opposite (Frazer & Marlier, 2009, p. 8; Peña-Miguel et
al., 2014, p. 96). A schematic overview is given in Figure 1. To illustrate; the requirements
of receiving a social integration income, a benefit received by individuals enabling them to
meet an income of subsistence level, clearly adheres to the following three opposite
characteristics in Belgium (Vlaanderen, n.d. a):
“A basic income is an income unconditionally granted to all on an individual basis, without
means test or work requirement” (BIEN, n.d. a).
“A universal basic income [is] an income paid by a government, at a uniform level and at
regular intervals, to each adult member of society” (Van Parijs, 2001, p.5).
17 | P a g e
1.) Conditionality; the social integration income is only granted to individuals of legal
age with a Belgian nationality, with Belgium being the factual country of residence,
with an income below subsistence level and fulfillment of the means test.
2.) Dependent on the household situation; the amount received depends on which
category the individual belongs to: a situation of cohabitation (spouse or legal
cohabitant) , a situation of cohabitation attached to family responsibilities (e.g.
taking care of a minor) or a one-person household.
3.) With means test or work requirement; verifying that the individual has first exerted
all possible options (e.g. first relying on other possible social benefit schemes) and is
yet unable to earn an income above subsistence level. An additional condition is that
the individual is willing (if able) to work if an opportunity were to present itself.
Figure 1: Basic income versus conventional minimum income schemes
Note: The arrows pointing in opposite directions are illustrative in showing that the characteristics of
basic income vis-à-vis conventional minimum income schemes (e.g. integration income and
unemployment benefits) are the opposite of one another.
Source: Own creation based on Peña-Miguel, De la Peña Esteban, & Fernandez-Sainz, (2014,
p. 96).
18 | P a g e
The specifications of each basic income proposal, however, (e.g. the exact level of the basic
income, the precise target audience of basic income, whether basic income is
supplementary to the social protection system…) may differ across diverse basic income
proposals. The diversity of these particularities will be illustrated by a range of basic
income proposals, which are discussed in chapter 3 of the paper. (Melzochová & Špecián,
2015, p. 554-555)
The following section first elaborates on the arguments for basic income on European soil
and proceeds by zooming in on the basic income debate in Belgium.
2.2 Basic income in Europe
The current topical reappearance of basic income in Europe, according to Soininvaara
(2000, p. 7-8), is thanks to the solutions offered by basic income in order to overcome two
obstacles faced by the present European welfare systems.
2.2.1 The two obstacles
The first obstacle is the trend of growing structural unemployment with the unskilled
struggling to obtain a job due to a mismatch between labor demand and supply
(Soininvaara, 2000, p.8) (C.W., 2014). This trend has already been occurring in advanced
economies for a number of decades and is expected to continue growing in the future due
to the threat that evolving technology poses for low-skilled jobs (C.W., 2014; Rotman,
2013). The long-term unemployment rates in Figure 2 suggest that especially Europe (EU-
28) seems to be greatly affected, with the EU-28 average being consistently higher than the
OECD average, which in turn is consistently higher than the rates of the United States for
the time span of 2000 to 2015 (OECD, 2016a). Belgium is no exception and seems to suffer
from long-term unemployment rates even higher than the EU-28 average (OECD, 2016a).
High long-term unemployment rates are problematic for various reasons. Besides being an
indicator of inefficient operating labor markets, long-term unemployed individuals are
19 | P a g e
shown “to have poorer health than average [due to mental and material stress] and [these
high rates] squeeze the social security budgets” (C.W., 2014). (OECD, 2016a)
Additional to having a greater percentage of long-term unemployed, Europe bears high
unemployment rates relative to the rest of the OECD and the United States. This is shown in
Figure 3. Note that although the current trend of the European Union is strongly influenced
by the extremely high unemployment rates of Greece and Spain, with respective
unemployment rates being 24.9% and 22.06% in 2015, all countries belonging to the
European Union are in all cases, except for two member states being Germany and the
Figure 2: Long-term unemployment rate, total % of unemployed, 2000 – 2015
Note: “The long-term unemployment rate refers to the proportion of people who have been
unemployed for 12 months or more among all unemployed” (OECD, 2016a).While the indicator itself
is relevant, it may also be considered as a proxy for structural unemployment as there is a tendency
of long-term unemployment turning into structural unemployment (C.W., 2014).
Source: OECD, (2016a).
20 | P a g e
Czech Republic, higher than those of the United States in 2015 (figure not shown). For the
specific case of Belgium, the unemployment rates have been fluctuating around 8% for the
past decade, with a percentage of 8.48 in 2015. (OECD, 2016b)
High levels of unemployment translate to low incomes on the unemployed which in turn
leads to an increased level of government spending on social benefits and decreased tax
revenues (Eurostat, 2016a). The unemployment rates and its effect on the government
revenues, the main source of funding basic income, through personal income taxes form an
important aspect of financing basic income. Although this aspect is beyond the paper, an
assessment thereof is recommended for further research.
Figure 3: Unemployment rate, total % of labor force, 2000 - 2015
Note: “The unemployment rate is the number of unemployed people as a percentage of the labor
force. The labor force consists of the unemployed plus those in paid or self-employment” (OECD,
2016b).
Source: OECD, (2016b).
21 | P a g e
The second obstacle lies in the incompatibility between incentives to enter the labor
market and conditions attached to unemployment benefits (Soininvaara, 2000, p. 8). “The
social income transfers in the European systems [are namely] diminishing as earned
income rises” (Soininvaara, 2000, p.8) with the typical dis-incentivizing outcome of
individuals losing these benefits completely when joining the workforce. In the Belgian
labor market, individuals who are unwillingly unemployed and fulfill the minimum amount
of days of paid employment have the right to request an unemployment benefit (RVA,
2015; Vlaanderen, n.d. b). The level of the unemployment benefit received is again of
conditional nature as it depends on the individual’s household situation, the individual’s
most recent paycheck, their employment history and the duration of unemployment due to
the benefits being of digressive nature (RVA, 2016). In this case, the mismatch is reflected
by receiving a lower level of unemployment benefits if the individual belongs to a
household in which their partner has income and the complete loss of unemployment
benefits when obtaining a job (RVA, 2016).
2.2.2 Overcoming the obstacles
Basic income provides a solution in order to overcome both these obstacles and is the
reason why basic income has received much attention in Europe (Soininvaara, 2000, p. 7-
9).
First, basic income alleviates the problem of high unemployment rates not by decreasing
these rates but rather by offering the unemployed a wider scope of opportunities. Van
Parijs (2004, p. 17-21), a well-known Belgian proponent of basic income, argues that basic
income enables individuals to comfortably look for a desirable job corresponding to their
capabilities and preferences, perhaps, more importantly, it also stimulates
entrepreneurship due to lower failure anxiety, encourages individuals to engage in training
and sharpen their existing skillset, facilitating the possibility to “take a break between two
jobs and reducing working time” (Van Parijs, 2004, p.19). This reduction in working time,
in turn, will allow individuals to dedicate themselves to academic research, volunteer work,
domestic work and charity. Furthermore, proponents argue that basic income empowers
22 | P a g e
the position of employees in negotiations leading to improved working conditions.
(Melzochová & Špeciána, 2015, p. 551-552)
Second, basic income is expected to eliminate the disincentives to work as unlike with
unemployment benefits, individuals do not lose this guaranteed income when deciding to
join the workforce. Basic income detaches the relationship between the amount of support
and the earned income. (Soininvaara, 2000, p. 8)
2.2.3 The administrative efficiency argument
Next to these policy-oriented arguments for basic income, the argument of basic income
emancipating the poor, and the classic ethical argument by Van Parijs (1995) of basic
income ensuring “real freedom for all”, there is another argument which is of particular
interest when considering the financial feasibility of basic income: the efficiency
implications brought forward by the characteristics of basic income. (Melzochová &
Špeciána, 2015, p. 551; Soininvaara, 2000, p. 8)
As basic income is unconditional without a means-test or work requirement, proponents
argue that basic income economizes on administration costs compared to other income
support schemes: there is no longer a need to verify whether an individual is eligible for
income support or not and there is no urge of cheating under the scheme of basic income. It
goes without saying that the more complex the initial social protection system set in place
is, the more savings that accumulate on administration costs when substituting the former
system by a simplified and more transparent scheme of basic income. This is a significant
argument in the European context considering how the social safety net in advanced
economies, such as in Western Europe and the Scandinavian countries, has grown into a
complex construct. However, while basic income may be more administratively efficient in
comparison to conditional income support schemes, the extent of its efficiency should be
still put under scrutiny. (De Wispelaere & Stirton, 2011, p. 115-116, p. 125-126;
Melzochová & Špeciána, 2015, p. 551)
23 | P a g e
Overall, the two aforementioned obstacles and the complexity of the social safety net faced
by Europe are also concerns shared by Belgium: Belgium had an unemployment rate of
8.48% in 2015 and 51.7% of those individuals were unemployed for longer than twelve
months (OECD, 2016a; OECD, 2016b). Furthermore, Belgium is known to have a very
elaborate social security net (Belgium, n.d. a). This makes Belgium ripe for considering
basic income. The next section focuses on the academic and political attention that basic
income has received in Belgium.
2.3 Basic income in Belgium
In Belgium, the topic of basic income first emerged in academic and intellectual circles,
before receiving attention in the field of politics. (Vanderborght, 2000, p. 277)
Among the Belgian scholars who have delved into basic income, Philippe Van Parijs stands
out the most, being a firm proponent of basic income and one of the founders of Basic
Income Earth Network (BIEN, n.d. b). Van Parijs (1995) is especially known for his book
“Real Freedom For All”, in which he argues that capitalism has introduced inequalities in
our society which he deems as unacceptable. To fight against these inequalities, Van Parijs
places freedom on a pedestal and specifically advocates for “real-libertarianism, or real-
freedom-for-all”, which is different from formal freedom as he describes “real freedom not
only [being] a matter of having the right to do what one might want to do, but also a matter
of having the means for doing it” (Van Parijs, 1995, p.4). Van Parijs further argues that the
regime which best incorporates this type of freedom is “the highest sustainable
unconditional income”(Van Parijs, 1995, p.30), with the level of basic income set
sufficiently high to guarantee the means to put an end to the inequalities imposed by
capitalism and ensure real freedom.
In politics, there is a division of proponents versus opponents of basic income not only
between political parties and labor unions but also between individuals within a single
party or union. (Evenepoel, 2016)
24 | P a g e
First, regarding the political parties, there are currently only two Belgian small-scale
political parties of which the members have collectively agreed to explicitly take up basic
income in their program: Piratenpartij and B.U.B. (Belgische Unie – Union Belge) (B.U.B.,
2016; Piratenpartij, 2014). Other parties who have supported basic income in the past are
Vivant and two green parties, ECOLO and AGALEV (Vanderborght, 2000). Furthermore, a
number of individuals belonging to the well-known parties, Open VLD and sp.a, have shown
interest in the radical proposal, although their personal interest does not necessarily
correspond to their affiliation (Cornillie & Kherbache, 2016; “Open VLD: Basisinkomen”
2015).
Piratenpartij (2014, p. 19, own translation) contended through their program of 2014 that
“labor should be more than just a mean to obtain income, and should instead primarily
contribute to the self-realization of individuals”. Piratenpartij pleads for basic income as
the long-term solution towards achieving that goal. “As a first step, the party implores an
assessment of the feasibility of implementing and financing basic income on European and
Belgian soil while accounting for the administrative efficiency brought upon by
bureaucratic simplification” (Piratenpartij, 2014, p. 19, own translation).
The party urging for a unified Belgium, B.U.B. (2016, p.10), is a supporter of basic income in
order to guarantee an equal treatment of all Belgians. They propose a scheme of basic
income at a subsistence level of €800 per month, which is to be implemented as a complete
substitute for existing social benefits. Similar to Piratenpartij, B.U.B. emphasizes the
administrative efficiency argument as a method of partially financing basic income, which
is maximized by abolishing the current social protection system. The basic income proposal
by B.U.B. is one of the proposals of which I will assess the costs.
“The green parties ECOLO and AGALEV supported basic income since the mid-1980s.
Compared to ECOLO who considered basic income as a medium-term objective more
belonging to the theoretical horizon than a policy proposal, the support by AGALEV was
more outspoken as it was promoted as a short-term reform” (Vanderborght, 2000, p.276).
The parties’ resolute support, however, is a remnant of the past. Groen left the name of its
25 | P a g e
predecessor AGALEV behind with the idea of basic income in 2003 (Groen, n.d.; Llc, 2003).
In comparison with AGALEV’s commitment to basic income, today Groen (n.d.) merely
labels basic income as an interesting proposal worth exploring on the long-term. For the
case of ECOLO, the already limited presence of basic income seems like it will further
disappear into the background as the idea was mainly upheld by the economist Philippe
Defeyt who recently retired in March 2016 (Dupriez & Khattabi, 2016). The resolute
proponent of basic income, however, is still going strong as he independently released a
concrete basic income proposal as of June 2016 (Van Horenbeek & Wauters, 2016). A cost
estimation of his proposal will be provided.
Vivant, although currently retired from the political scene, is a unique party with a sole
focus on basic income. The basic income proposal made public by Vivant is well-developed
compared to its counterparts and will therefore be elaborated upon next to other basic
income proposals, such as those by B.U.B. and Defeyt. (Vanderborght, 2000; Vivant, n.d.)
Notable individuals who have shown their interest for basic income and are requesting for
a thorough investigation are, but not limited to, Nele Lijnen, federal parliament member of
Open VLD, Yasmine Kherbache, Flemish parliament member of sp.a, Jan Cornillie, director
of the research affiliation of sp.a, and Karel Van Eetvelt, the managing director of an
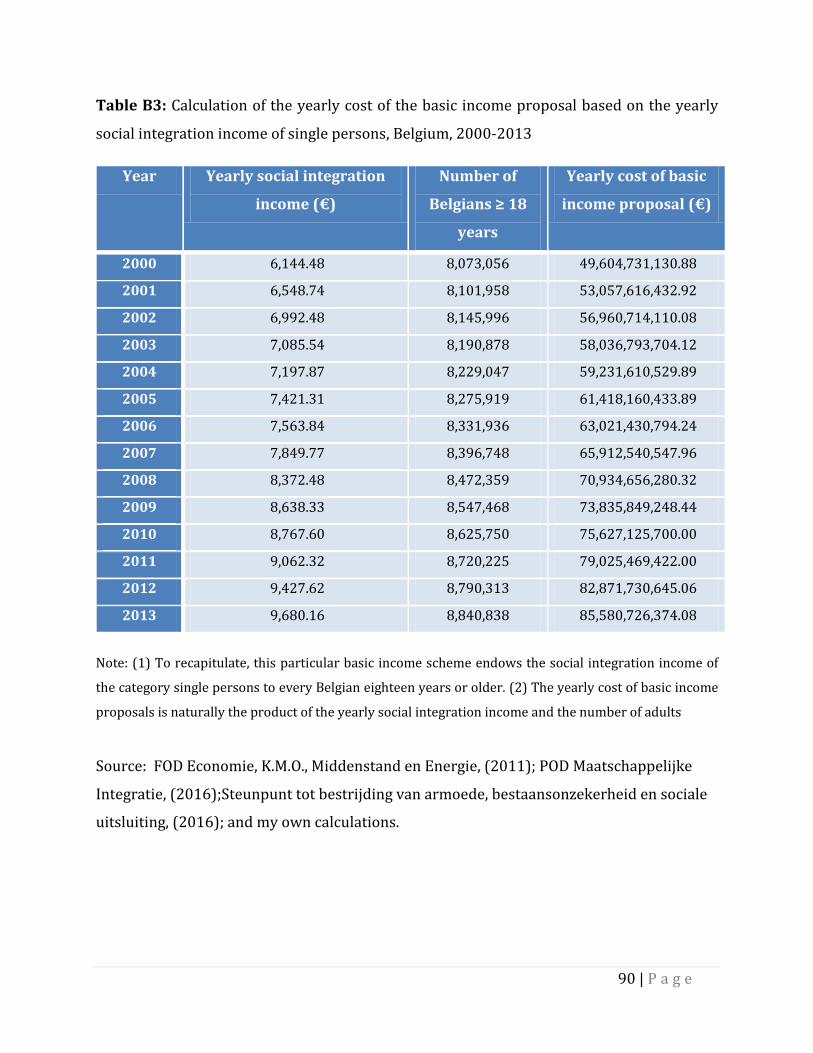
Špecián, 2015, p. 555-556; Statistics Belgium, n.d.; and own calculations)
Table 3: The B.U.B. proposal, Belgium, 2010
Scheme Monthly cash grant (€)
Adults / Minors
Yearly expenditures
(million €)
Cost comparison
(BI scheme as % of present social protection
expenditures)
Social integration
income
730.63 / 0 75,627 80.24
Poverty threshold
973.20 / 0 100,735 106.88
Breakeven 910.52 / 0 94,247 100
Source: Own creation based on Melzochová & Špecián, (2015, p. 555-556), B.U.B. (2016, p.
10), and my own calculations.
44 | P a g e
In this basic income scheme, everybody would receive the same sum and would thus be
treated equally, irrespective of their gender, race, household situation, status of
employment… However, is it truly appropriate to simply grant everyone the same amount
of money? In other words, is it socially desirable and correct to treat two different
individuals, say a healthy person and a disabled person, one and the same? The answer is
undeniably no. Following the wisdom of Amartya Sen’s capability approach, I am convinced
that one of the motives of basic income should be not to equalize the functionings, which
are “certain beings and doings that together constitute what makes a life valuable”
(Robeyns, 2011), but to respect the choice of the individual and instead equalize
capabilities, which are “a person’s real freedoms or opportunities to achieve functionings”
(Robeyns, 2011) (Odekon, 2015, p. 513). For example, if both a healthy person and a
disabled person were to be given the same amount of resources, e.g. the same level of basic
income, with these given resources the healthy person would be able to achieve more
functionings than a disabled person. In order to equalize the capabilities between the two
individuals, it is necessary to divert more resources to the disabled person and thus grant
the people who are most vulnerable in society a higher level of basic income. The current
social protection system acknowledges this and therefore diverts resources to the
vulnerable social groups, such as the sick, the disabled, the unwillingly unemployed and the
old. Thus while the basic income scheme by B.U.B. might be a system in which we treat
everyone equally, it is not the most equitable system. Furthermore, the basic-income-to-
substitute-everything scheme might be the most financially feasible, but again it is not the
most socially desirable system. We should thus strive for a basic income scheme that is
socially desirable yet financially feasible, a scheme which accommodates an equality of
opportunities. For this reason, many supporters push for basic income schemes which are
partially complementary to the social protection system. This is especially the case if basic
income is not at a sustainable level. (Van Parijs, 2004, p. 14)
45 | P a g e
In addition, I would like to draw attention to the fact that there exists a trade-off between
financial feasibility and social desirability. Basic income schemes that incorporate the
ethical principles of the social protection system by granting the socially vulnerable groups
a higher level of basic income, is socially desirable but leads to higher costs. The higher
costs are explained by two reasons.
First, the fact that a selective number of individuals receive a higher level of basic income
without changing the level of basic income for the remainder population evidently
increases the cost compared to the case in which everyone receives an equal level of basic
income. Naturally, a cost-reducing measure would be to decrease the level of basic income
for the remainder of the population. Alternatively, one can reduce the current levels of the
maintained social benefits for vulnerable social groups (Groot, 2004, p. 14) or subject the
social benefits to a ceiling which they may not exceed. (Defeyt, 2016)
Second, there is an opposition between basic income schemes which are substitutable and
basic income schemes which are complementary to the social protection system. While the
former basic income scheme incorporates the aspect of ‘unconditionality’, the latter basic
income scheme re-introduces ‘conditionality’ due to the need to verify whether the
individual in question meets the conditions to acquire a higher level of basic income, as
currently is the case with the social protection system. The latter basic income scheme has
higher administration costs because the efficiency gains on administration can no longer be
maximized as these are the result of a basic income scheme which is purely unconditional.
Possible cost-reducing measures in this regard would be to keep “conditional transfers in
simplified forms” (Groot, 2004, p. 14). (De Wispelaere & Stirton, 2011)
Overall, finding the balance between financial feasibility and social desirability brings us to
the following basic income proposals, which are more complex, more ethical, but also more
challenging to finance.
46 | P a g e
3.4.2 The Vivant proposal
The basic income proposal by Vivant (n.d.) can be to a large extent considered as a ‘basic-
income-to-substitute-everything’ scheme (Melzochová & Špeciána, 2015, p. 554-555). The
political party proposes basic income as a substitute for currently existing social benefits,
such as “retirement pensions, unemployment benefits, the social integration income, family
benefits, scholarships, compensations for career interruption, …”(Vivant, n.d., p. 8, own
translation). There are, however, two crucial aspects that differentiate Vivant’s proposal
from the pure basic-income-to-substitute-everything scheme of B.U.B. (2016, p. 10).
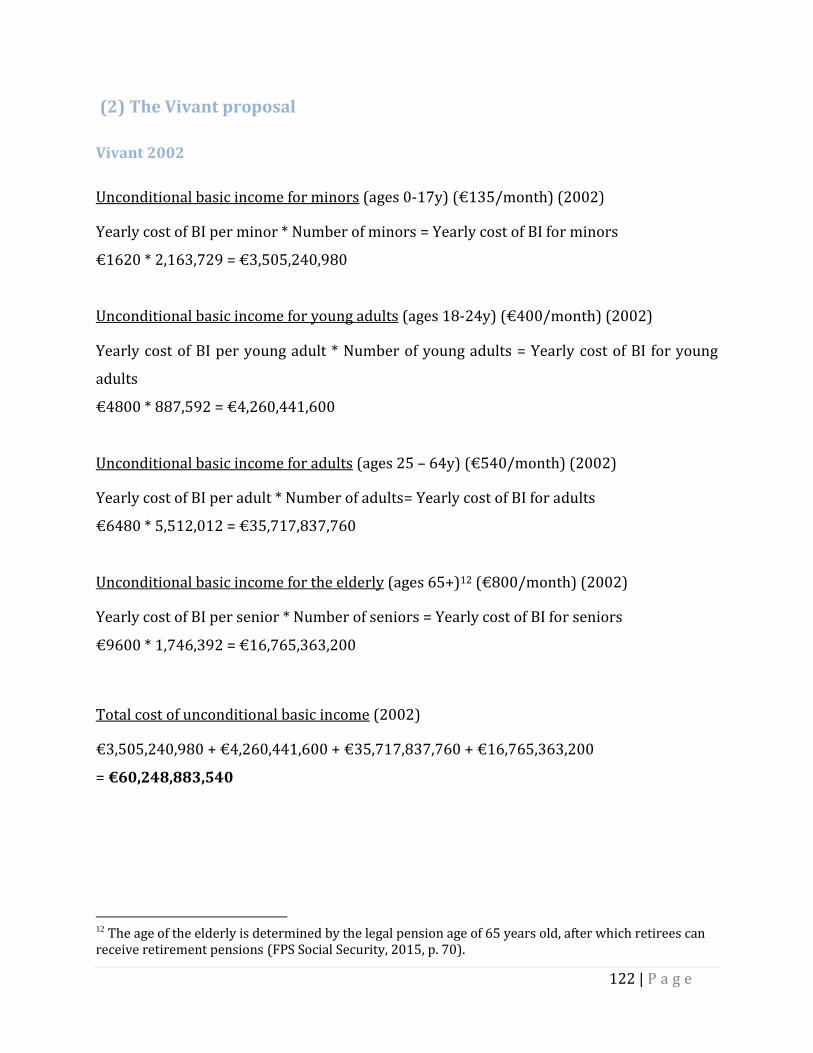
First, Vivant (n.d., p. 42) introduced a diversified basic income scheme with the levels of
basic income increasing throughout the four different age categories. The suggested
monthly levels of basic income for the year 2002 (2010) were €135 (€163) for minors,
€400 (€482) for young adults, €540 (€651) for adults, and €800 (€964) for seniors. In
total, the basic income proposal would cost €60 billion (€77 billion). This diversified basic
income scheme is opposed to the uniform basic income scheme by B.U.B. (2016, p. 10) that
grants every Belgian adult an equal amount of basic income.
Second, while B.U.B. (2016, p. 10) replaces health care and other social benefits by basic
income, Vivant (n.d., p. 9) believes that health care should be maintained and health
insurance should become unconditional just as basic income. According to the political
party, the persons who currently do not receive health care are limited in number and the
implied additional costs are modest compared to the current budget of health care. Vivant
further argues that the administration costs will decrease greatly by modifying the
conditional health insurance to one that is unconditional, as there is no longer a need to
verify whether an individual has the right to health care. As a result, Vivant suggests that
the cost savings should even out the extra implied costs, bringing about heath care
expenditures that are unchanged in level. Assuming Vivant’s suggestion is correct, the cost
of health care would remain at €23 billion for the year 2010. (Vivant, n.d., p. 9)
47 | P a g e
These two aspects contribute to the social desirability of Vivant’s basic income proposal.
The diversified basic income scheme across the different age categories provides seniors a
higher level of basic income as it substitutes their retirement pensions. Minors are also
given a basic income of which the level is approximated by the level of family benefits.
Furthermore, young adults receive a level of basic income, which is less than of adults but
more than of minors, that allows them to pursue higher education. Lastly, the sick are
protected thanks to unconditional health insurance. (Vivant, n.d. p. 7-24)
Table 4: The Vivant proposal, Belgium, 2002 and 2010
Scheme Monthly cash grant (€)
Minors / Young adults
Adults / Elderly
Yearly expenditures
(million €)
Cost comparison
(BI scheme as % of present social protection
expenditures)
Unconditional basic income
(2002)
135 / 400
540 / 800
60,249 N.A.
Unconditional basic income
(2010)
162.65 / 481.93
650.63 / 963.85
76,776 81.46
Health care
(2010)
N.A. 22,827 24.22
Basic income proposal and health care
(2010)
N.A.
99,603
105.68
Note: The dataset provided by FOD Sociale Zekerheid (2011, 2012, 2013) does not cover the year 2002,
thus no cost comparison is made for this year. I refrained myself from using data on social protection
expenditures provided by other sources as there is a wide diversity of which social categories are to be
included and which not.
Source: Own creation based on Melzochová & Špecián, (2015, p. 555-556), Vivant (n.d.),
and my own calculations.
48 | P a g e
In total, Vivant’s basic income proposal and unconditional system of health care would cost
€100 billion for the year 2010. The costs of Vivant’s proposal would exceed the social
protection expenditures by €5 billion (5.68%). At a first glance, the proposal by Vivant can
be thus considered as one that is financially feasible if their proposal were to replace the
social protection system of Belgium and if additional funds are sought for the remaining €5
billion. An overview of the preceding costs and cost comparisons is given in Table 4. (FOD
Sociale Zekerheid, 2011, 2012, 2013; Vivant, n.d.; and own calculations)
Lastly, I would like to make two remarks. First, I have only presented what Vivant had
planned regarding the basic income scheme and the social protection system. Vivant’s
political proposal, however, includes more policy proposals, such as a reform of the labor
market. Second, Vivant’s basic income proposal also includes a transition phase that
imposes different costs in comparison to the final phase. During this transition phase,
recipients should be able to retain their benefits if the level thereof is higher than the level
of basic income. The transition phase plays an important role for the political feasibility:
with basic income being a radical reform in comparison to the existing social protection
system, it cannot be simply implemented overnight. Implementing such a phase smoothens
the transition from the current social protection system to a scheme of basic income,
allowing for the people to adjust and thus leading to higher political feasibility. The costs
from this transition phase will not be considered. However, as will be seen in the upcoming
basic income proposals, the basic income proposal by Raventos et al. is comparable to the
transition phase of Vivant, thus we will still have an idea of the temporary high costs of
such a transition phase. But overall to simplify the analysis I have only addressed the cost
implications of the final phase. (Melzochová & Špecián, 2015, p. 553-554; Vivant, n.d., p.7-
18)
49 | P a g e
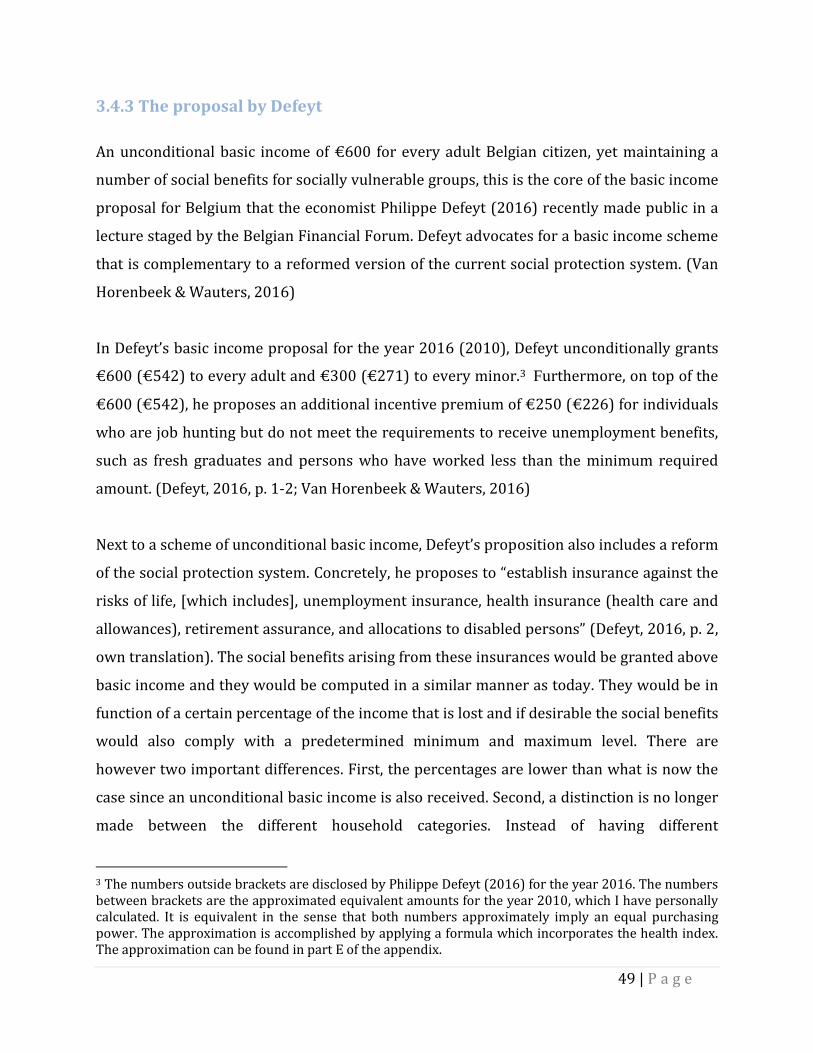
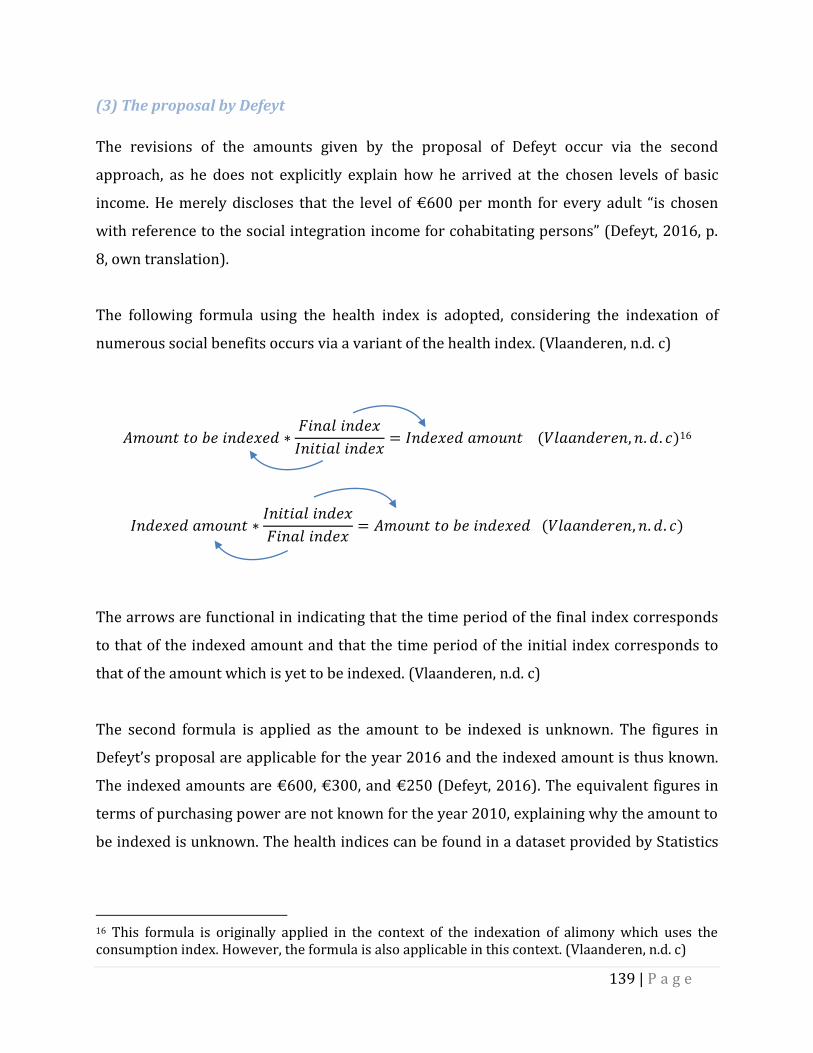
3.4.3 The proposal by Defeyt
An unconditional basic income of €600 for every adult Belgian citizen, yet maintaining a
number of social benefits for socially vulnerable groups, this is the core of the basic income
proposal for Belgium that the economist Philippe Defeyt (2016) recently made public in a
lecture staged by the Belgian Financial Forum. Defeyt advocates for a basic income scheme
that is complementary to a reformed version of the current social protection system. (Van
Horenbeek & Wauters, 2016)
In Defeyt’s basic income proposal for the year 2016 (2010), Defeyt unconditionally grants
€600 (€542) to every adult and €300 (€271) to every minor.3 Furthermore, on top of the
€600 (€542), he proposes an additional incentive premium of €250 (€226) for individuals
who are job hunting but do not meet the requirements to receive unemployment benefits,
such as fresh graduates and persons who have worked less than the minimum required
amount. (Defeyt, 2016, p. 1-2; Van Horenbeek & Wauters, 2016)
Next to a scheme of unconditional basic income, Defeyt’s proposition also includes a reform
of the social protection system. Concretely, he proposes to “establish insurance against the
risks of life, [which includes], unemployment insurance, health insurance (health care and
allowances), retirement assurance, and allocations to disabled persons” (Defeyt, 2016, p. 2,
own translation). The social benefits arising from these insurances would be granted above
basic income and they would be computed in a similar manner as today. They would be in
function of a certain percentage of the income that is lost and if desirable the social benefits
would also comply with a predetermined minimum and maximum level. There are
however two important differences. First, the percentages are lower than what is now the
case since an unconditional basic income is also received. Second, a distinction is no longer
made between the different household categories. Instead of having different
3 The numbers outside brackets are disclosed by Philippe Defeyt (2016) for the year 2016. The numbers between brackets are the approximated equivalent amounts for the year 2010, which I have personally calculated. It is equivalent in the sense that both numbers approximately imply an equal purchasing power. The approximation is accomplished by applying a formula which incorporates the health index. The approximation can be found in part E of the appendix.
50 | P a g e
arrangements for cohabitants, single persons, and persons living together with a
dependent family, there will only remain a single arrangement which is strictly individual.
On a side note, Defeyt wishes to keep the current system of health care and allocations to
handicapped persons as they are. (Defeyt, 2016, p.2)
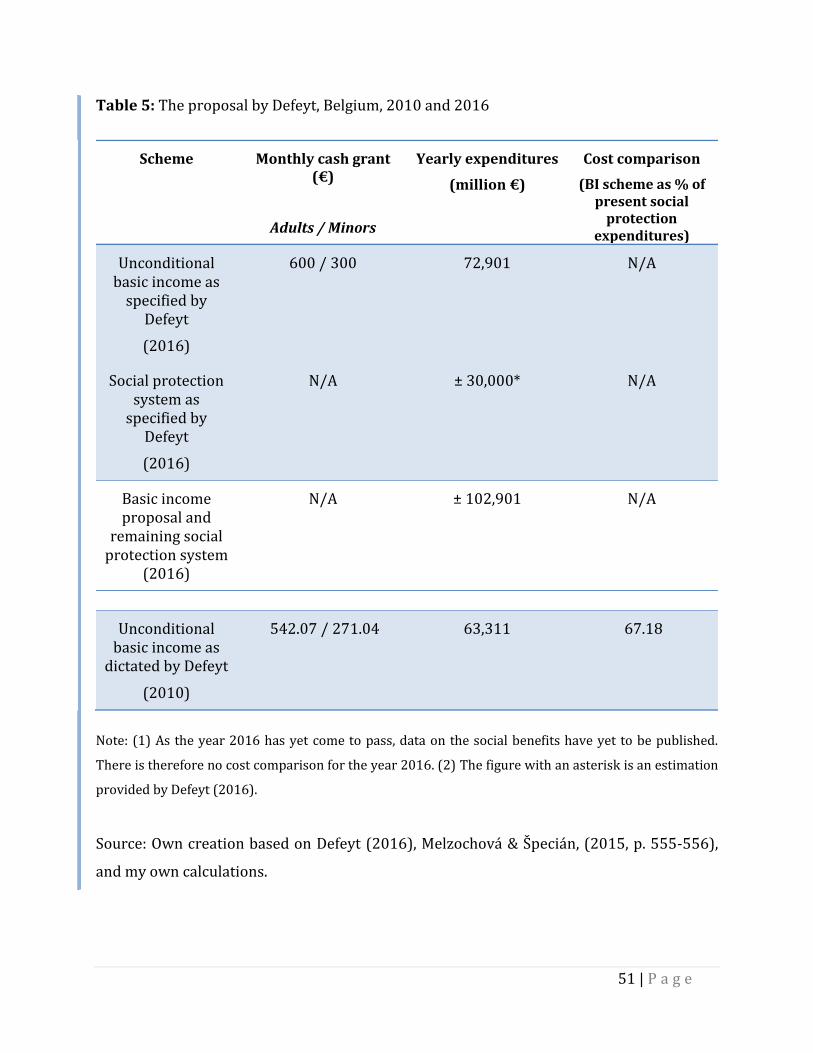
The unconditional basic income proposal by Defeyt would cost €73 billion in the year 2016
and €63 billion in the year 2010. The reformed social protection system is estimated at €30
billion by Defeyt for the year 2016.4 It is, however, unclear from his proposal whether
Defeyt includes the costs of health care in this estimation. I suspect that his estimate of €30
billion does not include health care as health care cost €23 billion and social benefits cost
€56 billion for the year 2010. That aside, in total, Defeyt’s proposal would cost about €103
billion for the year 2016. An overview of these costs is shown in Table 5. (Defeyt, 2016, p.
8)
Lastly, I would like to make a remark that the proposal by Defeyt is an excellent example of
a basic income proposal that attempts to find a balance between financial feasibility and
social desirability. The vulnerable social groups are protected in his proposal thanks to the
different types of insurances and remaining social benefits, which contributes to the social
desirability of the proposal. At the same time, Defeyt recognizes the increased costs of a
basic income proposal partially complementary to the social protection system. To
promote financial feasibility, he advocates for a lower level of basic income, lower levels of
social benefits, and a reform of the current social protection system. (Van Horenbeek &
Wauters, 2016)
4 Unfortunately, Defeyt (2016, p.8) does not provide calculations nor an exact description of how high the social benefits would be. He merely provides a total cost estimation for the reformed social protection system. For this reason, I cannot make a similar cost estimation of the remaining social benefits for the year 2010.
51 | P a g e
Table 5: The proposal by Defeyt, Belgium, 2010 and 2016
Scheme Monthly cash grant (€)
Adults / Minors
Yearly expenditures
(million €)
Cost comparison
(BI scheme as % of present social
protection expenditures)
Unconditional basic income as
specified by Defeyt
(2016)
600 / 300
72,901
N/A
Social protection system as
specified by Defeyt
(2016)
N/A ± 30,000* N/A
Basic income proposal and
remaining social protection system
(2016)
N/A ± 102,901 N/A
Unconditional basic income as
dictated by Defeyt
(2010)
542.07 / 271.04 63,311 67.18
Note: (1) As the year 2016 has yet come to pass, data on the social benefits have yet to be published.
There is therefore no cost comparison for the year 2016. (2) The figure with an asterisk is an estimation
provided by Defeyt (2016).
Source: Own creation based on Defeyt (2016), Melzochová & Špecián, (2015, p. 555-556),
and my own calculations.
52 | P a g e
3.4.4 The proposal by Raventos et al.
The last basic income proposal to be considered is by Raventos and his co-authors,
Arcarons and Torrens, for the territory of Catalonia in the year 2010 (Arcarons, Raventos
Pañella & Torrens Mèlich, 2014). Their proposal is an example of a basic income scheme
that lies closely to the extreme ‘basic-income-purely-as-a-complement scheme’
(Melzochová & Špecián, (2015, p. 554-555), as there is an intertwining of the currently
existing social benefits and basic income. The following three points formulate how
existing social benefits are to be treated after an introduction of basic income.
“1.) Basic income replaces any existing public cash benefit of a lesser quantity.
“2.) When the public cash benefit is of a greater amount, the basic income must be topped
up to an equal quantity.
“3.) The basic income model allows for the financing of all extant services, such as health,
education, and all the others covered by public spending, as well the BI that is proposed
here.” (Arcarons, Raventos Pañella & Torrens Mèlich, 2014, p. 80)
Regarding the level of basic income, Raventos et al. grant a different amount to the minors
and the adults of Catalonia. In the first basic income scheme, the level of the Sufficient
Income Indicator for Catalonia was granted to adults (€664 per month) and a fifth of this
amount was granted to minors (€133 per month) for the year 2010 (Arcarons, Raventos
Pañella & Torrens Mèlich, 2014, p. 80-81). In the second basic income scheme, the
minimum wage was foreseen for adults (€451 per month), and minors were alternatively
allocated a basic income worth 100%, 50%, 30% of the basic income for adults for the year
2003 (Raventos, 2007, p. 158). As a general guideline, the authors suggest that the level of
basic income for adults should be above the poverty threshold (Arcarons, Raventos Pañella
& Torrens Mèlich, 2014, p. 80).
In the conditions of Belgium 2010, I will examine the proposal by Raventos et al. which
accords to the first proposed basic income scheme and which fulfills the three points
summed up earlier. Alternatively to the Sufficient Income Indicator for Catalonia, I will
examine the social integration income for Belgium, which can be considered as its Belgian
53 | P a g e
equivalent as this amount is supposed to be sufficiently high to guarantee a decent
existence (FPS Social Security, 2015, p. 155). The social integration income, however, is
consistently lower than the poverty threshold in Belgium. For this reason, I will also
consider the poverty threshold of Belgium 2010, as the guidelines by Raventos et al.
requires the level of basic income for adults to be at least as high as the poverty threshold
(Arcarons, Raventos Pañella & Torrens Mèlich, 2014, p. 80). Concretely, this brings about
the following two basic income proposals for Belgium, 2010: (1) Basic income proposal by
Raventos et al. using the social integration income, €731 per month for adults and €146
per month for minors; (2) Basic income proposal by Raventos et al. using the poverty
threshold, €973 per month for adults and €195 per month for minors.
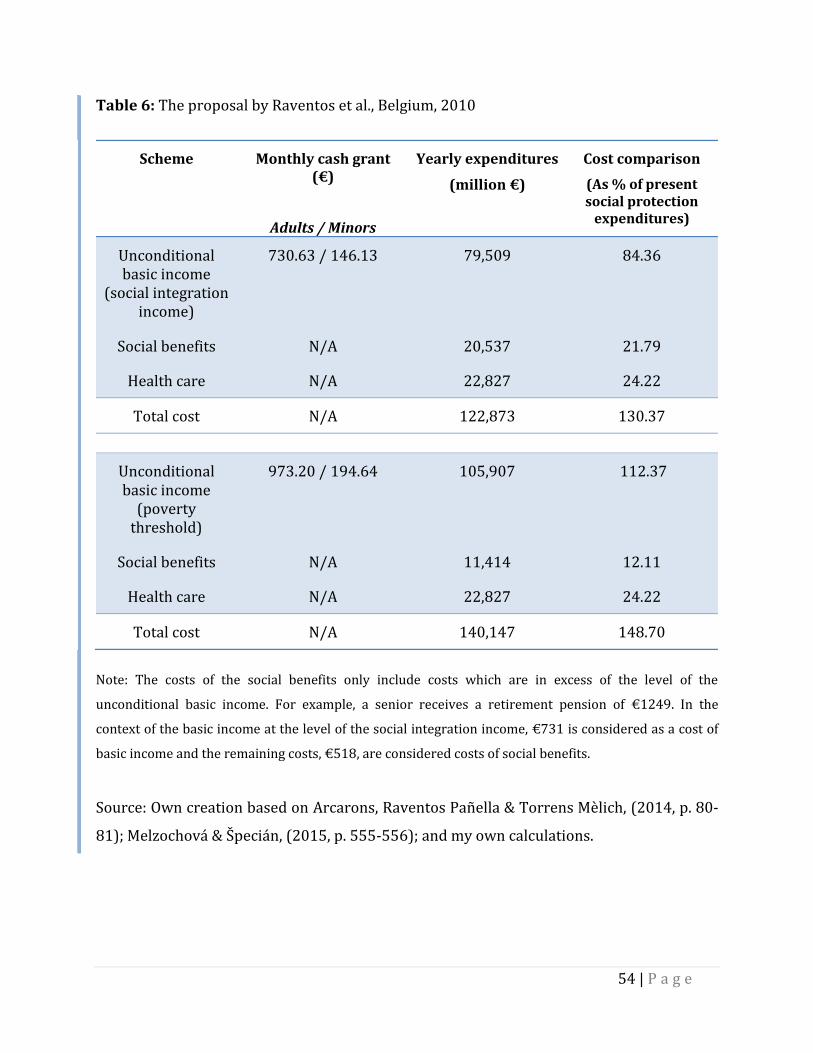
The cost estimation of both schemes is illustrated in Table 6. The unconditional basic
income alone would cost €80 billion for the first proposal and €106 billion for the second.
The retained social benefits, which exceed the level of basic income, are respectively
estimated at €21 billion and €11 billion. In total, including the costs of unconditional basic
income, the remaining social protection system, and health care, the implementation of the
proposal would require €123 billion for the basic income proposal using the social
integration income and €140 billion for the basic income proposal using the poverty
threshold. (FOD Economie, K.M.O., Middenstand en Energie, 2016; POD Maatschappelijke
Integratie, 2016; and Steunpunt tot bestrijding van armoede, bestaansonzekerheid en
sociale uitsluiting, 2016).
54 | P a g e
Table 6: The proposal by Raventos et al., Belgium, 2010
Scheme Monthly cash grant (€)
Adults / Minors
Yearly expenditures
(million €)
Cost comparison
(As % of present social protection
expenditures)
Unconditional basic income
(social integration income)
730.63 / 146.13
79,509
84.36
Social benefits N/A 20,537 21.79
Health care N/A 22,827 24.22
Total cost N/A 122,873 130.37
Unconditional basic income
(poverty threshold)
973.20 / 194.64
105,907
112.37
Social benefits N/A 11,414 12.11
Health care N/A 22,827 24.22
Total cost N/A 140,147 148.70
Note: The costs of the social benefits only include costs which are in excess of the level of the
unconditional basic income. For example, a senior receives a retirement pension of €1249. In the
context of the basic income at the level of the social integration income, €731 is considered as a cost of
basic income and the remaining costs, €518, are considered costs of social benefits.
Source: Own creation based on Arcarons, Raventos Pañella & Torrens Mèlich, (2014, p. 80-
81); Melzochová & Špecián, (2015, p. 555-556); and my own calculations.
55 | P a g e
The cost estimation of the basic income proposal by Raventos et al. is more complex than
the previously discussed proposals. The three points that were put forward by Raventos et
al., have an important implication on the cost estimation: a comparison between the level
of current social benefits and the level of basic income will become necessary to determine
which social benefits are retained and which social benefits are replaced by basic income.
Due to this additional technicality, based on information from part C of the appendix, I have
generated statistical figures that show the average (monthly, yearly) level of social benefits
per beneficiary in part D of the appendix, creating the data that is needed to make such a
comparison possible. A cost estimation of the basic income proposals by Raventos’ for the
year 2010 followed the comparison. To understand how the comparison and the cost
estimation of the basic income proposal by Raventos et al. were achieved, I recommend
consulting part E of the appendix. (Arcarons, Raventos Pañella & Torrens Mèlich, 2014)
The cost estimation that I provide of Raventos et al.’s proposal is innovative in two aspects.
First, the comparison preceding the cost estimation is of a comprehensive nature because
35 social benefits will be considered and not only the retirement pensions, as was done in a
cost estimation of Raventos’ proposal by Melzochová and Špecián (2015, p. 556) for the
Czech Republic. Furthermore, the extensive comparison is mandatory because in Belgium
many beneficiaries receive social benefits of which the levels tower over that of the social
integration income and the poverty threshold (FOD Sociale Zekerheid, 2011). Second, a
cost estimation of a basic income proposal which “replaces any existing public cash benefit
of a lesser quantity [and] is topped up to an equal quantity when the public cash benefit is
of a greater amount”(Arcarons, Raventos Pañella & Torrens Mèlich, 2014, p. 80) has not yet
been realized for Belgium. Cost estimations have been largely limited to proposals in which
basic income is seen as a stand-alone with respect to currently existing social benefits. One
exception is the basic income proposal by Defeyt (2016) as he urges for a basic income
scheme which co-exists with a reformed version of the social protection system. Defeyt,
however, does not provide calculations for the reformed social protections system, he
merely gives an estimate. Overall, the cost estimation of Raventos’ proposal for Belgium
will allow for an assessment of a basic income scheme that safeguards the existing social
Monnier & Vercellone, 2014, p. 71-73; and own calculations)
In order to assess the cost savings implied by the criterion provided by Raventos et al., a
comparison is necessary between the level of social benefits and the level of basic income.5
This comparison identifies which socials benefits are on average higher or lower than the
level of basic income. In order to make such a comparison possible, based on the dataset
provided by the FPS Social Security (FOD Sociale Zekerheid; 2011, 2012, 2013) (of which
an overview is shown in part C of the appendix), I calculated the average level for 35 social
benefits in part D of the appendix. After the comparison, an estimation of the cost savings
that are realized on the total cost of unconditional basic income (excluding the remaining
5 An elaborate explanation on how this comparison occurs can be found in part E of the appendix, under point (4), the proposal by Raventos et al. The comparison already took place in order to obtain cost estimations.
64 | P a g e
costs of social benefits and health care) can be calculated by the summation of (1) the total
expenditures on social benefits of which the average level is lower than the level of basic
income and (2) the summation of the following product for every social benefit of which
the average level is higher than the level of basic income: the product of the monthly level
of basic income level multiplied by the number of beneficiaries who receive the specific
social benefit which in turn is multiplied by the average number of months during which
this specific social benefit is received.6 The first part of the summation reflects the
complete replacement of social benefits by basic income and the second part reflects the
partial replacement of social benefits by basic income. Note that this calculation can be
considered as a general formula when only the cost of the universal basic income has been
calculated.
6 Note that the average number of months during which the social benefit is received differs between social benefits. This explains why the product should be calculated for each social benefit separately. The average number of months is also calculated in part D of the appendix.
Figure 12: Comparison of the cost savings and the grand total cost of the basic income
proposal by Raventos et al., in million euro, Belgium, 2010
Source: Own creation based on Arcarons, Raventos Pañella & Torrens Mèlich, (2014);
Defeyt (2016), FOD Sociale Zekerheid (2011, 2012, 2013), and my own calculations.
65 | P a g e
Concerning the modified version of Raventos et al. the implied cost savings are easier to
assess as the grand total cost estimation of basic income was calculated. The costs of social
benefits, the costs which are the result of social benefits in excess of the basic income level,
and the costs of health care additional to the costs of unconditional basic income are
included. As is illustrated in Figure 12, the cost savings of this grand total estimation (€114
billion) is €79 billion, the summation of the initial total expenditures of all social benefits
(€56 billion) and health care (€23 billion). The grand total cost estimation namely replaces
all costs of the initial social protection system. (Arcarons, Raventos Pañella & Torrens
Mèlich, 2014)
Alternatively, the cost savings realized on the cost of unconditional basic income (€66
billion), caused by an entire and partial replacement of social benefits, is €30 billion. This
can be calculated by the general formula aforementioned or it can be alternatively
calculated by the difference of the initial costs of social benefits (€56 billion) and the
remaining costs of social benefits under the basic income scheme (€25 billion), the costs
which are the result of social benefits in excess of the basic income level.7 Expressed in
percentages, the cost savings constitute 45% of the costs of unconditional basic income.
As concluded by Tirez (2014b, own translation), “the costs of basic income may be
enormous, but so are the savings”. The partial and complete replacement of social benefits
led to the realization of these significant cost savings. The remaining cost gap that has to be
financed is brought down to €36 billion.8
7 When the grand total cost estimation of basic income has already been calculated, this shortcut can be taken instead of the elaborate approach mentioned earlier. 8 Note that this cost gap is evidently equal for the ‘grand total cost of basic income’ and the total cost of
unconditional basic income. The cost gap is calculated as the following in million euro. (1) Grand total cost of basic income: Cost gap = 114,241 – 78,454 = 35,787 (2) Total cost of unconditional basic income: Cost gap = 66,091 – 30,304 = 35,787
66 | P a g e
3.5.3 Additional financing measures
The second step is to implement additional measures in order to finance the remaining cost
of €36 billion. A wide diversity of measures has been suggested by proponents of basic
income and there has been considerable progress of how basic income can be financed. Due
to a focus on providing improved estimations of basic income proposals and the implied
cost savings, a discussion of the diverse measures as well as a concrete assessment of how
the remaining cost gap can be financed is beyond the scope of my paper. However, I would
like to briefly discuss the administrative efficiency argument, which is brought up routinely
by proponents, and the tax-increasing measures, which are naturally considered the
primary measures in closing the cost gap. (Raventos, 2007)
Cost savings realized by administrative efficiency
Besides the cost savings realized by the replacement of social benefits, proponents of basic
income turn to cost savings which are the product of administration efficiency. As opposed
to social benefits which are conditional in nature, basic income is unconditional. Under
basic income, there is no longer the need to verify whether an individual is eligible or not,
leading to a simplification of the administration process. The extent of the cost savings,
however, depends on the one hand on the initial administrative (in)efficiency of the social
protection system and on the other hand on the implied efficiency of a specific basic income
proposal. (De Wispelaere & Stirton, 2011)
On the one hand, the Belgian social protection system is relatively inefficient in comparison
to a scheme of basic income mainly due to three reasons. First, the current responsibilities
of the social protection system are spread over the different government levels, varying
from the federal level to the three communities (Flemish, French, and German speaking)
and the Common Community Commission of the Brussels Capital Region (FPS Social
Security, 2015, p. 13). With the introduction of basic income, basic income can be simply
organized at the federal level. Second, the organization of the social protection system is
made possible by a significant number of institutions. There are currently 15 ‘central
institutions’ and these are only the “institutions that are responsible for one or more
67 | P a g e
branches of a specific system” (FOD Sociale Zekerheid, 2012, p. 59-61). There are thus
additional institutions, called ‘primary institutions’, which are responsible for the specific
branches. A scheme of basic income will lead to the replacement of many social benefits
and a number of these institutions will be made redundant as a consequence. Third, as
mentioned in part D of the appendix that is dedicated to an analysis of social benefits, there
exists a great variation in the level of social benefits due to a wide range of criteria due to
which the amount may differ. With basic income, these criteria are no longer enforced.
Overall, this leads to the insight that the efficiency gains are more significant if one were to
departure from an inefficient social protection system. (De Wispelaere & Stirton, 2011)
On the other hand, the implied efficiency of basic income depends on the type of basic
income scheme. Schemes of the type ‘basic-income-to-substitute-everything’ are naturally
more cost efficient than schemes leanings towards the type of ‘basic-income-purely-as-a-
complement’ (Melzochová & Špecián, 2015, p. 554). The cost efficiency namely depends on
how many social benefits are retained. For example, in the case of the proposal by Raventos
et al., there are efficiency gains due to the complete replacement of a number of social
benefits. However, at the same time, the efficiency gains are limited due to the fact that a
number of social benefits are partially being maintained. (De Wispelaere & Stirton, 2011)
The administrative efficiency argument is valid to a certain extent. However, when
assessing the extent of the cost savings, one should account for the initial administrative
(in)efficiency of the social protection system and the (limited) efficiency gains as a result of
a specific basic income scheme. Furthermore, while a scheme of basic income may be
comparatively more efficient than the current social protection system, it is important to
recognize that the implementation of basic income is also paired with administration costs.
There is a need to carefully assess the extent of efficiency gains based on the specific type of
basic income scheme. (De Wispelaere & Stirton, 2011)
68 | P a g e
Taxes
In all basic income proposals, the method that is primarily responsible for closing the cost
gap is a reform of the taxes (Monnier & Vercellone, 2014, p. 72). A number of tax proposals
given by Belgian proponents of basic income will be discussed.
Jan Cornillie (2015), director of the research department of sp.a, suggests reforming the
personal income tax by abolishing the income tax exemption, the martial quotient, and a
number of other deductions that he, unfortunately, does not specify. He estimates an
increase of tax revenues worth €16.6 billion for the year 2015.
Philippe Defeyt (2016, p. 9), adopts a similar approach and also suggests abolishing the
income tax exemption and the martial quotient. The additional tax-exempt income for
dependent children and the tax deduction of childcare expenses for children less than 12
years are also annulled. These measures are estimated to generate €14.5 billion for the
year 2016. Furthermore, he proposes a taxation of capital income (€4 billion), the abolition
of the company car scheme (€3.4 billion), and a decrease of 50% for the tax reductions of
pensions and replacement incomes (€2.4 billion).9
Andreas Tirez (2015b) also suggests putting an end to the income tax exemption, which
was at €7090 in the tax year 2016 (SBB, n.d.). A simulation by the static micro-simulation
model Flemosi (n.d.) estimates the revenues at €10.2 billion for the year 2012 and €11.2
billion for the year 2014.10
In a TV broadcast by Panorama (2014), three Belgian proponents of basic income, Cate
Pierre Catelin, Axelle de Brant, and Ismaël Daoud, suggested the following tax measures for
the year 2014 with the revenues correspondingly reported: “an average increase of the
VAT from 21% to 25% (€16 billion), an increase of the real estate registration fees from
10-12.5% to 25% (€5.3 billion), a wealth tax of 25% (€29.2 billion), a capital gains tax of
9 Note that this is a non-limitative list of Defeyt’s suggestions of measures to finance basic income. The
measures that are mentioned are the most tax increasing. 10
There are larger revenues for the year 2014 due to the higher level of the income tax exemption.
69 | P a g e
25% (€3 billion), an adjustment of the personal income tax (€22.9 billion), an adjustment
of the corporate tax (€4.2 billion), an adjustment of the withholding tax (taxes on savings,
dividends, securities) from 6% to 25% (€2.8 billion)” (Panorama, 2014, own translation).
Note that their suggestions are rather extreme because they want to finance a generous
scheme of basic income that monthly grants every adult €1500 and every minor €200.
The financing of the remaining cost gap of €36 billion can be technically achieved according
to these proposed measures. The proponents suggest generating government revenues in a
manner that is justifiable due to the fact that the citizens receive a basic income (Defeyt,
2016; Panorama, 2014). Ideally, the large cost of basic income should be carried by an
abundant amount of measures instead of a few extreme measures in order to enhance
political and economic feasibility. The need to increase taxes is thus a practically inevitable
course of action when finding ways to finance basic income. However, it is imperative to
ensure that the increased taxes are sustainable for the economy.
3.5.4 Sustainability
Recall that the basic income proposals that have been discussed allocate only modest
amounts of basic income to Belgian citizens. The highest basic income that was taken into
consideration is at the level of the poverty threshold (€973 per month). The reason why I
have limited myself to lower levels of basic income instead of grand levels, for example,
€1500 and €2000 per month, is due to an important insight identified by Van Parijs (1995,
p. 38-41): the sustainability of a basic income scheme for the Belgian economy. Whether
the Belgian economy can sustain a scheme of basic income depends on the exact manner in
which it is financed. However, higher levels of basic income evidently become more
challenging to finance, increasing the need to turn to higher taxes. Optimally, Van Parijs
(1995, p. 38) advises to “select the structure of taxation that can durably generate the
highest yield, and [to pitch the] tax rates at a level corresponding to the peak of the
associated Laffer hyperplane”.
70 | P a g e
As is illustrated in Figure 13, the Laffer curve is an inverse U-shaped curve. The peak of the
Laffer curve is said to be the optimal tax rate, “that durably generates the highest tax yield”
(Van Parijs, 1995, p.38). The inverse U-shaped curve has two implications. First, increases
in tax rates preceding the optimal tax rate lead to an increase in tax revenues. Second,
increases in tax rates higher than the optimal tax rate lead to a reduction in tax revenues
(Krugman & Wells, 2009, p. 177). This implies that higher tax rates do not always lead to an
increase in tax revenues so when deciding to increase the tax rates to finance basic income,
we should be careful to not find ourselves on the downward-sloping part of the Laffer
curve. Although Van Parijs’ advice is difficult to apply, his insight is nevertheless
enlightening and should be taken into account. For this reason, I have only covered
proposals that grant moderate levels of basic income as they are naturally more
sustainable than basic income proposals that adopt higher levels.
Allow me to present a basic income proposal that illustrates why high levels of basic
income are (or at least presently) unsustainable. In a TV broadcast of Panorama (2014),
three Belgian proponents of basic income, Cate Pierre Catelin, Axelle de Brant, and Ismaël
Daoud, took up the challenge to finance a basic income scheme that grants every adult
€1500 per month and every minor €200 per month. The scheme additionally includes a
number of ‘personal all-in insurances’, such as health insurance. The cost of the
unconditional basic income alone is estimated at €163 billion and the grand total cost,
Figure 13: The Laffer curve
Source: Adopted from Laffer, (2004).
71 | P a g e
including the insurances, is estimated at €187 billion. After accounting for the cost savings
on social benefits and administration, the remaining cost to be financed is €91 billion.
Catelin, de Brant, and Daoud proposed to finance this grand amount by increasing taxes
accompanied by a tax shift which is to bring about a balance between the tax on capital and
of the tax on labor. The exact proposed tax measures were discussed in the previous
subsection. Allow me to rephrase what this concretely means, Catelin, de Brant, and Daoud
suggest to implement “additional taxes that amount nearly a quarter of the GDP. This
would be politically and economically totally unfeasible” (Tirez, 2014a, own translation).
Not to mention, the large behavioral effects brought about by the increased taxes. It also
would not be unimaginable that the increased tax rates are on the downward-sloping part
of the Laffer curve, leading to a decrease in tax revenues instead of an increase (Decock,
2015).
Lastly, I would like to point out that basic income, as well as every single measure
implemented to finance basic income, will inevitably have important consequences. The
issue of sustainability was addressed but there are also behavioral effects, the issue of
whether the measure is considered to be politically or economically feasible, implications
on inequality, progressivity, and redistribution… For this reason, the consequences of basic
income, as well as every suggested measure, should be carefully considered. In this regard,
static back-of-the-envelope calculations do poorly and it becomes necessary to turn to
micro-simulation models and basic income experiments. In the next section, I will
acknowledge the limitations of the static approach and suggest an alternative approach for
further research. (Tirez, 2014a)
3.6 Topics for further research
The financing of basic income is twofold, being mainly achieved via the cost savings from
the replacement of social benefits by basic income and the extra revenues generated by tax
reforms.
72 | P a g e
The cost savings were assessed by applying the criterion of Raventos et al. that entirely
replaces social benefits of a lower level than basic income and partially replaces social
benefits of a higher level than basic income (Arcarons, Raventos Pañella & Torrens Mèlich,
2014). There are four aspects that can be improved. First, in order to determine which
social benefits are entirely and partially replaced, I compared the average level of social
benefit that each beneficiary receives to the level of basic income. However, as pointed out
in part D of the appendix, there is a tremendous amount of variation in the level received
not only across the different types of social benefits but also across different beneficiaries
who receive the same type of social benefit. An improved analysis would be to compare the
social benefit that each beneficiary receives individually instead of the average to the level
of basic income. Alternatively, a comparison can also be made for different ranges of
levels.11 However, the former requires precise data on what every single individual
receives from social benefits and the latter requires the number of beneficiaries for the
different level ranges of social benefits. Therefore, these improvements can only be
realized if there is a representative sample of recipients of social benefits or if the specified
datasets are available. Second, an analogous argument applies to the duration over which
the beneficiaries receive social benefits. As I have also employed the average number of
months or assumed that beneficiaries receive certain types of social benefits throughout
the year (e.g. retirement pensions, benefits for disabled persons). Third, aside from the
combination of retirement pensions and the income guarantee for the elderly (IGO), and
the combination of retirement pensions and survivor’s pensions, I made the assumption
that every beneficiary only receives one type of social benefit due to a lack of data. In
reality, however, there are recipients who receive more than one type of social benefit. For
example, on 1 January 2011, 82,308 out of 99,149 beneficiaries of IGO additionally received
a retirement pension (FOD Sociale Zekerheid, 2011, 2012, 2013; RVP, 2011, p. 259). Once
more, if more data were to be available in the different combinations of social benefits a
more accurate cost estimation can be made. Fourth, the number of recipients of social
benefits is given the conditions of the social protection system of 2010. If basic income, as
well as the corresponding tax reforms, were to be implemented, given the behavioral
11
For example, the datasets would include the number of beneficiaries that receive a specific type of social benefit which are within the ranges, €100 - €299, €300 - €499, €500 - €699…
73 | P a g e
effects and the consequences on income, the question should be addressed of whether the
number of recipients of social benefits will remain unchanged. Overall, the availability of
comprehensive datasets on social benefits and the knowledge of behavioral effects will
enable improved estimations of the cost savings.
After obtaining estimations of the cost savings, the next step is to finance the remaining
cost gap. The most typical approach is to generate extra revenue through tax reforms. In
Belgium, proponents of basic income have only adopted static back-of-the-envelope
calculations to assess how much tax reforms would yield. There is much space for
improvement in this regard and the following suggestions by the literature should be
applied to obtain a reliable assessment. First, it is desirable to analyze the distributional
effects of basic income and the proposed tax reformation. A micro-simulation model, which
employs data of the income distribution and tax payers, makes a static analysis possible
(Raventos, 2007, p. 157). Second, a dynamic approach can be adopted to predict the
behavioral effects, such as the labor effects, that occur due to the introduction of basic
income and the tax reforms (Melzochová & Špecián, 2015, p. 557). This is an important
aspect in the discussion of financial feasibility as the unemployment rates indirectly impact
the government revenues, the main source of funding basic income, through personal
income taxes. With personal income taxes being the predominant tax instrument in the
European Union, the impact of the decreased incomes caused by higher unemployment
rates on the tax revenues is not to be underestimated (Verbist & Figari, 2014).
Taking all contributions of the financial feasibility of basic income in Belgium into account,
there are yet many questions that remain unanswered. The distributional and the
behavioral effects of basic income and the corresponding tax reforms, for example, are yet
to be addressed. While static back-of-the-envelope calculations are the first step towards
assessing the financial feasibility, it is time for basic income proponents to distance
themselves from these calculations. I appeal to proponents to provide more transparency
of how their estimates were obtained and to take up the challenge to also adopt the highly
endorsed micro-simulation models in order to provide a better picture of the consequences
of basic income and the corresponding tax reforms.
74 | P a g e
4. Conclusion
The financial feasibility of basic income was taken under scrutiny in this paper, assessing
the costs as well as the cost savings on the social protection system which are implied by
the introduction of basic income.
The costs of granting every citizen an equal monthly income are dependent on the specifics
of the basic income proposal; though the costs are generally considerable in magnitude
when compared to the social protection expenditures. Five basic income proposals were
presented, starting with the proposal by B.U.B. (2016) which is of the extreme ‘basic-
income-to-substitute-everything’. The scheme was concluded to be the most financially
feasible; however, the scheme is also the least socially desirable as the complete
abolishment of the social protection system would lead to a deterioration of those receiving
social benefits of a higher level. More socially desirable schemes and thus also more costly
schemes were introduced that partially retained the social protection system, such as the
proposal by Vivant (n.d.) and the proposal by Defeyt (2016). Finally, bringing us closer to
the extreme ‘basic-income-as-a-complement’, the proposal by Raventos et al. (Arcarons,
Raventos Pañella & Torrens Mèlich, 2014) was introduced which ensured that recipients of
social benefits would be just as well off under the scheme of basic income. In comparison to
the other schemes, this proposal is the most socially desirable, but also the least financially
feasible. For this reason, a modified version was suggested, adjusting the level of basic
income downwards, finding a balance between financial feasibility and social desirability.
(Melzochová & Špecián, 2015)
The financing of basic income mainly occurs through cost savings and extra revenues
brought about by tax reforms. The cost savings of the modified proposal were assessed by
applying the simple but socially desirable criterion by Raventos et al., having basic income
entirely replace social benefits of a lower level and partially replace social benefits of a
higher level. The application of this criterion led to the comparison between the average
level of 35 different social benefits and the level of basic income. The conclusion to this
regard is that while the costs of basic income may be enormous, the resulting cost savings
75 | P a g e
are also significant in magnitude and largely contribute to financing basic income.
According to the calculations of basic income proponents in Belgium, the remaining cost
gap can technically be financed. However, proponents should additionally take into account
that basic income, as well as these suggested tax reforms, should be sustainable, address
the implications on redistribution, and account for behavioral effects.
This paper is the first step in establishing a cost analysis considering the current climate
with regards to social benefits as well as establishing a balanced proposal that entails
moderate characteristics. The next step would be to fine tune the proposal by looking into
all characteristics in detail. Some social benefits could potentially be lowered. For example,
considering that all working people receive basic income on top of their wage when
temporarily losing their job, maybe unemployment benefits do not have to be as high as
they are currently. Perhaps when taking into account all possible advantages and
disadvantages of implementing basic income, the amount in this proposal might be deemed
insufficient and an even larger cost gap would need to be financed. Furthermore, there are
also topics that go beyond the scope of a theoretical paper. The labor effects caused by
basic income and tax reforms, for example, can only be assessed to a certain extent with the
help of models as these are unreliable when faced with extreme values, calling the need to
also experiment with basic income. Basic income and the corresponding tax reforms will
affect our economic output and therefore influence the financing of basic income.
To truly complete the picture of addressing the financing feasibility of basic income in
Belgium, we must forego back-of-the-envelope calculations and address these issues and
calculations in a credible and transparent manner, only then can we have a valid
discussion. I hope this dissertation can be a first step in accomplishing that.
76 | P a g e
Bibliography
Agence France-Presse. (2016, June 5). Swiss voters reject proposal to give basic income to
every adult and child. The Guardian. Retrieved July 8, 2016, from
The age of the elderly is determined by the legal pension age of 65 years old, after which retirees can receive retirement pensions (FPS Social Security, 2015, p. 70).
123 | P a g e
Vivant 2010
Unconditional basic income for minors (ages 0-17y) (€162.65/month) (2010)
Yearly cost of BI per minor * Number of minors = Yearly cost of BI for minors
€1951.80 * 2,214,156 = €4,321,589,680.80
Unconditional basic income for young adults (ages 18-24y) (€481.93/month) (2010)
Yearly cost of BI per young adult * Number of young adults = Yearly cost of BI for young
adults
€5783.16 * 929,428 = €5,375,030,832.48
Unconditional basic income for adults (ages 25 – 64y) (€650.60/month) (2010)
Yearly cost of BI per adult * Number of adults= Yearly cost of BI for adults
€7807.20 * 5,836,162 = €45,564,083,966.40
Unconditional basic income for the elderly (ages 65+) (€963.85/month) (2010)
Yearly cost of BI per senior * Number of seniors = Yearly cost of BI for seniors
In this subsection, I explain how I have revised the values given in a certain basic income
proposal for the year in question to an equivalent value for the year 2010 for Belgium. It is
equivalent in the sense that the purchasing power of the amount of basic income given in
the proposal of the corresponding year is approximately equivalent to the revised amount
of basic income for the year 2010.
I have adopted the following two approaches. First, if the basic income proposal refers to a
certain measure, such as the social integration income and the poverty threshold, it is
relatively straightforward to find data on the measure over time. For this reason, I will
report the value of the applicable measure based on data for the year 2010. Second, in
cases which the basic income proposal does not refer to a certain measure and merely
discloses a number, such as the basic income proposal by Defeyt (2016), I have made an
approximation by applying a formula which incorporates the health index.
(1) The B.U.B. proposal
The first approach is adopted for the B.U.B. proposal. The level of the social integration
income was on average €731 per month in 2010 and the monthly level of the poverty
threshold was at €973 in January 2010. (FOD Economie, K.M.O., Middenstand en Energie,
2016; POD Maatschappelijke Integratie, 2016)
138 | P a g e
(2) The Vivant proposal
The first approach is also adopted for the proposal of Vivant. The amounts of basic income
are expressed by Vivant in certain percentages of the minimum net wage for the year 2002.
The minimum wages, however, are determined at the gross level. Furthermore, given an
equal gross wage, two individuals may still find themselves with a different net wage as the
latter is obtained after a number of deductions (contributions) from the gross wage and the
magnitude of these deductions are partially determined by an individual’s specific
circumstances, such as their household situation. For these reasons, I will express the
percentages in function of the minimum gross wage instead of the unstable minimum net
wage. (FOD Werkgelegenheid, Arbeid en Sociaal Overleg, n.d.; Vivant, n.d.)
The gross monthly average minimum wage was €1152 for the year 2002 and €1388 for the
year 2010 (Eurostat, 2016f).
Unconditional basic income for minors (2002, 2010) (11.72%)
Unconditional basic income for young adults (2002, 2010) (34.73%)
Unconditional basic income for adults (2002, 2010) (46.89%)
Unconditional basic income for the elderly (2002, 2010) (69.47%)
139 | P a g e
(3) The proposal by Defeyt
The revisions of the amounts given by the proposal of Defeyt occur via the second
approach, as he does not explicitly explain how he arrived at the chosen levels of basic
income. He merely discloses that the level of €600 per month for every adult “is chosen
with reference to the social integration income for cohabitating persons” (Defeyt, 2016, p.
8, own translation).
The following formula using the health index is adopted, considering the indexation of
numerous social benefits occurs via a variant of the health index. (Vlaanderen, n.d. c)
16
The arrows are functional in indicating that the time period of the final index corresponds
to that of the indexed amount and that the time period of the initial index corresponds to
that of the amount which is yet to be indexed. (Vlaanderen, n.d. c)
The second formula is applied as the amount to be indexed is unknown. The figures in
Defeyt’s proposal are applicable for the year 2016 and the indexed amount is thus known.
The indexed amounts are €600, €300, and €250 (Defeyt, 2016). The equivalent figures in
terms of purchasing power are not known for the year 2010, explaining why the amount to
be indexed is unknown. The health indices can be found in a dataset provided by Statistics
16 This formula is originally applied in the context of the indexation of alimony which uses the consumption index. However, the formula is also applicable in this context. (Vlaanderen, n.d. c)
140 | P a g e
Belgium (2016b). Using the base year of 200417, the final health index, which is for the year
2016, is 124.81 and the initial health index, which is for the year 2010, is 112.76 (Statistics
Belgium, 2016b). All of this information is inserted in the second formula and the following
equivalent amounts for the year 2010 are obtained.
Unconditional basic income for adults (2010)
Unconditional basic income for minors (2010)
Incentive premium for the unemployed ineligible for unemployment benefits (2010)
(4) The proposal by Raventos et al. (Catalonia → Belgium)
The first approach is adopted for the proposal by Raventos et al. The level of the social
integration income was on average €731 per month in 2010 and the monthly level of the
poverty threshold was at €973 in January 2010. (FOD Economie, K.M.O., Middenstand en
Energie, 2016; POD Maatschappelijke Integratie, 2016)
(5) A modification of the proposal by Raventos et al.
There is no need to revise the amounts of the last discussed basic income proposal as the
amounts are personally suggested.
17
The choice of base year is irrelevant for the estimation. The differences are at most one eurocent for the following calculations.
141 | P a g e
Data references
These calculations are principally based on data provided by the following sources.
Table E7: List of references, categorized by the type of data
Data on the social security expenditures FOD Sociale Zekerheid, (2011, 2012, 2013).
Data on the number of beneficiaries per social benefit
FOD Sociale Zekerheid, (2011, 2012, 2013).
Data on the population and age structure of Belgium
Statistics Belgium, (n.d.; 2016a).
Data on the monthly level of the social integration income of single persons
POD Maatschappelijke Integratie, (2016); and Steunpunt tot bestrijding van armoede, bestaansonzekerheid en sociale uitsluiting, (2016).
Data on the calculated yearly level of the social integration income of single persons and the corresponding monthly average.
Appendix: Part B – Tables, Table B2.
Adapted from POD Maatschappelijke Integratie, (2016); and Steunpunt tot bestrijding van armoede, bestaansonzekerheid en sociale uitsluiting, (2016).
Data on the poverty threshold FOD Economie, K.M.O., Middenstand en Energie, 2016; Steunpunt tot bestrijding van armoede, bestaansonzekerheid en sociale uitsluiting, 2016
Data on the health index Statistics Belgium, (2016b).
Data on the minimum wage Eurostat, (2016f).
142 | P a g e
Declaration on word of honor
I hereby declare that I know what plagiarism entails, namely to use another’s work and to
present it as my own without attributing the sources in the correct way.
I acknowledge that copying someone else's assignment or essay, or part of it, is wrong, and
declare that this is my own work.
I have used the American Psychological Association (APA) as the convention for citation
and referencing. Each significant contribution to, and quotation in, this
essay/report/project/… from the work, or works of other people has been attributed and
has cited and referenced.
This Master’s thesis is my own original work and has not yet been handed in at any other
university, nor had it been published.
I am aware of the consequences of fraud as stated in the exam regulation of the University