Nordson Corporation August 21, 2017 | Fiscal 2017 3Q Results & 4Q Outlook : NDSN A premier industrial technology company focused on precision dispensing, fluid control and related processes Investor Presentation Nordson Corporation
Transcript
Nordson Corporation
August 21, 2017 | Fiscal 2017 3Q Results & 4Q Outlook
: NDSN
A premier industrial technology company
focused on precision dispensing, fluid
control and related processes
Investor Presentation
Nordson Corporation
2
Safe Harbor Statement Under the Private Securities
Litigation Reform Act of 1995
Information in this presentation may contain “forward-looking statements” within the meaning of the U.S. Private Securities Litigation Reform Act of 1995. Forward-looking statements can be identified by words such as “may,” “will,” “should,” “expects,” “intends,” “plans,” “anticipates,” “believes,” “estimates,” “predicts,” “projects,” or “potential” or the negative of these words and phrases or similar words or phrases which are predictions of or indicate future events or trends and which do not relate solely to historical matters.
All statements regarding our future performance, earnings projections, events or developments are forward-looking statements. These forward-looking statements are made based on known events and circumstances at the time of release, and as such, are subject in the future to unforeseen uncertainties and risks that could cause actual results to differ materially from those contained in any forward-looking statement. Such risks and uncertainties are described under “Risk Factors” in Item 1A of our annual report on Form 10-K and any updates to those factors set forth in our subsequent quarterly reports on Form 10-Q or current reports on Form 8-K. We make these statements as of the date of this disclosure, and undertake no obligation to update them unless otherwise required by law.
Nordson at a GlanceA premier industrial technology company focused on precision dispensing,
fluid control and related processes
3
Founded in 1954
FY16 sales = $1.8 billion
7,200 employees
Direct presence in 35+ countries
Best-in-class technology
Diversified, growing end markets
Market leading positions
Sustained financial performance
Outstanding long-term returns
Parts & Consumables
40%
Standard Product
39%
Engineered Systems
21%
4
USA29%
Americas7%
Europe28%
Japan7%
Asia Pacific29%
Product Type
High percentage of
recurring revenue
from parts and
consumables
Diversified Sources of RevenueFY2016 Profile - $1.8 billion
Industrial Coating
14%
Advanced Technology
37%
Adhesive Dispensing
49%
Consumer Non-Durables
38%
Consumer Durables
17%
Industrial6%
Automotive7%
Medical8%
Electronic Components
9%
Semiconductor6%
PCB Assembly9%
Geography
Very global. 71% of
revenue outside USA.
Direct presence in
nearly 40 countries.
Diverse End Markets
Consumer non-durables,
durables, industrial,
medical and technology
Operating Segments
Three segments with leading
product lines and brands
Investment Highlights
5
8%
CAGR
2011-2016
Strong
growth:
organic and
acquisitive
Excellent
operating
margins
Strong cash
returns to
shareholders
Reliable and
consistent
dividend
Outstanding
long term
Total
Shareholder
Returns
22%
Operating
Margin
Average
2011-2016
$1.1 billion
Share
repurchases &
dividends
2011-2016
53 Yearsof annual
increases
(21% payout
ratio in 2016)
$1.4 billion
101% of
net income
2011-2016
High level of
free cash
flow before
dividends
124%
TSR*
2011-2016
Outstanding
gross
margins
57%
Gross
Margin
Average
2011-2016
*((Share Price at 10/31/2016 – Share Price at 10/31/2011 + dividends) / Share Price at 10/31/2011 ) = (($100.13 - $46.37 + $3.81) / $46.37 ) = 1.24 = 124%
Assumes $100 invested on 11/1/2011, dividends reinvested, fiscal year ending 10/31/2016Source:
Why invest in Nordson?
7
Outstanding Culture and Values
Leading Global Businesses
Clear Strategy and Goals
Strong Execution and Performance
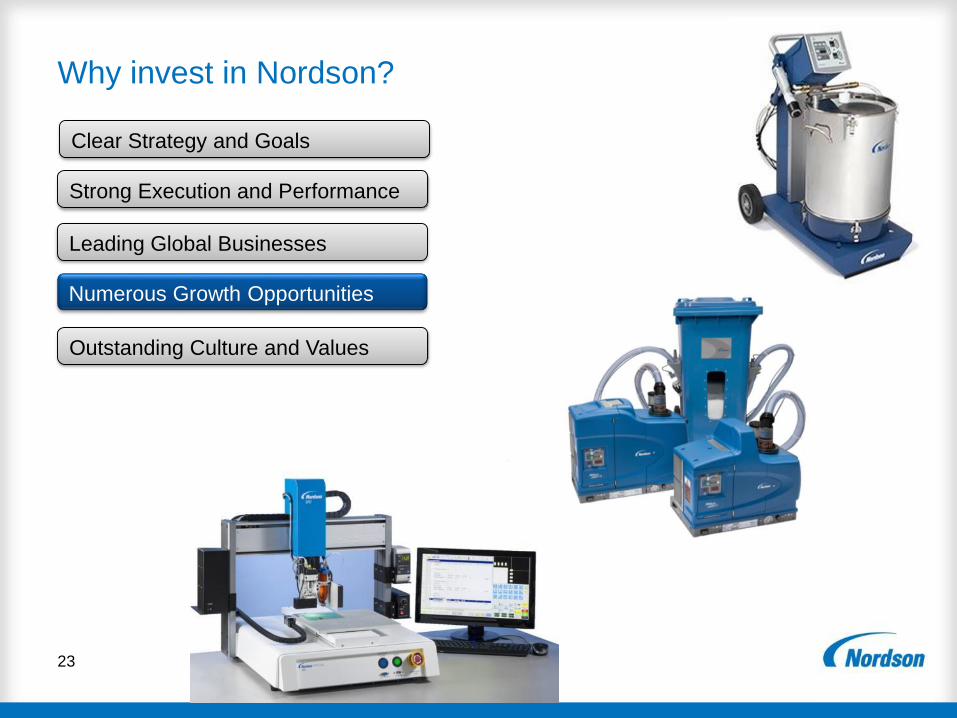
Numerous Growth Opportunities
Common Themes of our 2017-2022 Strategic Plan Continue to be a Premier Industrial Technology Company
Product innovation
New applications
Emerging markets
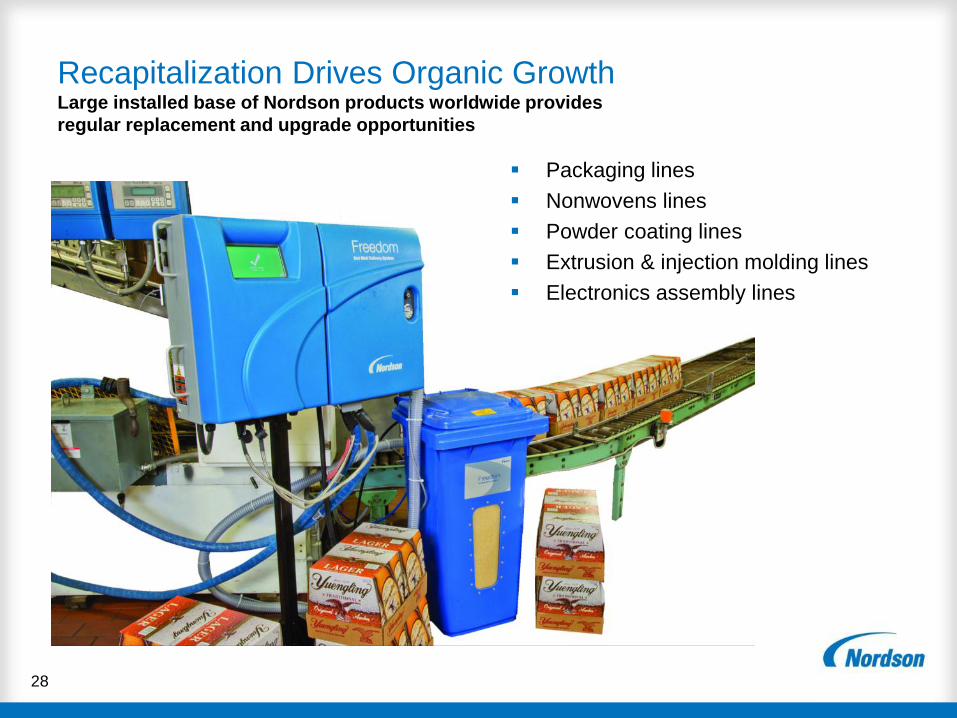
Recapitalize
installed base
Segmentation
Accelerate
organic
growth
Embed Nordson
Business System
Expand margins
Working capital
initiatives
Drive synergies
with acquisitions
Further
optimize our
business
Targeted spaces
Growth and
technology
Cultivate
proprietary deals
Execute and close
deals effectively
Disciplined pricing
Fast integration
Add key
acquisitions
Deepen bench
strength
Leadership
development
Rotational
assignments
Diversity
Enhance
and expand
organization
capability
Deliver top quartile total shareholder returns
Support our communities & good corporate citizenship
Revenue Operating Profit
2017-22 Strategic Plan TargetsFocused initiatives drive premium sales growth and expand profitability
~2x global GDP%
Outpace Revenue
Growth %
Underlying
Markets
Growth
Initiatives
Continuous
Improvement
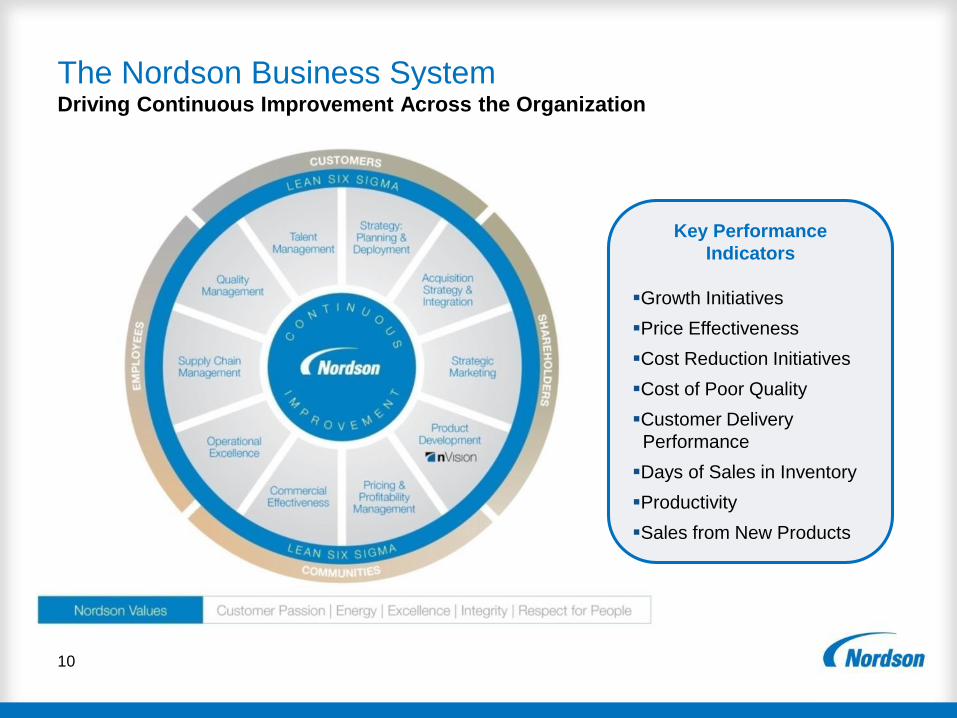
The Nordson Business System Driving Continuous Improvement Across the Organization
10
Key Performance
Indicators
Growth Initiatives
Price Effectiveness
Cost Reduction Initiatives
Cost of Poor Quality
Customer Delivery
Performance
Days of Sales in Inventory
Productivity
Sales from New Products
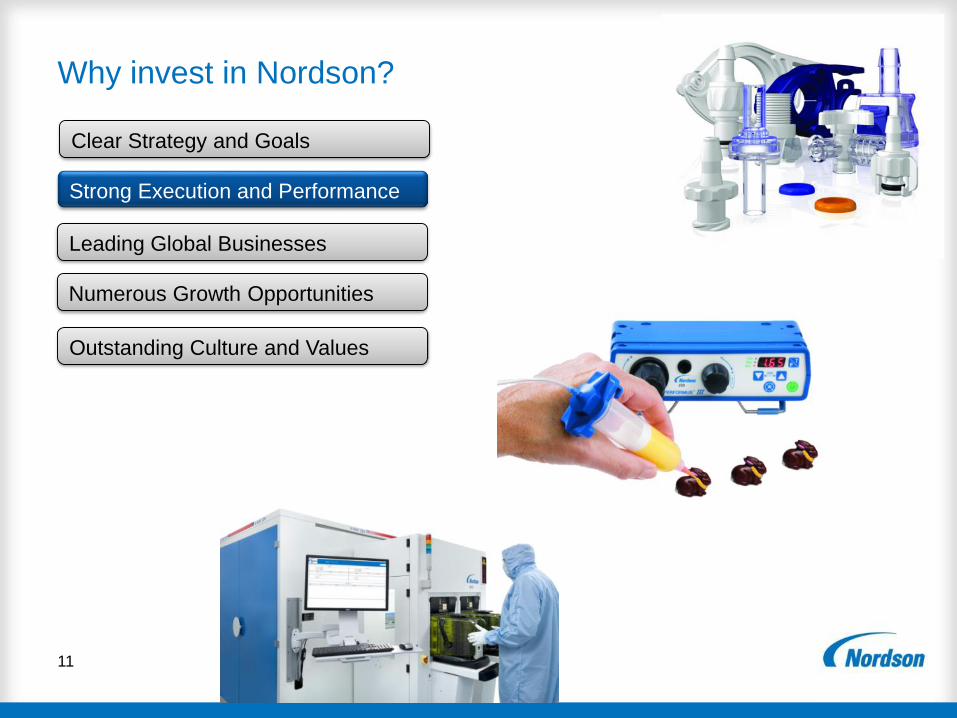
Why invest in Nordson?
11
Outstanding Culture and Values
Leading Global Businesses
Clear Strategy and Goals
Strong Execution and Performance
Numerous Growth Opportunities
0
300
600
900
1,200
1,500
1,800
2,100
'06 '07 '08 '09 '10 '11 '12 '13 '14 '15 '16
0%
5%
10%
15%
20%
25%
30%
06 07 08 09* 10 11 12 13 14 15 16
12
Strong Top Line Growthorganic and acquisitive
0%
10%
20%
30%
40%
50%
60%
70%
06 07 08 09 10 11 12 13 14 15 16
Industry Leading Gross MarginsConsistently mid 50s and above
Mill
ions o
f $
Financial Highlights
*FY09 excludes non-cash charges for impairment of goodwill and other long-lived assets. FY15 results impacted by significant negative currency translation effects compared to the prior year. source – NDSN SEC filings
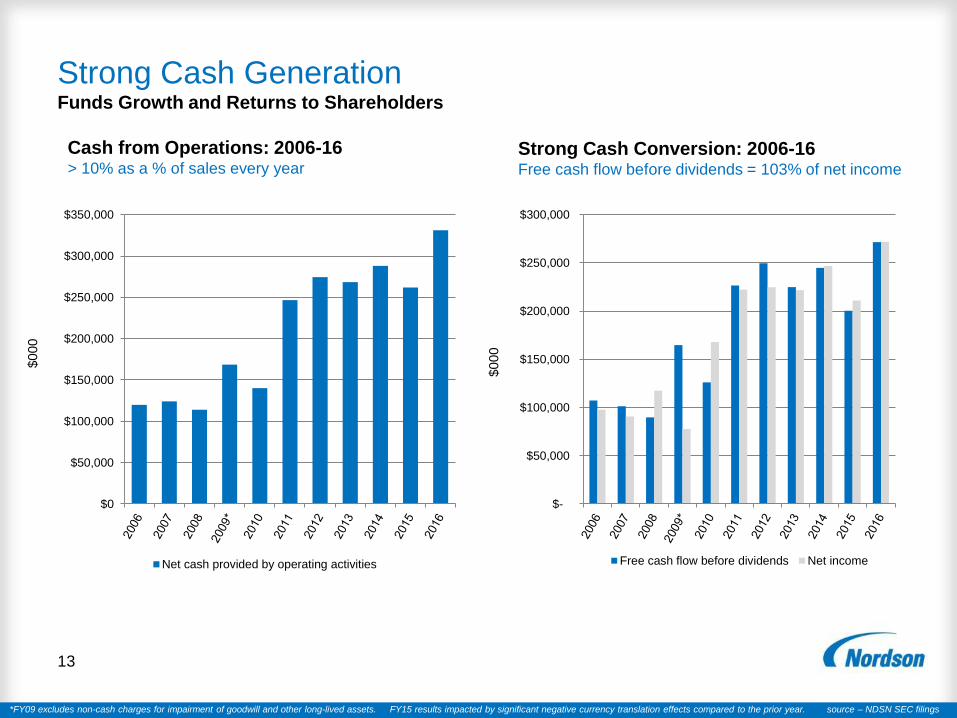
Strong Cash Generation Funds Growth and Returns to Shareholders
13
Strong Cash Conversion: 2006-16Free cash flow before dividends = 103% of net income
Cash from Operations: 2006-16> 10% as a % of sales every year
$000
$000
$0
$50,000
$100,000
$150,000
$200,000
$250,000
$300,000
$350,000
Net cash provided by operating activities
$-
$50,000
$100,000
$150,000
$200,000
$250,000
$300,000
Free cash flow before dividends Net income
*FY09 excludes non-cash charges for impairment of goodwill and other long-lived assets. FY15 results impacted by significant negative currency translation effects compared to the prior year. source – NDSN SEC filings
$24.8 $30.0
$49.2 $49.1 $66.7
$64.6
$284.4
$293.0
$441.7 $176.3
$186.4
$75.6
$42.7
$1,215.7
$29.8
$33.8
$40.5
$48.4
$54.8
$56.4
$263.7
$138.0
$88.5 $33.4
$166.4
$383.9
$33.4 $843.6
$28.5 $20.2 $25.8 $40.6 $37.7
$21.3 $174.1
0%
10%
20%
30%
40%
50%
60%
70%
80%
90%
100%
2011 2012 2013 2014 2015 2016 TOTAL
Disciplined Capital Deployment
14
PP&E/Leases
10%
Acquisitions
44%
Dividends
10%
Share Repur.
30%
Working Cap.
6%
40% or $1.1 billion
to shareholders via share repurchases
and dividends
Self funding business model generates excess cash
Low Working Capital Requirements
Low Capital Expenditures (approx. 3% of sales)
Strong free cash
54 consecutive years of dividend increases - 14th among publicly traded companies
$ millions
0.0
0.5
1.0
1.5
2.0
2.5
3.0
3.5
4.0
20
01
20
02
20
03
20
04
20
05
20
06
20
07
20
08
20
09
20
10
20
11
20
12
20
13
20
14
20
15
20
16
15
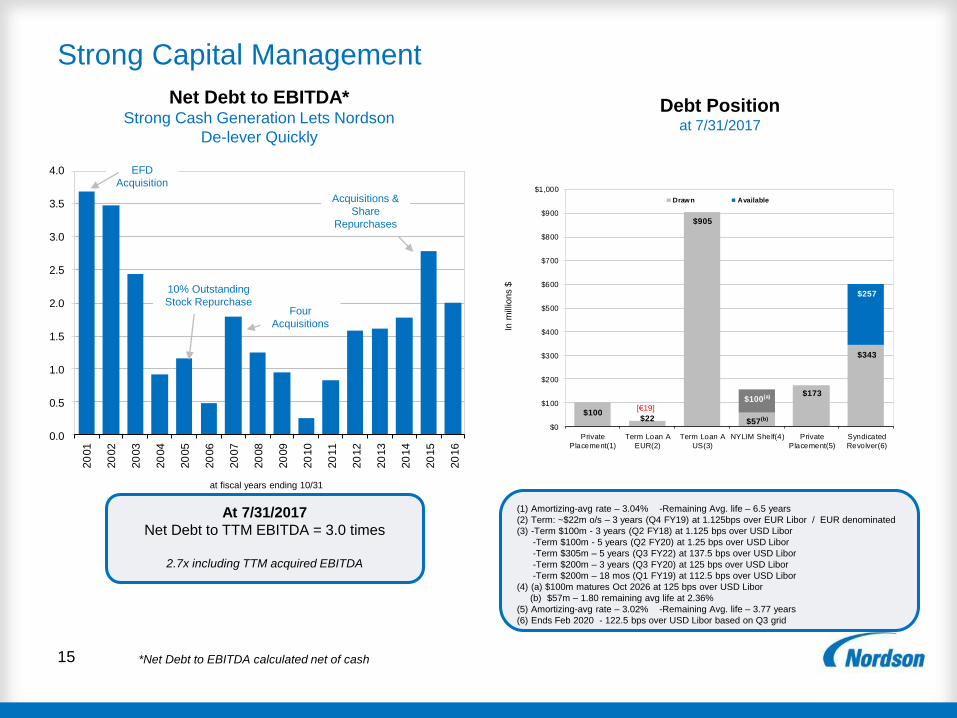
Strong Capital Management
Four
Acquisitions
10% Outstanding
Stock Repurchase
$100$22
$905
$57(b)
$173
$343
$100(a)
$257
$0
$100
$200
$300
$400
$500
$600
$700
$800
$900
$1,000
Private
Placement(1)
Term Loan A
EUR(2)
Term Loan A
US(3)
NYLIM Shelf(4) Private
Placement(5)
Syndicated
Revolver(6)
Drawn Available
Net Debt to EBITDA*Strong Cash Generation Lets Nordson
De-lever Quickly
EFD
Acquisition
*Net Debt to EBITDA calculated net of cash
In m
illio
ns $
Acquisitions &
Share
Repurchases
at fiscal years ending 10/31
Debt Positionat 7/31/2017
[€19]
At 7/31/2017
Net Debt to TTM EBITDA = 3.0 times
2.7x including TTM acquired EBITDA
(1) Amortizing-avg rate – 3.04% -Remaining Avg. life – 6.5 years
(2) Term: ~$22m o/s – 3 years (Q4 FY19) at 1.125bps over EUR Libor / EUR denominated
(3) -Term $100m - 3 years (Q2 FY18) at 1.125 bps over USD Libor
-Term $100m - 5 years (Q2 FY20) at 1.25 bps over USD Libor
-Term $305m – 5 years (Q3 FY22) at 137.5 bps over USD Libor
-Term $200m – 3 years (Q3 FY20) at 125 bps over USD Libor
-Term $200m – 18 mos (Q1 FY19) at 112.5 bps over USD Libor
(4) (a) $100m matures Oct 2026 at 125 bps over USD Libor
(b) $57m – 1.80 remaining avg life at 2.36%
(5) Amortizing-avg rate – 3.02% -Remaining Avg. life – 3.77 years
(6) Ends Feb 2020 - 122.5 bps over USD Libor based on Q3 grid
Fiscal Year 2017 3Q Results and 4Q Guidanceas reported in August 21-22, 2017 press release and webcast
16
Nordson Corporation Reports Record Quarterly Revenue, Operating Profit, Diluted EPS
and EBITDA in Third Quarter of Fiscal Year 2017
Sales increase 20 percent from prior year’s third quarter to $589 million, with all three segments contributing to
11 percent organic growth
Operating profit increases 24 percent to $153 million and operating margin improves by 1 percentage point to
26 percent, both compared to the prior year’s third quarter and both inclusive of $6 million of intangible asset
amortization expense for fiscal 2017 acquisitions
GAAP diluted EPS increases 19 percent to $1.74 and adjusted diluted EPS increases 21 percent to $1.78,
both compared to the prior year’s third quarter
EBITDA increases 29 percent to $179 million, EBITDA margin improves 2 percentage points to 30 percent,
and EBITDA per diluted share increases 27 percent to $3.08, all compared to the prior year’s third quarter
Free cash flow before dividends increases 14 percent compared to the prior year’s third quarter to $55 million
Order Rates and Guidance
Pro-forma 12 week order rates decrease 2 percent over same period a year ago
Fourth quarter 2017 guidance: sales expected to increase 4 to 8 percent over prior year; GAAP diluted EPS in the
range of $1.18 to $1.32; EBITDA in the range of $133 to $144 million, or $2.27 to $2.46 per diluted share
See Nordson press release, conference call transcript, presentation Appendix, and SEC filings reconciling adjusted amounts to reported amounts
Why invest in Nordson?
17
Outstanding Culture and Values
Leading Global Businesses
Clear Strategy and Goals
Strong Execution and Performance
Numerous Growth Opportunities
We Win with Unique Competitive AdvantagesCommon across our businesses
Strategic Assets
Customer relationships with leaders
Product breadth
Technology position
Premier brand reputation
Large installed product base
Global footprint (distribution, support)
Balance sheet / ability to scale production
Core Competencies
Application development
Precision manufacturing
Engineering strength
Technical expertise
Direct global sales and service
Customer “touch” / solutions provider
18
Customer Value Proposition
Product reliability = more uptime
Speed = greater productivity and yield
Efficiency = lower material usage
Leading product features = ease of operation
Unmatched global support
Lower Cost of
Ownership
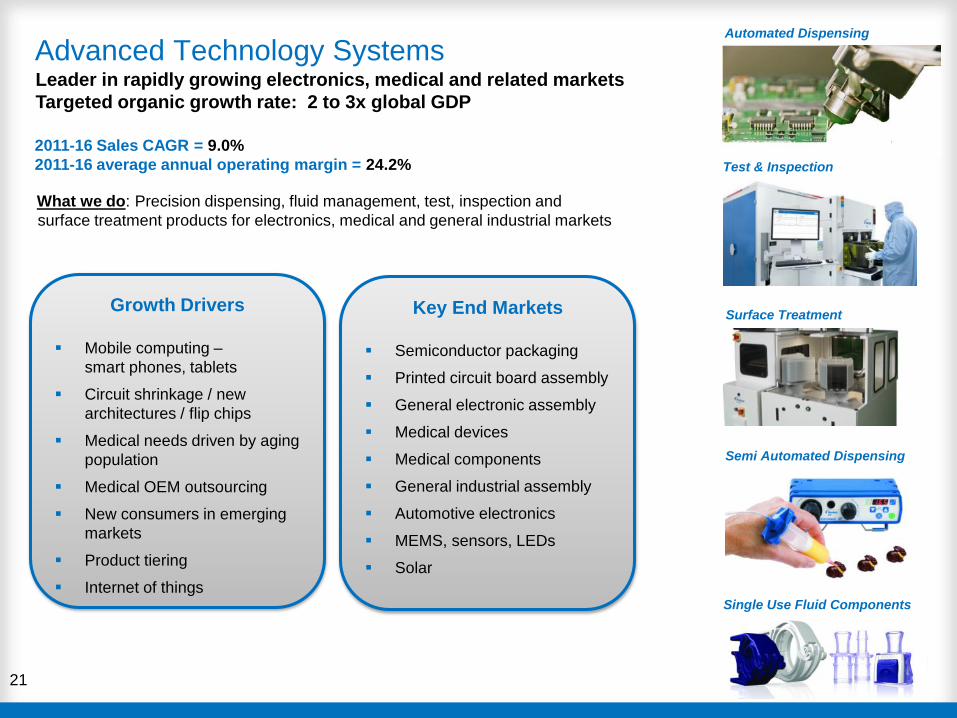
Industrial Coating Systems: durable goods and industrial market focus
Advanced Technology Systems: electronics, medical and industrial market focus
Innovation Drives Organic GrowthSteady stream of new products
25
Granted
Emerging Markets Drive Organic GrowthGrowing middle class drives increased consumption
26
baby diapers, disposable hygiene products
packaged foods, beverages, convenience items
appliances and other durable goods
electronic devices
medical products
plastic goods
$-
$100,000
$200,000
$300,000
$400,000
$500,000
$600,000
$700,000
2006 2011 2016
Asia Pacific Americas
Nordson Sales (000s)
• Americas reporting includes Canada, but not US -Asia Pacific excludes Japan -Eastern Europe, Middle East and Africa are reported in Europe and not broken out separately
Biopharmaceuticals
Orthobiologics
Minimally invasive catheters
Bottle labeling
Pipe coating
Flexible packaging
New Applications Drive Organic GrowthLeveraging our expertise – numerous emerging opportunities over last five years
Total Sales by Geographic Region 589,438$ 489,899$ 20.7% -0.4% 20.3% 1,493,044$ 1,299,711$ 16.0% -1.1% 14.9%
Year-to-Date
FREE CASH FLOW BEFORE DIVIDENDS 2017 2016 2017 2016
Net income 101,456$ 84,214$ 215,967$ 195,976$
Depreciation and amortization 25,954 17,662 65,366 52,824
Other non-cash charges (8,592) 4,455 3,041 13,213
Changes in operating assets and liabilities (41,991) (38,485) (68,183) (67,279)
Net cash provided by operating activities 76,827 67,846 216,191 194,734
Additions to property, plant and equipment (22,295) (19,931) (49,324) (45,452)
Proceeds from the sale of property, plant and equipment 308 173 3,906 1,044
Free cash flow before dividends 54,840$ 48,088$ 170,773$ 150,326$
Adjustments:
Acquisition costs and adjustments, net of tax (1) 1,597 - 12,564 1,325
Free cash flow before dividends, adjusted 56,437$ 48,088$ 183,337$ 151,651$
(1) Represents one-time costs, net of tax, associated with our 2017 and 2016 acquisitions, including the step up in the value of acquired inventory and acquisition
transaction costs that are required to be expensed as incurred.
Third Quarter Year-to-Date
Third Quarter
38 |
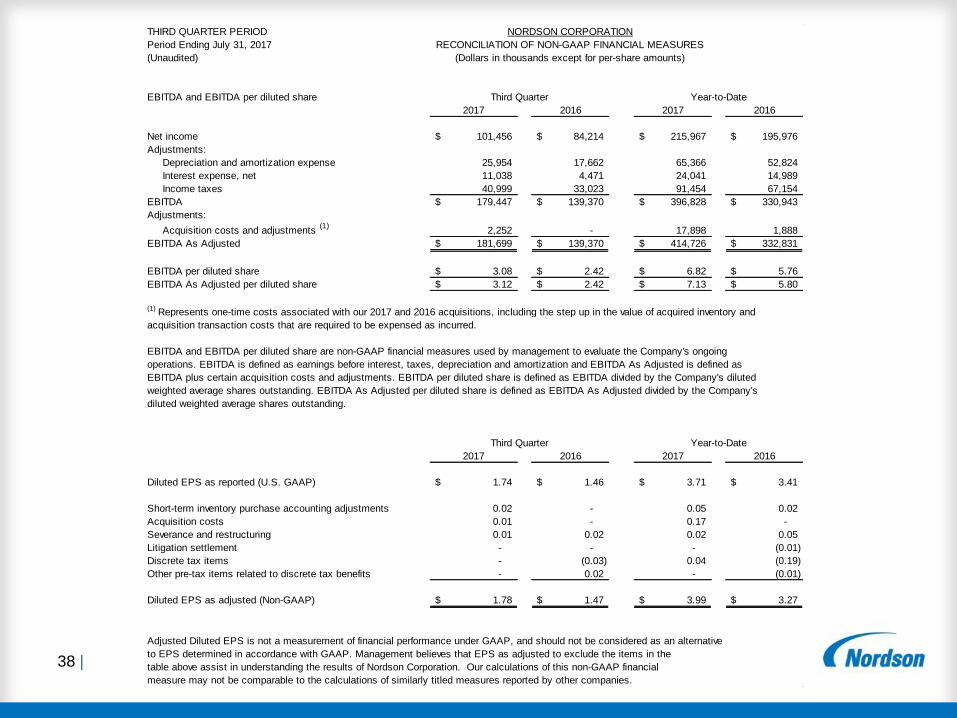
THIRD QUARTER PERIOD NORDSON CORPORATION
Period Ending July 31, 2017 RECONCILIATION OF NON-GAAP FINANCIAL MEASURES
(Unaudited) (Dollars in thousands except for per-share amounts)
EBITDA and EBITDA per diluted share Third Quarter Year-to-Date
2017 2016 2017 2016
Net income 101,456$ 84,214$ 215,967$ 195,976$
Adjustments:
Depreciation and amortization expense 25,954 17,662 65,366 52,824
Interest expense, net 11,038 4,471 24,041 14,989
Income taxes 40,999 33,023 91,454 67,154
EBITDA 179,447$ 139,370$ 396,828$ 330,943$
Adjustments:
Acquisition costs and adjustments (1)
2,252 - 17,898 1,888
EBITDA As Adjusted 181,699$ 139,370$ 414,726$ 332,831$
EBITDA per diluted share 3.08$ 2.42$ 6.82$ 5.76$
EBITDA As Adjusted per diluted share 3.12$ 2.42$ 7.13$ 5.80$
(1) Represents one-time costs associated with our 2017 and 2016 acquisitions, including the step up in the value of acquired inventory and
acquisition transaction costs that are required to be expensed as incurred.
EBITDA and EBITDA per diluted share are non-GAAP financial measures used by management to evaluate the Company's ongoing
operations. EBITDA is defined as earnings before interest, taxes, depreciation and amortization and EBITDA As Adjusted is defined as
EBITDA plus certain acquisition costs and adjustments. EBITDA per diluted share is defined as EBITDA divided by the Company's diluted
weighted average shares outstanding. EBITDA As Adjusted per diluted share is defined as EBITDA As Adjusted divided by the Company's
diluted weighted average shares outstanding.
Third Quarter Year-to-Date
2017 2016 2017 2016
Diluted EPS as reported (U.S. GAAP) 1.74$ 1.46$ 3.71$ 3.41$