A Profile of Minnesota Clinical Laboratory Employment and Operations January 2005 Office of Rural Health & Primary Care P.O. Box 64882 St. Paul, MN 55164-0882 www.health.state.mn.us Phone: (651) 282-5642 Toll free: (800) 366-5424 Fax: (651) 297-5808 TDD: (800) 627-3529
Transcript
A Profile of Minnesota Clinical Laboratory Employment and Operations
January 2005
Office of Rural Health & Primary Care P.O. Box 64882 St. Paul, MN 55164-0882www.health.state.mn.us
Figure 1: United States Health Occupation Vacancy Rates, 2002-2003 .................................. 8 Figure 2: Minnesota Health Occupation Vacancy Rate, 2000-2004 ........................................ 9 Figure 3: Minnesota Estimated Laboratory Wages, Third Quarter 2004 ............................... 10 Figure 4: Wages and Employment for Selected Health Care Occupations ............................ 10 Figure 5: Survey Responses by Number of Employees ......................................................... 12 Figure 6: Laboratory Employees Reported by Job Title......................................................... 13 Figure 7: Clinical Labs by Type of Institutional Affiliation................................................... 14 Figure 8: Lab Facility Respondents by Type and Size ........................................................... 14 Figure 9: Hospital-Affiliated Labs by Hospital Size .............................................................. 15 Figure 10: Clinic Labs and Physician-Provider Labs by Number of Physicians Served ....... 15 Figure 11: Labs Affiliated With Integrated Health Care Systems.......................................... 15 Figure 12: Profile of Employment for 408 Respondent Labs................................................. 16 Figure 13: Selected Employment Ratios for Laboratory Occupation..................................... 17 Figure 14: Difficulty of Filling Vacancies.............................................................................. 19 Figure 15: Work Experience Required for Selected Positions ............................................... 20 Figure 16: Hourly Wages Offered for Positions Vacant in 2003 ........................................... 20
: Benefits Offered for Vacant Positions .................................................................. 21Figure 17Figure 18: Billable Anatomic Lab Tests by Lab Type ........................................................... 22 Figure 19: Billable Clinical Lab Tests by Lab Type .............................................................. 23
: Percent of Labs With Electronic and Automated Procedures ............................... 24Figure 20Figure 21: Automated Procedures: Comparison of Reference Labs With Other Labs .......... 24
3
Summary
The Office of Rural Health and Primary Care of the Minnesota Department of Health conducted two surveys in 2003 and 2004 to gather information on the clinical laboratory workforce in Minnesota. The surveys, funded in part with bioterrorism planning money from the Centers for Disease Control and Prevention, were undertaken because of concern about a shortage of clinical laboratory workers. Shortages can impact patient care through delays, errors associated with heavier workloads, and increased costs—either through higher salaries or the need for labs to send specimens to outside reference labs.
Findings from the two surveys will help the Minnesota Department of Health, industry groups and higher education officials identify workforce planning issues and develop strategies to ensure adequate numbers of well-trained clinical laboratory workers.
This report describes findings from the first survey, which asked managers in 851 Clinical Laboratory Improvement Amendment-licensed laboratories about employment, recruitment and lab operations.
In Phase II, a follow-up survey was sent to employees in the 408 laboratories that responded to the Phase I survey. The surveys asked about employees’ education and training, conditions of employment, job satisfaction and career plans. The Phase II report will be released in early 2005.
Findings • Laboratory workforce shortages rose sharply in the late 1990s, but declined by 2002
and 2003. Minnesota vacancy rates for clinical laboratory technicians fell from 10.3 percent in late 2001 to 3.0 percent in 2004. The vacancy rate for technologists fell from 5.3 percent to 1.3 percent.
• Clinical laboratory jobs pay better than most Minnesota jobs. Median hourly wages for technologists and technicians were $22.47 and $17.62, respectively in 2004, compared to $15.19 for all Minnesota occupations.
• Most Minnesota clinical laboratories are associated with health care clinics (43 percent) or hospitals (33 percent).
• Despite data indicating a decline in vacancy rates, many Minnesota labs report difficulty in filling positions. One-fourth of labs reporting clinical laboratory technician vacancies said they had been vacant more than six months. One-third of labs with technologist positions open said they were open more than six months. Labs reported less trouble filling phlebotomist and laboratory assistant positions.
• Overall, respondents report hiring more employees than they lost in 2002. Departing employees represented a turnover rate of 12 percent, but reported turnover was much higher for some occupations.
4
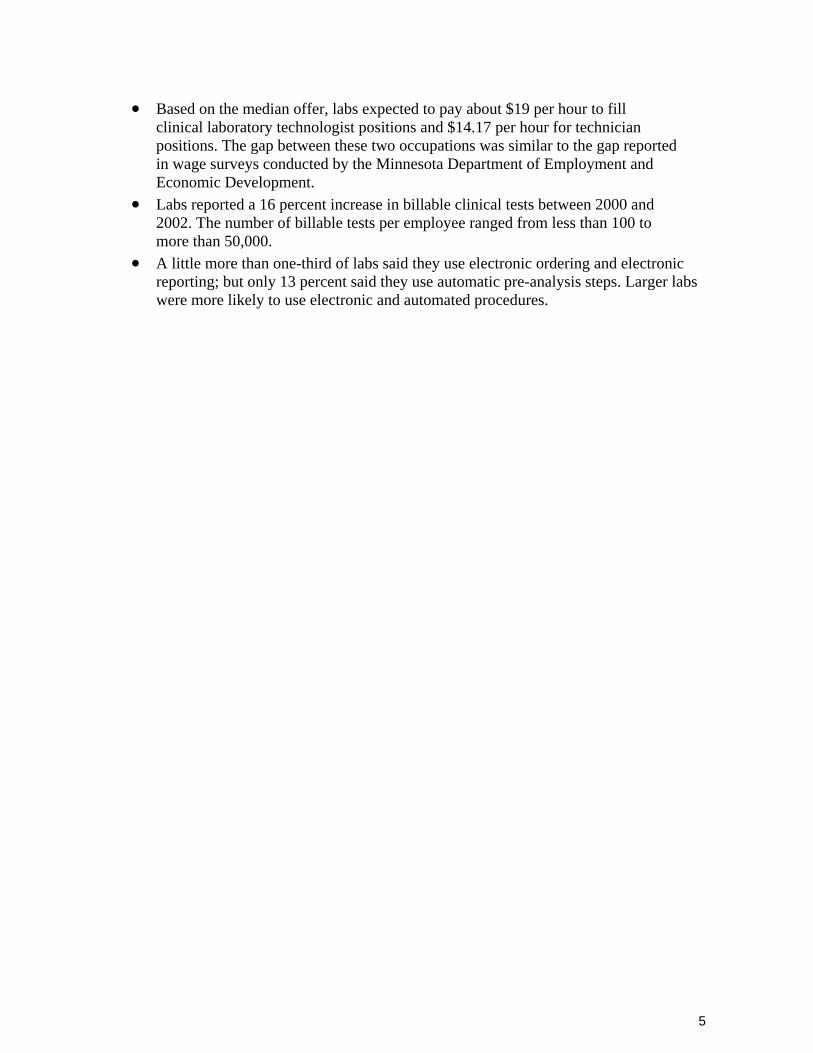
• Based on the median offer, labs expected to pay about $19 per hour to fill clinical laboratory technologist positions and $14.17 per hour for technician positions. The gap between these two occupations was similar to the gap reported in wage surveys conducted by the Minnesota Department of Employment and Economic Development.
• Labs reported a 16 percent increase in billable clinical tests between 2000 and 2002. The number of billable tests per employee ranged from less than 100 to more than 50,000.
• A little more than one-third of labs said they use electronic ordering and electronic reporting; but only 13 percent said they use automatic pre-analysis steps. Larger labs were more likely to use electronic and automated procedures.
5
Introduction
The Office of Rural Health and Primary Care of the Minnesota Department of Health conducted two surveys in 2003 and 2004 to gather information on the clinical laboratory workforce in Minnesota. The surveys were in response to industry concerns about shortages of clinical laboratory personnel and questions about the preparedness of Minnesota’s clinical laboratories to respond to bioterrorism. The project was funded in part with bioterrorism planning money from the Centers for Disease Control and Prevention.
The first survey asked managers in 851 Clinical Laboratory Improvement Amendment (CLIA)-certified laboratories about employment, recruitment and lab operations. The second survey was sent to employees in the 408 laboratories that responded to the Phase I survey. It asked about education and training, conditions of employment, job satisfaction and career plans. Results from the second survey will be available in early 2005. Because lab workers are not licensed, there is no readily available address list for them. To survey lab workers, it was necessary to send questionnaires to laboratory managers and ask them to distribute them to employees.
This report presents findings from the first survey. It also includes information on employment, vacancy rates and wages from other sources needed to interpret the survey results.
Clinical laboratory workers are part of the underlying support structure helping direct care professionals. They sample and analyze body fluids, tissues and cells, which help physicians diagnose diseases and monitor treatments. Tests performed by lab workers are critically important for accurate and timely diagnosis of patient conditions.
The U.S. Bureau of Labor Statistics estimated that there were more than 6,510 clinical laboratory technologists and technicians in Minnesota in 2003. Clinical laboratory technologists are also known as clinical laboratory scientists or medical technologists. Clinical laboratory technicians are sometimes known as medical laboratory technicians. Other laboratory workers include phlebotomists, cytotechnologists, histotechnologists, histotechnology technicians, certified medical assistants and others. The size of the laboratory workforce in Minnesota compares to fewer than 4,000 family and general practitioners, internists, pediatricians, obstetricians and gynecologists combined.
6
Workforce Shortages Job vacancy rates can be used to track trends in the supply and demand of employees. Data collected by the American Society for Clinical Pathology (ASCP) and the Minnesota Department of Employment and Economic Development for selected laboratory occupations show a sharp upturn in vacancy rates in the late 1990s, followed by declining rates by 2002 and 2003.
Nationwide Beginning in the late 1990s, there was growing concern about a shortage of clinical laboratory workers. Shortages may affect patient care through delays and errors associated with heavier workloads. They can also put upward pressure on costs, either through higher salaries or the need for labs to send specimens to outside reference labs.
Based on national surveys by ASCP, vacancy rates for laboratory occupations rose sharply between 1996 and 2000, but fell back below 1996 levels by 2002 and 2003.i The vacancy rate for medical laboratory technicians increased from 9.4 to 14.3 percent. For medical laboratory technologists, the rate increased from 8.2 to 11.1 percent between 1996 and 2000. The surveys recorded even larger vacancy rates for other laboratory occupations. For example, the histotechnologist vacancy rate jumped from 5.4 to 22.3 percent.
Some of the worry about shortages was caused by loss of postsecondary training programs. Nationwide, there were 208 fewer programs training clinical laboratory scientists, clinical laboratory technicians, cytotechnologists and phlebotomists in 2004 than in 1995. By comparison, the total number of accredited or approved programs for all health occupations grew by more than 800. There were barely half as many clinical lab education programs in 2003 as in 1985. ii
The high vacancy rates caused alarm, and the September 2001 terrorist attacks raised concerns about the preparedness of the industry to collect, transport and evaluate pathogens in the event of a bioterrorist attack. However, ASCP’s 2001 survey of medical laboratory science education programs found a slowing of program closures and an increase in enrollments that held promise for increasing the number of graduates.
Indeed, vacancy rates fell by 2002 and continued to decline in 2003. From 2002 to 2003, the overall number of budgeted staff, supervisory and management positions increased, and the number of vacancies decreased, yielding a lower overall vacancy rate. Vacancy rates for medical technologists and technicians fell to 4.3 and 5.4 percent, respectively. Vacancy rates for phlebotomists, histotechnologists and cytotechnologists also fell to their lowest levels since before 1996.iii
7
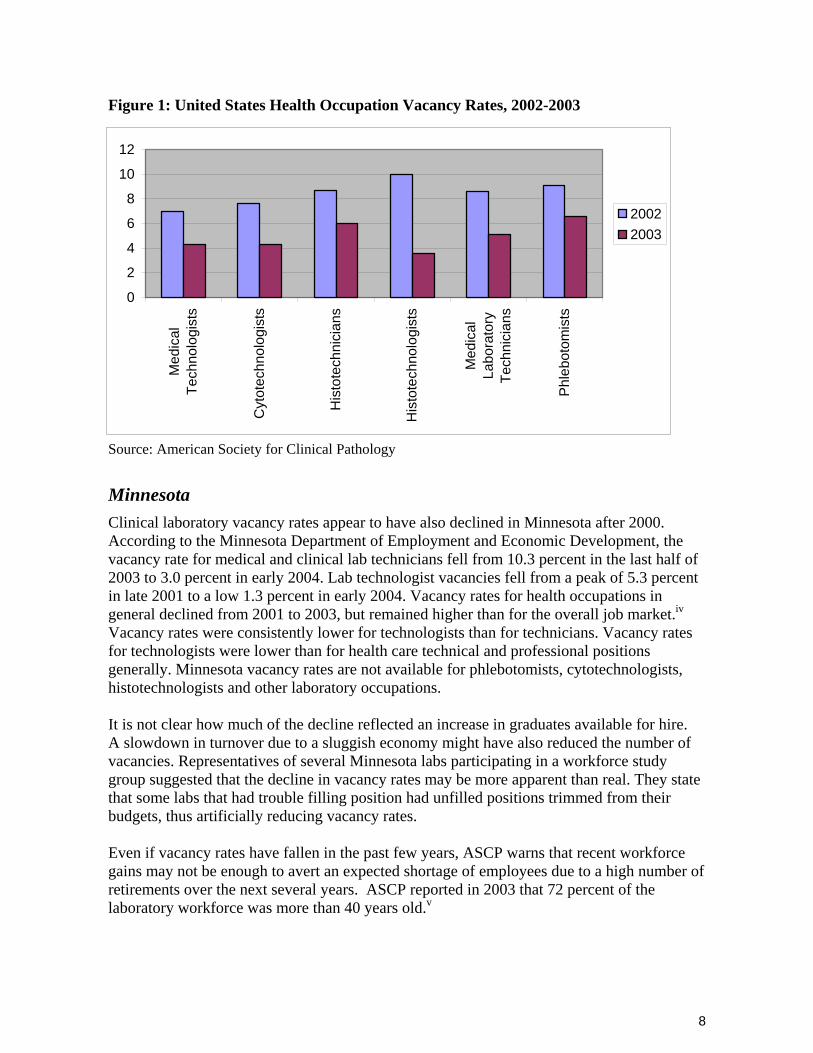
Figure 1: United States Health Occupation Vacancy Rates, 2002-2003
0
2
4
6
8
10
12
li i
2002 2003
Med
ical
Tech
nolo
gist
s
Cyt
otec
hno
ogst
s
His
tote
chni
cian
s
His
tote
chno
logi
sts
Med
ical
Labo
rato
ry
Tech
nici
ans
Phl
ebot
omst
s
Source: American Society for Clinical Pathology
Minnesota Clinical laboratory vacancy rates appear to have also declined in Minnesota after 2000. According to the Minnesota Department of Employment and Economic Development, the vacancy rate for medical and clinical lab technicians fell from 10.3 percent in the last half of 2003 to 3.0 percent in early 2004. Lab technologist vacancies fell from a peak of 5.3 percent in late 2001 to a low 1.3 percent in early 2004. Vacancy rates for health occupations in general declined from 2001 to 2003, but remained higher than for the overall job market.iv
Vacancy rates were consistently lower for technologists than for technicians. Vacancy rates for technologists were lower than for health care technical and professional positions generally. Minnesota vacancy rates are not available for phlebotomists, cytotechnologists, histotechnologists and other laboratory occupations.
It is not clear how much of the decline reflected an increase in graduates available for hire. A slowdown in turnover due to a sluggish economy might have also reduced the number of vacancies. Representatives of several Minnesota labs participating in a workforce study group suggested that the decline in vacancy rates may be more apparent than real. They state that some labs that had trouble filling position had unfilled positions trimmed from their budgets, thus artificially reducing vacancy rates.
Even if vacancy rates have fallen in the past few years, ASCP warns that recent workforce gains may not be enough to avert an expected shortage of employees due to a high number of retirements over the next several years. ASCP reported in 2003 that 72 percent of the laboratory workforce was more than 40 years old.v
8
Figure 2: Minnesota Health Occupation Vacancy Rate, 2000-2004
9.0% 8.0% 7.0% 6.0% 5.0% 4.0% 3.0% 2.0% 1.0% 0.0%
2000
4th Qtr
2001
2nd Qtr
2001
4th Qtr
2002
2nd Qtr
2002
4th Qtr
2003
2nd Qtr
2003
4th Qtr
2004
2nd Qtr
All ion
il
l
Occupat
Health Care Profess onal and TechnicaHea th Care Support
Source: Minnesota Department of Employment and Economic Development, Job Vacancy Survey
Clinical Laboratory Wages According to the Minnesota Department of Employment and Economic Development, medical and clinical laboratory technologists and technicians earn more than most Minnesotans. The estimated median hourly wage for the third quarter of 2004 was $17.62 for laboratory technicians and $22.47 for laboratory technologists (or scientists), compared to $15.19 for all Minnesota occupations. For a 52-week year of 40-hour workweeks, pay for Minnesota technicians and technologists would be about $36,650 and $46,750, respectively.
Technologist positions, which require four-year degrees, pay about 30 percent more than technician positions, which require two-year degrees. Medical transcriptionist is the only other lab occupation for which wage data is available and they receive slightly less than the median for all occupations in Minnesota.
Minnesota wages for technologists, technicians and medical transcriptionists are somewhat higher than for the same occupations nationally. Median wages for Minnesota laboratory technicians run 16 percent above national rates, but Minnesota lab technologists make only about 3 percent more than technologists nationally. Medical transcriptionists in Minnesota make about 7 percent more than the national rate.
9
Figure 3: Minnesota Estimated Laboratory Wages, Third Quarter 2004
All i
ll i
li
i l ipti
MN
$15.19
$22.47
$17.62
$14.63
$13.99
$21.91
$14.87
$13.72
$0.00 $5.00 $10.00 $15.00 $20.00 $25.00
occupat ons
aboratory techno og sts
aboratory technic ans
med catranscr onists
U.S.
Source: Minnesota Department of Employment and Economic Development
Although better paying than most Minnesota occupations, clinical lab positions are not among the highest paid Minnesota health care occupations. Radiation therapists, physical therapists, dental hygienists and sonographers all make more. On the other hand, clinical lab technologists and technicians earn more than emergency medical technicians, nursing aides and pharmacy aides.
Figure 4: Wages and Employment for Selected Health Care Occupations Occupation U. S. Median
Hourly wage May 2004*
Minnesota Median Hourly Wage May 2004*
Minnesota Employment May 2003
Radiation Therapists $27,21 $26.14 300 Physical Therapists $28.98 $26.87 3,460 Dental Hygienists $28.30 $29.94 4,250 Sonographers $25.08 $27.23 610 Medical and Clinical Lab Technologists $21.91 $22.47 2,920 Medical and Clinical Lab Technicians $14.87 $17.26 3,590 Medical Transcriptionists $13.72 $14.63 2,810 Emergency Medical Technicians $12.27 $13.17 3,900 Nursing Aides, Orderlies and Attendants $10.08 $11.40 30,110 Home Health Aides $8.98 $10.06 18,250 *Wages for second quarter 2004 are escalated from second quarter 2003 survey data. Source: Minnesota Department of Employment and Economic Development
10
Overall, Minnesota health industry wages are generally higher than national wage levels. Health care practitioner and technical occupations, which include medical professionals such as physicians, dentists and nurses, as well as lab technologists and technicians, earned an overall median hourly wage of $23.89, about 6 percent above the national rate. Minnesota health care support employees, including medical transcriptionists and various health occupation aides and assistants, had a median hourly wage of $11.56, about 10 percent above the national figure.
11
Minnesota Clinical Laboratory Survey Results The Phase I survey was mailed to 851 Minnesota labs culled from more than 2,000 facilities registered in the federal Clinical Laboratory Improvement Amendment (CLIA) program. Under the CLIA of 1988, any facility that performs laboratory testing on specimens for the purpose of providing information for diagnosis, prevention or treatment must obtain a CLIA certificate. CLIA entities such as schools and ambulance services were excluded from the survey.
A total of 408 laboratories responded. While their responses may not be completely representative, they do provide a snapshot of Minnesota labs that can be evaluated in the context of other data sources.
Employment The 408 responding labs reported 6,322 employees. Thirty respondents reported no employees—most of these presumably had staff, but did not answer this part of the questionnaire. The remaining 378 labs averaged about 17 employees. Fifty-eight percent reported five or fewer employees. Only 15 percent had more than 15 employees.
Nine labs reported more than 100 employees. These nine accounted for nearly 2,900 employees, or about 46 percent of the total. The largest lab reported 1,250 employees.
Figure 5: Survey Responses by Number of Employees N = 408 respondents Number of Employees Labs
To get a more complete picture of vacancies and recruitment for a range of laboratory occupations, the Phase I survey asked managers about employment in 12 occupations commonly found in Minnesota clinical laboratories:
• Clinical laboratory scientists or medical technologists • Clinical laboratory technicians or medical laboratory technicians • Phlebotomists • Cytotechnologists • Histotechnologists • Histotechnicians • Medical transcriptionists • Laboratory assistants • Certified medical assistants • Pathology assistants • Pathologists (M.D.s) • Clinical laboratory managers or supervisors.
12
Respondents were asked about numbers of employees in the 12 job classes (definitions were provided). Respondents reported more than 5,757 employees in these 12 classes and another 565 positions with a wide variety of other job titles. Some of these were job titles that might be closely related to one of the 12 main classes, but others were entirely different occupations; for example 36 licensed practical nurses.
Figure 6: Laboratory Employees Reported by Job Title Job Title Number of
* At least one full-time employee ** Figures do not add to total due to rounding
Most labs reported employing clinical laboratory technicians and/or scientists; other occupational groups were much less commonly reported. Seventy-three percent of 378 labs reporting employees said they employed clinical laboratory technicians—associate degree graduates, usually certified by ASCP or National Credentialing Agency for Laboratory Personnel, Inc. (NCA). Forty-five percent employed clinical laboratory scientists.
• Nearly 30 percent employed certified medical assistants and 23 percent employed laboratory assistants. It is not clear how many labs used medical assistants or laboratory assistants in place of Clinical Laboratory Technicians (CLT).
• About one-fourth employed phlebotomists, but less than 10 percent employed either histotechnologists or histotechnicians.
• Only 14 percent said they employed a pathologist. More than half reported having a laboratory manager or supervisor. Only 16 percent reported employing medical transcriptionists.
Respondents had the option of writing in data for employees outside the 12 job titles. One lab reported employing 60 “lab service techs.” Another large lab reported 60 “development technology” employees; the same lab reported 200 “other” employees without job titles.
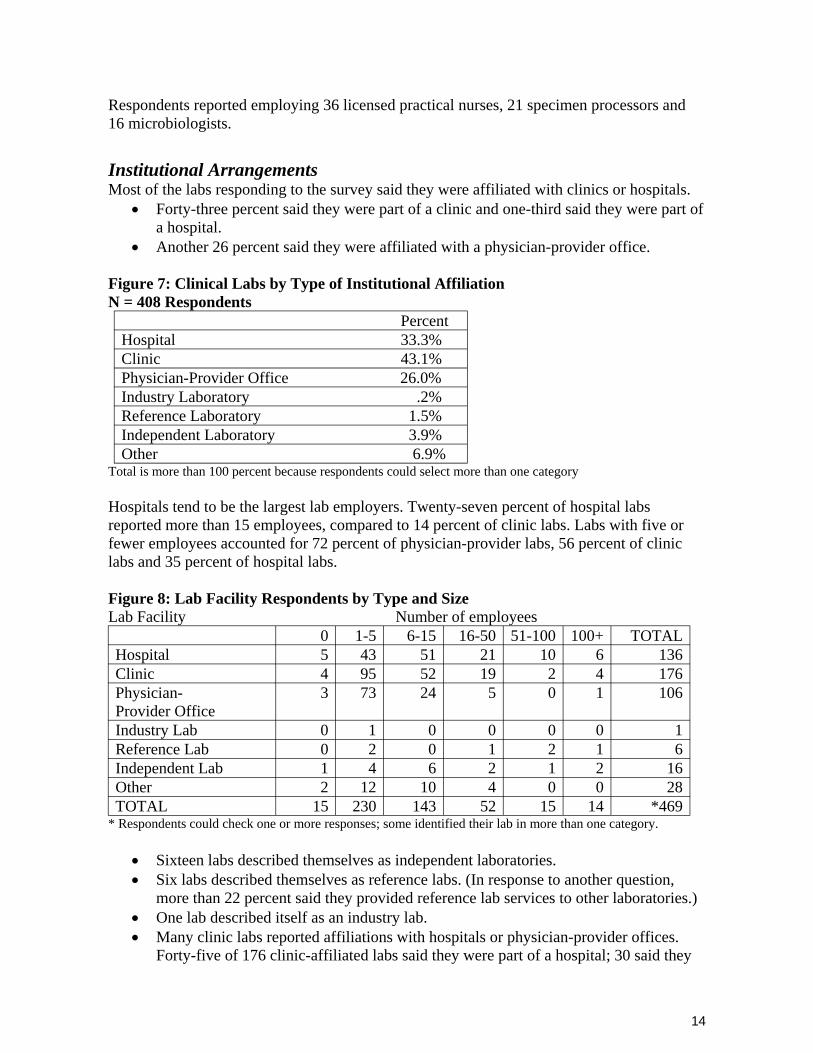
Institutional Arrangements Most of the labs responding to the survey said they were affiliated with clinics or hospitals.
• Forty-three percent said they were part of a clinic and one-third said they were part of a hospital.
• Another 26 percent said they were affiliated with a physician-provider office.
Figure 7: Clinical Labs by Type of Institutional Affiliation N = 408 Respondents
Percent Hospital 33.3% Clinic 43.1% Physician-Provider Office 26.0% Industry Laboratory .2% Reference Laboratory 1.5% Independent Laboratory 3.9% Other 6.9%
Total is more than 100 percent because respondents could select more than one category
Hospitals tend to be the largest lab employers. Twenty-seven percent of hospital labs reported more than 15 employees, compared to 14 percent of clinic labs. Labs with five or fewer employees accounted for 72 percent of physician-provider labs, 56 percent of clinic labs and 35 percent of hospital labs.
Figure 8: Lab Facility Respondents by Type and Size Lab Facility Number of employees
* Respondents could check one or more responses; some identified their lab in more than one category.
• Sixteen labs described themselves as independent laboratories. • Six labs described themselves as reference labs. (In response to another question,
more than 22 percent said they provided reference lab services to other laboratories.) • One lab described itself as an industry lab. • Many clinic labs reported affiliations with hospitals or physician-provider offices.
Forty-five of 176 clinic-affiliated labs said they were part of a hospital; 30 said they
14
were part of a physician-provider office. More than half—91 of 136—hospital labs said they were also affiliated with a clinic.
• Most physician-provider office labs did not report affiliations with other types or institutions; only 30 of 106 said they were also affiliated with a clinic.
Most hospital labs served hospitals with 50 or fewer beds; but 12 percent served hospitals with more than 250 beds.
Figure 9: Hospital-affiliated Labs by Hospital Size Hospital Affiliated Number Percent 1-25 beds 42 34% 26-50 beds 33 26% 51-100 beds 20 16% 101-250 beds 15 12% More than 250 beds 15 12% TOTAL *125 100%
*Another 11 respondents affiliated with a hospital did not answer or reported no beds.
Most clinic-affiliated labs—83 percent—are associated with clinics with 10 or fewer physicians. Ninety-one percent of labs affiliated with physician-provider offices said they served 10 or fewer physicians; 56 percent served five or fewer physicians.
Figure 10: Clinic Labs and Physician-Provider Labs by Number of Physicians Served Clinic-affiliated Physician-provider Affiliated Number Percent Number Percent
1-5 Physicians 0 0% 0 0% 6-10 Physicians 70 42% 56 56% 11-25 Physicians 70 42% 36 36% 26-100 Physicians 23 14% 6 6% More Than 100 Physicians 5 3% 3 3% TOTAL *168 100% **101 100% * Another eight respondents said their clinic-affiliated labs had no physicians or did not answer. ** Five respondents said their physician-provider, office-affiliated labs had no physicians or did not answer.
Almost half (45 percent) of the 408 respondents said their lab was a part of a larger integrated health care system. Clinic-affiliated labs (53 percent) and physician-provider offices (50 percent) were slightly more likely than hospital-affiliated labs (44 percent) to say they were part of a larger integrated system.
Figure 11: Labs Affiliated with Integrated Health Care Systems
Percentages do not all total 100 percent due to rounding
15
Laboratory Vacancies, Recruitment and Compensation Because of concern about the ability of clinical laboratories to meet staffing needs with appropriately trained workers, the survey asked about turnover, hiring and wage offers. Overall, survey respondents reported they lost 720 employees in 2002, but they made 979 new hires. This implies a 4 percent increase in employment.
Figure 12: Profile of Employment for 408 Respondent Labs
• Overall, labs had about 1.36 employees for every full-time equivalent (FTE) position. In other words, a significant share of employees worked less than full time. The use of part-time employees was highest for clinical lab scientists and lowest for medical transcriptionists. The data suggests that most medical transcriptionists worked full time or more.
• The use of employees eligible for certification from ASCP, NCA or similar organizations varied widely. Respondents said most of their histotechnologists, pathologists and clinical lab technicians were eligible for certification. About two-thirds of certified medical assistants, cytotechnologists and clinical lab scientists were eligible for certification. Certification rates were much lower for phlebotomists, pathology assistants and medical transcriptionists. Very few laboratory assistants were reported eligible for certification.
• Overall, respondents reported more FTE employees than budgeted positions. The meaning of this is not clear. This pattern held for all job classes, but was most pronounced for laboratory assistants, phlebotomists and cytotechnologists.
• The responding labs reported that 720 employees left their jobs in 2002. However, they reported hiring 979 people—1.36 hires for every position vacated. This implies
16
strong employment growth over the course of a year, and casts some doubt on concerns about workforce shortages in the short term. The ratio of new hires to vacated positions was highest for cytotechnologists and M.D. pathologists.
• While clinical lab technicians, phlebotomists and clinical lab scientists accounted for the largest number of job departures—together nearly two-thirds of the total—the highest rate of departures relative to budgeted FTEs was for laboratory assistants and phlebotomists.
Figure 13: Selected Employment Ratio for Laboratory Occupations Employees
Medical Transcriptionist .96 22% 1.35 10% 1.64 Clinical Lab
Manager/Supervisor 1.10 66% 1.41 12% .86
All Lab Employees 1.36 54% 1.25 19% 1.36
For some kinds of jobs, turnover might be as much a problem as a shortage of job candidates. Responding labs reported 6,322 employees at the time of the survey. If the number of reported employee losses and hires during the previous year are accounted for, this would imply approximately 6,063 employees at the beginning of 2002. The departing employees would have represented a turnover of nearly 12 percent. This is not remarkably high; but turnover was much higher for:
However, the two largest job classifications—clinical lab technicians and clinical lab scientists—had more moderate turnover rates of 11 and 8 percent, respectively. For all these classifications, labs reported hiring more employees than they lost.
17
Vacancies Respondents were also asked about vacant positions and difficulties filling them. Overall, only 78 of 408 responding labs reported vacancies. The question did not explicitly ask about vacancies at the time of the survey—but it is reasonable to believe that most respondents interpreted the question this way. However, because the previous question was about the number of employees lost during 2002, there could have been some confusion.
Only 38 labs reported more than one vacancy, and only 15 reported more than two. The survey also asked about the number of FTEs that were vacant. All together, labs reported 207 vacancies, but only 159 vacant FTEs. Only 70 labs reported at least a fractional FTE vacancy.
Only four job classifications had more than five reported vacancies: clinical laboratory technicians, 79; clinical laboratory scientists, 57; phlebotomists, 30; and laboratory assistants, 15. One lab accounted for 20 of the 57 Clinical Laboratory Science (CLS) vacancies and another one for 12 of the 79 CLT vacancies. Among these four occupations, phlebotomists had the highest vacancy rate at 19 percent. Clinical laboratory scientists and technicians had vacancy rates of 5.7 and 7.2 percent, respectively. The vacancy rate for laboratory assistants was 8.2 percent. Because these numbers are only from a sample, they do not represent the total vacancies in Minnesota at the time of the survey.
For all positions and all respondents, the overall vacancy rate was 5.6 percent. The vacancy rate is the number of reported vacancies as a percentage of budgeted FTEs. The rate would be lower if actual FTEs were used, because respondents reported more FTEs than budgeted FTEs.
Recruitment The small number of respondents reporting vacancies and the relatively small number of vacancies reported limited analysis of recruitment. The questionnaire format implied that questions about the difficulty of filling positions, educational requirements and compensation were to be answered only for positions that were vacant. Some respondents who did not report vacancies for a particular position gave responses to the questions regarding recruitment and compensation. Analysis of these questions is limited only to respondents who reported vacancies. Analysis is further limited to clinical laboratory scientists and technicians, phlebotomists and laboratory assistants. Too few responses were obtained for other occupations for meaningful analysis.
Overall, 50 of the 115 positions for which respondents reported vacanciesvi had been open more than two months, or continually open. Many labs with vacancies for clinical laboratory technician and clinical laboratory scientist positions reported great difficulty filling them. Labs reported less difficulty filling phlebotomist and laboratory assistant positions.
18
Figure 14: Difficulty of Filling Vacancies
clini l ians
4%
29%
40%
27%
l
33%
50%
17%
cal ab technic
None
Some
Great
no response
clinica lab scientists
Some
Great
no response
Clinical lab technician – Eleven of 48 labs reporting vacancies said their positions had been vacant more than six months. Another 18 said the positions were continually open. Nineteen labs said that had great difficulty filling open positions. Clinical laboratory scientist – Six of 18 labs reporting vacancies said the positions were open more than six months. Nine of 18 respondents said they had great difficulty filling vacancies. Phlebotomists – Only two of 20 labs reporting vacancies reported positions vacant more than six months. Another two said positions were continually open. None of the respondents reporting phlebotomist vacancies said they had great difficulty filling positions. Laboratory assistants – Only one of 10 labs reporting vacancies said positions were open more than six months. No labs said they had great difficulty filling positions.
Too few labs reported vacancies for meaningful analysis of other job titles.
19
Educational requirements are fairly standardized. Thirty of 48 labs reporting vacancies said that a CLT needed some variation of a two-year associate degree. Most expected less than a year of experience. Sixteen of 18 labs said a CLS needed a bachelor of science degree. Most required less than a year of experience.
Most labs looking for phlebotomists or laboratory assistants expected only a high school diploma or some on-the-job training. Employers appear to expect somewhat more work experience for positions such as clinical lab scientists and clinical technicians, which require post-secondary education.
Figure 15: Work Experience Required for Selected Positions (Includes only labs reporting vacancies)
Wages and Benefits The section of the questionnaire on job vacancies asked about hourly wages offered for vacant positions. The wording of the question (“What is the hourly or annual wage you will offer for this position?”) and the questionnaire layout implied that the question should only be answered for vacant job titles. Wage data was supplied for 133 job titles; of these, 94 were job titles for which respondents reported vacancies and 39 were for positions not reported vacant.
The wage data presented here is only for job titles for which vacancies were reported and for which more than five respondents provided wage data. Because of the very small number of responses, this data should be used with care. Nonetheless, the data gives some idea of the relative pay levels of these job titles in Minnesota labs.
Figure 16: Hourly Wages Offered for Positions Vacant in 2003 N=Number of labs reporting wage offers for vacancies
N Minimum Median Maximum Clinical Lab Scientist (Medical Technologist)
Based on the median reported wage, labs expected to offer about 34 percent more for clinical lab scientist positions requiring four-year degrees than for clinical lab technician positions
20
usually requiring two-year degrees. This is similar to the wage gap reported among all technologist and technician positions by the Minnesota Department of Employment and Economic Development (see Fig. 3).
Pay scales were significantly lower for phlebotomists and laboratory assistants, with median offers of $10.61 and $11.37, respectively. An $11 hourly wage amounts to $22,880 annually for a 40-hour workweek. By comparison, the $19 median offer for clinical lab scientists would amount to $39,520. Labs were not asked if the prospective wages they reported were for entry-level or higher positions; but they were likely to be entry-level since most labs said they would hire employees with no or little experience.
The questionnaire also asked about benefits offered for vacant positions. While many labs that did not report vacancies provided information about benefits, the data is inadequate to conclude anything about labs in general. The data reported here is only for labs that reported vacancies. Most labs said they offered paid sick leave and health insurance, and slightly fewer said they offered paid vacation. Three respondents said they offered no benefits for their vacant laboratory assistant positions. Some of the positions without full benefits might be part time.
Figure 17: Benefits offered for vacant positions N=Number of Responding Labs
Laboratory Operations To learn more about laboratory operations, the survey asked about lab test volume, the use of reference labs, and the use of automated pre-analytical procedures, paperless test reporting and order entry.
Volume of billable tests To gauge trends in lab activity, labs were asked how many billable clinical tests and anatomic pathology tests they performed in 2000, 2001 and 2002. All together, the 408 responding labs reported performing 37.5 million billable tests in 2002. Clinical tests far outnumber anatomic pathology tests, accounting for 96 percent of all billable tests. Clinical tests—sometimes called laboratory tests—include tests of blood and body fluids that usually are only a technical reading and do not require interpretation by a pathologist. Anatomic pathology tests, such as biopsies, tests on bone marrow and cytology tests looking for malignant cells in body fluids or pap smears, require interpretation by a pathologist to diagnose a condition. Cytotechnologists and histotechnology technicians typically do these anatomic pathology tests, while lab scientists and technicians do clinical lab work.
21
Many more labs do clinical tests than anatomic tests. More than three-fourths of labs reported no billable anatomic tests in 2002, while nearly three-fourths reported doing billable clinical tests. A fourth of all labs reported no billable tests of either kind. It is likely some number of these did tests, but did not answer the question. Only 83 labs reported billing for both kinds of tests.
Anatomic tests. Only 45 labs, just over 10 percent of respondents, reported more than 2,000 anatomic tests—about eight per workday. Eighteen labs reported more than 25,000 billable anatomic tests.
Among labs reporting data for both 2000 and 2002, anatomic test volume increased 6.8 percent. Hospital-based labs had virtually no increase, while clinic-based labs reported a 30 percent increase in billable tests.
Hospital-affiliated labs accounted for 72 percent of billable anatomic tests, while clinic-affiliated labs accounted for 35 percent.
Figure 18: Billable Anatomic Lab Tests by Lab Type Billable Tests
2002* Percent of Total*
Percent Change 2000-02**
All Labs 1,599,149 100.0% Hospital-Affiliated Labs 1,148,446 71.8% +0% N = 35 Clinic-Affiliated Labs 552,500 34.5% +30% N = 27 Reference Labs 158,004 9.9% -7.2% N = 9
*Numbers total more than 100 percent because many labs identified themselves more than one kind of institution. ** Only labs reporting tests in both years.
Clinical tests. Small labs are more likely to perform clinical rather than anatomic tests, which require interpretation by a pathologist. Thus, they are less likely to employ cytotechnologists and histotechnologists. Three-quarters of labs with 15 or fewer employees reported billable clinical tests in 2002. (Even 21 of 30 labs reporting no employees reported clinical tests; nine of these reported more than 25,000 tests each.) Forty-one of 59 labs with more than 15 employees reported more than 100,000 billable clinical tests each, or more than 400 per workday.
The number of billable clinical tests per employee in 2002 ranged from less than 100 to more than 50,000 (nearly 200 per workday). The number of billable tests per employee did not vary significantly by lab size, as measured by number of employees. Many small labs reported more than 10,000 billable tests per employee, while some large labs reported fewer than 10,000 tests per employee. There was no significant evidence that large labs had higher labor productivity than small labs.
Overall, the number of reported billable clinical tests increased 16 percent from 2000 to 2002, considering only respondents that provided data for both years. Clinic-affiliated labs, hospital-affiliated labs and reference labs all reported strong growth in their volume of billable clinical tests.
22
Labs affiliated with hospitals accounted for 68 percent of all clinical tests in 2002. Labs affiliated with clinics accounted for 34 percent.
Figure 19: Billable Clinical Lab Tests by Lab Type Billable Tests
2002* Percent of Total*
Percent Change 2000-02**
All Labs (N=408) 35,870,937 100.0% Hospital-Affiliated Labs 24,424,027 68.1% +16% N = 99 Clinic-Affiliated Labs 12,172,629 33.9% +26% N = 100 Reference Labs 3,290,045 9.2% +45% N = 5
* Numbers add to more than 100 percent because many labs identified themselves as more than one kind of institution. ** Only labs reporting tests in both years.
Reference lab services When asked if there were any high volume tests that they would like to bring in-house, 30 percent of respondents said “yes,” 70 percent “no.” Fifty-eight percent of labs with more than 15 employees answered “yes,” while only 25 percent of labs with 1 to 15 employees said “yes.”
Twenty-four percent of those answering said they were a reference lab for other laboratories. Seventeen of the 19 largest labs with more than 50 employees said “yes.” When asked in another part of the survey about their type of facility, only eight labs selected “reference lab.” Eighty-three labs that said they function as a reference lab for other laboratories did not identify themselves as reference labs when asked about the type of facility they were affiliated with. These labs all identified themselves as part of another kind of health care facility, even though they perform some reference work for other labs.
Of those that said they functioned as a reference lab, 69 percent said they were a reference lab for other laboratories within the same health system and 62 percent said they served laboratories outside their health system. About 40 percent of those who said they provided reference services said they did so for customers both within and outside their own system.
Automated procedures Many labs use automated procedures to improve efficiency and accuracy. A little more than a third of labs that answered the question said they use electronic ordering and electronic reporting. Only 13 percent said they used automated pre-analysis steps. These percentages are based only on labs that answered “yes” or “no.” The percentages would be lower if non-responses were counted as “no.”
Ninety percent or more of labs with more than 50 employees used electronic ordering and reporting, compared to only about 30 percent of labs with 15 or fewer employees. Automated pre-analysis steps were common only among labs with more than 100 employees.
23
Figure 20: Percent of Labs with Electronic and Automated Procedures Electronic Ordering
Labs providing reference services are more likely to use electronic and automated procedures. More than half of the reference labs said they used electronic ordering and reporting, while nearly a fourth said they used automated pre-analysis.
Figure 21: Automated Procedures: Comparison of Reference Labs with Other Labs All Labs
Reference Labs
Other Labs
Use Electronic Ordering 36% 56% 30% Use Electronic Reporting 37% 54% 32% Use Automated Pre-analysis 13% 24% 9%
24
Notes
i The American Society for Clinical Pathology survey covers: medical technologist (MT) staff, MT supervisors, MT managers, Cytotechnologist (CT) staff, CT supervisors, histotechnicians (HT), histotechnologists (HTL), HT/HTL supervisors, medical laboratory technicians (MLT), MLT supervisors, phlebotomists (PBT staff and PBT supervisors. iiAmerican Medical Association, Health Professions Career and Education Directory 2004-05. iii Kory Ward-Cook, Preliminary Results of the ASCP 2003 Wage and Vacancy Survey, retrieved November 9, 2004, from http://www.ascp.org/bor/center/wage_vac2003prel.asp. iv Minnesota Department of Employment and Economic Development, Minnesota Job Vacancy Survey. v Kory Ward-Cook, Susan Chapman and Suzanne Tannar, “2002 Wage and Vacancy Survey of Medical Laboratories,” Laboratory Medicine, volume 34, no. 10, October 2003. vi Responses were tabulated separately for each job classification at each lab. In aggregate, the 408 respondents had 4,896 job titles for which they could have reported a vacancy (12 job titles multiplied by 408 labs. The actual number of job titles for which the respondents could have reported a vacancy was more than 5,000 because many respondents reported information for job titles other than the 12 the questionnaire asked about). Together, the 408 respondents reported 207 vacancies spread over a total of 115 job titles (not unique job titles).
25
If you require this document in another format such as large print, Braille or cassette tape, call (651) 282-3838.
http://www.health.state.mn.us Printed on recycled paper