A Proposal to Enhance Competition and Reform Bidding in the Medicare Advantage Program ______________________________________________________ Steven M. Lieberman Loren Adler Erin Trish Joseph Antos John Bertko Paul Ginsburg May 2018 This report is available online at: https://www.brookings.edu/research/a-proposal-to-enhance-competition-and-reform-bidding-in-the-Medicare-Adavantage-Program USC-Brookings Schaeffer Initiative for Health Policy
Transcript
A Proposal to Enhance Competition and Reform Bidding in the Medicare Advantage Program
Steven M. Lieberman Loren Adler Erin Trish Joseph Antos John Bertko Paul Ginsburg
May 2018
This report is available online at: https://www.brookings.edu/research/a-proposal-to-enhance-competition-and-reform-bidding-in-the-Medicare-Adavantage-Program
USC-Brookings Schaeffer Initiative for Health Policy
Editor’s Note ........................................................................................................................................................... ii
Acknowledgements ............................................................................................................................................. ii
Statement of Independence ............................................................................................................................. ii
II. Background on Medicare Advantage (MA) ............................................................................................... 2
Medicare Advantage vs. Traditional Medicare Costs ...................................................................... 4
How “Competition” is Currently Structured in Medicare Advantage ....................................... 5
III. Reforming Bidding in MA to Foster Price Competition...................................................................... 6
How competitive bidding solely in MA differs from premium support .................................. 8
IV. Specific MA Competitive Bidding Proposal ............................................................................................. 9
Using Competitive Bidding to Set Benchmark Rates .................................................................... 10
Standard Benefits ........................................................................................................................................ 10
Allowing MAOs to Also Offer One “Standard Plus” and One “Enhanced” Plan .................. 11
Alternative Program Designs ................................................................................................................. 12
V. Analysis ................................................................................................................................................................. 13
Alternative Specifications and Sensitivity Analysis ...................................................................... 15
VI. Conclusion .......................................................................................................................................................... 17
This white paper is part of the USC-Brookings Schaeffer Initiative for Health Policy, which is a partnership between the Center for Health Policy at Brookings and the USC Schaeffer Center for Health Policy & Economics. The Initiative aims to inform the national health care debate with rigorous, evidence-based analysis leading to practical recommendations using the collaborative strengths of USC and Brookings.
ACKNOWLEDGEMENTS
We thank Anthony Damico for excellent programming assistance. This white paper also benefitted from thoughtful comments from Matthew Fiedler and Alice Rivlin at the Brookings Institution.
STATEMENT OF INDEPENDENCE
Brookings is committed to quality, independence, and impact in all of its work. Activities supported by its donors reflect this commitment and the analysis and recommendations are solely determined by the authors. Steven Lieberman is the president of Lieberman Consulting, Inc. Erin Trish is a consultant to a capital management firm on issues related to health care. Outside of these affiliations, the authors did not receive financial support from any firm or person for this article or from any firm or person with a financial or political interest in this article. They are currently not an officer, director, or board member of any organization with an interest in this article.
Introduction
Medicare beneficiaries have the option of receiving health coverage either through “Traditional” Medicare, in which the government directly pays providers for all covered services, or by enrolling in a private Medicare Advantage (MA) health plan, which 33 percent of beneficiaries now do.i If beneficiaries opt for the latter, Medicare pays the plans a fixed monthly amount for each enrolled member, and MA plans assume full financial responsibility for providing all Medicare-covered benefits to their enrollees.1 In proposing a reformed competitive bidding structure for Medicare Advantage, this paper seeks to address three issues with the current system:
1. Inefficiently high plan bids due to a poor bidding structure. Each Medicare Advantage Organization (MAO) submits a bid intended to reflect its estimated price for offering the Traditional Medicare benefit package, but MAOs are discouraged from competing on price because the government collects 30-50 cents on the dollar when it reduces a plan’s bid below the local administratively-set payment “benchmark.” As a result, MAOs face weakened incentives to become more efficient or accept lower markups and compete to attract enrollees largely based on the generosity of the benefits they offer over and above standard Medicare benefits without requiring an additional premium.
2. Poor consumer decisions due to a complex choice environment. The current MA plan offerings are hard for consumers to navigate, leading them to make mistakes in determining which plan best suits their needs. This has direct costs for the beneficiaries themselves and may also further undermine plans’ competitive incentives.
3. Uneven subsidization of MA enrollees. Benchmarks are set well in excess of plan bids, so MA enrollees receive substantial supplemental benefits at no additional cost, the amount of which varies significantly throughout the country. Whether or not the resulting transfers to MA beneficiaries are desirable as a whole, it is unclear why the level of additional subsidization should vary by geography as it does.
This paper proposes two key changes to current MA rules. First, we propose defining new standardized products that would provide a common basis for both plan bids and beneficiary comparison-shopping. Second, we propose revising the current contracting process to focus on promoting price competition. Our analysis suggests that these reforms would produce significant budgetary savings – on the order of $10 billion annually – and reduce Part B premiums by about $1.5 billion annually. This paper begins by providing background on the MA program, and then describes these two reforms and explores how basing payment to MA plans on competitive bidding for well-defined, standardized products would better focus competition on lowering prices paid by Medicare, as well as enhancing beneficiary choice by facilitating meaningful comparison shopping. We propose specific approaches to both standardizing products and competitive bidding (but also note alternative
1 For more detail on MA payment rules, see here: http://medpac.gov/docs/default-source/payment-basics/medpac_payment_basics_17_ma_finalc1a311adfa9c665e80adff00009edf9c.pdf?sfvrsn=0.
specifications). The paper concludes by evaluating the potential federal savings and beneficiary premium impacts from the proposed reforms.
II. Background on Medicare Advantage (MA)
Part C of Medicare, renamed Medicare Advantage in the legislation that created Medicare’s prescription drug benefit, allows beneficiaries each year to enroll in a private health plan from which they receive their Medicare benefits instead of Traditional, fee-for-service (FFS) Medicare. Private health insurance plans have been an option for Medicare beneficiaries since the 1970s.2 Since then, this option has grown from a small part of the program to serving 33 percent of all Medicare
beneficiaries in 2017.i In 2017, 63 percent of MA enrollees were in health maintenance organizations (HMOs), while the remainder were enrolled primarily in preferred provider organizations (PPOs).i Nationwide, 99 percent of Medicare beneficiaries live in counties where MA plans are available.ii Unlike Traditional Medicare, MA plans are required to provide beneficiaries with a limit on out-of-pocket spending; in 2018, the out-of-pocket maximum can be no higher than $6,700. Medicare Advantage Organizations (MAOs) receive fixed, monthly payments (“capitation”) for each enrolled member, in exchange for which the MAO bears financial risk for the cost of providing all medically necessary benefits covered by Medicare.3 If the cost of benefits plus administrative expenses is less than revenue (the sum of capitation paid by Medicare plus premiums, if any, paid by beneficiaries), the MAO makes money. 4 If costs exceed revenue, the MAO loses money. Currently, MA plan payments are based on county-level “benchmarks,” which as a result of the Affordable Care Act (ACA) are administratively set between 95 and 115 percent of the cost of Traditional FFS Medicare for an average-risk, “standardized,” beneficiary in that county. How a county’s benchmark compares to FFS costs in the county depends on which quartile that county’s FFS per beneficiary costs fall within, with counties with higher FFS costs receiving lower benchmarks as a percentage of local FFS costs, as depicted in Table 1. In addition, plans earning at least a 4 out of 5 star quality rating are eligible for higher benchmarks.5
2 The Social Security Amendments of 1972, which authorized contracting with managed care plans, first gave Medicare beneficiaries the option of joining private plans. 3 Medicare “risk adjusts” payments are based on the expected costs of differing beneficiaries, paying more for beneficiaries projected to have (on average) higher costs while paying less for those with lower projected costs. The current risk adjustment system, the Hierarchical Condition Category (HCC) model, relies on statistically important clinical diagnoses. 4 MA plans must meet at least an 85 percent medical loss ratio (MLR), which limits the combination of administrative expenses, marketing costs, and profits. MAOs are also required to meet a number of profit margin requirements with their bid. 5 MA plans are given a Star Rating, intended to denote quality, with a maximum of 5 stars.
3
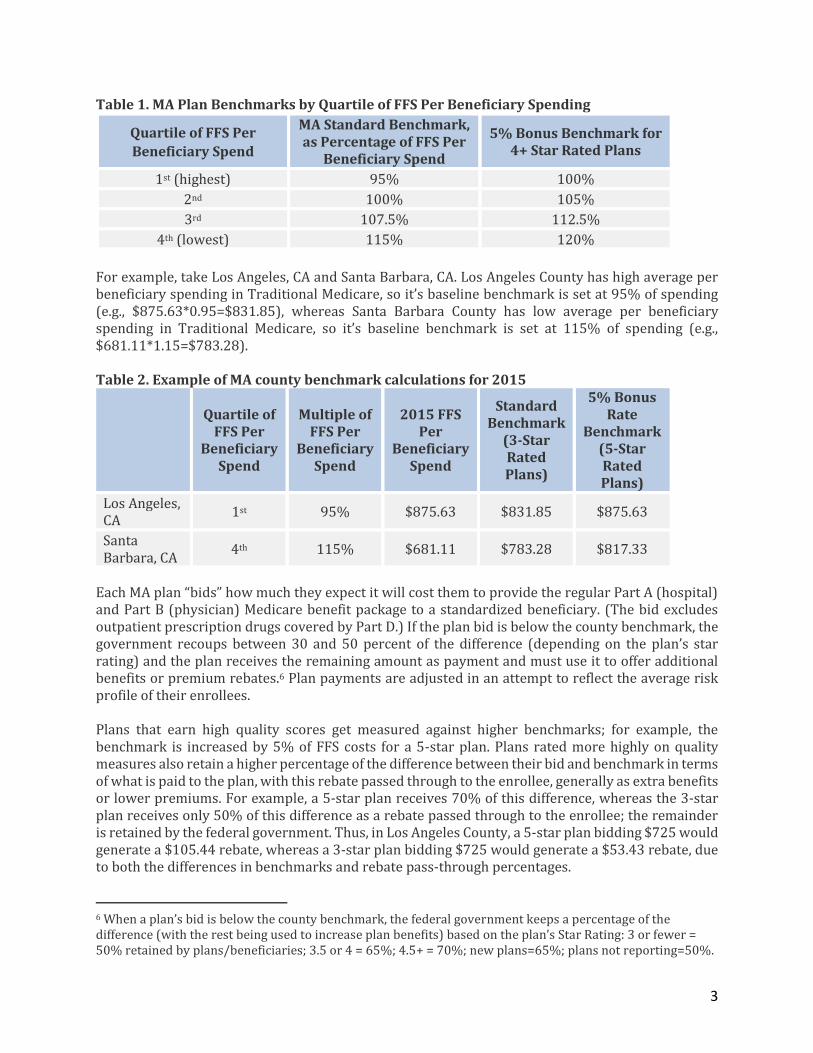
Table 1. MA Plan Benchmarks by Quartile of FFS Per Beneficiary Spending
Quartile of FFS Per
Beneficiary Spend
MA Standard Benchmark, as Percentage of FFS Per
Beneficiary Spend
5% Bonus Benchmark for 4+ Star Rated Plans
1st (highest) 95% 100%
2nd 100% 105%
3rd 107.5% 112.5%
4th (lowest) 115% 120%
For example, take Los Angeles, CA and Santa Barbara, CA. Los Angeles County has high average per beneficiary spending in Traditional Medicare, so it’s baseline benchmark is set at 95% of spending (e.g., $875.63*0.95=$831.85), whereas Santa Barbara County has low average per beneficiary spending in Traditional Medicare, so it’s baseline benchmark is set at 115% of spending (e.g., $681.11*1.15=$783.28). Table 2. Example of MA county benchmark calculations for 2015
Quartile of FFS Per
Beneficiary Spend
Multiple of FFS Per
Beneficiary Spend
2015 FFS Per
Beneficiary Spend
Standard Benchmark
(3-Star Rated Plans)
5% Bonus Rate
Benchmark (5-Star Rated Plans)
Los Angeles, CA
1st 95% $875.63 $831.85 $875.63
Santa Barbara, CA
4th 115% $681.11 $783.28 $817.33
Each MA plan “bids” how much they expect it will cost them to provide the regular Part A (hospital) and Part B (physician) Medicare benefit package to a standardized beneficiary. (The bid excludes outpatient prescription drugs covered by Part D.) If the plan bid is below the county benchmark, the government recoups between 30 and 50 percent of the difference (depending on the plan’s star rating) and the plan receives the remaining amount as payment and must use it to offer additional benefits or premium rebates.6 Plan payments are adjusted in an attempt to reflect the average risk profile of their enrollees. Plans that earn high quality scores get measured against higher benchmarks; for example, the benchmark is increased by 5% of FFS costs for a 5-star plan. Plans rated more highly on quality measures also retain a higher percentage of the difference between their bid and benchmark in terms of what is paid to the plan, with this rebate passed through to the enrollee, generally as extra benefits or lower premiums. For example, a 5-star plan receives 70% of this difference, whereas the 3-star plan receives only 50% of this difference as a rebate passed through to the enrollee; the remainder is retained by the federal government. Thus, in Los Angeles County, a 5-star plan bidding $725 would generate a $105.44 rebate, whereas a 3-star plan bidding $725 would generate a $53.43 rebate, due to both the differences in benchmarks and rebate pass-through percentages.
6 When a plan’s bid is below the county benchmark, the federal government keeps a percentage of the difference (with the rest being used to increase plan benefits) based on the plan’s Star Rating: 3 or fewer = 50% retained by plans/beneficiaries; 3.5 or 4 = 65%; 4.5+ = 70%; new plans=65%; plans not reporting=50%.
4
Table 3. Example rebate calculation for a $725 Bid in 2015
Star Rating
Benchmark – Bid
Rebate Pass-Through Rate
Rebate (Funds Extra
Benefits)
Los Angeles, CA 5 Stars
$875.63-$725 = $150.63
70% $150.63*0.7 =
$105.44
3 Stars $831.85-$725 =
$106.85 50%
$106.85*0.5 = $53.43
Note: The $725 bid used in this table is purely illustrative.
Medicare Advantage vs. Traditional Medicare Costs
Originally, private plans in Medicare were intended to use care coordination tools to offer high-quality care, provide enhanced benefits, and to save money for taxpayers. The 1982 Tax Equity and Fiscal Responsibility Act (TEFRA), which enacted the “risk” program and precipitated the growth of private plan participation and enrollment, set payment for private Medicare plans at 95 percent of the average Traditional FFS Medicare cost of a “standard” beneficiary residing in a specific county, thereby aiming to assure an up-front 5 percent discount for taxpayers. The payments to MAOs were risk adjusted to reflect the actual characteristics (“risk scores”) of the individuals enrolled in a plan, although numerous studies over the years warned of excess spending due to inadequate risk adjustment, which at the time used only demographic adjustments.iii Given the significant variation around the country in county-level FFS costs, tightly tying MA payments to FFS costs resulted in MA enrollment concentrating in a limited number of generally high-cost counties, leaving vast areas of the country without MA plans. To address concerns about the uneven access to MA plans, legislative changes increased plan payment rates over time from a uniform 95 percent of FFS Medicare costs and created complicated rules for establishing county benchmark payment rates whose percentages varied by county. As a result of a series of legislative changes, MA plan payments grew to an average of 113 percent of FFS costs by 2008 and MA plans became available throughout the country, but the MA “benchmark” rates set annually by Medicare for each county began to range widely relative to county-level FFS Medicare costs.iv The ACA sought to reduce costs of the MA program in excess of Traditional Medicare by phasing in limits on MA county benchmarks, ranging from 95 percent of the cost of FFS Medicare to 115 percent, as described in the previous section.7 In 2017, the Medicare Payment Advisory Commission (MedPAC) estimated that, on average, Medicare currently pays MAOs 100 percent of what Traditional Medicare costs for beneficiaries with an average risk score.v Notwithstanding this fact, average MAO payments for beneficiaries of truly equivalent risk appear to still be higher than those for Traditional Medicare. This occurs because similar beneficiaries in MA plans have their diagnoses coded more intensively than their counterparts in Traditional Medicare, according to multiple studies.vi Despite CMS attempts to adjust MAO payment for this difference in coding intensity, evidence suggests that the current adjustment is inadequate, and the difference in coding intensity has been growing.vii As a result, any given patient’s risk score tends to be higher
7 Interestingly, the Senate-passed version provided for MA competitive bidding, but the final version of ACA substituted the quartile-based system of benchmarks.
5
when that patient is enrolled in MA relative to when the patient is enrolled in Traditional Medicare. Higher risk scores translate into higher payments to MA plans. Even though MA plans are likely paid more than the cost of Traditional Medicare, on average nationwide due to the coding intensity differences described above, evidence that compares the cost of care for identical patients covered under Traditional Medicare and MA generally finds lower costs in MA, reflecting lower utilization and similar provider prices in MA.viii This is likely an important reason that the average MAO “bid” to provide the Medicare benefit package to a beneficiary with an average risk score is only 90 percent of Traditional Medicare’s.v Other factors may also contribute to these lower bids, however. The same coding intensity issues described above likely cause MAOs to anticipate being overcompensated by the risk adjustment program, leading them to reduce their bids. On the other hand, the shortcomings of the current bidding structure likely cause MAOs to bid higher than their actual costs. The difference between MA payments and plan costs accrues to a combination of MAOs in the form of profits and beneficiaries in the form of supplemental benefits. While this difference is intended to be rebated entirely to the enrollee in the form of lower premiums and/or greater benefits, studies have found that only a limited percentage is passed through to consumers in that manner. Mark Duggan, Amanda Starc, and Boris Vabson estimate that only 1/8 of higher MA plan reimbursement is passed through to beneficiaries in the form of lower out-of-pocket costs and premiums, and rule out that more than 49 percent is passed through at the 95 percent level of confidence.ix Marika Cabral, Michael Geruso, and Neale Mahoney find that a higher percentage of increased MA plan payments is passed through to consumers, but still only 54 percent (45 percent through lower premiums and 9 percent through more generous benefits).x The ratio of MAO payments to FFS costs also varies widely across the country. In some areas, such as those with high FFS costs, MAOs are paid less than the cost of Traditional Medicare, while MAOs in other areas of the nation are paid significantly more than the cost of Traditional Medicare. While this variation stems from an explicit policy choice to incentivize MA plan availability throughout the country, it also means that the additional benefits and/or lower premiums offered by MAOs are subsidized by taxpayers beyond the cost of Traditional Medicare in some areas of the country, but not others.
How “Competition” is Currently Structured in Medicare Advantage
MAOs can attract enrollees based on the magnitude of their extra benefits, lower Part B and D premiums, the attractiveness of their network of participating providers, and their reputation.8 In practice, after zeroing out the Part D premium, MAOs typically compete to attract beneficiaries primarily by the generosity of the “product,” accepting Medicare’s fixed Part B premium.xi Many plans use rebate dollars to offset Part D premiums. In 2017, 81 percent of Medicare beneficiaries had access to a “zero premium MA-PD” plan – one which charges no additional premium for Medicare, including the drug benefit, beyond the standard Part B premium paid by all Medicare enrollees – and 50 percent of MA-PD enrollees selected one of these zero premium plans.i Research,
8 The Centers for Medicare and Medicaid Services (CMS), the agency that administers Medicare, emphasizes star ratings in its materials and website, making the quality ratings a presumably important factor in the general reputation of an MAO.
6
however, suggests that plans overwhelmingly tend to favor using extra rebate dollars to offer additional supplemental benefits rather than reducing Part B premiums, presumably because these extra benefits (such as dental or vision coverage or lower cost-sharing for standard Medicare-covered benefits) are more salient and attractive to beneficiaries.xi This salience likely stems at least in part from the lack of emphasis placed on reductions to a consumer’s Part B premium in plan comparison tools, including the Medicare Plan Finder, and that Part B premiums are automatically deducted from a person’s Social Security benefits.
III. Reforming Bidding in MA to Foster Price Competition
The key objectives of reforming the MA bidding process are to: (i) increase price competition among MAOs by strengthening the economic incentives for beneficiaries to choose efficient, high quality plans; (ii) help beneficiaries make informed choices; and (iii) make more efficient use of taxpayer resources. Under our MA competitive bidding proposal, Medicare would pay the same rate to plans operating in the same area. Beneficiaries choosing MA plans whose bids are below the market-level weighted average bid (hereafter, “average bid”)9 will have any applicable MA premium (and, potentially, their Part B premium) reduced by the full amount that a bid is below the average bid. No longer will the government retain 30 to 50 percent of this difference. Conversely, beneficiaries choosing plans that bid above the average bid will pay the full amount by which a bid exceeds it as an MA premium. These cost differences will be made clear to consumers. This straightforward structure passes through to beneficiaries on a dollar-for-dollar basis the differences in plan costs, providing strong and clear incentives to select lower cost plans, which have to meet minimum quality requirements in order to be offered. Because they need to attract enrollees, MAOs will also have strong incentives to offer high quality, low cost plans. Some standardization of the products offered by MAOs can also further encourage competition based on price and quality by making it easier for consumers to compare prices for the same benefits. As discussed in Section IV, we propose to both standardize benefit plans and limit the number each MAO may offer to a maximum of 3 different plans. Currently, many markets have a proliferation of MA offerings; in 2018, the average Medicare beneficiary had a choice from among 21 different MA plans offered by 6 different MAOs.ii A 2011 study found that an overly high number of choices of plans in MA can be overwhelming and lead to suboptimal enrollment decisions.xii Other evidence also suggests that too many insurance offerings can hinder competition in different markets.xiii, xiv These proposed features parallel the Part D rules for Medicare prescription drug plans, which standardize benefit offerings and pass through to beneficiaries 100 percent of the amount by which
9 We use “market-level weighted average bid” here to refer to what will become the new benchmark under our proposal in order to avoid confusion with the county-level benchmark under current law.
7
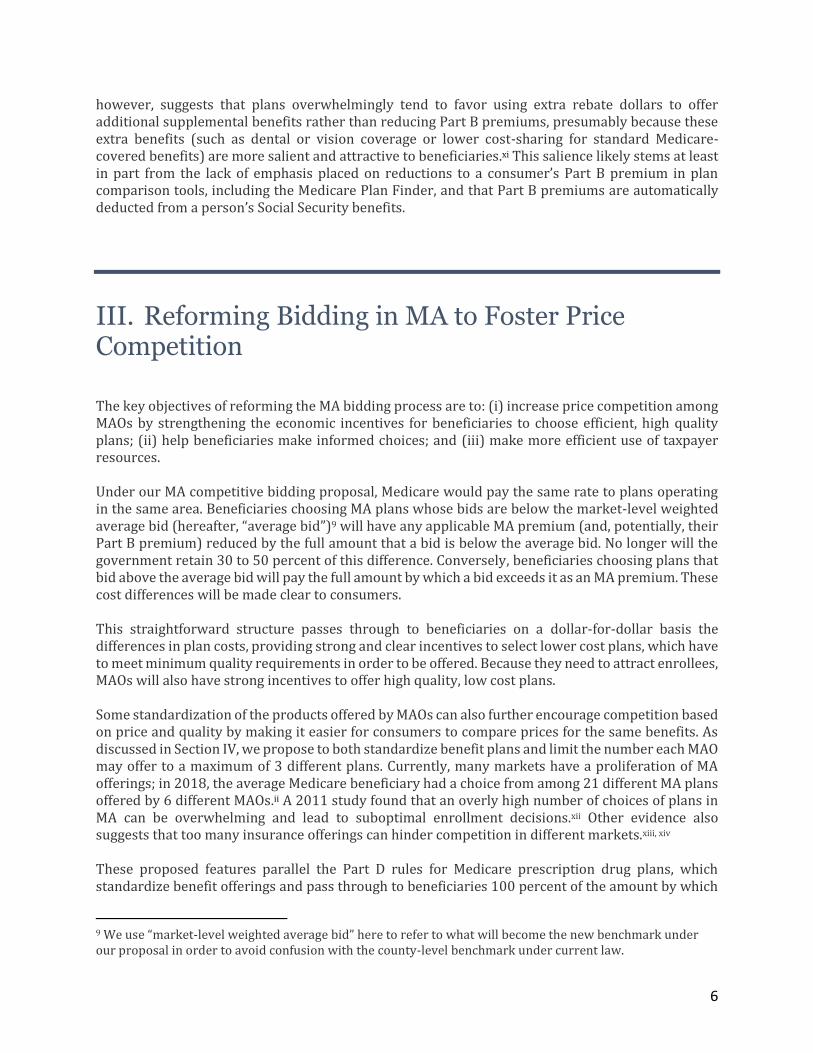
the bid of a particular plan is above or below the average bid. Many observers view Part D as succeeding in creating meaningful competition, with the bidding rules giving strong incentives to plans to offer low prices and beneficiaries to choose low-priced plans. The competitive bidding structure proposed would also largely even out the level of federal support for MA enrollees throughout the country and provide it more efficiently. Current MA rules have beneficiaries share in any amounts, without limits, by which their MA plan bids below the relevant benchmark (based on local Medicare FFS costs). As discussed earlier, this structure has resulted in marked regional variations in the generosity of benefits offered by MA plans to enrollees, as well as beneficiaries enrolling in MA plans receiving a total payment (i.e., the plan’s bid plus rebate) 12 percent higher than their reported cost (i.e., their bid) of providing the Traditional Medicare benefit, despite research suggesting that far less than that 12 percent is actually passed through to beneficiaries.ix,x
Under our proposal, all Medicare beneficiaries across the country (in counties that convert to the new bidding system, as explained below) would have access to an MA plan with an actuarial value 5 percent higher than Traditional Medicare’s for just the Part B premium. MA enrollees in every region, then, would receive 100 percent of this benefit enhancement (i.e., 5 percent) over Traditional Medicare and the federal government would receive 100 percent of savings above the first 5 percent. Importantly, this reform need not make beneficiaries worse off on average, especially given how little of the additional payment to MA plans above the cost of providing the Traditional Medicare benefit currently appears to be passed through to enrollees in the form of lower costs. The MA benefit
8
enhancement for a plan priced at the Part B premium can easily be adjusted to meet one’s desired goals; for example, the required actuarial value enhancement for MA plans could be set higher or lower than the 5 percent described above. Our competitive bidding reform, however, would most likely reduce MA plan profit margins. As described in detail in the previous section, much of the difference between plan bids and local payment benchmarks currently appears to accrue to MAOs in the form of increased profits. Reduced payments and enhanced price competition, therefore, should result in lower profits. While this is a key rationale for competitive bidding, evidence suggests that reduced payments and profits will lower the number of MAOs offering plans.xv Paying MA plans through a competitive bidding process also minimizes the impact of any inadequacies in risk adjustment that likely overcompensate private plans currently, and in particular the growing problem of patients in MA plans having their diagnoses coded more intensely than those
in Traditional Medicare.vi This issue, termed “coding intensity,” leads to a beneficiary in an MA plan being treated as having worse health status than an identical beneficiary in Traditional Medicare, in turn causing overcompensation under risk adjustment. CMS attempts to adjust MA plan payments to account for the coding intensity differences, but the current adjustment appears to be insufficient and the Congressional Budget Office estimates that adjusting more accurately could save $18 billion for taxpayers over ten years.vii,xvi If MA plan payments were set competitively, rather than through the current system of administrative benchmarks, the effect of “upcoding” on Medicare payments would be lessened. Under a competitive bidding system, MAO bids would tend to reflect their actual costs of providing coverage, including any amounts they expect to pay into or receive from risk adjustment. Thus, to the extent that MAOs expect to be overpaid in risk adjustment due to “upcoding,” bids would be correspondingly lower and the overall level of payments would fall accordingly, offsetting the risk adjustment overpayment. The same dynamic does not exist under the current system because the overall level of payment is determined primarily by the level of the administrative benchmark. (While upcoding would no longer lead to overpayments, it could still impair risk adjustment’s effectiveness in deterring risk selection and ensuring a level playing field across plans. Monitoring the integrity of plans’ risk adjustment submissions would therefore remain important even under a competitive bidding system.)
How competitive bidding solely in MA differs from premium support
Over the past two decades, two sets of proposals have emerged to increase the role of market-based forces when providing the full complement of Medicare benefits. One set of proposals, frequently referred to as “premium support,” envisions having the cost of Medicare be determined for each region by bids from private plans along with the local cost of Traditional Medicare. Taken together, these costs would define the standard contribution made available to all beneficiaries, which they would use to purchase health insurance. Under premium support, beneficiaries would receive the same (risk-adjusted) amount to purchase either one of the competing MA plans or FFS Medicare. Such a system would represent a significant change, especially for Traditional Medicare beneficiaries, whose cost would cease being nationally uniform and would vary geographically. Beneficiaries would annually choose among the available alternatives, paying (or saving) the difference between the uniform defined contribution in their locality and the cost of the specific option they select.
9
Although proposals vary on crucial features, bids associated with competing plans would generally establish the amount of the federal government contribution, so that it reflects the cost of the Medicare benefit package.xvii All Medicare beneficiaries, including any remaining in FFS, would have their cost (i.e., the premium paid by a beneficiary) determined by the “bid” associated with their preferred option in relation to the bids associated with competing alternatives (with FFS’ “bid,” or price, being determined by CMS to be equal to the projected average cost for a standardized risk beneficiary in a given region). This structure still maintains the core defined benefit of Medicare, although other proposals have added a cap on the growth in the federal contribution. The second set of reform proposals envisions a more limited role for market-based competition, reforming MA to create a more effective system for price competition but limiting bidding only to MA. Importantly, Traditional Medicare would not change under our proposal, leaving beneficiaries who remain in FFS Medicare unaffected by the reform of MA. This second approach is the focus of this paper. While the two sets of proposals vary in important ways, the initiatives share the goal of increasing reliance on market-based forces to improve competition and lower costs by enhancing the focus on cost (price). Because restricting competitive bidding to MA avoids disrupting the status quo for those enrolled in Traditional Medicare, it is more politically viable and avoids some of the risks inherent in moving to premium support. Important elements of our proposal are similar to plans advanced by the Bipartisan Policy Center and President Obama’s Fiscal Year 2017 Budget.xviii
IV. Specific MA Competitive Bidding Proposal
To enhance price competition and facilitate informed beneficiary choice, this paper recommends creating a new bidding system for Medicare Advantage, under which:
CMS would specify a Standard benefit with an actuarial value (AV) equal to 105 percent of Traditional Medicare’s that must be offered by all MAOs. Such plans would include the Traditional Medicare benefit package plus a maximum out-of-pocket (MOOP) limit and reductions to Traditional Medicare cost-sharing as specified by CMS.
Each MAO operating in a market would submit a bid indicating the cost of providing the Traditional Medicare benefit including the 5 percentage point AV enhancement incorporated into the new MA Standard benefit for an average-risk beneficiary.
If the enrollment-weighted average of those bids (including the 5 percentage point AV enhancement) is lower than the current law benchmark payment rate (with no bonuses) for a market, then Medicare would pay a new risk-adjusted, capitated benchmark based on the enrollment-weighted average of bids submitted for the Standard benefit in a given market. Otherwise, the current law benchmark and MA rules would remain in place.
Enrollees in MA plans that bid above the enrollment-weighted average bid for the region would pay the difference, and those enrolled in plans that bid below that average would receive that difference as a discounted premium, which would be made clear on the Medicare Plan Finder website and in materials sent to beneficiaries.
10
Each MAO is required to offer a Standard benefit plan but is also permitted to offer one “Standard Plus” benefit and one “Enhanced” benefit plan (defined in greater detail below).xiv No more than three different plans could be offered by one issuer in a given region.
MAOs would have to declare to CMS the areas for which they will submit bids for the following calendar year by April 1.
All other MA rules remain unchanged.
Using Competitive Bidding to Set Benchmark Rates
Medicare capitation payments would be based on the “Standard plan” bids submitted for a market area (if the average bid costs no more than the current benchmark). For every dollar an MAO’s Standard plan bid is either above or below the competitively-set benchmark (based on average bids) in that market, enrollees would either pay a premium or receive a rebate of that exact amount. All organizations participating in MA in a service area would submit a bid for the Standard benefit (and all MAOs would have to offer such a plan). The bids for each MAO would then be weighted by its enrollment (in all plan offerings) during the current plan year to determine the benchmarks, which are incorporated in the analysis presented in Section V.10 The effects on federal costs and premiums of this competitive bidding scheme are analyzed in Section V.
Standard Benefits
All MAOs would have to offer and bid on the Standard benefit specified by CMS for a beneficiary with a risk score of 1.0 (the national average enrollee). We propose that, on a national average basis, the Standard benefit would have an actuarial value of 105 percent of Traditional Medicare, including Traditional Medicare’s benefit package plus a maximum out-of-pocket (MOOP) limit on a beneficiary’s cost sharing in any year and reduced cost-sharing for certain services. The MOOP would be set annually by the CMS Actuary, generally increasing with per capita program costs, and is anticipated to approximate the mandatory MOOP limit that MA plans must provide under current law ($6,700 in 2018). Defining the Standard MA benefit to be higher in value than Traditional Medicare is important in order to guarantee that beneficiaries, not only the government, gain financially from any efficiencies and lower costs MA plans are able to offer, particularly given that enrollees are generally accepting a narrower network of providers by enrolling in a MA plan. Setting the Standard benefit to have an actuarial value 5 percentage points higher than that of Traditional Medicare effectively guarantees that the first 5 percentage points of savings due to the Medicare Advantage program accrue to beneficiaries, with any additional savings taking the form of reduced federal expenditures. However, 5 percent is a judgment intended to represent a reasonable balance between generating federal savings and providing incentives to beneficiaries to accept the network features of MA plans. The fiscal and enrollment effects of specifying the actuarial value of the Standard benefit both at 105
10 In the case of regions where one or more MAOs serve only a subset of the region, the benchmark for a given consumer would be based only on those plans serving his or her zip code.
11
percent of Traditional Medicare’s and at a lower, 103 percent, are estimated relative to current law and discussed in Section V. The uniform benefits offered in the Standard plan (also in the “Standard Plus” plan, described below) facilitate the ability of beneficiaries to compare offerings and choose high value, low cost plans. Evidence has shown that more standardized insurance products can make consumer choice easier and increase consumer welfare.xix
Allowing MAOs to Also Offer One “Standard Plus” and One “Enhanced” Plan
Unlike the current system in which MAOs can generally offer as many different plan variations as they like (as long as they are “meaningfully different”), each MAO would only be allowed to offer one “Standard Plus” plan and one “Enhanced” plan in addition to the Standard benefit.11 The Standard Plus benefits would be specified by CMS and have an actuarial value 8 percentage points higher than Traditional Medicare. They might lower the MOOP below the level specified in the Standard plan, or potentially provide other benefits (such as exempting from the Part B deductible a limited number of primary care visits or replacing the 20 percent coinsurance with a flat copayment for those visits).12 MAOs would have to actuarially justify the incremental premium of the Standard Plus plan over the bid for the Standard plan. MAOs that offer a Standard Plus plan could also offer an Enhanced plan, which gives the MAO more flexibility in benefit design. An Enhanced Plan must have at least the same actuarial value as the Standard Plus plan, but could also offer reduced beneficiary cost sharing, a lower MOOP, eliminate or reduce deductibles, or add benefits. MAOs would have to actuarially justify the incremental premium of the Enhanced plan over the Standard Plus plan. In addition, CMS would have the authority to reject any proposed Enhanced benefit plan that they believe would induce significant biased selection. Beneficiaries enrolling in either a Standard Plus plan or Enhanced plan offered by an MAO would pay a monthly premium equal to the full amount of the differential between the plan’s cost, as detailed in the MAO’s bid, and the competitively-determined benchmark bid for a Standard plan in that region (or receive a rebate if the Standard Plus or Enhanced option is cheaper than the region’s benchmark bid).
11 Special Needs Plans (SNPs) are outside the scope of this analysis, but under this competitive bidding proposal, would be allowed to continue as under current law, except that the local MA benchmark payment rate would now be set as proposed. 12 Our intention is to make Standard and Standard Plus plans offered within a region as comparable as possible to facilitate comparison and informed beneficiary choice while providing the necessary flexibility associated with variations in costs across regions and among plans bidding within a region. We envision delegating to CMS authority to manage variation while preserving comparability. As an example of one approach, CMS could list in priority order potential benefit enhancements, allowing each plan in a region to offer the specific enhancements that would equal (under its pricing) either a 5 percentage point actuarial value for the Standard benefit or an 8 percentage point enhancement for the Standard Plus benefit. Such an approach would give plans needed flexibility yet maintain a high degree of comparability and limit variation among competing products. The Enhanced plan would permit MAOs to offer less standardized, more innovative benefits with an actuarial value of at least 108 percent.
12
Each MAO, then, could offer three different plans in total in each region. This limitation affords significant, understandable choice, but reduces the risk that too many offerings will hinder informed choice due to beneficiaries being overwhelmed by the sheer number and complexity of offerings. In addition, making comparable all Standard and Standard Plus plans limits the number of non-comparable plans and promotes consistent differentiation across these two types of plan offerings. Permitting each MAO to also offer an Enhanced benefit that adds to its Standard Plus offering encourages innovation, balanced with avoiding overwhelming complexity.
Alternative Program Designs
Many of the specific attributes of the competitive bidding proposal could be modified while retaining the focus on economically rewarding beneficiaries who choose efficient, high-value plans, enhancing price competition among MAOs, and assisting beneficiaries in making informed choices. Some alternative options could include: Increase or decrease the generosity of the new MA Standard benefit. The actuarial value of the Standard benefit could be increased or decreased from the proposed 5 percent above that of Traditional Medicare. Increasing the AV of the Standard benefit would make the benefits offered by MAOs more attractive and effectively increase the share of savings kept by beneficiaries, but reduce federal savings. Decreasing the AV would have the opposite impact, and at some low enough level could lead to large reduction in MA enrollment.xv For Medicare beneficiaries to accept the narrower provider networks and more aggressive utilization management in MA, a large share likely require some additional benefits above those in Traditional Medicare before being required to pay an additional premium.13 Adopt transition rules or modifications to minimize disruption. To minimize changes in benefits in areas where very generous benefits are currently offered, transition rules could be devised to phase-in reductions in benefit generosity. Another option could be to have the actuarial value of the Standard benefit vary by the relative cost of an area, rather than having a nationally uniform benefit. If the national average actuarial value remains 105 percent of Traditional Medicare’s, this could push against the goal of making the MA benefit standard nationwide, but could minimize disruption. Implement the new system nationwide, not only in counties where Medicare costs would not increase. Federal savings are maximized by having our proposed competitive bidding system set benchmarks only in areas where the new system would cost no more than the current system, while retaining the current system in counties where the new system would increase costs. As an alternative, the new competitive bidding system could be implemented in all counties nationwide, regardless of whether costs would decrease or increase. Adopting this alternative specification would reduce the proposal’s federal savings. Setting an upper limit on the number of MAOs awarded contracts in a market. CMS could become more of an “active purchaser,” limiting the maximum number of MAOs offering plans in an area based on cost and quality. As an example, Covered California requires new plans wanting to participate in their
13 Because MA beneficiaries (unlike beneficiaries in FFS) are not permitted to purchase supplemental insurance (i.e., Medigap) to reduce their out-of-pocket costs, the increased actuarial value limits their cost-sharing.
13
state’s ACA marketplace to either participate in regions of the state with low competition or introduce an innovative approach. Adopting a different formula for setting the MA benchmark in a region. Other approaches could be adopted to derive the benchmark from bids: examples include having the second lowest bid set the benchmark or counting plan bids equally when calculating an average (rather than weighting by enrollment). Converting from bidding by county to (larger) market areas. MAO bids and service areas could be at a regional level that would generally encompass multiple counties, reflect health markets, or extend across state lines.
V. Analysis
In this section, we detail how MA competitive bidding would affect the Medicare program, the federal budget, and beneficiary premiums. The analysis focuses on the proposal outlined in the previous section, and then examines what might occur under a small number of alternative specifications and assumptions. The estimates provided are for the year 2015, expressed in 2015 dollars, and assume the policy has been fully phased-in. For our central analysis, we assume:
MAOs respond to the new competitive bidding system by lowering their bids by an average of 5 percent compared to current law.14
In counties that convert to the new competitive bidding system: o All enrollees in health maintenance organizations (HMOs) and point-of-service (POS)
plans remain enrolled in the reformed MA program o 10 percent of enrollees in preferred-provider organizations (PPOs) leave MA and join
the Traditional Medicare program, while the other 90 percent remain in MA o All enrollees in private fee-for-service (PFFS) plans leave MA and join the Traditional
Medicare program.
14 We believe that MAOs will respond to new competitive bidding system by reducing their bids somewhat, on average, but the assumed 5 percent reduction is intended to be illustrative and a reasonable starting point for sensitivity analyses. In recent years, we have seen MAOs lower plan bids as administrative benchmarks have come down, but it is unclear to what degree a similar phenomenon might occur in response to our proposed bidding system which enhances price competition. As a point of comparison, the Congressional Budget Office assumes the MAO bids would decline by an average 3 percent under a premium support model.
See https://www.cbo.gov/sites/default/files/113th-congress-2013-2014/reports/09-18-premiumsupport.pdf and https://www.cbo.gov/system/files/115th-congress-2017-2018/reports/53077-premiumsupport.pdf for a longer discussion of how competitive pressures might affect MAO bids.
As a sensitivity analysis, we test what would occur if MAOs responded by lowering their bids by only 2 percent. Although precise estimates are not reported in this paper, we also analyzed how the proposal would be affected by different assumptions surrounding how many beneficiaries would switch out of the MA program back into Traditional Medicare.15 We also examine the impacts of setting the Standard benefit package that MA plans bid to provide at an actuarial value 3 percent higher than Traditional Medicare’s (as opposed to 5 percent higher in our central proposal).
Results
According to our analysis of CMS data, introducing competitive bidding in the Medicare Advantage program as proposed would:
Save the federal government approximately $10 billion annually; and Reduce Medicare Part B premiums across both MA and Traditional Medicare beneficiaries by
a combined roughly $1.5 billion (roughly 2 percent) annually. We estimate that 58 percent of counties nationwide would shift to the new competitive bidding structure, in which 85 percent of Medicare beneficiaries and 93 percent of current MA enrollees (included in our analysis) reside. For the remaining 7 percent of MA beneficiaries, the Medicare Advantage program would continue as under current law. For estimating our proposal, our assumptions imply that 5 percent of current MA enrollees would leave the program and join Traditional FFS Medicare.
15 Further details on this analysis available upon request to the Brookings Institution.
15
Alternative Specifications and Sensitivity Analysis
In this section, we examine what would happen if the actuarial value of the Standard plan benefit were set lower and under different assumptions of how much plan bids would come down in response to the new competitive bidding system. Our core proposal establishes the actuarial value of the Standard plan for purposes of MA competitive bidding at 5 percent above that of Traditional Medicare. Notably, this is the same benefit level chosen in similar proposals from the Obama administration and the Bipartisan Policy Center.xx, xxi However, there are pros and cons to establishing either a higher or lower benefit level for the Standard plan, as discussed in Section IV, and it is not clear what the ideal level should be. If the AV of the Standard plan MA offering were set 3 percent higher than that of Traditional Medicare, but all other assumptions were held the same, including the assumption that all PFFS enrollees and 10 percent of PPO enrollees would leave MA and enroll in Traditional Medicare while all other beneficiaries stay enrolled in MA, we estimate that overall savings would increase by 14 percent, and a slightly higher share of the population would live in counties switching to a competitive bidding system, as detailed in Table 4. Specifically, we estimate that this alternative specification of our proposal would have saved the federal government $11.5 billion in 2015 and reduced total Part B premiums paid by $1.6 billion.
16
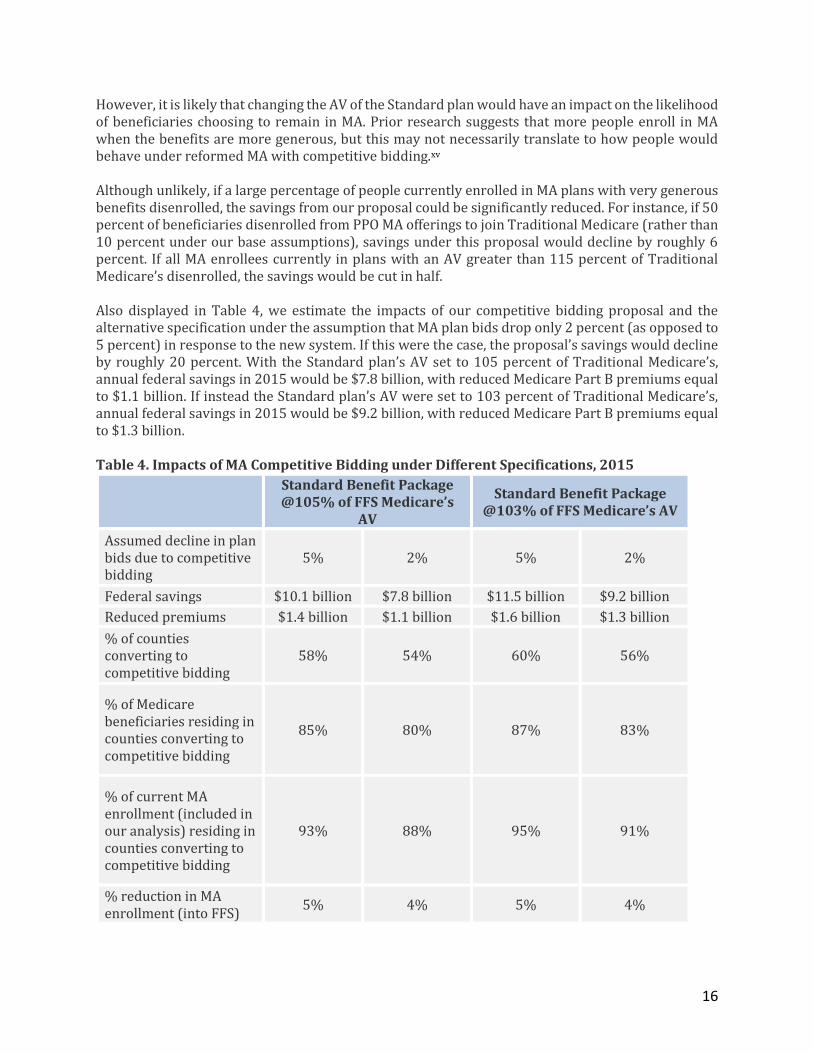
However, it is likely that changing the AV of the Standard plan would have an impact on the likelihood of beneficiaries choosing to remain in MA. Prior research suggests that more people enroll in MA when the benefits are more generous, but this may not necessarily translate to how people would behave under reformed MA with competitive bidding.xv Although unlikely, if a large percentage of people currently enrolled in MA plans with very generous benefits disenrolled, the savings from our proposal could be significantly reduced. For instance, if 50 percent of beneficiaries disenrolled from PPO MA offerings to join Traditional Medicare (rather than 10 percent under our base assumptions), savings under this proposal would decline by roughly 6 percent. If all MA enrollees currently in plans with an AV greater than 115 percent of Traditional Medicare’s disenrolled, the savings would be cut in half. Also displayed in Table 4, we estimate the impacts of our competitive bidding proposal and the alternative specification under the assumption that MA plan bids drop only 2 percent (as opposed to 5 percent) in response to the new system. If this were the case, the proposal’s savings would decline by roughly 20 percent. With the Standard plan’s AV set to 105 percent of Traditional Medicare’s, annual federal savings in 2015 would be $7.8 billion, with reduced Medicare Part B premiums equal to $1.1 billion. If instead the Standard plan’s AV were set to 103 percent of Traditional Medicare’s, annual federal savings in 2015 would be $9.2 billion, with reduced Medicare Part B premiums equal to $1.3 billion. Table 4. Impacts of MA Competitive Bidding under Different Specifications, 2015
Standard Benefit Package @105% of FFS Medicare’s
AV
Standard Benefit Package @103% of FFS Medicare’s AV
Assumed decline in plan bids due to competitive bidding
5% 2% 5% 2%
Federal savings $10.1 billion $7.8 billion $11.5 billion $9.2 billion
% of Medicare beneficiaries residing in counties converting to competitive bidding
85% 80% 87% 83%
% of current MA enrollment (included in our analysis) residing in counties converting to competitive bidding
93% 88% 95% 91%
% reduction in MA enrollment (into FFS)
5% 4% 5% 4%
17
VI. Conclusion
As our analysis illustrates, converting Medicare Advantage to a competitive bidding system offers an opportunity to make the program more efficient and produce significant federal budgetary savings without shifting costs to beneficiaries. Greater program efficiency should be achievable by incentivizing MAOs to compete on price for a standardized product, rather than competing primarily on benefit generosity, as is largely the case today. The current structure of MA provides an uneven and inefficient subsidy to Medicare beneficiaries based upon where they reside and how much Traditional Medicare costs in that county compared to private plan costs. Much of the additional federal payment to MA plans above the cost of providing the Traditional Medicare benefit appears not to flow through to beneficiaries. Our proposal, by establishing the MA Standard plan benefit 5 percent higher than that of Traditional Medicare’s, provides seniors and people with disabilities with a much more uniform benefit across the country.16 Beneficiaries would maintain access to a private plan with a greater AV than Traditional Medicare for the same cost as Traditional Medicare. Applying competitive bidding to MA as proposed, however, also guarantees that the federal government gets to share in the savings private plans are able to generate. In doing so, Medicare Advantage would finally achieve its original goal.
16 Except for the small share of the population still residing in counties that do not convert to competitive bidding for setting MA plan payments.
18
Appendix: Methodology
We obtained 2015 plan-level average per member per month payments for MA plans (for Parts A and B services) using publicly available plan payment data from CMS.xxii These plan-level payment rate data reflect the plan’s bid standardized (by CMS) to a beneficiary of 1.0 risk score. We merged these plan-level payment data to county-plan level enrollment data from the CMS contract-plan-state-county enrollment data file, using March 2015 enrollment.xxiii We restricted our analysis to individual, standard MA plans; that is, we excluded Special Needs Plans (SNPs) and Employer Group Waiver Plans (EGWPs), as these plans are only available to certain subsets of enrollees. Generally, the plan payment data reflect a plan’s bid, although there are several limitations for research purposes. If a plan bids above the benchmark, we do not observe the amount of the bid above the benchmark. This is very infrequent, and we take the benchmark as the plan’s bid in these instances, but note that this may slightly under-represent actual bids. Additionally, in practice, plans actually submit bids that reflect a service area that tends to include multiple counties, and they also submit bids that reflect their expected enrollment and risk scores. While CMS has standardized the plan bids to reflect a beneficiary of 1.0 risk, we implicitly assume that plan bids are constant across counties after being standardized by CMS; it is unclear how this assumption might impact our results, but the effect is likely very small. Thus, for the purposes of this analysis, we take the published plan payment rate to represent the plan’s bid. For each county, we computed an enrollment-weighted average plan bid using certain subsets of plans, depending on MAO offerings in the market. In counties with at least two different MAOs offering an HMO (39% of counties with 89% of MA enrollment), we calculated the county’s reformed benchmark as the enrollment-weighted average of all HMO bids in the county. For counties with two different MAOs where only one MAO offers an HMO but one or more others offers a local PPO (15% of counties with 5% of MA enrollment), we assigned the HMO bid as the county’s reformed-benchmark. For counties with at least two MAOs offering local PPOs but none offering an HMO (6% of counties with 1% of MA enrollment), we calculated the county’s reformed-benchmark as the enrollment-weighted average of all local PPO bids in the county. We assigned counties that did not meet any of the above competitive criteria to be non-reforming (39% of counties with 4% of MA enrollment). We chose these particular plan inclusion schemes rather than simply producing enrollment-weighted average bids across all plans in a given county to reflect the fact that under competitive bidding, current high-bid plans would be unlikely to persist in a market where beneficiaries faced the full additional premium cost of these higher bids. Moreover, we do not expect competitive bidding to work well in a market where only one MAO offers plans. In the main set of results, we first multiplied all 2015 bids by 105% to represent the increased actuarial value of MA plans under our reform proposal. We then multiplied these bids by 95% to reflect an expected 5% savings from increased competition due to the reform proposal. We calculated the county’s enrollment weighted-average bid based on included plans (described above) after adjusting by these multipliers. For the alternative scenarios described in the text, we adjusted these multipliers accordingly (e.g., we multiplied bids by 103% rather than 105% for the 103% actuarial value scenario).
19
For counties that met the participation criteria described above, we then compared the county’s enrollment-weighted average bid (after multipliers) to the county’s 2015 benchmark (0% bonus), available from the MA ratebook.xxiv If the county’s enrollment-weighted average bid was greater than the benchmark, the county was assigned to “do not reform” status. If the county’s enrollment-weighted average bid was less than the benchmark, it was assigned to reform status. For counties that met the criteria for reform, we calculated savings under our proposed competitive-bidding reform by comparing 2015 plan payment levels to what would have been paid if plans were instead paid for all enrollees at the county’s enrollment-weighted average bid under the proposed reforms. To calculate what plans were paid in 2015, we summed plan payments (i.e., the plan bids used throughout this analysis) with plan rebates. For each plan-county, we compared these total plan bid plus rebate payment amounts to the county’s enrollment-weighted average bid under the proposed reforms (where rebates are irrelevant), and computed total savings for each plan by multiplying this difference by the plan’s enrollment. We then summed this total across all plans. Additionally, since we assumed that all enrollees in private fee-for-service plans would not stay in reformed MA but would instead opt into Traditional Medicare, we assigned the county’s average Traditional Medicare spending for these enrollees under reform. Similarly, we assigned the county’s average Traditional Medicare spending for 10% of PPO enrollees. The set of steps detailed above produces an estimate of the total gross savings to Medicare Part A and B from the proposal (and its alternative specifications). Because Part B premiums are set as a percentage of program costs (generally 25 percent), some of these gross savings will flow through to beneficiaries in the form of reduced premiums, while the rest reduce federal spending. We assume simply that the gross savings from the proposal distribute proportionately between Medicare Part A and Part B, based on relative 2015 gross Medicare Part A and B spending. The allocated savings to Part B are then reduced by 25 percent when calculating the total federal savings, to reflect the reduced beneficiary Part B premiums now being collected.
i Jacobson, Gretchen, Anthony Damico, Tricia Neuman, Marsha Gold. “Medicare Advantage 2017 Spotlight: Enrollment Market Update.” Henry J. Kaiser Family Foundation. June 6, 2017. http://www.kff.org/medicare/issue-brief/medicare-advantage-2017-spotlight-enrollment-market-update/
ii Jacobson, Gretchen, Anthony Damico, Tricia Neuman. “Medicare Advantage 2018 Data Spotlight: First Look.”
Henry J. Kaiser Family Foundation. October 13, 2017. https://www.kff.org/medicare/issue-brief/medicare-advantage-2018-data-spotlight-first-look/
iii General Accounting Office (GAO), “Medicare HMOs: HCFA Can Promptly Eliminate Hundreds of Millions in
Excess Payments,” GAO/HEHS-97-16, Apr. 25, 1997. http://www.gao.gov/assets/230/224084.pdf iv MedPAC Data Book, “June 2008 Data Book: Health Care Spending and the Medicare Program.” v “A Data Book: Health Care Spending and the Medicare Program,” Medicare Payment Advisory Commission.
June 2017. p. 138 http://www.medpac.gov/docs/default-source/data-book/jun17_databookentirereport_sec.pdf?sfvrsn=0#page=138
viGeruso, Michael, Timothy Layton, “Upcoding: Evidence from Medicare on Squishy Risk Adjustment,” NBER
Working Paper No. 21222. October 2015. http://www.nber.org/papers/w21222 http://www.nber.org/papers/w21222
vii Kronick, Richard, W. Pete Welch, “Measuring Coding Intensity in the Medicare Advantage Program.”
Medicare and Medicaid Research Review. 2014; 4(2). July 17, 2014. https://www.cms.gov/mmrr/Downloads/MMRR2014_004_02_a06.pdf
viii Curto, Vilsa, Liran Einav, Amy Finkelstein, Jonathan D, Levin, Jay Bhattacharya. “Healthcare Spending and
Utilization in Public and Private Medicare.” NBER Working Paper No. 23090. January 2017. http://www.nber.org/papers/w23090
ix Duggan, Mark, Amanda Starc, Boris Vabson. “Who Benefits when the Government Pays More? Pass-Through
in the Medicare Advantage Program.” May 2016. https://web.stanford.edu/~mgduggan/assets/img/dsv_revision_final_may2016.pdf
x Cabral, Marika, Michael Geruso, Neale Mahoney. “Do Larger Health Insurance Subsidies Benefit Patients or
Producers? Evidence from Medicare Advantage.” American Economic Review (forthcoming). https://www.aeaweb.org/articles?id=10.1257/aer.20151362&&from=f
xiStockley, Karen, Thomas McGuire, Christopher Afendulis, Michael E. Chernew. “Premium Transparency in
the Medicare Adcantage Market: Implications for Premiums, Benefits, and Efficiency.” NBER Working Paper No. 20208. June 2014. http://www.nber.org/papers/w20208
xii McWilliams, J. Michael, Christopher C. Afendulis, Thomas G. McGuire, Bruce E. Landon. “Complex Medicare
Advantage Choices May Overwhelm Seniors – Especially Those With Impaired Decision Making.” Health Affairs. Vol 30. No. 9. September 2011. https://www.healthaffairs.org/doi/abs/10.1377/hlthaff.2011.0132?url_ver=Z39.88-2003&rfr_id=ori%3Arid%3Acrossref.org&rfr_dat=cr_pub%3Dpubmed
xiiiAbulack, Jason T., Jonathan Gruber. “Choice Inconsistencies Among the Elderly: Evidence from Plan Choice
in the Medicare Part D Program.” NBER Working Paper No. 14759. February 2009. http://www.nber.org/papers/w14759
xiv Bertko, John, Paul B. Ginsburg, Steven M. Lieberman, Erin Trish, and Joseph Antos. “Medicare Advantage:
Better information tools, better beneficiary choices, better competition.” The Brookings Institution.
November 27, 2017. . https://www.brookings.edu/research/medicare-advantage-better-information-tools-better-beneficiary-choices-better-competition/
xv Rivlin, Alice, M., Willem Daniel. “Could improving choice and competition in Medicare Advantage be the
future of Medicare?” The Brookings Institution. December 1, 2015. https://www.brookings.edu/articles/could-improving-choice-and-competition-in-medicare-advantage-be-the-future-of-medicare/
xvi “Proposals for Health Care Programs – CBO’s Estimate of the President’s Fiscal Year 2016 Budget.” The
xvii “A Premium Support System for Medicare: Updated Analysis of Illustrative Options.” Congressional Budget
Office. October 5, 2017. https://www.cbo.gov/publication/53077 xviii Burke, Sheila, Paul Ginsburg, Steven Lieberman, G. William Hoagland, and Katherine Hayes. “The BPC
Health Care Reform Plan: A Response to Coulam, Feldman, and Dowd.” Health Affairs Blog. July 30, 2013. http://healthaffairs.org/blog/2013/07/30/the-bpc-health-care-reform-plan-a-response-to-coulam-feldman-and-dowd/
xix Marzilli Ericson, Keith M., Amanda Starc. “How Product Standardization Affects Choice: Evidence from the
Massachusetts Health Insurance Exchange.” NBER Working Paper No. 19527. October 2013. http://www.nber.org/papers/w19527
xx Office of Management and Budget. “Budget of the U.S Government. Fiscal Year 2017.” U.S. Government