Page 1
A Proposed Methodology to Assess the Quality of Public UseManagement in Protected Areas
Maria Munoz-Santos • Javier Benayas
Received: 9 April 2011 / Accepted: 29 March 2012 / Published online: 5 May 2012
� Springer Science+Business Media, LLC 2012
Abstract In recent years, the goal of nature preservation
has faced, almost worldwide, an increase in the number of
visitors who are interested in experiencing protected areas
resources, landscapes and stories. Spain is a good example
of this process. The rapidly increasing numbers of visitors
have prompted administrations and managers to offer and
develop a broad network of facilities and programs in order
to provide these visitors with information, knowledge and
recreation. But, are we doing it the best way? This research
focuses on developing and applying a new instrument for
evaluating the quality of visitor management in parks.
Different areas are analyzed with this instrument (78 semi-
quantitative indicators): planning and management capac-
ity (planning, funding, human resources), monitoring,
reception, information, interpretation, environmental edu-
cation, training, participation and volunteer’s programs.
Thus, we attempt to gain a general impression of the
development of the existing management model, detecting
strengths and weaknesses. Although Spain’s National Parks
constituted the specific context within which to develop the
evaluation instrument, the design thereof is intended to
provide a valid, robust and flexible method for application
to any system, network or set of protected areas in other
countries. This paper presents the instrument developed,
some results obtained following its application to Spanish
National parks, along with a discussion on the limits and
validity thereof.
Keywords Quality assessment � Visitors management �National Parks � Evaluation
Introduction
Natural areas have long been used for recreation (hunting,
fishing, hiking, etc.). Current levels of demand, however,
based upon a process that started halfway through the XX
century (Newsome and others 2002; Eagles and others
2002; Monz and others 2010), are unprecedented. More
than ever before, these natural areas have become impor-
tant places for leisure and enjoyment, a fact that appears to
reveal a new way in which the population relates to nature,
rather than just a passing fashion (Archer and Wearing
2003; Eagles 2004). Protected areas therefore provide
currently recognized and valuable recreational, cultural and
educational services (Manning and others 1999; Millen-
nium Ecosystem Assessment 2003). Nevertheless, these
places can only benefit us and fulfill conservation objec-
tives if they are well managed (Dudley and others 1999).
Thus, correct management of public use plays a vital role
with regard to optimizing the enjoyment of these services
and conserving the ecosystems that provide them.
In recent years, the evaluation of planning and man-
agement of protected areas has become one of the relevant
and intensely debated aspects in national and international
forums dealing with nature conservation and management
(e.g., evaluation of management effectiveness has been
included in the Work Program in protected areas adopted
by the Convention on Biological Diversity in 2004)
(Leverington and others 2010). There is an increasing need
M. Munoz-Santos (&)
Universidad Autonoma de Madrid, Fundacion F.G.Bernaldez,
Modulo 08. Edificio de Ciencias Dcho. 504.5,
28049 Madrid, Spain
e-mail: [email protected]
J. Benayas
Department of Ecology, Universidad Autonoma de Madrid,
Madrid, Spain
123
Environmental Management (2012) 50:106–122
DOI 10.1007/s00267-012-9863-0
Page 2
to convey the results obtained both to society and to senior
staff and government ministries (Moore and others 2003).
A recent study conducted by Leverington and others (2010)
shows that at international level there are now over 8,000
evaluations of effectiveness of protected area management,
in 100 countries, and over 50 methodologies employed.
Within the scope of visitor management, there is an
important body of study dealing with monitoring and
evaluation. Over the last 50 years numerous studies have
developed the field of Recreation Ecology (see the review
essay by Monz and others 2010), as well as different
models of visitor impact monitoring, in which the infor-
mation provided by different indicators enables manage-
ment measures to be adopted (Newsome and others 2002;
Manning and Lawson 2002; Moore and others 2003).
There is also a related stream of research about the deter-
mination of standards of quality. As a result, these stan-
dards are being included in different outdoor recreation
planning and management frameworks (e.g., Limit of
Acceptable Change, Visitor Experience and Resource
Protection) (Manning and Freymund 2004). With regard to
the evaluation of communication and environmental edu-
cation programs in parks, there is a growing body of lit-
erature, although this is as yet limited (see the review
essays by Absher and Bright 2004 and Marion and Reid
2007). As for experiences in evaluation of the quality of
services and facilities offered, there is an increasing num-
ber of quality control systems, among these, the evaluation
program Visitor Services Project of the National Park
Service, USA (Le and others 2004, 2005).
In Spain, protected areas occupy 12.1 % of the land and,
as occurs at the international level, these areas are
attracting an increasing number of visitors. The 2 million
visits to these areas in 1982 have now risen to at least 26
million (EUROPARC-Espana 2009). The different
administrations and managers have reacted to the pro-
gressive increase in the number of visits since the 1980s by
means of big investments and the development of a wide
network of facilities, activities and services intended to
facilitate awareness and enjoyment of the area by these
visitors. Likewise, there has been an increase in the amount
of private companies offering complementary nature-rela-
ted activities (Blanco 2006). The challenge facing the
managers of Spain’s protected areas is a truly complex one.
They have to guarantee the conservation of these areas,
promoting visitor satisfaction and providing benefits to the
local population (39 % of Spain’s population is concen-
trated in the municipalities containing protected areas).
And these challenges must all be met within a scenario of
rapid increase, both in the number of protected areas
declared and in the amount of visits (in 1987 only 1.7 % of
the country was protected, in 2009 12.1 %) (EUROPARC-
Espana 2009).
Following the growth and consolidation phase, steps are
being taken toward a new stage characterized by the greater
attention paid to quality processes in management and to
the contribution of protected areas to ecosystem services
(EUROPARC-Espana 2009). In recent years, different
initiatives have arisen relating to evaluation of protected
area management and to the improvement of monitoring
systems aimed at providing rigorous evaluation informa-
tion (Mallarach and others 2004; EUROPARC-Espana
2010).
With regard to evaluating visitor management, despite
the existence of some partial studies on the evaluation of
certain facilities and services (e.g., Benayas and others
2000; Sureda and others 2002; EUROPARC-Espana 2006),
specific evaluations of visitor management in Spanish
parks are practically non-existent. Most of them consist of
a series of quantitative indicators integrated within the
general evaluation programs. In this context, there is a
general call for systematic evaluation programs of visitor
management to be initiated in order for it to be more
effective with regard to fulfillment of objectives.
Objectives
The objective of the research involves developing and
applying an instrument for evaluating the quality of visitor
management in parks making up the Spanish National Park
System (NPS). And thus, attempt to gain a general
impression of the development of the existing model,
detecting strengths and weaknesses. Although Spain’s
National Parks constituted the specific context within
which to develop the evaluation instrument, the design
thereof is intended to provide a valid, robust and flexible
method for application to any system, network or set of
protected areas in other countries (provided that our
methodology needs to be tailored to each specific national
or regional context).
Study Area: The Spanish National Park System
In Spain, the National Park status offers the highest degree
of protection to a natural area and also enjoys the greatest
recognition and prestige. A total of 347,081.66 ha of the
50,488,490 comprising the national territory have been
declared National Parks (14 in total, 13 at the time of the
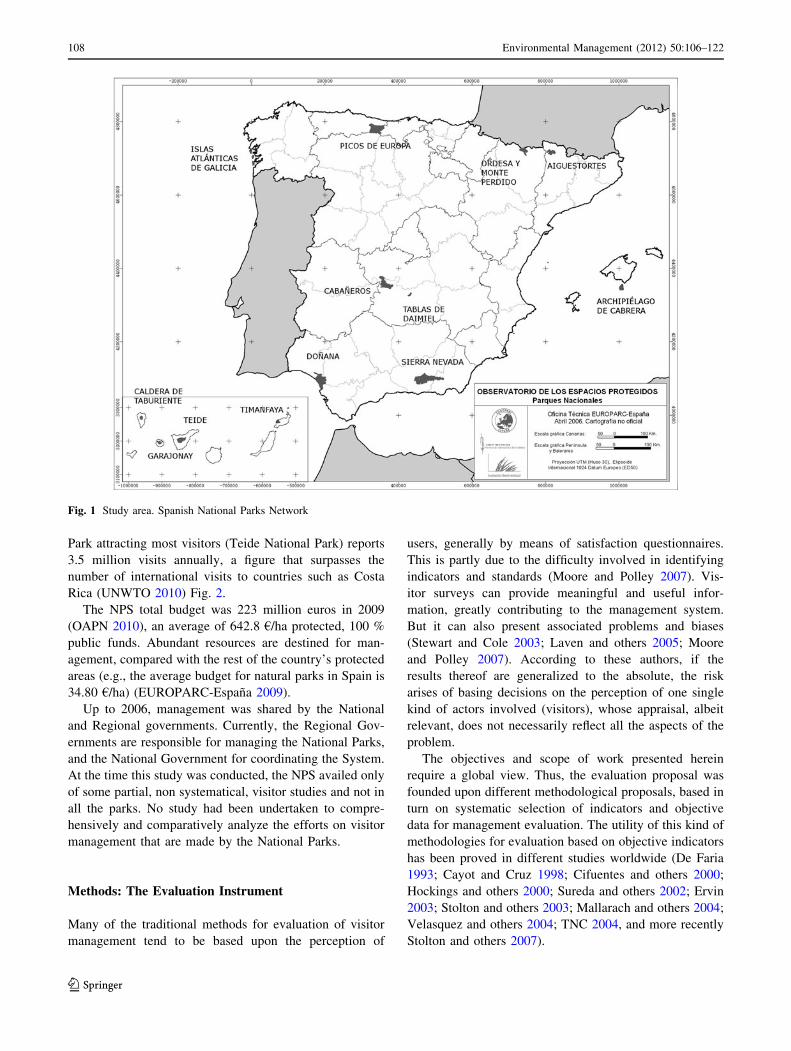
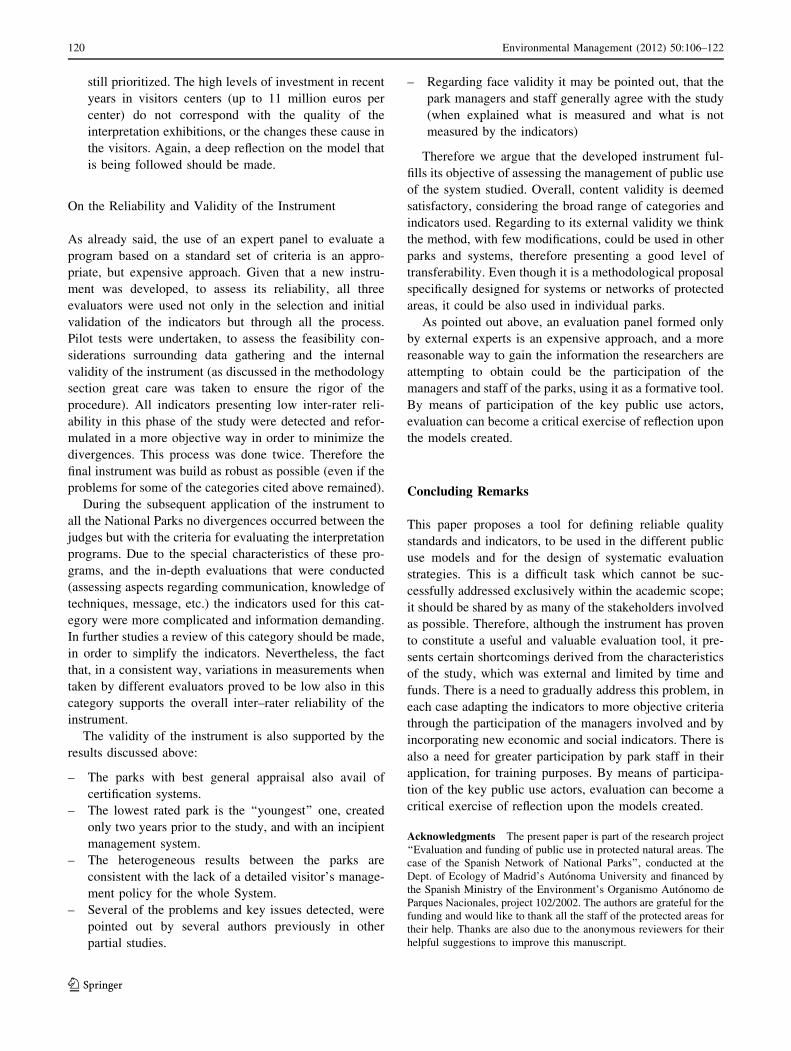
study), the first of these in August 1918 (Fig. 1).
Spain constitutes an important tourist destination at the
international level (3rd most visited country in 2009 and
4th in 2010) (UNWTO 2010). Tourism in the National
Parks has developed gradually over the past 20 years and
in 2007 the NPS reported 10.8 million visits. The National
Environmental Management (2012) 50:106–122 107
123
Page 3
Park attracting most visitors (Teide National Park) reports
3.5 million visits annually, a figure that surpasses the
number of international visits to countries such as Costa
Rica (UNWTO 2010) Fig. 2.
The NPS total budget was 223 million euros in 2009
(OAPN 2010), an average of 642.8 €/ha protected, 100 %
public funds. Abundant resources are destined for man-
agement, compared with the rest of the country’s protected
areas (e.g., the average budget for natural parks in Spain is
34.80 €/ha) (EUROPARC-Espana 2009).
Up to 2006, management was shared by the National
and Regional governments. Currently, the Regional Gov-
ernments are responsible for managing the National Parks,
and the National Government for coordinating the System.
At the time this study was conducted, the NPS availed only
of some partial, non systematical, visitor studies and not in
all the parks. No study had been undertaken to compre-
hensively and comparatively analyze the efforts on visitor
management that are made by the National Parks.
Methods: The Evaluation Instrument
Many of the traditional methods for evaluation of visitor
management tend to be based upon the perception of
users, generally by means of satisfaction questionnaires.
This is partly due to the difficulty involved in identifying
indicators and standards (Moore and Polley 2007). Vis-
itor surveys can provide meaningful and useful infor-
mation, greatly contributing to the management system.
But it can also present associated problems and biases
(Stewart and Cole 2003; Laven and others 2005; Moore
and Polley 2007). According to these authors, if the
results thereof are generalized to the absolute, the risk
arises of basing decisions on the perception of one single
kind of actors involved (visitors), whose appraisal, albeit
relevant, does not necessarily reflect all the aspects of the
problem.
The objectives and scope of work presented herein
require a global view. Thus, the evaluation proposal was
founded upon different methodological proposals, based in
turn on systematic selection of indicators and objective
data for management evaluation. The utility of this kind of
methodologies for evaluation based on objective indicators
has been proved in different studies worldwide (De Faria
1993; Cayot and Cruz 1998; Cifuentes and others 2000;
Hockings and others 2000; Sureda and others 2002; Ervin
2003; Stolton and others 2003; Mallarach and others 2004;
Velasquez and others 2004; TNC 2004, and more recently
Stolton and others 2007).
Fig. 1 Study area. Spanish National Parks Network
108 Environmental Management (2012) 50:106–122
123
Page 4
Our methodology was developed by people with
expertise in visitor management (academics, recreation
professionals and managers) and was adapted to the orga-
nizational structure and management needs of the Spanish
National Parks System and to the information available or
that could be compiled at the time of the study. Due to the
lack of available information to assess the efficiency or the
effectiveness, it was decided that the object of evaluation
should be Quality.
There is much literature about the concepts of ‘‘quality’’
and ‘‘satisfaction’’ in the leisure, tourism and business lit-
erature (e.g., Mackay and Crompton 1990; Tian-Cole and
others 2002). For purposes of this research we understood
quality according to the definition proposed by EUROP-
ARC (the European Federation of National and Natural
Parks): ‘‘intrinsic conditions and qualities necessarily
inherent in resources, facilities and services of a protected
natural area in order for public use activities to unfold in a
satisfactory manner for visitors and for the Park Agency,
always within the social and conservation objectives
assigned to public use’’ (EUROPARC-Espana 2006). Much
discussion has occurred regarding the operational definition
of satisfaction, as it is a multi-dimensional concept (Man-
ning 1999), influenced by situational variables including
resource, social and management settings, being these
influences mediated by the subjective evaluations of indi-
viduals (Whisman and Hollenhorst 1998). For the purposes
of this study ‘‘satisfactory manner’’ means to enhance both
acceptable levels of resource and experiential conditions
(Laven and others 2005).
Our methodological proposal is therefore specifically
designed for systems of protected areas, which enables
results to be expressed, both in relative terms of compari-
son (this park is better than that one because…) or in
absolute terms (this study area scored highly because
it responds to a determined standard with which to make
the comparison). It was designed and applied during
2006–2008.
Design of the Evaluation Instrument
The evaluation instrument was designed by a panel of 5
experts, both academic (2 university lecturers, 1 graduate
student) and professionals (1 consultant, 1 protected area
manager). They all had previous experience in evaluation
of visitor management in protected areas in the last 5 years
and possessed knowledge of the National Parks network. It
was applied by way of a pilot experience to two National
Parks.
Selection of Analysis Categories and Sub-Categories
Firstly, based upon different documents of the Spanish
NPS dealing with visitor management policy,
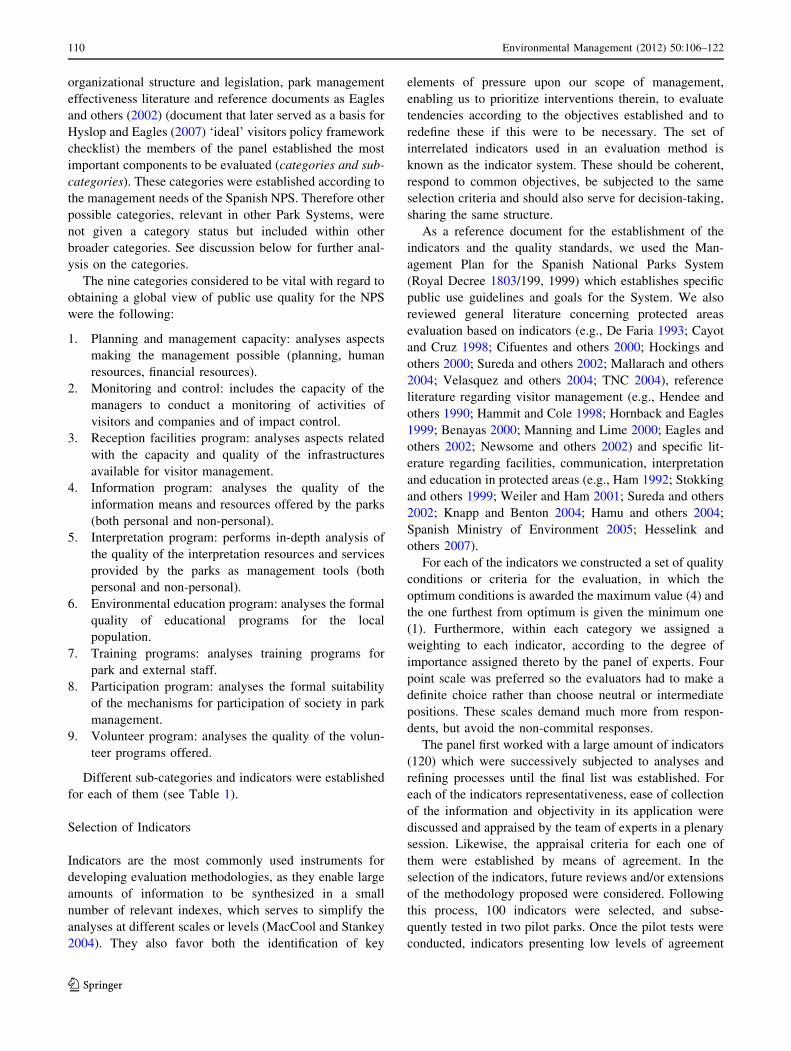
Formulation of objectives: QUALITY ASSESSMENT
Design of the evaluation instrumentPanel of experts
METHODOLOGY FOR GATHERING
INFORMATION
- Written documents - Structured and semi-
structured interviews - Semi-structured and
unstructured interviews- Closed and regulated
questionnaires for appraisal of facilities and services
- Participant observation - Field notes- Photographic records
EVALUATION INSTRUMENT
78 semi-quantitative indicators (values 1-4)
Nine programmes: - Planning and
management capacity- Monitoring - Reception facilities- Information- Interpretation- Environmental education- Participation- Volunteers
CONCLUSIONS AND RECOMMENDATIONS FOR
MANAGEMENT
Selection of categories and sub-categories, indicators and criteria for evaluation
Proposal for information -gathering instruments and
techniques
Gathering information in 2 Parks and review of the methodological proposal
Application of the evaluation instrumentto the National Parks network
3 external evaluators
Synthesis of information gathered
Visits to each national park
Individual appraisal of the indicators
Results sharing and collective appraisal
Calculation of categories and sub-categories
Fig. 2 Methodology
Environmental Management (2012) 50:106–122 109
123
Page 5
organizational structure and legislation, park management
effectiveness literature and reference documents as Eagles
and others (2002) (document that later served as a basis for
Hyslop and Eagles (2007) ‘ideal’ visitors policy framework
checklist) the members of the panel established the most
important components to be evaluated (categories and sub-
categories). These categories were established according to
the management needs of the Spanish NPS. Therefore other
possible categories, relevant in other Park Systems, were
not given a category status but included within other
broader categories. See discussion below for further anal-
ysis on the categories.
The nine categories considered to be vital with regard to
obtaining a global view of public use quality for the NPS
were the following:
1. Planning and management capacity: analyses aspects
making the management possible (planning, human
resources, financial resources).
2. Monitoring and control: includes the capacity of the
managers to conduct a monitoring of activities of
visitors and companies and of impact control.
3. Reception facilities program: analyses aspects related
with the capacity and quality of the infrastructures
available for visitor management.
4. Information program: analyses the quality of the
information means and resources offered by the parks
(both personal and non-personal).
5. Interpretation program: performs in-depth analysis of
the quality of the interpretation resources and services
provided by the parks as management tools (both
personal and non-personal).
6. Environmental education program: analyses the formal
quality of educational programs for the local
population.
7. Training programs: analyses training programs for
park and external staff.
8. Participation program: analyses the formal suitability
of the mechanisms for participation of society in park
management.
9. Volunteer program: analyses the quality of the volun-
teer programs offered.
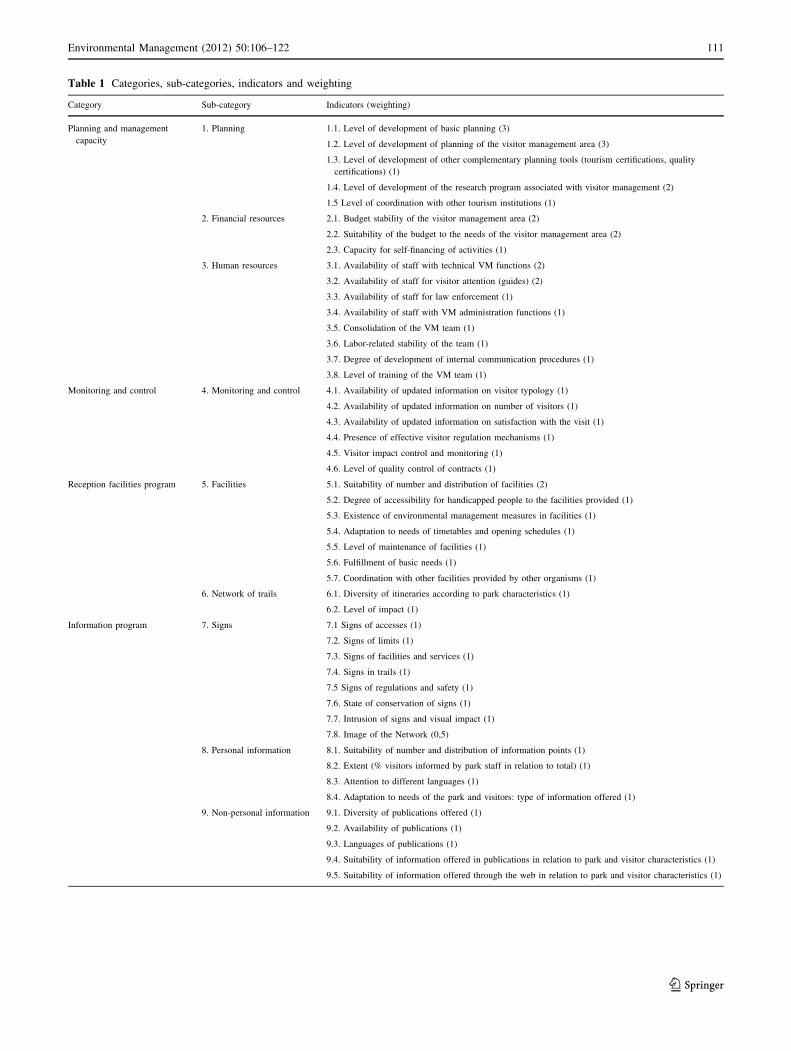
Different sub-categories and indicators were established
for each of them (see Table 1).
Selection of Indicators
Indicators are the most commonly used instruments for
developing evaluation methodologies, as they enable large
amounts of information to be synthesized in a small
number of relevant indexes, which serves to simplify the
analyses at different scales or levels (MacCool and Stankey
2004). They also favor both the identification of key
elements of pressure upon our scope of management,
enabling us to prioritize interventions therein, to evaluate
tendencies according to the objectives established and to
redefine these if this were to be necessary. The set of
interrelated indicators used in an evaluation method is
known as the indicator system. These should be coherent,
respond to common objectives, be subjected to the same
selection criteria and should also serve for decision-taking,
sharing the same structure.
As a reference document for the establishment of the
indicators and the quality standards, we used the Man-
agement Plan for the Spanish National Parks System
(Royal Decree 1803/199, 1999) which establishes specific
public use guidelines and goals for the System. We also
reviewed general literature concerning protected areas
evaluation based on indicators (e.g., De Faria 1993; Cayot
and Cruz 1998; Cifuentes and others 2000; Hockings and
others 2000; Sureda and others 2002; Mallarach and others
2004; Velasquez and others 2004; TNC 2004), reference
literature regarding visitor management (e.g., Hendee and
others 1990; Hammit and Cole 1998; Hornback and Eagles
1999; Benayas 2000; Manning and Lime 2000; Eagles and
others 2002; Newsome and others 2002) and specific lit-
erature regarding facilities, communication, interpretation
and education in protected areas (e.g., Ham 1992; Stokking
and others 1999; Weiler and Ham 2001; Sureda and others
2002; Knapp and Benton 2004; Hamu and others 2004;
Spanish Ministry of Environment 2005; Hesselink and
others 2007).
For each of the indicators we constructed a set of quality
conditions or criteria for the evaluation, in which the
optimum conditions is awarded the maximum value (4) and
the one furthest from optimum is given the minimum one
(1). Furthermore, within each category we assigned a
weighting to each indicator, according to the degree of
importance assigned thereto by the panel of experts. Four
point scale was preferred so the evaluators had to make a
definite choice rather than choose neutral or intermediate
positions. These scales demand much more from respon-
dents, but avoid the non-commital responses.
The panel first worked with a large amount of indicators
(120) which were successively subjected to analyses and
refining processes until the final list was established. For
each of the indicators representativeness, ease of collection
of the information and objectivity in its application were
discussed and appraised by the team of experts in a plenary
session. Likewise, the appraisal criteria for each one of
them were established by means of agreement. In the
selection of the indicators, future reviews and/or extensions
of the methodology proposed were considered. Following
this process, 100 indicators were selected, and subse-
quently tested in two pilot parks. Once the pilot tests were
conducted, indicators presenting low levels of agreement
110 Environmental Management (2012) 50:106–122
123
Page 6
Table 1 Categories, sub-categories, indicators and weighting
Category Sub-category Indicators (weighting)
Planning and management
capacity
1. Planning 1.1. Level of development of basic planning (3)
1.2. Level of development of planning of the visitor management area (3)
1.3. Level of development of other complementary planning tools (tourism certifications, quality
certifications) (1)
1.4. Level of development of the research program associated with visitor management (2)
1.5 Level of coordination with other tourism institutions (1)
2. Financial resources 2.1. Budget stability of the visitor management area (2)
2.2. Suitability of the budget to the needs of the visitor management area (2)
2.3. Capacity for self-financing of activities (1)
3. Human resources 3.1. Availability of staff with technical VM functions (2)
3.2. Availability of staff for visitor attention (guides) (2)
3.3. Availability of staff for law enforcement (1)
3.4. Availability of staff with VM administration functions (1)
3.5. Consolidation of the VM team (1)
3.6. Labor-related stability of the team (1)
3.7. Degree of development of internal communication procedures (1)
3.8. Level of training of the VM team (1)
Monitoring and control 4. Monitoring and control 4.1. Availability of updated information on visitor typology (1)
4.2. Availability of updated information on number of visitors (1)
4.3. Availability of updated information on satisfaction with the visit (1)
4.4. Presence of effective visitor regulation mechanisms (1)
4.5. Visitor impact control and monitoring (1)
4.6. Level of quality control of contracts (1)
Reception facilities program 5. Facilities 5.1. Suitability of number and distribution of facilities (2)
5.2. Degree of accessibility for handicapped people to the facilities provided (1)
5.3. Existence of environmental management measures in facilities (1)
5.4. Adaptation to needs of timetables and opening schedules (1)
5.5. Level of maintenance of facilities (1)
5.6. Fulfillment of basic needs (1)
5.7. Coordination with other facilities provided by other organisms (1)
6. Network of trails 6.1. Diversity of itineraries according to park characteristics (1)
6.2. Level of impact (1)
Information program 7. Signs 7.1 Signs of accesses (1)
7.2. Signs of limits (1)
7.3. Signs of facilities and services (1)
7.4. Signs in trails (1)
7.5 Signs of regulations and safety (1)
7.6. State of conservation of signs (1)
7.7. Intrusion of signs and visual impact (1)
7.8. Image of the Network (0,5)
8. Personal information 8.1. Suitability of number and distribution of information points (1)
8.2. Extent (% visitors informed by park staff in relation to total) (1)
8.3. Attention to different languages (1)
8.4. Adaptation to needs of the park and visitors: type of information offered (1)
9. Non-personal information 9.1. Diversity of publications offered (1)
9.2. Availability of publications (1)
9.3. Languages of publications (1)
9.4. Suitability of information offered in publications in relation to park and visitor characteristics (1)
9.5. Suitability of information offered through the web in relation to park and visitor characteristics (1)
Environmental Management (2012) 50:106–122 111
123
Page 7
among evaluators (more than one point of difference) were
detected and reformulated in a more objective way. Others
were eliminated due to lack of information or interest for
management (feedback was received from the managers).
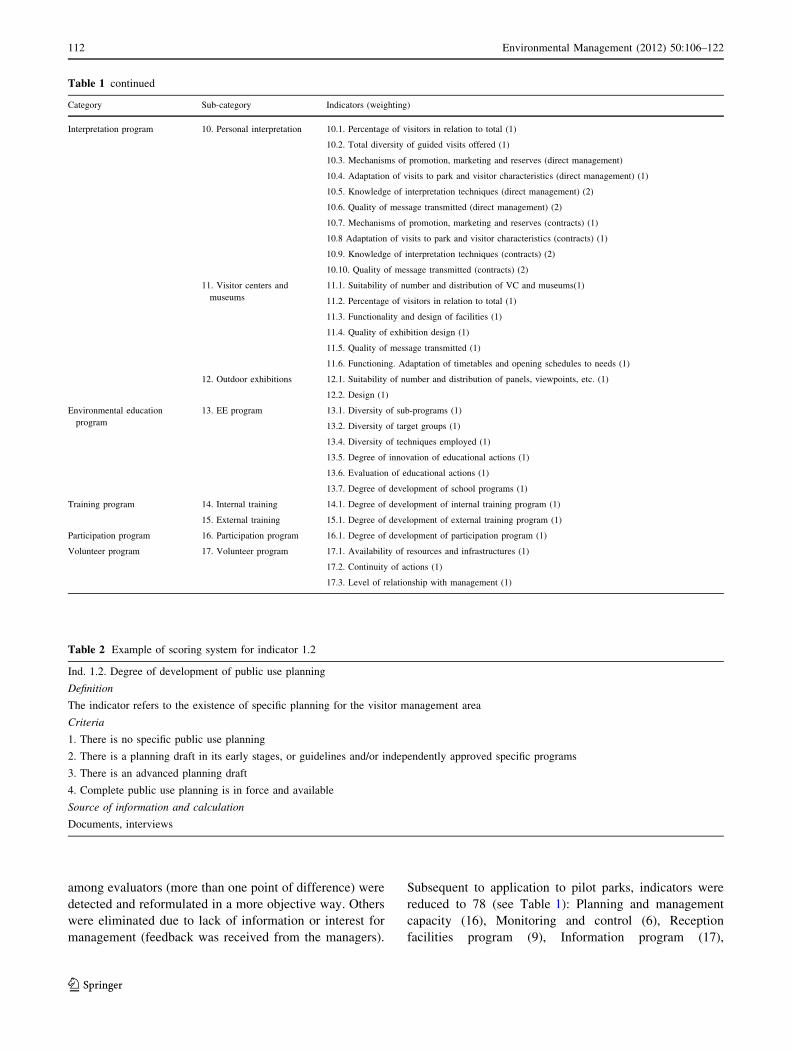
Subsequent to application to pilot parks, indicators were
reduced to 78 (see Table 1): Planning and management
capacity (16), Monitoring and control (6), Reception
facilities program (9), Information program (17),
Table 2 Example of scoring system for indicator 1.2
Ind. 1.2. Degree of development of public use planning
Definition
The indicator refers to the existence of specific planning for the visitor management area
Criteria
1. There is no specific public use planning
2. There is a planning draft in its early stages, or guidelines and/or independently approved specific programs
3. There is an advanced planning draft
4. Complete public use planning is in force and available
Source of information and calculation
Documents, interviews
Table 1 continued
Category Sub-category Indicators (weighting)
Interpretation program 10. Personal interpretation 10.1. Percentage of visitors in relation to total (1)
10.2. Total diversity of guided visits offered (1)
10.3. Mechanisms of promotion, marketing and reserves (direct management)
10.4. Adaptation of visits to park and visitor characteristics (direct management) (1)
10.5. Knowledge of interpretation techniques (direct management) (2)
10.6. Quality of message transmitted (direct management) (2)
10.7. Mechanisms of promotion, marketing and reserves (contracts) (1)
10.8 Adaptation of visits to park and visitor characteristics (contracts) (1)
10.9. Knowledge of interpretation techniques (contracts) (2)
10.10. Quality of message transmitted (contracts) (2)
11. Visitor centers and
museums
11.1. Suitability of number and distribution of VC and museums(1)
11.2. Percentage of visitors in relation to total (1)
11.3. Functionality and design of facilities (1)
11.4. Quality of exhibition design (1)
11.5. Quality of message transmitted (1)
11.6. Functioning. Adaptation of timetables and opening schedules to needs (1)
12. Outdoor exhibitions 12.1. Suitability of number and distribution of panels, viewpoints, etc. (1)
12.2. Design (1)
Environmental education
program
13. EE program 13.1. Diversity of sub-programs (1)
13.2. Diversity of target groups (1)
13.4. Diversity of techniques employed (1)
13.5. Degree of innovation of educational actions (1)
13.6. Evaluation of educational actions (1)
13.7. Degree of development of school programs (1)
Training program 14. Internal training 14.1. Degree of development of internal training program (1)
15. External training 15.1. Degree of development of external training program (1)
Participation program 16. Participation program 16.1. Degree of development of participation program (1)
Volunteer program 17. Volunteer program 17.1. Availability of resources and infrastructures (1)
17.2. Continuity of actions (1)
17.3. Level of relationship with management (1)
112 Environmental Management (2012) 50:106–122
123
Page 8
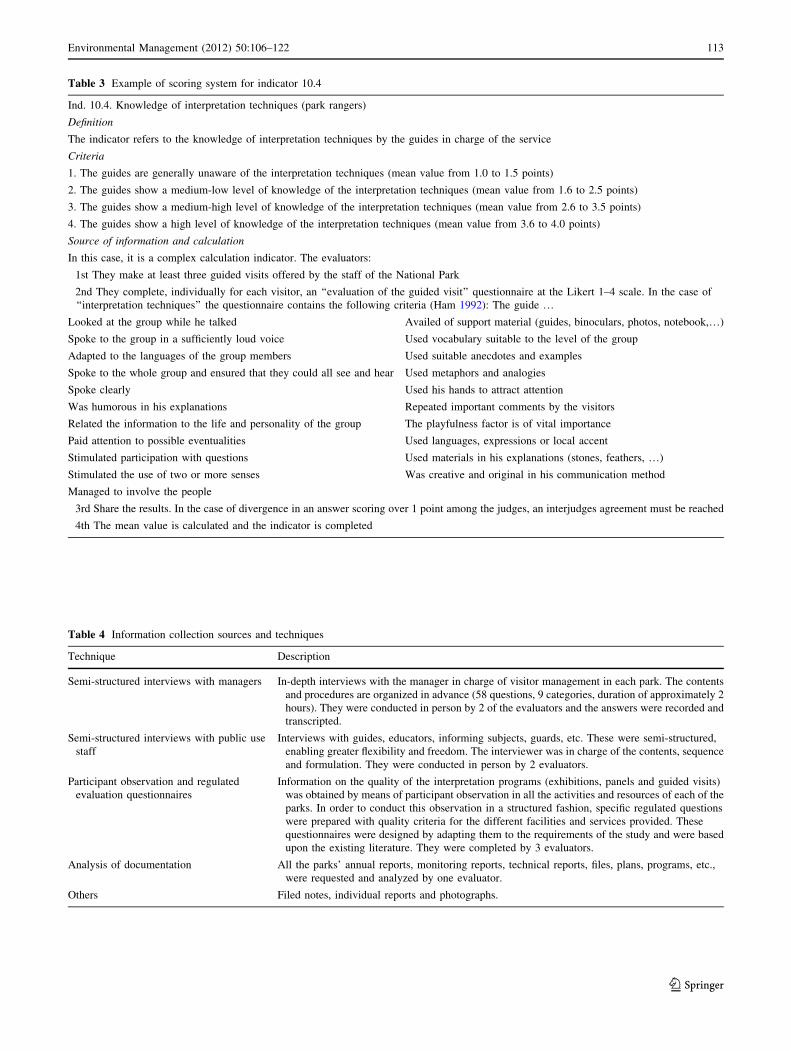
Table 3 Example of scoring system for indicator 10.4
Ind. 10.4. Knowledge of interpretation techniques (park rangers)
Definition
The indicator refers to the knowledge of interpretation techniques by the guides in charge of the service
Criteria
1. The guides are generally unaware of the interpretation techniques (mean value from 1.0 to 1.5 points)
2. The guides show a medium-low level of knowledge of the interpretation techniques (mean value from 1.6 to 2.5 points)
3. The guides show a medium-high level of knowledge of the interpretation techniques (mean value from 2.6 to 3.5 points)
4. The guides show a high level of knowledge of the interpretation techniques (mean value from 3.6 to 4.0 points)
Source of information and calculation
In this case, it is a complex calculation indicator. The evaluators:
1st They make at least three guided visits offered by the staff of the National Park
2nd They complete, individually for each visitor, an ‘‘evaluation of the guided visit’’ questionnaire at the Likert 1–4 scale. In the case of
‘‘interpretation techniques’’ the questionnaire contains the following criteria (Ham 1992): The guide …Looked at the group while he talked
Spoke to the group in a sufficiently loud voice
Adapted to the languages of the group members
Spoke to the whole group and ensured that they could all see and hear
Spoke clearly
Was humorous in his explanations
Related the information to the life and personality of the group
Paid attention to possible eventualities
Stimulated participation with questions
Stimulated the use of two or more senses
Managed to involve the people
Availed of support material (guides, binoculars, photos, notebook,…)
Used vocabulary suitable to the level of the group
Used suitable anecdotes and examples
Used metaphors and analogies
Used his hands to attract attention
Repeated important comments by the visitors
The playfulness factor is of vital importance
Used languages, expressions or local accent
Used materials in his explanations (stones, feathers, …)
Was creative and original in his communication method
3rd Share the results. In the case of divergence in an answer scoring over 1 point among the judges, an interjudges agreement must be reached
4th The mean value is calculated and the indicator is completed
Table 4 Information collection sources and techniques
Technique Description
Semi-structured interviews with managers In-depth interviews with the manager in charge of visitor management in each park. The contents
and procedures are organized in advance (58 questions, 9 categories, duration of approximately 2
hours). They were conducted in person by 2 of the evaluators and the answers were recorded and
transcripted.
Semi-structured interviews with public use
staff
Interviews with guides, educators, informing subjects, guards, etc. These were semi-structured,
enabling greater flexibility and freedom. The interviewer was in charge of the contents, sequence
and formulation. They were conducted in person by 2 evaluators.
Participant observation and regulated
evaluation questionnaires
Information on the quality of the interpretation programs (exhibitions, panels and guided visits)
was obtained by means of participant observation in all the activities and resources of each of the
parks. In order to conduct this observation in a structured fashion, specific regulated questions
were prepared with quality criteria for the different facilities and services provided. These
questionnaires were designed by adapting them to the requirements of the study and were based
upon the existing literature. They were completed by 3 evaluators.
Analysis of documentation All the parks’ annual reports, monitoring reports, technical reports, files, plans, programs, etc.,
were requested and analyzed by one evaluator.
Others Filed notes, individual reports and photographs.
Environmental Management (2012) 50:106–122 113
123
Page 9
Interpretation program (17), Environmental education
program (6), Training program (2), Participation program
(1), Volunteer program (3).
Two examples of indicators are included (Tables 2, 3).
The first one is the most frequently used. The second type
is used to evaluate the interpretation services and facilities
and requires regulated checking-lists for information
gathering (questionnaires, 1–4 Likert scales).
Information Collection: The Evaluation Team
Information was gathered by three external evaluators with
experience in similar evaluation studies on visitor man-
agement in protected areas (two within the university
context and one as a consultant). To gather the information,
an evaluation visit was made, lasting at least one week, to
each of the parks, and as many possible sources of infor-
mation were used, along with information collection
techniques (Table 4). In order to minimize the disadvan-
tages associated with the use of external evaluators, the
variables that required greater internal knowledge of the
institution (for example, the indicator referring to the Suf-
ficiency of funds) are included as direct questions in the
interview with the manager of each park.
Data Processing and Interpretation of Results
Information Synthesis
During the visits to the parks, interviews, questionnaires,
participant observation, etc. were done and documents with
data on visitor use levels, budgets, etc. were collected.
Following these visits, a descriptive file was created by one
of the judges which contained fundamental information
thereon (existing programs, available resources and facili-
ties, budgets, etc.). This file was delivered to the other
judges.
Individual Appraisal of the Indicators
Three evaluators were instructed in the purpose and use of
the tool. Training in the use of the tool included developing
consistent agreement on decision rules for assessing the
indicators. Each evaluator used the descriptive file inde-
pendently, together with their own annotations and
questionnaires.
Results Sharing and Collective Appraisal
Once the individual work had been done, the appraisal for
each indicator was shared with the other evaluators. In the
event of divergences in the appraisal of an indicator the
mean of the appraisals was used. If exceptionally the
divergence exceeded more than one point the evaluators
should comment the reasons for the divergence to confirm
they were using the same decision rules, and, if the dif-
ference was due to a problem with the interpretation of the
indicator, then the decision rules were jointly reviewed
again by the experts so as to reach an acceptable level of
agreement. Once this procedure was implemented no dif-
ferences higher than one point remained. As indicators
presenting low levels of interjudges agreement were
detected in the pilot tests and were reformulated or elimi-
nated, this happened less than 10 times, all regarding the
interpretation programs (further discussion below).
Calculation of Categories and Sub-categories
For the calculation of the sub-categories, we employed the
weighted averages of each of the indicators they comprise
(see Table 1).
Results
Study Case: Application of the Evaluation Model
to the Spanish National Park System
The evaluation presented attempted to establish a broad
perspective of visitor management in National Parks. The
results obtained provide information on the health of the
institution, detecting problems to which possible opera-
tional solutions are to be found and identifying good and
bad management practices.
The information obtained is of great value and has
provided us with interesting management conclusions.
Results were delivered to the National Parks managers both
as a report and in several discussion forums. Some of the
main results are now described:
Quality of the Visitor Management Model
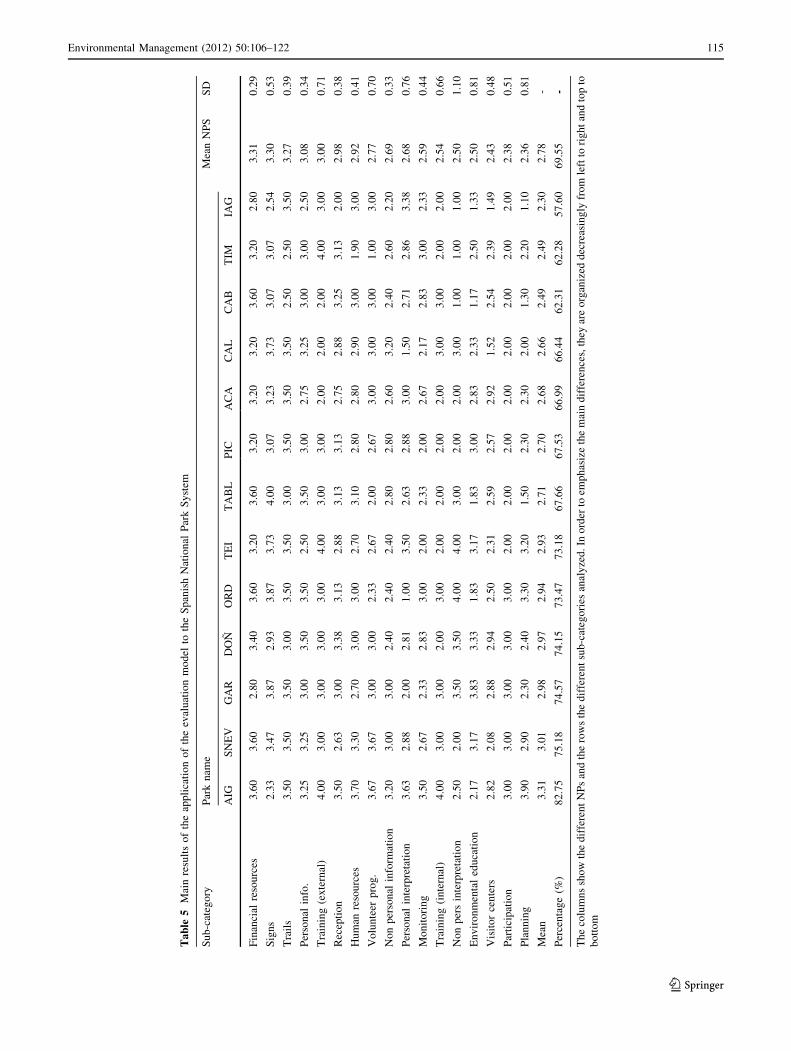
The results of the study show a good level of average
quality (70 % of the optimum) of visitor management in
the National Parks. None of the categories analyzed present
values close to the maxima or minima of the range of
possible scores (Table 5). The results obtained reveal dif-
ferences among Parks. The scope of variation of global
appraisal ranges from 83 % for the best appraisal to 58 %
for the worst one.
Financial Resources vs Planning
– The category obtaining the lowest results for the whole
System is planning (mean = 2.36, r = 0.81). The high
114 Environmental Management (2012) 50:106–122
123
Page 10
Ta
ble
5M
ain
resu
lts
of
the
app
lica
tio
no
fth
eev
alu
atio
nm
od
elto
the
Sp
anis
hN
atio
nal
Par
kS
yst
em
Su
b-c
ateg
ory
Par
kn
ame
Mea
nN
PS
SD
AIG
SN
EV
GA
RD
ON
OR
DT
EI
TA
BL
PIC
AC
AC
AL
CA
BT
IMIA
G
Fin
anci
alre
sou
rces
3.6
03
.60
2.8
03
.40
3.6
03
.20
3.6
03
.20
3.2
03
.20
3.6
03
.20
2.8
03
.31
0.2
9
Sig
ns
2.3
33
.47
3.8
72
.93
3.8
73
.73
4.0
03
.07
3.2
33
.73
3.0
73
.07
2.5
43
.30
0.5
3
Tra
ils
3.5
03
.50
3.5
03
.00
3.5
03
.50
3.0
03
.50
3.5
03
.50
2.5
02
.50
3.5
03
.27
0.3
9
Per
son
alin
fo.
3.2
53
.25
3.0
03
.50
3.5
02
.50
3.5
03
.00
2.7
53
.25
3.0
03
.00
2.5
03
.08
0.3
4
Tra
inin
g(e
xte
rnal
)4
.00
3.0
03
.00
3.0
03
.00
4.0
03
.00
3.0
02
.00
2.0
02
.00
4.0
03
.00
3.0
00
.71
Rec
epti
on
3.5
02
.63
3.0
03
.38
3.1
32
.88
3.1
33
.13
2.7
52
.88
3.2
53
.13
2.0
02
.98
0.3
8
Hu
man
reso
urc
es3
.70
3.3
02
.70
3.0
03
.00
2.7
03
.10
2.8
02
.80
2.9
03
.00
1.9
03
.00
2.9
20
.41
Vo
lun
teer
pro
g.
3.6
73
.67
3.0
03
.00
2.3
32
.67
2.0
02
.67
3.0
03
.00
3.0
01
.00
3.0
02
.77
0.7
0
No
np
erso
nal
info
rmat
ion
3.2
03
.00
3.0
02
.40
2.4
02
.40
2.8
02
.80
2.6
03
.20
2.4
02
.60
2.2
02
.69
0.3
3
Per
son
alin
terp
reta
tio
n3
.63
2.8
82
.00
2.8
11
.00
3.5
02
.63
2.8
83
.00
1.5
02
.71
2.8
63
.38
2.6
80
.76
Mo
nit
ori
ng
3.5
02
.67
2.3
32
.83
3.0
02
.00
2.3
32
.00
2.6
72
.17
2.8
33
.00
2.3
32
.59
0.4
4
Tra
inin
g(i
nte
rnal
)4
.00
3.0
03
.00
2.0
03
.00
2.0
02
.00
2.0
02
.00
3.0
03
.00
2.0
02
.00
2.5
40
.66
No
np
ers
inte
rpre
tati
on
2.5
02
.00
3.5
03
.50
4.0
04
.00
3.0
02
.00
2.0
03
.00
1.0
01
.00
1.0
02
.50
1.1
0
En
vir
on
men
tal
edu
cati
on
2.1
73
.17
3.8
33
.33
1.8
33
.17
1.8
33
.00
2.8
32
.33
1.1
72
.50
1.3
32
.50
0.8
1
Vis
ito
rce
nte
rs2
.82
2.0
82
.88
2.9
42
.50
2.3
12
.59
2.5
72
.92
1.5
22
.54
2.3
91
.49
2.4
30
.48
Par
tici
pat
ion
3.0
03
.00
3.0
03
.00
3.0
02
.00
2.0
02
.00
2.0
02
.00
2.0
02
.00
2.0
02
.38
0.5
1
Pla
nn
ing
3.9
02
.90
2.3
02
.40
3.3
03
.20
1.5
02
.30
2.3
02
.00
1.3
02
.20
1.1
02
.36
0.8
1
Mea
n3
.31
3.0
12
.98
2.9
72
.94
2.9
32
.71
2.7
02
.68
2.6
62
.49
2.4
92
.30
2.7
8-
Per
cen
tag
e(%
)8
2.7
57
5.1
87
4.5
77
4.1
57
3.4
77
3.1
86
7.6
66
7.5
36
6.9
96
6.4
46
2.3
16
2.2
85
7.6
06
9.5
5-
Th
eco
lum
ns
sho
wth
ed
iffe
ren
tN
Ps
and
the
row
sth
ed
iffe
ren
tsu
b-c
ateg
ori
esan
aly
zed
.In
ord
erto
emp
has
ize
the
mai
nd
iffe
ren
ces,
they
are
org
aniz
edd
ecre
asin
gly
fro
mle
ftto
rig
ht
and
top
to
bo
tto
m
Environmental Management (2012) 50:106–122 115
123
Page 11
number of visits to these areas make this situation
especially serious. Although managers are becoming
increasingly aware of the advantages of good planning,
it appears that the urgent matters left no time for the
important ones and in most cases greater priority has
been given to the inflow of visitors and the problems
they cause than to planning.
– The category obtaining the highest score is financial
resources (mean = 3.31, r = 0.29). In objective terms,
the budgets available for management in national parks
are much higher than the average for other protected
areas in Spain. Notwithstanding this overall sufficiency
of funding, managers pointed out that budget items
were not always properly balanced. In particular, they
reported some problems due to underfunding of human
resources.
Do We Know What We are Doing?
– The mean for the category of monitoring and control is
2.59 (r = 0.44). In recent years, good systems have
been developed for quantifying visits and for typifying
them. There are, however, practically no visitor studies
(satisfactions, disappointments, suggestions …) (mean
ind. 4.3 = 1.69, r = 0.95). Even though the method
here used is based on external appraisal and not in
visitors’ inputs, as justified above, visitor studies are
also necessary for managers to have a permanent
feedback.
– Problems were identified relating to quality control of
the services provided by contracted companies (mean
ind. 4.6 = 2.08, r = 0.64).
On the Facilities Provided
– The System’s reception facilities program presents a
good level of quality for the sub-category trails
(mean = 3.27, r = 0.39) which is somewhat lower for
the rest of the facilities (mean = 2.98, r = 0.38).
– No serious problems were detected relating to impacts
on trails (mean ind. 6.2 = 3.23, r = 0.44). In very few
cases, episodes were identified that required urgent
restoration measures; in other cases, these had been
adopted, with frequent use of buffering facilities.
– The general facilities are good (mean ind. 5.1 = 3.00,
r = 0.58), with problems only in the two recently
created Parks. Problems were detected which related
only to accessibility for handicapped people, thus
reflecting the lower priority given to these aspects in
the Parks (and in Spanish society as a whole) until the
last decade.
– Problems were detected in relation to the coordination
of the supply of facilities with those of other admin-
istrations (mean ind. 5.7 = 1.92, r = 0.95). On occa-
sions, we detected overabundance of facilities in a
given territory, with duplicated functions.
Communication and Environmental Education
As a whole, the results obtained exhibit high quality values
for the signs, and personal information programs, lower
ones for the volunteer, information training and non-per-
sonal information programs and low values for the pro-
grams relating to environmental education, participation
and interpretation through non-personal media.
Information
– The high values for the personal information
(mean = 3.08, r = 0.34) and signs (mean = 3.30,
r = 0.53) programs, reflect the large effort invested in
these themes in recent years. The data show, however,
that the role of the System web page is still underused
for these purposes (mean ind. 9.5 =2.00, r=0). Like-
wise, other places or facilities next to the Parks but not
depending upon the National Parks Administration (but
other parks or tourism administrations) remain unused;
if coordinated and supervised, these could provide
useful information services to National Parks’ visitors.
Interpretation
– On average, personal interpretation is valued for the
System higher than any other means of non-personal
interpretation (mean = 2.68, r = 0.76).
– Although the visitor centers greatly fulfill their recep-
tion facilities and information functions, they present
problems in relation to communication of interpretation
messages (mean = 2.43, r = 0.36). The quality of the
facilities (location, design, safety, etc.) and functioning
(timetables, maintenance, environmental management,
etc.) of these centers show high values; nonetheless, the
aspects relating to the functionality thereof (support for
management, interpretation, fulfillment of basic needs,
etc.) exhibit lower values.
– With regard to the personal interpretation, our results
show clear differences between the quality of services
managed directly by the Parks or of those managed by
enterprises. Knowledge of interpretation techniques
(ind. 10.5, 10.9) and quality of contents and delivery of
the message (ind. 10.6 and 10.10) score higher in all
cases relating to services provided by Park guides. On
the contrary, results show that contracted companies
116 Environmental Management (2012) 50:106–122
123
Page 12
avail of better marketing systems and reserves of the
services they provide (ind. 10.3 and 10.7).
Environmental Education
– Our results show a mean value for the category of the
whole of the System of 2.5 (r = 0.81), thus revealing
great variability among Parks. Five parks have very
basic environmental education programs aimed at
schoolchildren only. Other parks have made an effort to
diversify their programs and broaden their target
groups.
Participation and volunteers
– All 13 parks avail of constituted public participation
organs, but public participation, however, plays a scant
role in management (mean = 2.38, r = 0.51). The
parks generally have infrastructures and staff to deal
with the needs of the volunteer programs
(mean = 2.77, r = 0.70), although these occasionally
involve an extra workload. Only in one park are these
activities not conducted due to a lack of sufficient
human resources.
Discussion
There is a growing body of literature available on program
evaluation beginning with Theobald’s seminal text on
evaluation of Recreation and Park Programs (Theobald
1979). Many authors have reviewed evaluative concepts,
and have discussed the importance of evaluation (see for
example Sanders 1994; Hockings and others 2000; Weiler
and Ham 2001; Ervin 2003). There are many reasons for
evaluation and they vary for each situation. Evaluating
management of a protected area is not only a way of
identifying problems, but also informs us whether the
programs and strategies chosen work (Hockings 2000). The
literature is growing and there is general agreement
between the scholars that evaluation is a key aspect in the
pursuit of more effective administration. As a result,
assessments are increasingly being conducted by govern-
ment agencies (Leverington and others 2010). But, despite
all, the fact is not all parks evaluate systematically their
policies, programs or resources. That is the case of the
Spanish National Park System. In a country with little
tradition in the evaluation of the results of public policies,
evaluation of management of protected areas in general,
and of visitor management in particular, remains an issue
to be addressed. In this context, the present study and the
results obtained provide a great amount of information
which enables us to address quality evaluation of the public
use of the system studied and provides a useful instrument
for the management thereof.
Therefore, the objective of this paper does not only
involve analyzing the results of the management of public
use of the parks studied, but also to check the validity and
potentiality of the evaluation instrument applied. In this
context, further discussion of some key aspects follows.
Method Selection
The evaluation model used in this research is a standard
approach based on indicators, using independent evalua-
tors. It is based on available management literature, both in
the selection of the categories and indicators. It differs
from other similar methodologies (such as Cayot and Cruz
1998; Ervin 2003; TNC 2004) in that it has been specifi-
cally tailored to address public use issues in depth, and, as
discussed above, in its using of independent evaluators
instead of park managers opinions or visitors opinions. The
use of the instrument developed presents big advantages:
a) It enables large amounts of information to be summa-
rized in a small number of relevant indexes which
serves to simplify the analyses at different scales or
levels.
b) Facilitates comparison among different parks.
c) Enables good practices or opportunities for improve-
ment to be detected.
d) Periodic application thereof can provide information
on the evolution of visitor management over time,
showing achievements and advances, as well as the
tendencies followed.
e) Although the design of the methodology was adjusted
for application to a specific parks system, it can easily
be adapted and employed in other protected areas.
Despite the big advantages offered by this kind of semi-
quantitative evaluation instruments, however, they also
involve a series of limitations that should be considered on
interpreting the results obtained. Firstly, the design of the
whole instrument is conditioned by two factors: its neces-
sary application to a heterogeneous set of parks, and the
possibility of obtaining the information in a reasonably
easy manner.
This involves difficulties mainly within the scope of
participation, volunteer and environmental education pro-
grams where, in order to establish the real quality thereof,
one must avail of in-depth evaluations. In the case of
environmental education programs, one example is the
need for an evaluation that would entail attending the
interventions and conducting prior and subsequent evalu-
ations. The evaluation instrument designed can only make
Environmental Management (2012) 50:106–122 117
123
Page 13
a formal appraisal of these programs and their results and
must therefore be interpreted bearing this in mind (for
example, changes in program users’ behavior are not
monitored). Likewise, the evaluation instrument lacks
indicators of the effect of the visitor management model on
the sustainable development of the parks.
The use of independent evaluators provides greater
neutrality, but causes problems inherent to information
access, particularly due to the high number of indicators
used. For purposes of this research, and in order to state the
reliability of the instrument, a panel of evaluators was used,
which is an expensive approach. The cost could be mini-
mized using a more participatory approach, including park
staff in its application (see below).
Selection of the Categories and Indicators
Throughout the evaluation process, the method and eval-
uation team chosen, along with the criteria for selecting the
indicators, will have a great impact upon the result
obtained (MacCool and Stankey 2004).
Overall goals and general policies for visitation in
Spanish National Parks (e.g., to provide visitors with
information and education, not to charge fees for entrance
or for basic information services) are stated in the Man-
agement Plan for the Spanish National Parks System
(Royal Decree 1803/199, 1999) and redefined in each
park’s management plan. But we found big differences
among parks. Some of the parks had well developed
management plans but others did not have any. Therefore
the general goals stated by the Management Plan for the
Spanish National Parks System (which has a legal status,
and must be met by all the parks) were used as a basis for
the selection of the categories and indicators.
Quality of visitor management has been assessed for:
Planning and management capacity (planning, funding,
human resources); monitoring, reception, information,
interpretation, environmental education, training, partici-
pation and volunteer’s programs. As said above these cat-
egories were selected and adapted specifically for the
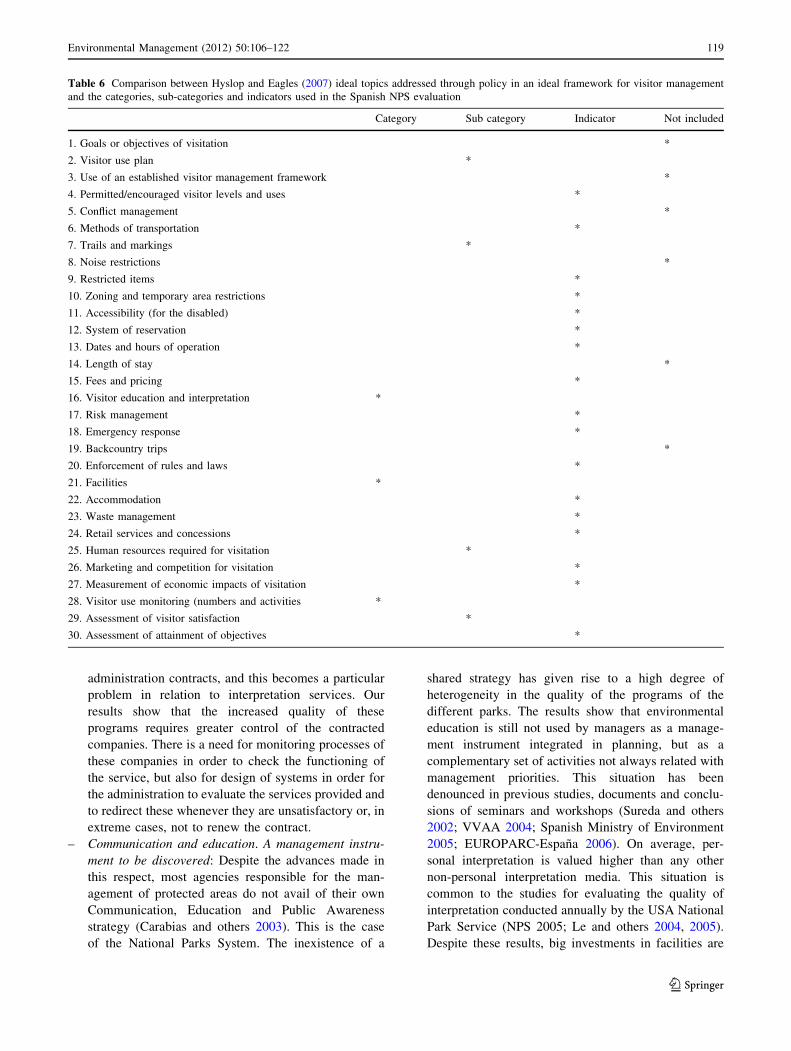
Spanish National Park System. Hyslop and Eagles (2007)
listed 30 different categories of visitor management policy
in an ideal framework for visitors management. Table 6
shows the comparison between the categories listed by
these authors and the categories used in this study.
Twenty four of the thirty categories used by Hyslop and
Eagles can be referred to our categories. Some of them
were included not as a category, but in the form of indi-
cators. As an example, there is no category for ‘Fees’ or
‘Marketing and Competition for Visitation’ as in the
Spanish NPS fees are not as important as in other systems.
There is a general policy stating that park access should be
free and that basic services (information, interpretation,…)
should have no cost for visitors and that complementary
services, as food and accommodation, should be provided
outside the parks. Therefore we decided not to establish a
whole category but an indicator (indicator 2.3. analyzes the
capacity for self-financing of the activities). Yet there are
six categories not considered by us, some do not fit with the
attributions of the individual Spanish National Parks (e.g.
use of an established visitor management framework),
others were not deemed relevant for visitor management in
the Spanish context when the study was conducted (e.g.,
backcountry trips) but could be included in further studies.
Identifying Current Key Issues for the Spanish National
Parks
We have presented some results obtained following the
application of the method to Spanish National Parks. The
instrument has proved itself as a good tool to identify
management key issues, detecting weaknesses and
strengths:
– Overall quality: the results shows how, although there
is room for improvement, the general situation can be
considered acceptable. The four parks with best general
appraisal also avail of certification systems and of
formal mechanisms for integration in the tourism
dynamics of the area. It could be that these certification
systems do raise the overall quality of visitor manage-
ment, or that parks with good level of management are
less resistant to the use of externally monitoring
certification systems.
– Planning models: Planning exhibits deficiencies despite
availing of appreciable financial resources; what guar-
antee is there that these resources are being invested in
the best way possible? Not planning means that many
decisions are taken due to urgent needs by management
or for political reasons. This vicious circle has been
criticized before (Blanco 2001; Corraliza and others
2002; Rosabal 2005): the lack of planning and the high
number of visits at determined times of the year mean
that resources and budget funds increase in the months
with most visits (when daily needs prevent planning)
and staff are not re-hired at times of fewer visits, rather
than being used for these planning tasks. Efforts have
been attempted in recent years aimed at mitigating
these tendencies, with specific funds and resources for
planning, but it could be that the current planning
models are not able to function in a period of rapid
change. Planning takes too long and is too expensive.
Based on the results, an in deep reflexion about the
planning approach should be made.
– Control systems: The results show how there is hardly
any control of fulfillment of the conditions set out in
118 Environmental Management (2012) 50:106–122
123
Page 14
administration contracts, and this becomes a particular
problem in relation to interpretation services. Our
results show that the increased quality of these
programs requires greater control of the contracted
companies. There is a need for monitoring processes of
these companies in order to check the functioning of
the service, but also for design of systems in order for
the administration to evaluate the services provided and
to redirect these whenever they are unsatisfactory or, in
extreme cases, not to renew the contract.
– Communication and education. A management instru-
ment to be discovered: Despite the advances made in
this respect, most agencies responsible for the man-
agement of protected areas do not avail of their own
Communication, Education and Public Awareness
strategy (Carabias and others 2003). This is the case
of the National Parks System. The inexistence of a
shared strategy has given rise to a high degree of
heterogeneity in the quality of the programs of the
different parks. The results show that environmental
education is still not used by managers as a manage-
ment instrument integrated in planning, but as a
complementary set of activities not always related with
management priorities. This situation has been
denounced in previous studies, documents and conclu-
sions of seminars and workshops (Sureda and others
2002; VVAA 2004; Spanish Ministry of Environment
2005; EUROPARC-Espana 2006). On average, per-
sonal interpretation is valued higher than any other
non-personal interpretation media. This situation is
common to the studies for evaluating the quality of
interpretation conducted annually by the USA National
Park Service (NPS 2005; Le and others 2004, 2005).
Despite these results, big investments in facilities are
Table 6 Comparison between Hyslop and Eagles (2007) ideal topics addressed through policy in an ideal framework for visitor management
and the categories, sub-categories and indicators used in the Spanish NPS evaluation
Category Sub category Indicator Not included
1. Goals or objectives of visitation *
2. Visitor use plan *
3. Use of an established visitor management framework *
4. Permitted/encouraged visitor levels and uses *
5. Conflict management *
6. Methods of transportation *
7. Trails and markings *
8. Noise restrictions *
9. Restricted items *
10. Zoning and temporary area restrictions *
11. Accessibility (for the disabled) *
12. System of reservation *
13. Dates and hours of operation *
14. Length of stay *
15. Fees and pricing *
16. Visitor education and interpretation *
17. Risk management *
18. Emergency response *
19. Backcountry trips *
20. Enforcement of rules and laws *
21. Facilities *
22. Accommodation *
23. Waste management *
24. Retail services and concessions *
25. Human resources required for visitation *
26. Marketing and competition for visitation *
27. Measurement of economic impacts of visitation *
28. Visitor use monitoring (numbers and activities *
29. Assessment of visitor satisfaction *
30. Assessment of attainment of objectives *
Environmental Management (2012) 50:106–122 119
123
Page 15
still prioritized. The high levels of investment in recent
years in visitors centers (up to 11 million euros per
center) do not correspond with the quality of the
interpretation exhibitions, or the changes these cause in
the visitors. Again, a deep reflection on the model that
is being followed should be made.
On the Reliability and Validity of the Instrument
As already said, the use of an expert panel to evaluate a
program based on a standard set of criteria is an appro-
priate, but expensive approach. Given that a new instru-
ment was developed, to assess its reliability, all three
evaluators were used not only in the selection and initial
validation of the indicators but through all the process.
Pilot tests were undertaken, to assess the feasibility con-
siderations surrounding data gathering and the internal
validity of the instrument (as discussed in the methodology
section great care was taken to ensure the rigor of the
procedure). All indicators presenting low inter-rater reli-
ability in this phase of the study were detected and refor-
mulated in a more objective way in order to minimize the
divergences. This process was done twice. Therefore the
final instrument was build as robust as possible (even if the
problems for some of the categories cited above remained).
During the subsequent application of the instrument to
all the National Parks no divergences occurred between the
judges but with the criteria for evaluating the interpretation
programs. Due to the special characteristics of these pro-
grams, and the in-depth evaluations that were conducted
(assessing aspects regarding communication, knowledge of
techniques, message, etc.) the indicators used for this cat-
egory were more complicated and information demanding.
In further studies a review of this category should be made,
in order to simplify the indicators. Nevertheless, the fact
that, in a consistent way, variations in measurements when
taken by different evaluators proved to be low also in this
category supports the overall inter–rater reliability of the
instrument.
The validity of the instrument is also supported by the
results discussed above:
– The parks with best general appraisal also avail of
certification systems.
– The lowest rated park is the ‘‘youngest’’ one, created
only two years prior to the study, and with an incipient
management system.
– The heterogeneous results between the parks are
consistent with the lack of a detailed visitor’s manage-
ment policy for the whole System.
– Several of the problems and key issues detected, were
pointed out by several authors previously in other
partial studies.
– Regarding face validity it may be pointed out, that the
park managers and staff generally agree with the study
(when explained what is measured and what is not
measured by the indicators)
Therefore we argue that the developed instrument ful-
fills its objective of assessing the management of public use
of the system studied. Overall, content validity is deemed
satisfactory, considering the broad range of categories and
indicators used. Regarding to its external validity we think
the method, with few modifications, could be used in other
parks and systems, therefore presenting a good level of
transferability. Even though it is a methodological proposal
specifically designed for systems or networks of protected
areas, it could be also used in individual parks.
As pointed out above, an evaluation panel formed only
by external experts is an expensive approach, and a more
reasonable way to gain the information the researchers are
attempting to obtain could be the participation of the
managers and staff of the parks, using it as a formative tool.
By means of participation of the key public use actors,
evaluation can become a critical exercise of reflection upon
the models created.
Concluding Remarks
This paper proposes a tool for defining reliable quality
standards and indicators, to be used in the different public
use models and for the design of systematic evaluation
strategies. This is a difficult task which cannot be suc-
cessfully addressed exclusively within the academic scope;
it should be shared by as many of the stakeholders involved
as possible. Therefore, although the instrument has proven
to constitute a useful and valuable evaluation tool, it pre-
sents certain shortcomings derived from the characteristics
of the study, which was external and limited by time and
funds. There is a need to gradually address this problem, in
each case adapting the indicators to more objective criteria
through the participation of the managers involved and by
incorporating new economic and social indicators. There is
also a need for greater participation by park staff in their
application, for training purposes. By means of participa-
tion of the key public use actors, evaluation can become a
critical exercise of reflection upon the models created.
Acknowledgments The present paper is part of the research project
‘‘Evaluation and funding of public use in protected natural areas. The
case of the Spanish Network of National Parks’’, conducted at the
Dept. of Ecology of Madrid’s Autonoma University and financed by
the Spanish Ministry of the Environment’s Organismo Autonomo de
Parques Nacionales, project 102/2002. The authors are grateful for the
funding and would like to thank all the staff of the protected areas for
their help. Thanks are also due to the anonymous reviewers for their
helpful suggestions to improve this manuscript.
120 Environmental Management (2012) 50:106–122
123
Page 16
References
Absher JD, Bright AD (2004) Communication research in outdoor
recreation and natural resources management. In: Manfredo MJ,
Vaske JJ, Bruyere BL, Field DR, Brown PJ (eds) Society and
natural resources: a summary of knowledge. Missouri, Jefferson,
pp 117–126
Archer D, Wearing S (2003) Self, space, and interpretive experience.
Journal of Interpretation Research 8(1):7–23
Benayas J, Blanco R, Gutierrez J (2000) Evaluacion de la calidad de
las visitas guiadas a espacios naturales protegidos. Topicos en
Educacion Ambiental 2(5):69–78
Benayas J (Coord.) (2000) Manual de buenas practicas del monitor de
Naturaleza: espacios naturales protegidos de Andalucıa. Junta de
Andalucıa. Sevilla, Spain, p 250
Blanco R (2001) La Situacion de Partida del uso Publico en la red de
Parques Nacionales. Un diagnostico para mejorar la gestion.
Proceedings II jornadas tecnicas sobre uso publico en la Red de
Parques Nacionales. Almagro 12–14 de noviembre de 2001
Blanco R (2006) El turismo de naturaleza en Espana y su plan de
impulso. Estudios Turısticos 169–170:7–38
Carabias J, De La Maza J, Cadena R (Coord.) (2003) Capacidades
necesarias para el manejo de areas protegidas. America Latina y
el Caribe. The Nature Conservancy, Arlington, Virginia
Cayot L, Cruz F (1998) Manual para la evaluacion de la eficiencia de
Manejo del Parque Nacional Galapagos. Servicio Parque Nacional
Galapagos. Instituto Ecuatoriano Forestal y de Areas Naturales y
Vida Silvestre, Puerto Ayora, Islas Galapagos, Ecuador
Cifuentes M, Izurieta A, de Faria H (2000) Measuring protected area
management effectiveness. WWF, GTZ, IUCN, Costa Rica
Corraliza JA, Garcıa J, Valero E (2002) Los Parques Naturales en
Espana: conservacion y disfrute. Mundiprensa, Madrid
De Faria H (1993) Elaboracion de un procedimiento para medir la
efectividad del manejo de areas silvestre protegidas y su
aplicacion en dos areas protegidas de Costa Rica. Thesis
Magister Scientiae. CATIE, Turrialba, Costa Rica
Dudley N, Hockings M, Solton S (1999) Measuring the effectiveness
of protected areas management. In: Dudley N, Solton S (eds)
Partnerships for protection. Earthscan, London
Eagles PFJ (2004) Trends affecting tourism in Protected Areas. In:
Working papers of the Finnish Forest researching Institute.
Working Papers of the Finnish Forest Research Institute 2,
18–26
Eagles PFJ, McCool SF, Haynes CDA (2002) Sustainable tourism in
protected areas: guidelines for planning and management. IUCN
Gland, Cambridge, p 183
Ervin J (2003) WWF: rapid assessment and prioritization of protected
area management (RAPPAM) methodology. WWF Gland,
Switzerland
EUROPARC-Espana (2006) Evaluacion del papel que cumplen los
equipamientos de uso publico en los espacios naturales prote-
gidos. Fundacion Fernando Gonzalez Bernaldez, Madrid, p 96
EUROPARC-Espana (2009) Anuario EUROPARC-Espana del estado
de los espacios naturales protegidos. Fundacion Fernando
Gonzalez Bernaldez, Madrid, p 160
EUROPARC-Espana (2010) Herramientas para la evaluacion de las
areas protegidas: modelo de memoria de gestion. Fundacion
Fernando Gonzalez Bernaldez, Madrid, p 121
Ham S (1992) Environmental interpretation: a practical guide for people
with big ideas and small budgets. Fulcrum Pub, Colorado, p 431
Hammit WE, Cole DN (1998) Wildland recreation: ecology and
management, 2nd edn. Wiley, New York, p 341
Hamu D, Auchincloss E, Goldstein W (eds) (2004) Communicating
protected areas, commission on education and communication.
IUCN, Gland, p 312
Hendee JC, Stanley GH, Lucas RC (1990) Wilderness management.
North American Press, Fulcrum publishing, Golden Colorado, p 540
Hesselink F, Goldstein W, Paul P; Garnett T, Dela J, Alm A (2007)
Communication, education and public awareness, a toolkit for
the convention on biological convention. Montreal, p 331
Hockings M (2000) Evaluating protected area management. a review
of systems for assessing management effectiveness of protected
areas. School of natural and Rural Systems Management,
Queensland
Hockings M, Stolton S, Dudley N, Phillips A (Eds) (2000) Evaluating
effectiveness—a framework for assessing the management of
protected areas. Best Practice Protected Area Guidelines Series
No. 6. IUCN, Gland, p 121
Hornback KE, Eagles PFJ (1999) Guidelines for public use
measurement and reporting at parks and protected areas. IUCN,
Gland, p 90
Hyslop KE, Eagles PFJ (2007) Visitor management policy of
protected areas in Canada and the United States. Leisure/Loisir
31(2):475–499
Knapp D, Benton MS (2004) Elements to successful interpretation: a
multiple case study of five national parks. Journal of Interpre-
tation Research 9(2):9–26
Laven DN, Manning RE, Krymkowski DH (2005) The relationship
between visitor-based standards of quality and existing condi-
tions in parks and outdoor recreation. Leisure Sciences
27(157–173):2005
Le Y, Littlejohn M, Hoger J, Hollenhorst S (2004) Serving the visitor
2003. Report on visitors to the National Park System. National
Park Service Visitor Services Project. University of Idaho Park
Studies Unit, Moscow, p 30
Le Y, Littlejohn M, Hoger J, Hollenhorst S (2005) Serving the visitor
2004. Report on visitors to the National Park System. National
Park Service Visitor Services Project. University of Idaho Park
Studies Unit, Moscow, p 32
Leverington F, Lemos Costa K, Pavese H, Lisle A, Hockings M
(2010) A global analysis of protected area management effec-
tiveness. Environmental Management 46:685–698
MacCool SF, Stankey GH (2004) Indicators of sustainability:
challenges and opportunities at the interface of science and
policy. Environmental Management 33(3):294–305
MacKay KJ, Crompton JL (1990) Measuring the quality of recreation
services. Journal of Park and Recreation Administration
8(3):47–56
Mallarach JM, Vila J, Varga D (Eds) (2004) El PEIN deu anys
despres: balanc i perspectives. Diversitas 50:29–4. Catedra de
Geografia i Pensament Territorial, University Girona, Girona
Manning RE (1999) Studies in outdoor recreation: search and
research for satisfaction, 2nd edn. Oregon State University
Press, Corvallis, p 374
Manning RE, Freymund WA (2004) Visual research methods to
measure standards of quality for parks and outdoor recreation.
Journal of leisure research 36(4):557–579
Manning RE, Lawson SR (2002) Carrying capacity as informed
judgment: the values of science and the science of values.
Environmental Management 30:157–168
Manning RE, Lime DW (2000) Defining and managing the quality of
wilderness recreation experiences. In: McCool SF, Cole DN,
Borrie WT, O’Loughlin J (compilers) Wilderness science in a
time of change conference. Proceedings of USDA, Forest
Service, May 23–27, 1999 Missoula, Montana, Ogden
Manning RE, Valliere W, Minteer B (1999) Values, ethics, and
attitudes toward National forest management. Society and
natural resources 12(5):421–436
Marion JL, Reid SE (2007) Minimising visitor impacts to protected
areas: the efficacy of low impact education programs. Journal of
Sustainable Tourism 15(1):5–27
Environmental Management (2012) 50:106–122 121
123
Page 17
Millennium Ecosystem Assessment (2003) Ecosystems and human
well-being: a framework for assessment. Island Press, Washing-
ton, DC, p 245
Ministerio Medio de Ambiente Espana de (Spanish Ministry of
Environment) (2005) Orientaciones para planes de CECoP
(Comunicacion, Educacion, Concienciacion y Participacion) en
humedales espanoles. Ministerio de Medio Ambiente, Madrid,
p 96
Monz CA, Cole DN, Leung Y, Marion JL (2010) Sustaining visitor
use in protected areas: future opportunities in recreation ecology
research based on the USA experience. Environmental Manage-
ment 45:551–562
Moore SA, Polley A (2007) Defining indicators and standards for
tourism impacts in protected areas: cape range National Park,
Australia. Environmental Management 39:291–300
Moore SA, Dmithe AJ, Newsome DN (2003) Environmental perfor-
mance reporting for natural areas tourism: contributions by
visitor impact management frameworks and their indicators.
Journal of sustainable tourism 11(4):348–375
Newsome D, Moore S, Dowling RK (2002) Natural area tourism
ecology. Impacts and management. Channel View Publications,
Clevedon
OAPN (2010). Annual Report 2010. Organismo Autonomo de
Parques Nacionales. Ministerio de Medio Ambiente. Madrid
Rosabal P (2005) >Como es nuestra gestion? La evaluacion de
efectividad de la gestion en areas protegidas como mecanismo
para mejorar nuestras acciones. Proceedings X Congreso
EUROPARC-Espana. Fundacion Fernando Gonzalez Bernaldez.
Madrid, p 104
Royal Decree 1803/199 (1999) Management Plan for the Spanish
National Parks System
Sanders JR (1994) The program evaluation standards: how to assess
evaluations of educational programs 2nd Ed. Sage Publications,
Thousand Oaks
Stewart WP, Cole DN (2003) On the prescriptive utility of visitor
survey research: a rejoinder to manning. Journal of Leisure
Research 35:119–127
Stokking K, van Aert L, Meijberg W, Kaskens A (1999) Evaluating
environmental education. IUCN, Gland, p 134
Stolton S, Hockings M, Dudley N, MacKinnon K, Whitten T (2003)
Reporting progress in protected areas: a site-level management
effectiveness tracking tool. World Bank/WWF Alliance for
Forest Conservation and Sustainable Use
Stolton S, Hockings M, Dudley N, MacKinnon K, Whitten T,
Leverington F (2007) The management effectiveness tracking
tool (METT) reporting progress at protected. Area Sites: Second
Edition. WWF International, Gland
Sureda Negre J, Oliver Trobat MF, Castells Valdivielso M (2002)
Avaluacio dels equipaments d’educacio i d’interpretacio ambi-
ental a les Illes Balears. Palma. Ed, Sintes, p 210
The Nature Conservancy (2004) Measuring success: the parks in Peril
site consolidation scorecard manual. The Nature Conservancy,
Arlington, p 56
Theobald WF (1979) Evaluation of recreation and park programs.
Wiley, New York, p 204
Tian-Cole S, Crompton JL, Wilson VL (2002) An empirical
investigation of the relationships between service quality,
satisfaction and behavioural intentions among visitors to a
wildlife refuge. Journal of Leisure Research 34(1):1–24
UNWTO (2010) Tourism Highlights 2010. UNWTO World Tourism
Barometer. http://www.unwto.org Accessed Dec 2010
Various Authors (2004) Proceedings I Encuentro Nacional de Guıas
Interpretadores del Patrimonio de Parques Nacionales. Parque
Nacional del Teide. Octubre de 2004, p 33 (unpublished)
Velasquez M, Guerrero P, Villegas T (2004) Parque Nacional
Galapagos. Evaluacion de la Efectividad del Manejo
(1996–2004). Ministerio del Ambiente, Parque Nacional Gala-
pagos, Ecuador, p 74
Weiler B, Ham SH (2001) Tour guides and interpretation in
ecotourism. Chapter 35 in Weaver D (ed) The encyclopedia of
ecotourism. CABI Publishing, Wallingford, pp 549–563
Whisman S, Hollenhorst S (1998) A path model of whitewater
boating satisfaction on the Cheat River of West Virginia.
Environmental Management 22:109–117
122 Environmental Management (2012) 50:106–122
123