JOURNAL OF THE OPTICAL SOCIETY OF AMERICA A Psychophysical Study of White. III. Adaptation as Variant LEO M. HURVICH AND DOROTHEA JAMESON Color Control Division, Eastman Kodak Company, Rochester, New York (Received August 8, 1951) Experimental data are presented which provide psychophysical specifications of white in terms of the stimulus variables, color temperature, and luminance, for 10 different adaptive conditions. A single test field size, 11.70, and a single exposure time, 1 second, were used. The color temperatures of the adapting and surround illuminations were: 10,000 0 K, 7500'K, 5500'K, 4300 0 K, and 2842 0 K; and the adapting luminance levels were 5 and 15 mL. The white threshold contours exhibit minima in all cases, and vary systematically with both the color temperature and luminance of adapting and surround field. These variations are analyzed and discussed in terms of chromatic desensitization. Various principles and mechanisms of color vision are discussed in relation to the psychophysical functions presented in the three papers of this series. It is suggested that the properties exhibited by these functions are most simply in- terpreted by postulating an independent white mechanism. A summary is presented of the three papers constituting the series. INTRODUCTION EXPERIMENTAL data which provide rigorous psychophysical definitions of white have been presented in papers I and II of this series.", 2 Such defi- nitions include precise specification both of the stimulus variables, wavelength distribution, luminance, area, and duration, as well as of the adaptive state of the eye. In the experiments referred to, the experimental procedure and controls were such that the visual system of the observer was at all times maintained in a neutral state of adaptation. With the eye in this neutral state, white threshold contours which relate the approximate color temperature of the test stimulus and the luminance required to evoke a sensation of absolute white were determined for a series of five test field sizes and two exposure durations. The forms assumed by these threshold contours are, of course, valid only for this specified neutral state of adaptation, and thus they cannot correctly be taken to represent the psychophy- sical relations which obtain in the, more commonly en- countered viewing situations where the observer is ordinarily adapted to a prevailing illumination. Further- more, the threshold luminances for the neutral state, although expressed for the sake of convenience and uniformity in photopic units, do not apply to a fully bright adapted condition. The present paper reports a further series of experiments showing the influence of variations in the adaptive state of the visual system on the form of the white threshold contour. Ten different states of adaptation were investigated. The color temperatures of the adapting illuminations were 10,000 0 K, 7500'K, 5500'K, and 2842 0 K; and each of these adapting color temperatures was em- ployed at two different luminance levels, namely, 5 and 15 mL. For each adaptive condition the minimal lumi- nance required to evoke an absolute white sensation was measured for each of ten test field color temperatures, IL. M. Hurvich and D. Jameson, J. Opt. Soc. Am. 41, 521 (1951). 2 D. Jameson and L. M. Hurvich, J. Opt. Soc. Am. 41, 528 (1951). ranging from 2842 0 K to 10,000 0 K. A single test field size, 11.70, and a single exposure time, 1 second, were used throughout this series of experiments. The apparatus used for the measurements was de- scribed in the first paper. Variations in the test stimulus were effected in exactly the same manner as in the previous experiments. Adapting fields were provided by uniformly illuminating a magnesium oxide -surface which was located optically at the same apparent dis- tance as the test field.' This rectangular metal plate coated with magnesium oxide was pivoted on the field stop which delimited the central test field. The field stop was similarly coated with magnesium oxide, so that when the plate which provided the uniform adapting field was pivoted out of the field of view to permit a test exposure, an identically illuminated annulus sur- rounded the independently variable test field. The over-all field of view subtended an angle of about 470 at the eyes. A single adaptive condition was investigated in each experimental session. Exposure to the adapting field was preceded by a 10-minute period of complete light exclusion to remove the effects of previous uncontrolled and unknown chromatic stimulation. The effects of specific adaptations can, of course, be determined in a reliable manner only by starting from such a neutral equilibrium state. After the observer's visual system had thus recovered to a state of neutral adaptation, it was exposed for 3 minutes to one of the specified adapting illuminants. The subsequent experimental procedure was essentially the same as that already de- scribed in detail for the neutral adaptation experiments. Under the present conditions, however, the observer viewed the adapting field between the 1-second test exposures for 15 seconds to 2 minutes (depending on the brightness of the preceding test stimulus), instead of keeping his eyes closed in the darkened cubicle. Following the determination of a white threshold for a given test color temperature, a 1-minute dark interval followed by a 2-minute re-exposure to the adapting illuminant preceded the threshold determinations for a 787 NOVEMBER, 1951 VOLUME 41, NUMBER 11
Transcript
JOURNAL OF THE OPTICAL SOCIETY OF AMERICA
A Psychophysical Study of White. III. Adaptation as VariantLEO M. HURVICH AND DOROTHEA JAMESON
Color Control Division, Eastman Kodak Company, Rochester, New York
(Received August 8, 1951)
Experimental data are presented which provide psychophysical specifications of white in terms of thestimulus variables, color temperature, and luminance, for 10 different adaptive conditions. A single testfield size, 11.70, and a single exposure time, 1 second, were used. The color temperatures of the adaptingand surround illuminations were: 10,000 0K, 7500'K, 5500'K, 4300 0K, and 2842 0K; and the adaptingluminance levels were 5 and 15 mL. The white threshold contours exhibit minima in all cases, and varysystematically with both the color temperature and luminance of adapting and surround field. Thesevariations are analyzed and discussed in terms of chromatic desensitization. Various principles andmechanisms of color vision are discussed in relation to the psychophysical functions presented in the threepapers of this series. It is suggested that the properties exhibited by these functions are most simply in-terpreted by postulating an independent white mechanism. A summary is presented of the three papersconstituting the series.
INTRODUCTION
EXPERIMENTAL data which provide rigorouspsychophysical definitions of white have been
presented in papers I and II of this series.",2 Such defi-nitions include precise specification both of the stimulusvariables, wavelength distribution, luminance, area, andduration, as well as of the adaptive state of the eye. Inthe experiments referred to, the experimental procedureand controls were such that the visual system of theobserver was at all times maintained in a neutral stateof adaptation. With the eye in this neutral state, whitethreshold contours which relate the approximate colortemperature of the test stimulus and the luminancerequired to evoke a sensation of absolute white weredetermined for a series of five test field sizes and twoexposure durations. The forms assumed by thesethreshold contours are, of course, valid only for thisspecified neutral state of adaptation, and thus theycannot correctly be taken to represent the psychophy-sical relations which obtain in the, more commonly en-countered viewing situations where the observer isordinarily adapted to a prevailing illumination. Further-more, the threshold luminances for the neutral state,although expressed for the sake of convenience anduniformity in photopic units, do not apply to a fullybright adapted condition. The present paper reports afurther series of experiments showing the influence ofvariations in the adaptive state of the visual system onthe form of the white threshold contour.
Ten different states of adaptation were investigated.The color temperatures of the adapting illuminationswere 10,0000K, 7500'K, 5500'K, and 28420 K; andeach of these adapting color temperatures was em-ployed at two different luminance levels, namely, 5 and15 mL. For each adaptive condition the minimal lumi-nance required to evoke an absolute white sensation wasmeasured for each of ten test field color temperatures,
IL. M. Hurvich and D. Jameson, J. Opt. Soc. Am. 41, 521(1951).
2 D. Jameson and L. M. Hurvich, J. Opt. Soc. Am. 41, 528(1951).
ranging from 2842 0K to 10,0000K. A single test fieldsize, 11.70, and a single exposure time, 1 second, wereused throughout this series of experiments.
The apparatus used for the measurements was de-scribed in the first paper. Variations in the test stimuluswere effected in exactly the same manner as in theprevious experiments. Adapting fields were provided byuniformly illuminating a magnesium oxide -surfacewhich was located optically at the same apparent dis-tance as the test field.' This rectangular metal platecoated with magnesium oxide was pivoted on the fieldstop which delimited the central test field. The fieldstop was similarly coated with magnesium oxide, so thatwhen the plate which provided the uniform adaptingfield was pivoted out of the field of view to permit atest exposure, an identically illuminated annulus sur-rounded the independently variable test field. Theover-all field of view subtended an angle of about 470at the eyes.
A single adaptive condition was investigated in eachexperimental session. Exposure to the adapting fieldwas preceded by a 10-minute period of complete lightexclusion to remove the effects of previous uncontrolledand unknown chromatic stimulation. The effects ofspecific adaptations can, of course, be determined in areliable manner only by starting from such a neutralequilibrium state. After the observer's visual systemhad thus recovered to a state of neutral adaptation, itwas exposed for 3 minutes to one of the specifiedadapting illuminants. The subsequent experimentalprocedure was essentially the same as that already de-scribed in detail for the neutral adaptation experiments.Under the present conditions, however, the observerviewed the adapting field between the 1-second testexposures for 15 seconds to 2 minutes (depending onthe brightness of the preceding test stimulus), insteadof keeping his eyes closed in the darkened cubicle.Following the determination of a white threshold for agiven test color temperature, a 1-minute dark intervalfollowed by a 2-minute re-exposure to the adaptingilluminant preceded the threshold determinations for a
787
NOVEMBER, 1951VOLUME 41, NUMBER 11
L. iM. URVIC1I AND) D. JAIMESON
TABLE I. Threshold luminance for the perception of white as a function of color temperature of test field for various color temperaturesof adapting field and surround. Angular size of test field= 11.70. Angular size of adapting field= 47'. Luminance of adapting field, 5 mL.Exposure time of test field= 1 second. Binocular observations. The average threshold luminance, B, and the root-mean-square deviation,s = [2d'/(n- 1)], are expressed in millilamberts.
Color temperature of test field, K
Color temp. of 10,000 7500 6500 5500 4800 4300 4000 3600adapting fieldand surround,0K B s B s B s B s B s B s B s B s
different test field temperature. Measurements of whitethreshold luminance were obtained for the same threeobservers who served in the earlier series of experiments.Three repetitions for each of the 10 adaptation statesconstitute a complete experimental series for two ob-servers, N= 3, and for the third observer, N= 1.
RESULTS
The average white threshold measurements for thisseries of experiments are contained in Tables I and II
and are shown graphically in Figs. 1-3. The root-mean-square deviations of the average determinations fortwo observers are also shown in Tables I and II.
In Figs. 1-3, the functions represent the thresholdluminance required to evoke a white response for aseries of test fields of various color temperatures. Thecolor temperature of the adapting and surround illumi-nant is specified on each graph. The color temperature,in degrees Kelvin, of the test field is plotted as abscissa;
TABLE II. Threshold luminance for the perception of white as a function of color temperature of test field for various color tem-peratures of adapting field and surround. Angular size of test field= 11.70. Angular size of adapting field= 47°. Luminance of adaptingfield, 15 mL. Exposure time of test field= 1 second. Binocular observations. The average threshold luminance, B, and the root-mean-square deviation, s= [2d'/(n- 1)], are expressed in millilamberts.
Color temperature of test field, 0K
Color temp. of 10,000 7500 6500 5500 4800 4300 4000 3600 3000adapting fieldand surround,0K B s B s B s B s B s B s B s B s B s
FIG. 1. White threshold contours. Adaptation as variant. Observer H.
the logarithm of the test field luminance, in millilam-berts, is ordinate. The heavy bar located along the axisof abscissa in each graph indicates the color temperatureof the adapting and surround illuminant; and theheight of the bar on the ordinate scale in each caseindicates the adapting luminance level. The smallarrows which appear in some of the graphs designate aluminance value which was reported as uncomfortablybright, although still below the white threshold.
As in the experiments for a neutral state of adapta-
tion, test exposures at all stimulus luminances abovethe threshold values (and below a level of "discomfort")continued to evoke a white response. Thus all stimuluscombinations which plot in the area above the thresholdcontour (and below the "discomfort" threshold) appearwhite.
The characteristics of the white contours are, ingeneral, different for the different adaptive conditions,and there is a consistent relation between the form ofthe white contour and the color temperature of the
3.0
2.0
'1.0
ADAPTATION10,000°K 5 mi.
U,'
ir1-
JJ01:
w
-J
-J
0z
z-J
3.1
2.1
I.(
0.4
3.1
2.
I .(
0.
3.
2.1
1.1
O.
3.4
2.4
1.4
0.'
28421K 15 ml.
I II
789November 1951 PSYCHOPHYSICAL
I I I I
.V
L. M. HURVICH AND D. JAMESON
ADAPTATI ON2 /t IO,0000 K 5 ml.
,0 11 I I
) _ X 7500'K 5 ml.
) 0
O2 I
55000 KIt ml.
4300°K5 5ml.
2842OK _ mi.
I 0
10,000 7500 5000 2500
ADAPTATION3.0 10,0000 K 15 ml.
2.0
1.0
0.0 l l
3.0 - 7500 0K 15 ml.
it2.0 i
1.0
0.0 l I
3.0 t 5500KIS1 ml.
1.0
2.0 I I 1,,
3.0 t 43000K3.0 ~~~~~~~~~~t 15 ml.
2.0 -t
1.0 I
2.0 '
5.0 28420 K 15 ml.2.0
1.0 _
00 I IIIC
COLOR TEMPERATURE OF TEST FIELD IN
10,000 7500 5000 2500
DEGREES KELVIN
FIG. 2. White threshold contours. Adaptation as variant. Observer J.
adapting and surround illumination. The thresholdluminance tends to be minimal at a color temperature ofthe test field which approaches the color temperatureof the adapting illuminant. Deviations of the minimalthreshold loci from the adapting color temperatures areusually in the direction of higher color temperaturesthan the adaptation stimuli. The departures are smallfor the high color temperatures of adapting light, andincrease regularly as the color temperature of theadapting illuminant decreases.
The color temperatures delimiting the white contoursand the maximal range within each contour are de-pendent upon the color temperature of the adaptingfield. For a 10,000°K adaptation the maximal range ofcolor temperatures which evoke a white response ex-tends from 10,000 °K (the highest color temperatureused as test stimulus) to 6500'K. At an adapting colortemperature of 5500'K the range extends from 10,000 °Kto 5500'K for observers H and B (for the 15-mL level)and from 10,000 °K to 4800'K for observer J. For the
(I)
l-J
-J0
0o
-J-J
z0
zZz
-J
3.(
2.(
3.C
I.C
O.c
3.C
2.C
I .C
3.(
2.(
O.X
2.(
I.C
O.X
790 Vol. 41
PSYCHOPHYSICAL STUDY OF WHI-TE. III
ADAPTATION10,0000 K 5 mi.
I I I I
75000K 5 ml.
I I I I
55000K 5 ml.
I I I I
43000K 5 ml.
I I I I I
28420 K
, l I I II10,000 7500 5000 2500
COLOR TEMPERATURE OF
3.C
2.0
I.c
O.c
3.C
2.C
1.0
O.0
3.C
2.C
I.C
O.0
3.0
2.C
1.C
O.X
3.0
2.0
1.0
0.0
-ADAPTATION10,0000K 15 ml.
7500 0K 15 ml.
D~~~~~~~~~~~~~ _
5500 0K 15 ml.
D~~~~~~~~ I
43000°K15 ml.
D~~~~~~~~ _
28420K15 ml.
)~~ 01) _ oLJ~~, l l l 1,~~~I
10,000 7500 5000 2500
TEST FIELD IN DEGREES KELVIN
FIG. 3. White threshold contours. Adaptation as variant. Observer B.
lowest color temperature of adapting field, 2842 0K, therange for observer H extends from 10,000 °K to 4000 Kfor the 5-mL adapting luminance, and from 65000Kto 3600'K for the 15-mL adapting level. The cor-responding ranges for observer J are from 7500'K to3600'K for the 5-mL adaptation, and from 6500'K to36000K for the 15-mL adapting level. For observer B,the range is from 7500'K to 3600'K for the 5-mL levelof adapting luminance when adapted to 28420K, andfrom 10,000 °K to 4000'K for 15 mL. When the color
temperature of the adapting field was as low as 2842 0K,it was reported to be yellowish by all observers at bothluminance levels, and it remained so throughout anentire experimental session. The test field of the samecolor temperature (28420K) also evoked a yellow re-sponse throughout the entire range of test luminancesused, and it was impossible to evoke a white sensationwith this stimulus for any of the adaptive states in-vestigated.
For every white contour, moreover, relative to the
3.0
2.0
1.0
0.0
3.0
C,)I-
mit3-j-j
0
0-
z0
zz
2.0
1.0
0.0
3.0
2.0
1.0
0.0
3.0
2.0
1.0
0.0
3.0
2.0
1.0
0.0
November 1951 791
L. M. HURVICH AND D. JAMESON
minimum locus, the threshold rises more rapidly forcolor temperatures of progressively lower values than itdoes for color temperatures of progressively highervalues. In general, the data show that for any state ofadaptation test stimuli whose color temperatures arerelatively higher will more readily evoke a white sensa-tion than will test stimuli of relatively lower colortemperatures.
The slopes of the contours for observers H and J tendto be slightly greater for the 15-mL adapting luminancethan for the 5-mL level for the same color temperatureof adapting field, while the results for the third ob-server, which are based on single measurements, showno consistent trend in this respect.
The average minimal threshold luminances for all5-mL adaptive conditions (11.7° test field, 1-secondexposure) are 13 mL, 90 mL, and 100 mL, for thethree observers. At the 15-mL level of adaptation thesevalues are, respectively, 20 mL, 85 mL, and 62 mL. Thewhite threshold luminance, even at the minimal value,is always higher than the luminance of the adaptingfield and surround. The difference is small in some cases,and as much as one log unit of luminance difference isfound in others.
The relation between the variability of the observa-tions and the threshold luminance is essentially the sameas that found for the neutral state of adaptation. Thepresent data, however, were obtained for a wide varietyof adaptive states, and consequently we are not justifiedin treating them as samples obtained from a populationof homogeneous effects.
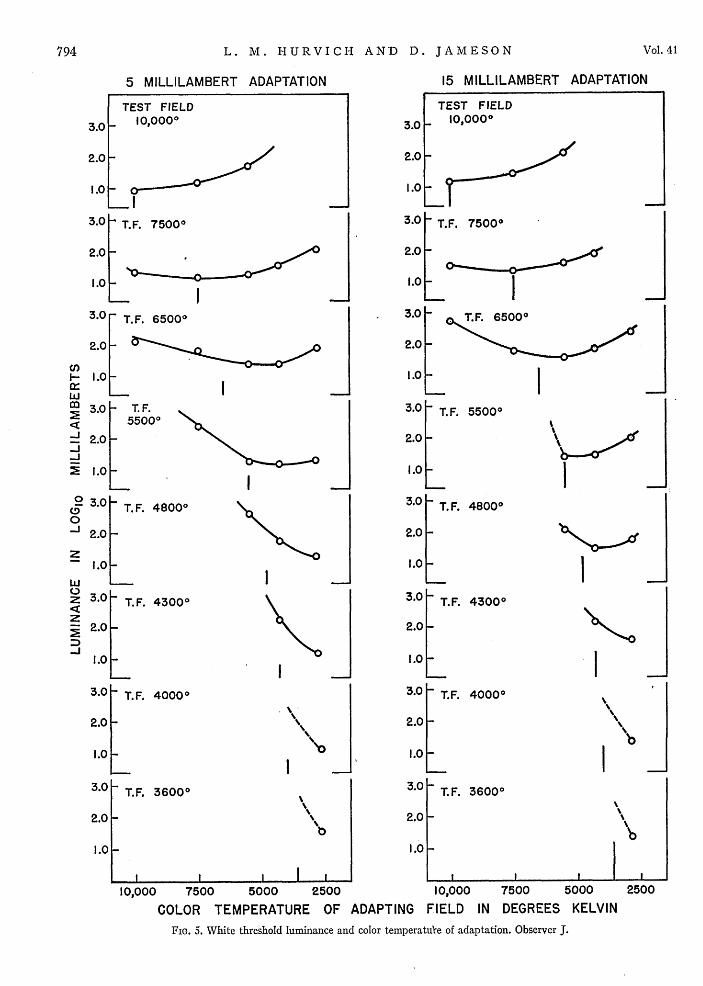
The data may be presented in an alternative graphicalform to show the range of adaptations throughout whichany specified test field attains a white threshold level,In Figs. 4, 5, and 6, the logarithm of the test luminance,in millilamberts, is plotted against color temperature,in degrees Kelvin, of the adapting and surround field.Each individual graph shows the white threshold as afunction of adaptation for a single color temperature oftest field. The series of functions on the left in eachfigure are for an adapting luminance of 5 mL. Those onthe right are for a 15-mL adaptation. In each case, theposition of the small bar along the abscissa designatesthe color temperature of the adapting illuminant whichis identical to that of the specified test field.
Test stimuli of both 6500'K and 7500'K are, on theaverage, seen as white for a greater range of adaptingconditions than any of the other test stimuli used inthese experiments. It should be noted, however, thatthe ranges are arbitrarily restricted at the two extremesof adaptation. Extension of the adapting color tempera-tures in both directions would obviously extend therange over which both the high and low color tempera-ture test fields would be perceived as white.
For the highest color temperature (10,000 0K) of testfield, the minimal white threshold occurs for the eyeadapted to a color temperature identical to that of thetest field, and the threshold luminance increases with a
decrease in the color temperature of the adapting andsurround illumination. As the color temperature of thetest field is progressively decreased, however, the func-tions tend to change systematically for all observers.The minimal threshold luminance ordinarily occurswhen the visual system is adapted to a color temperaturewhich is lower than that of the test stimulus. This is,of course, merely a restatement of the relation shown inFigs. 1-3, where the color temperature of the adaptingfield, rather than that of the test field, is parameter.
The results make it clear than any psychophysicaldefinition of white must include precise specification ofthe physiological state of the organism and the natureof the surround as well as of the stimulus variables,wavelength distribution, luminance, area, and duration.(Retinal location for a fixed area is still another modeof incidence not considered here.) Each psychophysicalfunction presented in this report thus provides a defi-nition of white for the specified adaptive state.
DISCUSSION
Variations among the threshold contours for differentadaptive states are indirect measures of the amount of"color conversion"3 suffered by the test field as adapta-tion and surround are varied in color temperature andluminance. They represent directly the manner in whichthe test stimulus must be modified for various adaptiveand surround conditions if the response of the visualsystem is to be "zeroed" at the constant position"white." An analysis of the present data as they relateto the problem of color constancy will be included in aseparate publication.
The literature concerned with the problems of colorconversion is very extensive and covers many decades ofvisual research. The essential characteristics of thephenomena measured here have, for example, beendemonstrated experimentally and discussed theoreti-cally by Pretori and Sachs in their classical contraststudy.4 Directly comparable with the present experi-ments are the incidental observations reported byPriest concerning the influence of what he calls "selec-tive fatigue" on the color temperature required to evokea gray or white sensation.5 The effects noted are similarto those reported here. The more recent and more ex-tensive observations of Helson and Michels concerningthe effect of chromatic adaptation on achromaticity arealso completely consistent with the present findings,although concerned with strongly chromatic adaptationsand a relatively low range of test luminances.' Theseexperiments and all experimental research on problemsof color conversion fully confirm predictions derivedfrom Hering's unifying principle that there is a lawfuland reciprocal interaction among all elements of the
3H. Helson, J. Explt. Psychol. 23, 439 (1938).4H. Pretori and M. Sachs, Pflugers Arch. ges. Physiol. 60,
71 (1895).6 I. G. Priest, Natl. Bur. Standards (U. S.), Sci. Papers, No. 417,
17, 231 (1921), pp. 247-249.6 H. Helson and W. C. Michels, J. Opt. Soc. Am. 38, 1025 (1948).
COLOR TEMPERATURE OF ADAPTING FIELD IN DEGREES KELVIN
FIG. 4. White threshold luminance and color temperature of adaptation. Observer H.
2500
793
U)
IJXw0
M
0-J
z
w
0
z-
ZZ
J
I
L. M. URVICH AND
5 MILLILAMBERT ADAPTATION
D. JAMESON
15 MILLILAMBERT
Vol. 41
ADAPTATION
TEST FIELD
3.0 10,0000
2.0
1.0
3.0 T.F. 75001
2.0 .
1.0
3.0 T.F. 65000
2.0
1.0 _-
3.0 - T. F.55000
2.0 T I1.0 _I
3.0 T. F. 48000
2.0 _
1.0 I3.0 - T.F. 43000
2.0 _
1.0 I3.0 T. F. 4000
2.0 - '44
1.0 %l0
3.0 - T.F. 36000
2.0 %%
1.0
I I I I I
TEST FIELD
3.0 _ 10,000°
2.0 _
1.0 _
3.0 T.F. 75000
2.0 I
2.03.0 T T. 65000
2.0 _
1.0 L 3.0 h T.F. 55000
2.0 _
1.0
3.0 - T. F. 48000
2.0 _
1.0KI
3.0 T.F. 43000
2.0 _
1.0K
3.0 F T.F. 40000
2.0 _ '%
1.0 I
3.0 T.F. 36000
2.0 _ \
1.0
10,000 7500 5000 2500 10,000 7500 5000
COLOR TEMPERATURE OF ADAPTING FIELD IN DEGREES KELVIN
FIG. 5. White threshold luminance and color temperatu're of adaptation. Observer J.
2500
C/nI-
wM
-M
-J
00-J
wC.
z
-J
794
I
November1951 PSYCHOPHYSICAL STUDY OF WHITE. III
5 MILLILAMBERT ADAPTATION 15 MILLILAMBERT
795
ADAPTAT ION
TEST FIELD
3.0 10,000°
2.0 - - V
1.0 _
3.0 T.F. 75000
2.0
1,0_
65000
3.0 T
2.0h_
1.0K30T.F.
2.0
3.0 T. F.
2.0 1.0_
3.0 T.F
2.0
1.03.0
T. F.
2.0
1.0_
5500°
4800'
43000
4000°
36000
' 0
I I
I -
b
I I I
TEST FIELD
3.0 10,000 °
2.0
1.0 F
30T.F. 7500°
2.0 0
3.0 30 0
2.0 - T.F
4300~
. O
1.0 I30T.F. 5500°
2.0 _
3.0 _ -
2.0 T.F. 4800
1.0 _ o0
2.0 _
1.0_'I
3.0 _ -
T.F. 40000 '%
2.0 _
1.0_I
3.0 _T.F. 36000
2.0 _
no white
1.0i1
10,000 7500 5000 2500 10,000 7500 5000
COLOR TEMPERATURE OF ADAPTING FIELD IN DEGREES KELVIN
FIG. 6. White threshold luminance and color temperature of adaptation. Observer B.
2500
(I)
m
-J-J0
Ca0-.1
z0
zz-jJ
1
I
I
I
I
L. M. HURVICH AND D. JAMESON
60-1 10000c!iiU.
us 7500U.0wa:
cc 5000
I-, 2500000 2500 5000 7500 10,000
COLOR TEMP. OF ADAPTING ILLUMINANTGTa
FIG. 7. Color temperature for minimal white threshold andcolor temperature of adaptation. Hypothetical functions.
total visual field and that the momentary state of eachsuch element is a lawful determinant of every visualsensation. 7
The present data are distinguished from the earlierresults primarily by the fact that they provide completepsychophysical functions relating the stimulus variablesspectral distribution and luminance for the perceptionof the constant visual quality white for each of theadaptations investigated. Moreover, the range of colortemperatures used for the adapting stimuli (28420K to10,0000K) is that encountered in everyday viewingsituations and includes the stimuli which are mostcommonly taken as "white standards" in visual experi-ments of every conceivable nature.
Locus of the White Threshold Minimumand the State of Adaptation
The white threshold contours for a neutral state ofadaptation tend, in general, to exhibit minima."2 Theseminima have been taken to represent loci of stimuliwhich are physiologically neutral with respect to theneutral adaptive state. The chromaticities of thesestimuli are such that the visual system responds in achromatically balanced 'manner: there is no excess inany of the chromatic excitation components.8
It is to be expected that when visual sensitivities arealtered during adaptation the locus of the minimum willvary in a manner which is lawfully related to thechromatic sensitivity changes. That the locus of theminimum does vary in a consistent manner with adapta-tion is seen in Figs. 1, 2, and 3. It remains merely toexamine this dependance more closely.
If the eye were uninfluenced by adaptation-comparea photocell with ideally constant response properties-
7 Detailed discussion of Hering's unifying interaction principlemay be found in many of his visual papers. See, for example, E.Hering, Grbiidzilge der Lehlre vorn Licltsinn (Verlag. Julius Springer,Berlin, 1920).
8 D. Jameson and L. M. Hurvich, J. Explt. Psychol. 41, 455(1951).
the color temperature locus of the white thresholdminimum (CTm) for various color temperatures ofadapting illuminant (CTa) might be represented by thedashed horizontal line (slope= 0) in Fig; 7. On the otherhand, if chromatic desensitization to the adaptingilluminant were complete, the relation to be expectedbetween CTm and CTa might be represented by thedashed line of unit slope. Under these circumstances theadapting field would itself appear neutral at the end ofthe adapting period, and the test stimulus which evokesa chromatically balanced response would necessarilybe of the same color temperature as the adapting field(CTm=CTa). (Since the surround illumination in thepresent experiments is always identical to the adaptingillumination, the physiological effects correlated withboth may be taken as approximately identical. Com-plexities introduced by retinal nonhomogeneities, suchas macular pigmentation, will be taken into accountbelow.) These two hypothetical functions may betaken as the limiting cases. The solid line with slopebetween the extremes of zero and unity represents theexpected relation if only incomplete chromatic desensi-tization takes place, that is, if the visual system is onlypartially "adapted" to the chromaticities of the variousadapting stimuli. Under conditions of incomplete ad-aptation, if the color temperature is high, the adaptingand surround fields will retain a slightly bluish appear-ance, and the test stimulus will accordingly have to besomewhat less blue, or of a slightly lower temperature,in order to evoke a white response at a minimal lumi-nance. If the adapting color temperature is low, on theother hand, it will retain a slightly yellowish appearance,and the color temperature of the test simulus will haveto be increased somewhat to evoke a white sensationat a minimal luminance. Consequently, when desensi-tization is incomplete the only case in which the CTmmay be expected to be identical to the CTa is for acolor temperature which appears neutral initially andthroughout the adaptation. This intersection locus ofthe hypothetical curves is shown at 5500'K. It is basedon the results for two observers of both the neutraladaptation experiments and those of the separate studyconcerned with the chromatic balance of the visualsystem." 2'8 The results for the third observer wouldpredict an intersection locus at 7500'K.
Figure 8 shows the relation actually found betweenthe test color temperature for which the white thresholdluminance is minimal and the color temperature of theadapting illuminant. The figure contains the resultsfor the three observers for adapting luminances of both5 and 15 mL. In each graph, a solid line has been fittedvisually to the plotted points representing the experi-mental results. The dashed line (slope= 1) indicatesthe hypothetical function which would be obtained ifadaptation were complete, i.e., if CTm= CTa.
In five of the-six cases shown in the figure, the slope ofthe experimentally determined curve is less than unityand tends to intersect the hypothetical function at the
//////////////
////////
I I
796 Vol. 41
N rPSYCHOPHYSICAL STUDY OF WHITE. III
5 MILLILAMBERTS
2500 5000 7500 10,000
OTa
I5 MILLILAMBERTS
10,000
7500
EI-
5000 -
2500
10,000
7500 _
E
05000 -
2500
10,000
75001-
E
05000[-
2500
2500 5000 7500
OTa
FIG. 8. Color temperature for minimal white threshold and color temperature of adaptation. Experimental results.
10,000
75001-
E
0
OBSERVER H
0
I I I I
OBSERVER H 0
I I
OBSERVER J
I I
5000F-
2500
10,000
7500 -
5000
2500
10,000
7500 -
5000
2500
OBSERVER J
I I
OBSERVER B
0 .,a
0
_ OBSERVER B
10,000
-
I. . . . . . .
November 1951 797
l l
1 I II
0
0
I Il 1 l l I I
L. M. HURVICH AND D. JAMESON
highest color temperature (10,0000K). At the lowestcolor temperature used in the experiments (28420 K),the CTm is higher than the CT.. As the CT. increases,the two values approach each other until, at the highestcolor temperature of the adapting field the CTm is,on the whole, equal to the CTa. The departures for thelower color temperatures are greater for the 5-than forthe 15-miL adaptation. (The variation in sensationwith the intensities of both the adapting and the teststimuli has long been recognized, and the lawful rela-tion which holds within certain limits is known as the"Coefficient law."-1") In the sixth case (results forobserver H for an adapting luminance of 15 mL), theslope of the experimental function is unity but the entirecurve is displaced upwards relative to the hypotheticalfunction; the CTm is higher than the CTa for all colortemperatures of adapting illuminant.
The experimental functions have, on the whole, slopeswhich are less than unity. In terms of the a priorianalysis, chromatic desensitization is not complete. Theobservers' reports recorded in the protocols testify tothis incompleteness. The lower color temperatureadapting fields, at least, retain a yellowish or tanappearance even at the end of a 5-minute adaptation.
With regard to the intersection locus, however, adiscrepancy appears. The experimental curves, ingeneral, intersect the hypothetical curve with unitslope at about 10,0000 K instead of at the anticipated5500'K (or 7500'K for observer B). A possible reasonfor this discrepancy is found in the yellow pigment ofthe macula. The presence of macular pigment in theretina within the sharply outlined test stimulus area(11.70) and not within the surround has the effect ofrendering the uniformly perceived test illumination rela-tively more yellow than that of the unfiltered surroundstimulus of the same color temperature. In order tocompensate for the relatively increased yellow stimula-tion in the test area, the color temperature of the teststimulus must be increased to a distribution weightedrelatively more in the short wavelength region. Thus,with adaptation to a "neutral" color temperature thei ncrease in test color temperature required for a minimalwhite threshold is consistent. The extent to which themacular pigmentation "weights" the incident lightstimulus is, in a sense, then represented by the shift inthe intersection locus from 5500'K to the experimentallydetermined intersection locus in the region of 10,0000 K.
The effect of increased adapting luminance appearsto be an increased chromatic desensitization. The ex-perimental functions for the 15-mL adapting luminancemore nearly approach the unit slope of the hypotheticalcurve do those for the 5-mL adaptations.'
9 See H. v. Helmholtz, Handbook of Physiological Optics (OpticalSociety of America, 1924) third English edition, Vol. II, p. 235;see also Appendix by J. v. Kries, pp. 440-441.
10 J. v. Kries, Nagel's Handbuck der Physiologie der Menschzen(Brunswick 3, 1905), p. 211.
l1 For a more recent investigation see W. D. Wright, Proc. Roy.Soc. (London) 115B, 49 (1934).
The absence of the upper segments of the experimentalcurves beyond the 10,0000K position is due simply tothe fact that color temperatures higher than 10,0000 Kwere not used in these experiments. There can be littledoubt that extending this range would result in an ex-perimental curve which, after intersecting the hypo-thetical function of unit slope at about 10,0000 K,would, like the solid line of Fig. 7, show the CTm lessthan the CTa at the higher values of color temperature.
The specific slopes and intersection loci may be ex-pected to vary both with size of test field and othermodes of incidence. Future experiments concerned withthese factors will provide factual information necessaryto check the validity of the assumptions made here.
Theoretical Interpretations
Some of the stimulus-response relations reported inthe present investigation are direct psychophysical ex-pressions of known facts concerning the anatomy andphysiology of the visual mechanism, while others raisebasic questions concerning the nature and behavior ofthat mechanism. The general dependences, for example,of the white response upon the retinal area stimulated,upon stimulus duration, and upon the state of adapta-tion are easily explained in terms of the general prin-ciples of color theory whether the specific mechanismsare assumed to be of a three-component variety, such asthe Young-Helmholtz theory, or of a four-componenttype, such as the Hering theory of opponent colors.
The two correlated findings of the white experimentswhich pose real theoretical problems are: (1) the changein sensation, for a stimulus of fixed color temperature,from some definite hue at a low luminance to a huelesswhite sensation at a higher luminance, and (2) theincrease in the range of color temperatures which evokean absolute white sensation with an increase in lumi-nance. The findings themselves are completely con-sistent with older observations relating stimulus in-tensity and saturation. Even spectral stimuli becomecompletely desaturated, or nearly so, at very highluminance levels.'2 " 3
Neither the present results nor the older observations,however, are readily interpretated in terms of the com-monly accepted principles of three-color theory. Only bypostulating auxiliary hypotheses can these effects beexplained. Unfortunately, these supplementary as-sumptions lead to deductions which are in direct con-flict with other accepted experimental facts.
Any theoretical formulation of the physiologicalmechanisms of color vision must take as a point ofdeparture the psychophysiological axioms that (1) amaterial event underlies each sensory event, and (2) toevery equality, similarity, or difference in the characterof a sensation there corresponds an equality, similarity,or difference in the character of the physiological or
12H. v. Helmholtz, Handbook of Physiological Optics (OpticalSociety of America), third English edition, Vol. II, p. 73.
13 D. M. Purdy, Brit. J. Psychol. 21, 283 (1931).
798 Vol. 41
PSYCHOPHYSICAL STUDY OF WHITE. III
material event and conversely.'4 Thus, with regard tothe present data, a common physiological event mustbe assumed to underlie the common sensory qualitywhite, in spite of differences in the chromaticities of thevarious stimuli which evoke this sensation. According tothree-color theory as it is ordinarily formulated, a neu-tral or white sensation is correlated with equal excitationof all three receptors, while a hue sensation results fromunequal excitation of the three hypothetical color recep-tors, with the saturation of the hue sensation dependenton the degree of this inequality. For any given state,furthermore, the three response curves associated withthe three receptors are assumed to be fixed and inde-pendent of intensity. Any set of trichromatic excitationcurves illustrates this. Purdy states that the Helmholtz"excitation curves," if defined in terms of color-mixturedata subjected to the usual transformations cannotvary with intensity.'5 Wright has also indicated that thespectral sensitivities of the three hypothetical processesare effectively independent of the intensity of the stim-ulus.'6 In accordance with these postulates, luminositiesare additive, and hue and saturation are invariant withchanges in intensity. Since the latter is patently false,a new hypothesis is made. "Helmholtz . . . assumesthat chromatic excitations do not increase in proportionto their stimuli, but rather obey a law of diminishingreturns . . . . This means that, for a given increaseof stimulus, the weakest component of the retinalresponse will increase relatively more than the twostronger components. Accordingly, the colour becomesmore whitish as the intensity is increased."17"18
Although this ad hoc assumption does not completelyaccount for the spectral hue and saturation data, itmay be adequate to explain the results of the whiteexperiments. The concept of diminishing returns in thethree receptor processes with ultimate equality of excita-tion at high intensities accounts for the progressivedesaturation of any specific stimulus as its intensity isincreased and for the increasing width of the whitesensation area. The extreme color temperatures are, ofcourse, of greater initial saturation and hence requirehigher luminances to excite all three receptors equally.
There is a difficulty however. Since three-color theoryalso postulates that the brightness of the sensation iscorrelated with the total excitation of the three colorreceptors, the assumption of diminishing returns can-not be reconciled with the law of additivity of luminosi-ties, a principle long assumed to be valid and basic tophotometry and colorimetry.'9-22 This law, as Purdy
'4 G. E. Muller, Z. Psychol. 10, 1 (1896).15 D. M. Purdy, "Chroma as a function of retinal illumination,"
dissertation, Harvard University, 1-190 (1929), p. 143.16 W. D. Wright, Documenta Ophthalmologica. 3, 10 (1949),
17 D. M. Purdy, Brit. J. Psychol. 21, 283 (1931), p. 288. See alsoreference 12, pp. 185 ff.
18 C. S. Peirce, Am. J. Sci. and Arts. 13, 247 (1877).19 H. E. Ives, Phil. Mag. 24, 845 (1912).20 S. Hecht, Howe Lab. Ophthal., Bull. No. 4, 1 (1931).
has pointed out, necessitates a fixed ratio of the threeresponse strengths for all intensities of a given physicalstimulus.23 Within the theoretical framework of three-color theory, if a diminishing returns principle werevalid for the three different color mechanisms, thensimple addition (say) of a photometric unit of "green"light to a photometric unit of "red" light could not beequal in luminance to the addition of two unit amountsof the "red" or of the "green" alone. Thus, we cannotaccept a principle of diminishing returns for the threechromatic processes, without at the same time challeng-ing the fundamental visual principle that luminositiesare additive.
It is not within the scope of this report to discuss andevaluate the evidence for and against the law of additionof luminosities. It should be pointed out, however, thatthis law, which is fundamental to current photometricand calorimetric practice, has been brought into ques-tion by a number of investigators whose results arebased on direct heterochromatic brightness matchesrather than on the method of flicker photometry.24 -2 9
With only conflicting experimental data available, wewould not be justified at present in abandoning theadditivity principle, since this decision would entailsimultaneous re-evaluation of the whole field of visualphotometry and the specification of light stimuli inphotometric units. Because of this very importance,however, the problem of additivity of luminosities isone which must be subjected to further experimentalanalysis, and its continued acceptance or rejection mustultimately be based on indisputable experimental evi-dence. For a detailed theoretical discussion of thisproblem, the reader is referred to the recent paper bySinden.A 0
In an attempt to resolve the conflict between theprinciples of diminishing returns and additivity ofluminosities, Purdy was led to assume that the ratio ofthe three response strengths does remain fixed for allintensities of a given physical stimulus but that the"critical ratio" of chromatic to achromatic excitationwhich must be exceeded for discrimination of a huecomponent is itself a varying function of the stimulusintensity. Purdy believed, however, that this conceptwould provide a reasonable basis for the disappearanceof hue only at very low intensities where discriminationis generally poor and that some other mechanism had tobe postulated for the similar effect at high intensitiesof stimulation. In the absence of any suggestions con-cerning specific physiological mechanisms, such a con-
21 W. D. Wright, Researches on Normal and Defective ColourVision (C. V. Mosby Company, St. Louis, 1947), pp. 75 and 110.
2 G. Blet, Cahiers phys., No. 22, 57 (1944).23 D. M. Purdy, Am. J. Psychol. 43, 541 (1931), p. 554.24 E. Hering, Lotos, Jahrb. Naturwiss, N. F. 2, 69 (1882).25 E. Hering, Lotos, Jahrb. Naturwiss, N. F. 6, 142 (1885).26 A. BrUckner, Pfluigers Arch. ges. Physiol. 98, 90 (1903).27 R. Hiecke, Z. Sinnesphysiol. 59, 67 (1928).28H. Pieron, L'Annde Psychol. 40, 52 (1939).29 F. Blottiau, Rev. optique (th~or. instrum.) 26, 193 (1947).30 R. H. Sinden, J. Opt. Soc. Am. 40, 647 (1950).
799November 1951
L. M. URVICh1 AND D. JAIMESON
cept of varying critical ratio seems more adequate as ageneralized description of the stimulus relations re-quired to evoke a threshold hue response than as afruitful hypothesis concerning the physiological eventscorrelated with the varying sensory response.
The theoretical problem becomes considerably simpli-fied if viewed from the standpoint of a color theorywhich postulates the existence of a separate, inde-pendent white mechanism. In such a view, the responsecurve of the separate white mechanism would needsimply to increase with intensity at a rate .more rapidthan the response curves of the specific color mechanismsin order to explain the shift from a sensation with aclearly perceptible hue component at a low intensity toa neutral white sensation in which the hue componentis subliminal at a higher intensity. To account forthe disappearance of hue at very low luminances(achromatic or "photochromatic" interval), it is onlyrequired that the independent white mechanism havean absolute threshold lower than those of the chro-matic processes.3 ,3 ' Since the independent white mech-anism is also assumed to be either entirely or mainlyresponsible for brightness, this hypothesis raises nodifficulties for the law of additivity of luminosities.
Arguments against the existence of a separate white,or brillance mechanism, have been based mainly ongrounds of parsimony. The postulate does not conflictwith established facts of vision. On the contrary, muchrecent work concerned with both the sensory andphysiological aspects of vision has lent added weightto the original arguments of Hering and the adherentsof his opponent-color theory in favor of such an inde-pendent white process.32 -37
A three-color concept, with fixed ratios of the threeexcitations for all intensities of a given physical stimulus,thus accounting for additivity of luminosities, can bemaintained, of course, if all the white data were to beexplained as the result of adaptation to the differenttest stimuli. The change in appearance of different colortemperatures during a 5-minute exposure certainly in-volves adaptation. Chromatic desensitization must alsobe a factor in the white threshold results for a 5-secondtest exposure, as attested to by the observers' reports ofperceived hue changes in these experiments.2 Althoughno such changes were reported at and above the whitethreshold for the 1-second exposures, sensitivity changesare known to occur during exposures as short as 0.02second." However, since the magnitude of the sensi-
31 E. Hering, Sitzber. Akad. Wiss. Wien, Math.-naturw. Klasse,Abt. III, 70, 169 (1875).
32 E. Hering, Sitzber. Akad. Wiss. Wien, Math.-natur. lasse,Abt. III, 69, 179, (1874).
33 L. T. Troland, J. Opt. Soc. Am. 6, 3 (1922).34 A. Tschermak, Handb. Norm. Path. Physiol. 2, 550 (1929).'5 H. Pi6ron, Sciences, Rev. de l'assoc. frang. avance. des sci.
70, 265 (1943).30 G. A. ry, J. Opt. Soc. Am. 35, 114 (1945).37 R. Granit, Sensory Mechanisms of the Retina (Oxford Uni-
versity Press, London, 1947), pp. 316 ff.38 J. F. Schouten and L. S. Ornstein, J. Opt. Soc. Am. 29, 168
(1939).
tivity changes is continuously reduced with decrease instimulus duration, the likelihood of adaptation as acomplete explanation of the data becomes less and lessplausible for increasingly shorter stimulus durations.Moreover, if chromatic desensitization is assumed toaccount for the white results, it must also be shown toaccount for the variations in saturation of a spectralstimulus with changes in intensity and for the Bezold-Bricke hue shifts. In view of these facts, even whenrapid sensitivity changes are taken into consideration,three-color theory with invariant excitation ratios doesnot provide a useful working hypothesis. In contrast,the assumption of an independent white mechanismadequately accounts for the present results, is consistentwith all known variations in saturation, whether de-pendent on luminance or adaptation, and, moreover,the additivity of luminosities is one of its necessaryconsequences. In short, it does provide a useful workinghypothesis for visual research.
SUMMARY
In the first paper of this series an analysis was pre-sented of the concept white as it is used to describeproperties of light, properties of objects, and propertiesof sensation. It was concluded that the concept canhave both practical and theoretical significance onlywhen the psychophysical functions which relate thesensation white to the stimulus variables are known.
In the three papers constituting the series, an ex-perimental study is reported in which the followingpsychophysical relations were investigated:
(1) The threshold luminance required to evoke anabsolute white sensation was measured with the eyein a neutral state:
(a) for various color temperatures of test stimulus, namely,2842 0K, 3000 0K, 3600°K, 4000 0K, 4300 0K, 4800°K, 5500°K,6500°K, 7500'K, and 10,000 0K (approximate values);
(b) for various sizes of test stimulus, namely, 2.00, 5.80, 11.71,23.40, and 46.80; and
(c) for two different durations of test exposure, namely, 1second and 5 seconds.
(2) The threshold luminance required to evoke anabsolute white sensation was measured with the eye incontrolled states of adaptation using a 1-second ex-posure, 11.70 test field, and 46.80 adapting field andsurround:
(a) for various color temperatures of test stimulus, as specifiedabove under 1(a);
(b) for various color temperatures of adapting stimulus andsurround field, namely, 2842 0K, 4300'K, 5500'K, 7500°K, and10,0000K; and
(c) for two different luminances of adapting stimulus andsurround field, namely, 5 and 15 mL.
Observations were made by three observers. Allthreshold luminance measurements were binocular.White threshold contours relating color temperature andluminance are presented for the various conditionsoutlined above under (1) and (2). These contours, whichform the lower boundary of a white sensation area,
oo Vol. 41
PSYCHOPHYSICAL STUDY OF WHITE. III
usually exhibit a minimum for all conditions. The exactform of the contour and the color temperature at whichthe minimal threshold luminance occurs depend uponthe observer, the field size, the test exposure, and thestate of adaptation.
For a neutral state, a 1-second exposure, and fieldsizes above 110, the minimal white threshold luminanceoccurs at 5500'K for two observers and at 7500'K forthe third. Except for the location of the minimum, thegeneral form of the white threshold contour is similarfor the three observers. Marked inter-observer differ-ences in the form of the contour occur only for the twosmallest test stimuli, 2.00 and 5.80. These variations areprobably due mainly to individual differences inamounts and distribution of macular pigment.
For a given test stimulus, the white threshold lumi-nance varies with area in a manner which is dependenton the color temperature of the test field. The functionsexhibit maxima which occur at 5.80 for the lower colortemperatures and at 11.7° for the higher color tempera-tures. The functions are nearly independent of retinalarea at an intermediate color temperature (5500'K fortwo observers). These results are to be explained interms of variations in macular pigmentation and re-ceptor sensitivities in different retinal areas.
The white threshold contours for the 5-second ex-posure are generally similar to those obtained for 1second, but the slopes of the contours are less steep,reflecting expected changes in visual sensitivities withincreased exposure times. The total range of color tem-peratures which evoke a white sensation increases withluminance more rapidly for 5-second than it does for1-second exposures. This trend cannot be extrapolated,however, since the quality of the visual responsechanges. For all observers, prolonged stimulation by agiven color temperature of moderate luminance resultsin a darkening of the sensation as well as in a loss ofchroma, so that the achromatic response eventually
becomes grayish rather than pure white. Adaptationeffects are also reflected in the locations of the luminancemaxima in the area functions for 5-second exposures.
The variability of the threshold luminance measure-ments is shown to be related in a lawful manner to thethreshold luminance itself. The relation is essentially ofthe same form as that which has been established forintensity discrimination both in vision and in othersense modalities, namely, s = K logl.
White threshold contours for different adaptive statesdepend upon both the color temperature and the lumi-nance of the adapting and surround field. The contoursagain exhibit minima in all cases. The minimum usuallyoccurs at a color temperature of test field which ap-proaches but is not identical to the color temperatureof the adapting field. For the range of adaptations in-vestigated, the minimum usually occurs for a colortemperature higher than that of the adapting field. Testfields of 6500'K and 7500'K are, on the average,perceived as white over a greater range than are teststimuli of color temperatures either higher or lowerthan these.
The relation between the color temperature forminimal white threshold and color temperature ofadaptation (locus of white threshold minimum) is dis-cussed and analyzed in terms of chromatic desensitiza-tion and known retinal properties.
The results are discussed in relation to classical con-cepts of visual color theory, and it is suggested thatthe data are most simply and consistently to be ex-plained by postulating a separate independent whitemechanism.
ACKNOWLEDGMENT
We gratefully acknowledge our indebtedness to Dr.R. W. Burnham for the many hours which he devotedto observing in these experiments.