It is important to evaluate the quality of care given by PNP's. A Quality of Care Assessment: Pediatricians and Pediatric Nurse Practitioners Author : Introduction Nancy Graham, Dr. P.H., R.N., (Upsilon) is Director of Professional Services for the Professional Standards Review Organiza- tion of Queens County, Inc., New York. The need to improve the delivery of child health care in the United States has been documented repeatedly.' Approximately one-quarter of all American children do not receive anything ap- proaching adequate health care. While surgeons perform an estimated 500,000 unnecessary ton- sillectomies on children each year, we are among the few nations that do not guarantee minimal health care to all mothers and children." A number of studies in recent years have demonstrated that pediatricians spend much of their time in activities inappropriate to their education and train in^.^,^^,*^ Other problems, in addition to the poor utilization of personnel, are the purported shortages of physicians, the high and rising costs of medical care, and the maldistribution, both geographically and by specialty, of physicians. These problems plus the dissatisfaction of many nurses have been the forces leading to programs to expand the role of the nurse.16 Page 41 lred ilmage June 1978 Volume 10 Number 2
Transcript
It is important to evaluate the quality of care given by PNP's.
A Quality of Care Assessment: Pediatricians and Pediatric Nurse Practitioners
Author : Introduction Nancy Graham, Dr. P.H., R.N., (Upsilon) is Director of Professional Services for the Professional Standards Review Organiza- tion of Queens County, Inc., New York.
The need to improve the delivery of child health care in the United States has been documented repeatedly.' Approximately one-quarter of all American children do not receive anything ap- proaching adequate health care. While surgeons perform an estimated 500,000 unnecessary ton- sillectomies on children each year, we are among the few nations that do not guarantee minimal health care to all mothers and children."
A number of studies in recent years have demonstrated that pediatricians spend much of their time in activities inappropriate to their education and train in^.^,^^,*^ Other problems, in addition to the poor utilization of personnel, are the purported shortages of physicians, the high and rising costs of medical care, and the maldistribution, both geographically and by specialty, of physicians. These problems plus the dissatisfaction of many nurses have been the forces leading to programs to expand the role of the nurse.16
Page 41 lred ilmage June 1978 Volume 10 Number 2
Quality of Care Assessment
The Preface of the Health, Education and Welfare Report on Extending the Scope of Nurs- ing Practice, 1971, stated, “We believe that the future of nursing must encompass a substantially larger place within the community of the health
. . . we are among the few nations that do not guarantee minimal health care to all mothers and children.
professions. Moreover, we believe that extending the scope of nursing practices is essential if this nation is to achieve the goal of equal access to health for all its citizens.”e
In addition, quality of health care service is an issue of increasing national concern.’ While a great deal of research has been done in measuring quality of medical care, it is clear that the science of quality assessment is still in its infancy. For- malized programs for expanded roles for nurses, such as pediatric nurse practitioners (PNPs), have been in existence for only a little over a decade, and little information is available on the quality dimension of Services being rendered by nurse practitioners. Because of the increasing use of PNPs, it is important to evaluate the quality of care they give.
2. At Station D. are the PNPs. Patients routed here could have been triaged to the Distributing Doctors; these patients may require more exten- sive physical examination or health counseling. In practice, however, it is usually the pressure of the workload which determines whether a patient is sent to the Distributing Doctor or PNP. The PNPs are instructed to give good care, but they must also keep up with the volume of patients. Two PNPs were hired to take the place of one Distributing Doctor, which they do, as evidenced by a daily record of patients seen. The PNPs, too, may refer patients to Station C. i f necessary. The training of the two types of Practitioners - physi- cians and PNPs - is different as is the amount of time they are likely to spend with patients. The PNPs see the same kinds of patients as the Distributing Doctors but go into more preventive and health counseling aspects of care. Neither the MDs or PNPs use protocols (specific guidelines) in treating patients, and both groups of health care providers work with little supervi- sion.
Because of the increasing use of PNPs, it is important to evaluate the quality of care they give.
Setting The setting for this study was the Pediatric Am-
bulatory Care Clinic of a large, urban medical center. Most encounters in this clinic are for episodic care. There is little provider-patient con- tinuity, a non-defined patient population and a large proportion of unscheduled visits for minor illness. The majority of patients who come to this clinic are black and Puerto Rican from the lower socio-economic class.
Upon arriving in the clinic, the patient first presents at the triage desk where the triager routes the patient to one of four possible places.
1. Stations A and B are the Distributing Doc- tors. These stations are manned by board eligible pediatricians employed in the clinic to handle routine care for the not so ill children. An average of five to ten minutes is all that is usually required at this station. The Distributing Doctors must try to keep up with the volume of patients. I f the child needs extensive work up, the doctor will refer the child to Station C.
3. Station C. is where the Attendings, Residents, Interns and Medical Students are located. It is for the very ill and emergency pa- tients.
4. Isolation room is for the patients with com- municable diseases.
The three female physicians in the study work part-time, and the two female PNPs in the study are full-time. The physicians ranged in age from 30 to 50 and nurses, from 20 to 30. All of the physi- cians completed a Pediatric Residency. One of the PNPs has a Bachelor’s Degree, and the other will finish her B.S. within the year. Both PNPs had graduated from the first PNP course given at the Medical Center four months prior to the study.
Methodology During week days from January until the middle
of April, 1975, the investigator of this study was present at the triage desk in the Pediatric Am- bulatory Care Clinic at the Medical Center where
June 1978 Volume 10 Number 2 IreTl /Image Page 42
Quality of Care Assessment
I Seen I were interviewed MD I 136 I 96
this study was conducted. To compare the quality of care by two types of providers, patients who presented at the triage with a complaint of “sore throat” were alternately assigned to female pediatricians and to female PNPs in the Distributing Area.
At the point of entry (triage desk) into the study, the patient’s name, address, telephone number, language spoken, date, time of day as well as who accompanied the child were recorded by the in- vestigator. Later the same day the patients who in- dicated that they either had a telephone in their home or had access to one were sent a letter tell- ing them about the study and asking their future cooperation in answering some questions over the telephone. The telephone was chosen, for practical reasons, as a means of conducting the interview.
Seven to ten days after the clinic visit the per- son who accompanied the child to the clinic - or the child himself if helshe came alone - was in- terviewed via the telephone. Four M.P.H. students conducted the interviews. The purpose of the in- terview was to ascertain parentallpatient satisfac- tion, attitudes, understanding, compliance, severi- ty of illness, activity level, health status at one week after initial visit, as well as other sources of care for this illness. One week after the initial visit was chosen as the time to interview because it was short enough to remember the visit but not as stressful as when the child was ill, and because it was also a uniform time to determine outcome.
The number and percentage of the patients seen by pediatricians and PNPs and the patients andlor parents who were interviewed are shown below:
interviewed 70.6
I Number I or Parents who 1 Percent Number of Patients
PNP I 138 1 106 I 76.8
There were no significant differences between the two groups of patients as to the percentage of pa- tients andlor parents who were interviewed. To determine the possible bias from using the
telephone as the only means of interviewing and for other reasons of non-response, the respondents and non-respondents for both the physicians’ patients and the PNPs’ patients were
each compared on eleven important variables us- ing chi squares at the 5 percent level of significance.O The results of the statistical com- parisons showed a high degree of homogeneity between the respondents and non-respondents in each group of patients with regards to the follow- ing variables: age, sex, ethnic group, language spoken, Medicaid, first complaint, tentative diagnosis, throat culture result, total visits in the episode and the unweighted scores for history and physical examination.
Information was obtained from the records with regard to episodes of medical and health care. An episode of medical or health care is a block of one or more medical services received by an individual during a period of relatively continuous contact with one or more providers of service in relation to a medical problem.18 There are three basic com- ponents to an episode: first, it is based around a problem or a symptom; second, it has a length; third is the medical management of an episode.
The study visit was to be the first visit in this medical care episode. Therefore, i f the child had been in the clinic within three weeks prior to this visit with a related illness, the child was dropped from the study. Three weeks was also chosen as the time limit for this episode of medical and health care. It was expected that most patients would be asymptomatic within 48-72 hours, but that i f complications were to develop, they would be most likely to appear within three weeks after the onset of the illness.1g
In addition to obtaining information for the episode, information was obtained from the records regarding the quality of the process of medical and health care by adapting the explicit criteria developed for the tracer condition of strep- tococcal phary ng i t is.
The criteria for the streptococcal tracer were proposed by a panel of Board Certified Pediatri- cians and appropriate specialists. The physicians were instructed not only to take into account the best thinking in the medical community but also the practical constraints of the particular setting being evaluated. Criteria were proposed that both reasonably and minimally could be in the patients’ charts.
*Developed by the Child Care Project, Center for Community Health Systems and Department of Pediatrics, Faculty of Medicine, Columbia University, New York City, 1974.
Page 43 IEeTl Amage June 1978 Volume 10 Number 2
Quality of Care Assessment
The proposed criteria were mailed to the attend- ing physicians and house staff of the Pediatric Division of this Medical Center.* Agreement by at least 80 percent of the physicians who respond- ed to a questionnaire concerning the relevance of each criterion was pre-established as the minimum level for inclusion of each criterion.
The questionnaire was mailed to 52 physicians; 47 responded. Up to the point that a diagnosis is made and usually confirmed by a throat culture, the process of medical and health care should be similar whether the etiology of the pharyngitis is bacterial or viral.
The tracer, as described by Kessner,l7 calls for using a set of three or more conditions. This study is concerned with only one condition. Henceforth the criteria for sore throat will be called the in- dicator condition and not a tracer.
There are five levels of care for this indicator condition: history, physical examination, diagnosis, laboratory and management. Each of these levels was assigned a weight.
Process and satisfaction were the two main categories of dependent variables.
The top five administrative physicians in the pediatric clinic were given the indicator criteria and asked to weigh each of the five levels making the range equal to 100. The average was then com- puted for each category. The results were: History - 15; Physical Examination - 15; Diagnosis - 5; Laboratory - 33; Management and Follow-up - 32. The total possible score excluding manage- ment was 68. If the child had a positive throat culture, it would be possible to get an additional score of 32 for management and follow-up. The number of patients with a positive throat culture was small for both groups of patients - 28 for the MDs and 41 for the PNPs. The relative weight assigned to each level was divided equally among all criteria within each category. The weighted and unweighted scores for each criterion and level as well as the overall score were available for analysis.
Process and satisfaction were the two main
“For further information regarding tracer development see Novick, Lloyd, et a/. “Assessment of the Tracer Methodology” Medical Care 14 (1): 1-12, 1976.
categories of dependent variables. It has been stated in the literature that patient satisfaction is a form of outcome.8 The satisfaction (outcome) variables were measured by responses to inter- view questions. The process variables were measured by the explicit criteria from the records and by questions in the parentallpatient inter- views. The explicit criteria from the records in- cluded the five levels of care for the indicator con- dition history, physical examination, diagnosis, laboratory and management and follow-up of the children with a positive throat culture. Information regarding process of care from the interviews was ascertained by the responses to questions regar- ding what the health care provider did (such as discussion of non-illness-related topics), whether an explanation of the diagnosis was given, whether medication was prescribed andlor a throat culture was done. In addition, the length and management of the episode was obtained from the records and interviews. The components of the episode included: diagnosis, completeness of physical examination, number and kinds of tests ordered and medications given, number of referrals, number of appointments kept, number of visits, and the number of persons who sought care elsewhere (based on interview data one week after the initial visit).
The patients of the pediatricians and the pa- tients of the PNPs did not differ significantly as to the sociodemographic variables about residence, age, sex, ethnic groups, language spoken, access to a telephone, Medicaid status and the person who accompanied the child to the clinic.
There were no significant differences between the two groups in the percentages with throat cultures ordered or the percentages with positive throat cultures. About 26 percent of those ordered by MDs were positive, in contrast with 35 percent of those ordered by PNPs. However this dif- ference was not significant. The PNPs had significantly more patients with a tentative diagnosts of some type of pharyngitis, and the pediatricians recorded a diagnosis of upper respiratory infection more often.
The two PNPs and one of the three pediatri- cians worked five days a week. One pediatrician worked one and one-half days per week, and the other pediatrician worked one-half day per week. One PNP saw 59 percent of the PNPs’ patients, and one pediatrician saw 75 percent of the MDs’
June 1978 Volume 10 Number 2 LEeTl /Image Page 44
Quality of Care Assessment
Level of
Care
Number of persons Overall
weighted score
History Physical Exam
Laboratory Diagnosis
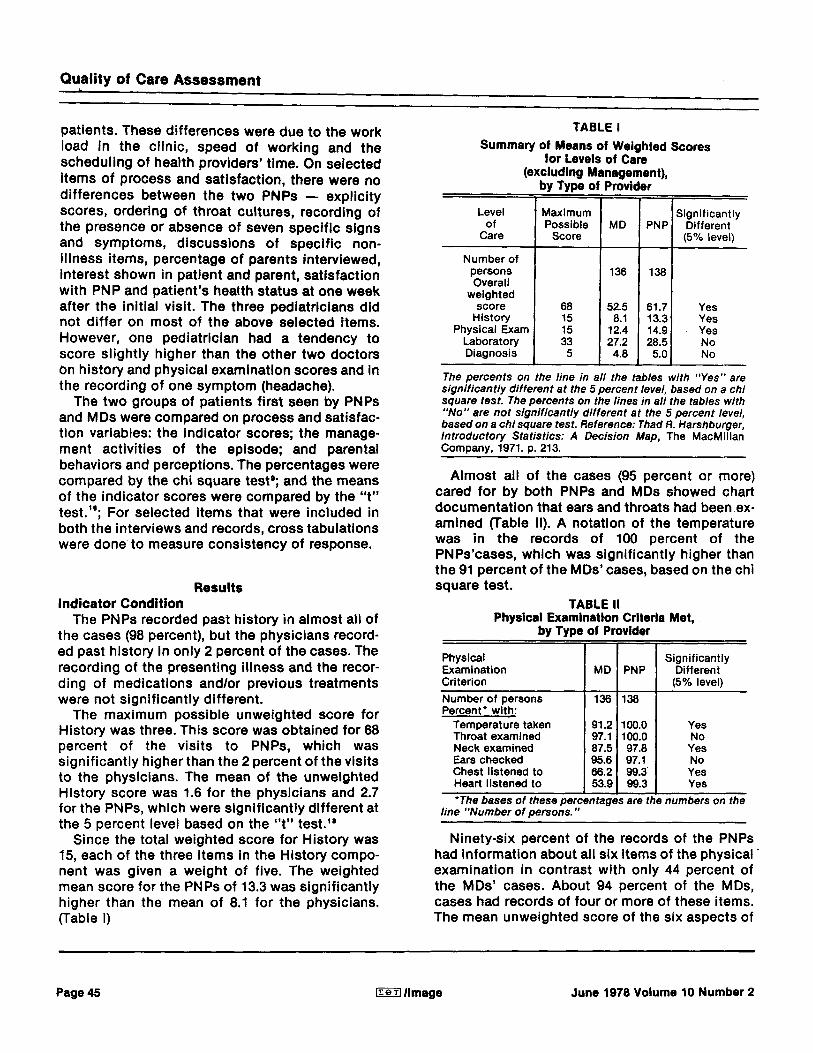
patients. These differences were due to the work load in the clinic, speed of working and the scheduling of health providers’ time. On selected items of process and satisfaction, there were no differences between the two PNPs - explicity scores, ordering of throat cultures, recording of the presence or absence of seven specific signs and symptoms, discussions of speclfic non- illness items, percentage of parents interviewed, interest shown in patient and parent, satisfaction with PNP and patient’s health status at one week after the initial visit. The three pediatricians did not differ on most of the above selected items. However, one pediatrician had a tendency to score slightly higher than the other two doctors on history and physical examination scores and in the recording of one symptom (headache).
The two groups of patients first seen by PNPs and MDs were compared on process and satisfac- tion variables: the indicator scores; the manage- ment activities of the episode; and parental behaviors and perceptions. The percentages were compared by the chi square testa; and the means of the indicator scores were compared by the “t” test.‘*; For selected items that were included in both the interviews and records, cross tabulations were done to measure consistency of response.
Maximum Significantly Possible MD PNP Different
Score (5% level)
136 138
68 52.5 61.7 Yes 15 8.1 13.3 Yes 15 12.4 14.9 Yes 33 27.2 28.5 No 5 4.8 5.0 No
Results Indicator Condition
The PNPs recorded past history in almost all of the cases (98 percent), but the physicians record- ed past history in only 2 percent of the cases. The recording of the presenting illness and the recor- ding of medications andlor previous treatments were not significantly different.
The maximum possible unweighted score for History was three. This score was obtained for 68 percent of the visits to PNPs, which was significantly higher than the 2 percent of the visits to the physicians. The mean of the unweighted History score was 1.6 for the physicians and 2.7 for the PNPs, which were significantly different at the 5 percent level based on the “t” test.’*
Since the total weighted score for History was 15, each of the three items in the History compo- nent was given a weight of five. The weighted mean score for the PNPs of 13.3 was significantly higher than the mean of 8.1 for the physicians. (Table I)
by Type of Provider
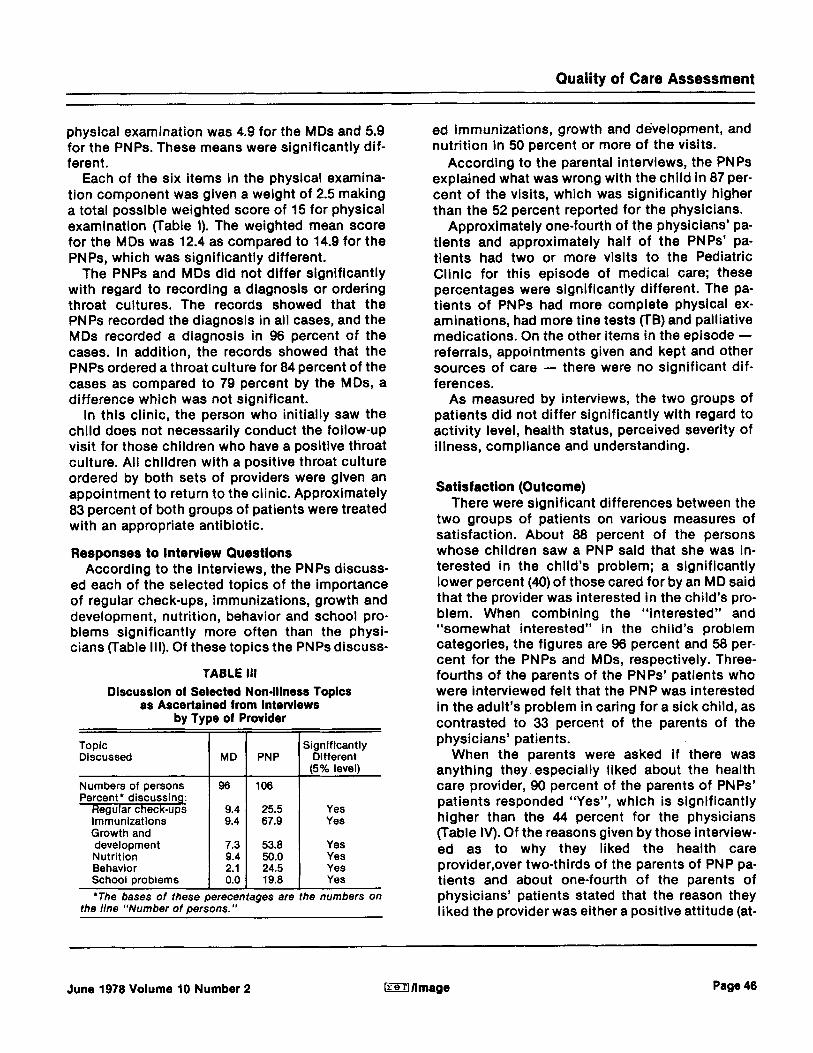
Physical Examination Criterion Number of persons Percent’ with:
Temperature taken Throat examined Neck examined Ears checked Chest listened to Heart listened to ’The bases of these perc
line “Number of persons.”
MD PNP & 91.2 100.0 97.1 100.0 87.5 97.8 95.6 97.1 66.2 99.3 L qtages 53.9 are 99.3 tl
Significantly Different 15% level)
Yes No Yes No Yes Yes
numbers on the
Ninety-six percent of the records of the PNPs had information about all six items of the physical. examination in contrast with only 44 percent of the MDs’ cases. About 94 percent of the MDs, cases had records of four or more of these items. The mean unweighted score of the six aspects of
Page 45 [reT1 /Image June 1978 Volume 10 Number 2
Quality of Care Assessment
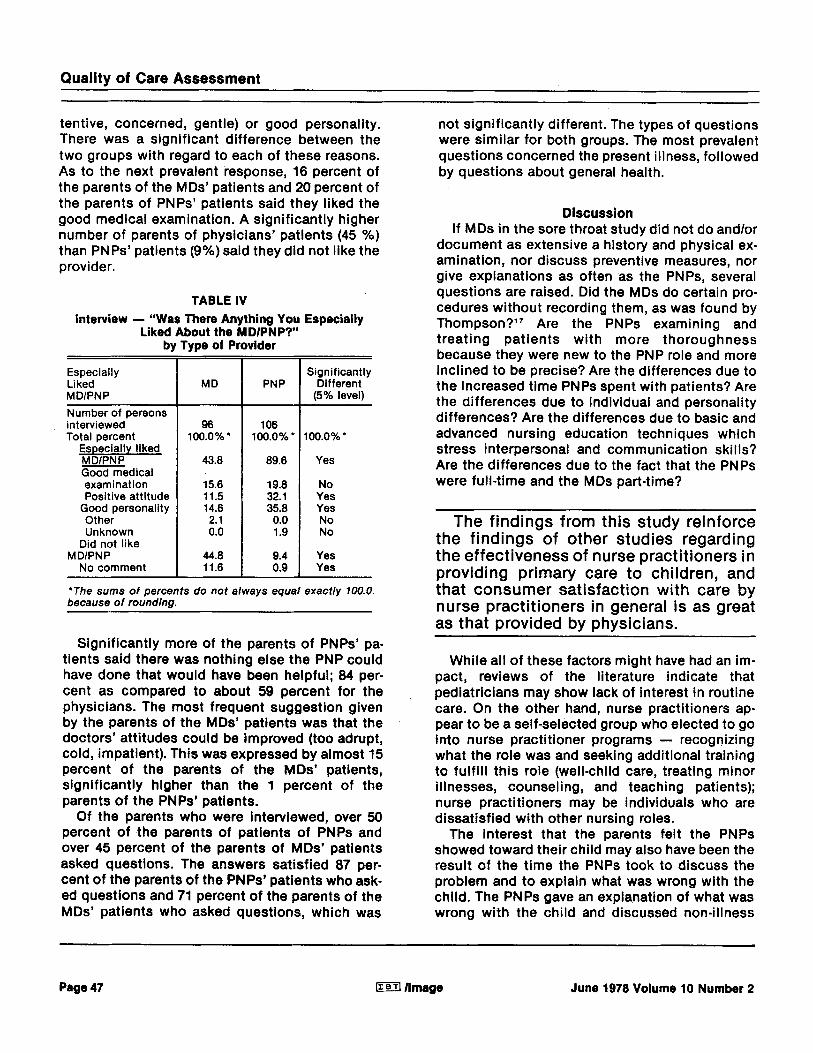
Topic Discussed MD PNP
Numbers of persons 96 106
Significantly Different (5% level)
Percent’ discussing: Reaular check-ups immunizations . Growth and development Nutrition Behavior School problems
9.4 9.4
7.3 9.4 2.1 0.0
25.5 67.9
53.8 50.0 24.5 19.8
Yes Yes
Yes Yes Yes Yes
‘The bases of these perecentages are the numbers on the line “Number of persons.”
ed immunizations, growth and de’velopment, and nutrition in 50 percent or more of the visits.
According to the parental interviews, the PNPs explained what was wrong with the child in 87 per- cent of the visits, which was significantly higher than the 52 percent reported for the physicians.
Approximately one-fourth of the physicians’ pa- tients and approximately half of the PNPs’ pa- tients had two or more visits to the Pediatric Clinic for this episode of medical care; these percentages were significantly different. The pa- tients of PNPs had more complete physical ex- aminations, had more tine tests (TB) and palliative medications. On the other items in the episode - referrals, appointments given and kept and other sources of care - there were no significant dif- ferences.
As measured by interviews, the two groups of patients did not differ significantly with regard to activity level, health status, perceived severity of illness, compliance and understanding.
Satisfaction (Outcome) There were significant differences between the
two groups of patients on various measures of satisfaction. About 88 percent of the persons whose children saw a PNP said that she was in- terested in the child’s problem; a significantly lower percent (40) of those cared for by an MD said that the provider was interested in the child’s pro- blem. When combining the “interested” and “somewhat interested’’ in the child’s problem categories, the figures are 96 percent and 58 per- cent for the PNPs and MDs, respectively. Three- fourths of the parents of the PNPs’ patients who were interviewed felt that the PNP was interested in the adult’s problem in caring for a sick child, as contrasted to 33 percent of the parents of the physicians’ patients.
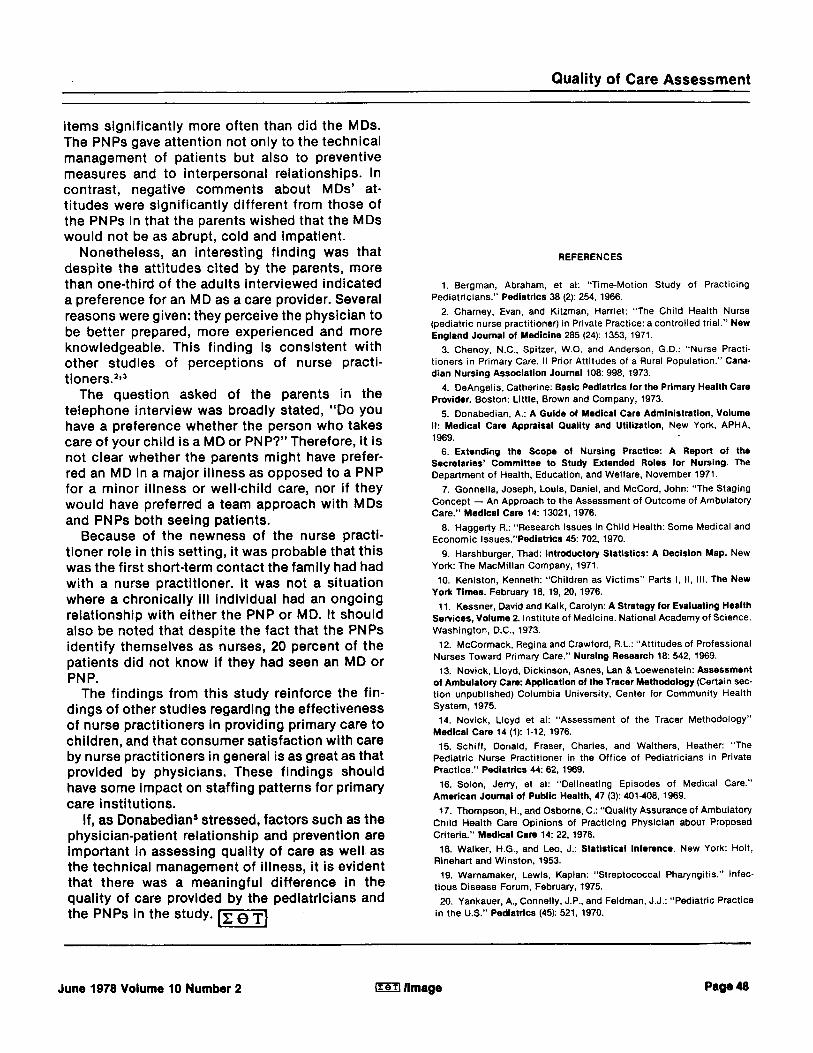
When the parents were asked i f there was anything they especially liked about the health care provider, 90 percent of the parents of PNPs’ patients responded “Yes”, which is significantly higher than the 44 percent for the physicians (Table IV). Of the reasons given by those interview- ed as to why they liked the health care provider,over two-thirds of the parents of PNP pa- tients and about one-fourth of the parents of physicians’ patients stated that the reason they liked the provider was either a positive attitude (at-
June 1978 Volume 10 Number 2 lreollmage Page 46
Quality of Care Assessment
tentive, concerned, gentle) or good personality. There was a significant difference between the two groups with regard to each of these reasons. As to the next prevalent response, 16 percent of the parents of the MDs’ patients and 20 percent of the parents of PNPs’ patients said they liked the good medical examination. A significantly higher number of parents of physicians’ patients (45 %) than PNPs’ patients (9%) said they did not like the provider.
TABLE IV Interview - “Was There Anything You Especially
Liked About the MDIPNP?” by Type of Provider
Especially Liked M DlPN P Number of persons interviewed Total Dercent
Especially liked MDlPNP Good medical examination Positive attitude
Good personality Other Unknown
Did not like
No comment M DlPN P
MD
96 100.0%‘
43.8
15.6 11.5 14.6 2.1 0.0
44.8 11.6
PN P
106 100.0~0’
89.6
19.8 32.1 35.8 0.0 1.9
9.4 0.9
Significantly Different
(5% level)
100.0%’
Yes
No Yes Yes No No
Yes Yes
“The sums of percents do not always equal exactly 100.0 because of rounding.
Significantly more of the parents of PNPs’ pa- tients said there was nothing else the PNP could have done that would have been helpful; 84 per- cent as compared to about 59 percent for the physicians. The most frequent suggestion given by the parents of the MDs’ patients was that the doctors’ attitudes could be improved (too adrupt, cold, impatient). This was expressed by almost 15 percent of the parents of the MDs’ patients, significantly higher than the 1 percent of the parents of the PNPs’ patients.
Of the parents who were interviewed, over 50 percent of the parents of patients of PNPs and over 45 percent of the parents of MDs’ patients asked questions. The answers satisfied 87 per- cent of the parents of the PNPs’ patients who ask- ed questions and 71 percent of the parents of the MDs’ patients who asked questions, which was
not significantly different. The types of questions were similar for both groups. The most prevalent questions concerned the present illness, followed by questions about general health.
Discussion If MDs in the sore throat study did not do andlor
document as extensive a history and physical ex- amination, nor discuss preventive measures, nor give explanations as often as the PNPs, several questions are raised. Did the MDs do certain pro- cedures without recording them, as was found by Thompson?I7 Are the PNPs examining and treating patients with more thoroughness because they were new to the PNP role and more inclined to be precise? Are the differences due to the increased time PNPs spent with patients? Are the differences due to individual and personality differences? Are the differences due to basic and advanced nursing education techniques which stress interpersonal and communication skills? Are the differences due to the fact that the PNPs were full-time and the MDs part-time?
The findings from this study reinforce the findings of other studies regarding the effectiveness of nurse practitioners in providing primary care to children, and that consumer satisfaction with care by nurse practitioners in general is as great as that provided by physicians.
While all of these factors might have had an im- pact, reviews of the literature indicate that pediatricians may show lack of interest in routine care. On the other hand, nurse practitioners ap- pear to be a self-selected group who elected to go into nurse practitioner programs - recognizing what the role was and seeking additional training to fulfill this role (well-child care, treating minor illnesses, counseling, and teaching patients); nurse practitioners may be individuals who are dissatisfied with other nursing roles.
The interest that the parents felt the PNPs showed toward their child may also have been the result of the time the PNPs took to discuss the problem and to explain what was wrong with the child. The PNPs gave an explanation of what was wrong with the child and discussed non-illness
Page 47 Irerl /Image June 1978 Volume 10 Number 2
Quality of Care Assessment
items significantly more often than did the MDs. The PNPs gave attention not only to the technical management of patients but also to preventive measures and to interpersonal relationships. In contrast, negative comments about MDs’ at- titudes were significantly different from those of the PNPs in that the parents wished that the MDs would not be as abrupt, cold and impatient.
Nonetheless, an interesting finding was that despite the attitudes cited by the parents, more than one-third of the adults interviewed indicated a preference for an MD as a care provider. Several reasons were given: they perceive the physician to be better prepared, more experienced and more knowledgeable. This finding is consistent with other studies of perceptions of nurse practi- t i o n e r ~ . ~ , ~
The question asked of the parents in the telephone interview was broadly stated, “Do you have a preference whether the person who takes care of your child is a MD or PNP?” Therefore, it is not clear whether the parents might have prefer- red an MD in a major illness as opposed to a PNP for a minor illness or well-child care, nor i f they would have preferred a team approach with MDs and PNPs both seeing patients.
Because of the newness of the nurse practi- tioner role in this setting, it was probable that this was the first short-term contact the family had had with a nurse practitioner. It was not a situation where a chronically ill individual had an ongoing relationship with either the PNP or MD. It should also be noted that despite the fact that the PNPs identify themselves as nurses, 20 percent of the patients did not know i f they had seen an MD or PN P.
The findings from this study reinforce the fin- dings of other studies regarding the effectiveness of nurse practitioners in providing primary care to children, and that consumer satisfaction with care by nurse practitioners in general is as great as that provided by physicians. These findings should have some impact on staffing patterns for primary care institutions.
If, as DonabedianS stressed, factors such as the physician-patient relationship and prevention are important in assessing quality of care as well as the technical management of illness, it is evident that there was a meaningful difference in the quality of care provided by the pediatricians and the PNPs in the study. c 8 T 0
REFERENCES
1. Bergman, Abraham, et al: ”Time-Motion Study of Practicing Pediatricians.” Pediatrics 38 (2): 254, 1966.
2. Charney, Evan, and Kitzman, Harriet: “The Child Health Nurse (pediatric nurse practitioner) in Private Practice: a controlled trial.” New England Journal 01 Medicine 285 (24): 1353, 1971.
3. Chenoy, N.C., Spitzer, W.O. and Anderson, G.D.: “Nurse Practi- tioners in Primary Care. II Prior Attitudes of a Rural Population.” Cana- dian Nursing Association Journal 108: 998, 1973.
4. DeAngelis, Catherine: Basic Pediatrics lor the Primary Health Care Provider. Boston: Little, Brown and Company, 1973. 5. Donabedian, A.: A Guide 01 Medical Care Administration, Volume
II: Medical Care Appraisal Quality and Utilization, New York, APHA, 1969.
6. Extending the Scope of Nursing Practice: A Report of the Secretaries’ Committee lo Study Extended Roles lor Nursing. The Department of Health, Education, and Welfare, November 1971.
7. Gonnella, Joseph, Louis, Daniel, and McCord, John: “The Staging Concept - An Approach to the Assessment of Outcome of Ambulatory Care.” Medical Care 1 4 13021, 1976.
8. HaggerIy R.: “Research Issues in Child Health: Some Medical and Economic Issues.”Pediatrics 45: 702, 1970.
9. Harshburger, Thad: Introductory Statistics: A Decision Map. New York: The MacMillan Company, 1971.
10. Keniston, Kenneth: “Children as Victims” Parts I, II, ill. The New York Times. February 18, 19,20, 1976.
11. Kessner, David and Kalk, Carolyn: A Strategy lor Evaluatlng Health Setvices, Volume 2. Institute of Medicine. National Academy of Science. Washington, D.C., 1973.
12. McCormack, Regina and Crawford, R.L.: “Attitudes of Professional Nurses Toward Primary Care.” Nursing Research 18: 542, 1969. 13. Novick, Lloyd, Dickinson, Asnes, Lan 8. Loewenstein: Assessment
01 Ambulatory Care: Application of the Tracer Methodology (Certain sec- tion unpublished) Columbia University, Center for Community Health System, 1975. 14. Novick, Lloyd et al: “Assessment of the Tracer Methodology”
Medical Care 14 (1): 1-12, 1976. 15. Schiff, Donald, Fraser, Charles, and Walthers, Heather: “The
Pediatric Nurse Practitioner in the Office of Pediatricians in Private Practice.” Pediatrics 44: 62, 1969.
16. Solon, Jerry, et al: “Delineating Episodes of Medical Care.” American Journal of Public Health, 47 (3): 401-408, 1969.
17. Thompson, H., and Osborne, C.: “Quality Assurance of Ambulatory Child Health Care Opinions of Practicing Physician about Proposed Criteria.” Medlca l Care 14: 22, 1976.
18. Walker, H.G., and Leo, J.: Statlstical Inference. New York: Holt, Rinehart and Winston, 1953.