A Quantitative DTI Fiber Tract Analysis Suite Casey Goodlett 1 , Isabelle Corouge 1,2 , Matthieu Jomier 2 , and Guido Gerig 1,2 1 Department of Computer Science 2 Department of Psychiatry, University of North Carolina, USA, {gcasey,corouge}@cs.unc.edu, [email protected], [email protected]Abstract. Diffusion tensor imaging (DTI) allows a quantitative study of the underlying geometry and architecture of white matter. We have de- veloped a suite of open source tools for quantitative analysis of DTI suit- able for use in clinical research studies. We have leveraged open source tools for file IO, image processing, visualization, and user interface. The tools are designed to provide several interconnected modules to perform quantitative analysis of DTI data based on fiber tracts generated from tractography. 1 Introduction Diffusion tensor imaging (DTI) provides quantitative measurements of the local- ized diffusion of water in the brain. Since water tends to diffuse more easily along axons, rather than perpendicular to them, localized diffusion measurements can give insight into the structure of the white matter in the brain. For each voxel in the image we can model the local diffusion properties of the tissue by a 3x3 symmetric matrix with positive eigenvalues. The largest eigenmode of the tensor estimates the principal direction of diffusion locally, and the relative values of the eigenvalues estimates the anisotropy of the diffusion. Tractography extracts streamlines along the principal diffusion directions as fiber tracts [1]. We have developed a prototype suite of tools suitable for use in clinical re- search studies to implement tract oriented statistics of DTI. As part of a modular design, we have developed two separate tools FiberTracking and FiberViewer. FiberTracking computes tensor fields from diffusion weighted images and per- forms tractography to analyze the architecture of white matter. FiberViewer analyzes the geometry and diffusion properties of fiber tracts produced by the FiberTracking tool with a tensor statistics analysis package. Together these tools provide an integrated package for analysis of DTI data [2]. Open source libraries are used as a base for processing, IO, and visualization. ITK provides the basis of image and object processing, while VTK and SOViewer provide the basis of visualization [3], [4], [5]. The tools described in this paper are a prototype envi- ronment for algorithm developments that can be contributed back to the open source community as ITK modules. This work is part of the National Alliance for Medical Image Computing (NAMIC), funded by the National Institutes of Health through the NIH Roadmap for Medical Research, Grant U54 EB005149. Information on the National Centers for Biomedical Computing can be obtained from http://nihroadmap.nih.gov/bioinformatics
Transcript
A Quantitative DTI Fiber Tract Analysis Suite
Casey Goodlett1, Isabelle Corouge1,2, Matthieu Jomier2, and Guido Gerig1,2
1 Department of Computer Science2 Department of Psychiatry, University of North Carolina, USA,
Abstract. Diffusion tensor imaging (DTI) allows a quantitative studyof the underlying geometry and architecture of white matter. We have de-veloped a suite of open source tools for quantitative analysis of DTI suit-able for use in clinical research studies. We have leveraged open sourcetools for file IO, image processing, visualization, and user interface. Thetools are designed to provide several interconnected modules to performquantitative analysis of DTI data based on fiber tracts generated fromtractography.
1 Introduction
Diffusion tensor imaging (DTI) provides quantitative measurements of the local-ized diffusion of water in the brain. Since water tends to diffuse more easily alongaxons, rather than perpendicular to them, localized diffusion measurements cangive insight into the structure of the white matter in the brain. For each voxelin the image we can model the local diffusion properties of the tissue by a 3x3symmetric matrix with positive eigenvalues. The largest eigenmode of the tensorestimates the principal direction of diffusion locally, and the relative values ofthe eigenvalues estimates the anisotropy of the diffusion. Tractography extractsstreamlines along the principal diffusion directions as fiber tracts [1].
We have developed a prototype suite of tools suitable for use in clinical re-search studies to implement tract oriented statistics of DTI. As part of a modulardesign, we have developed two separate tools FiberTracking and FiberViewer.FiberTracking computes tensor fields from diffusion weighted images and per-forms tractography to analyze the architecture of white matter. FiberVieweranalyzes the geometry and diffusion properties of fiber tracts produced by theFiberTracking tool with a tensor statistics analysis package. Together these toolsprovide an integrated package for analysis of DTI data [2]. Open source librariesare used as a base for processing, IO, and visualization. ITK provides the basisof image and object processing, while VTK and SOViewer provide the basis ofvisualization [3], [4], [5]. The tools described in this paper are a prototype envi-ronment for algorithm developments that can be contributed back to the opensource community as ITK modules.? This work is part of the National Alliance for Medical Image Computing (NAMIC),
funded by the National Institutes of Health through the NIH Roadmap for MedicalResearch, Grant U54 EB005149. Information on the National Centers for BiomedicalComputing can be obtained from http://nihroadmap.nih.gov/bioinformatics
bull
Text Box
Presented at the 2005 ISC / NA-MIC / MICCAI Workshop on Open-Source Software
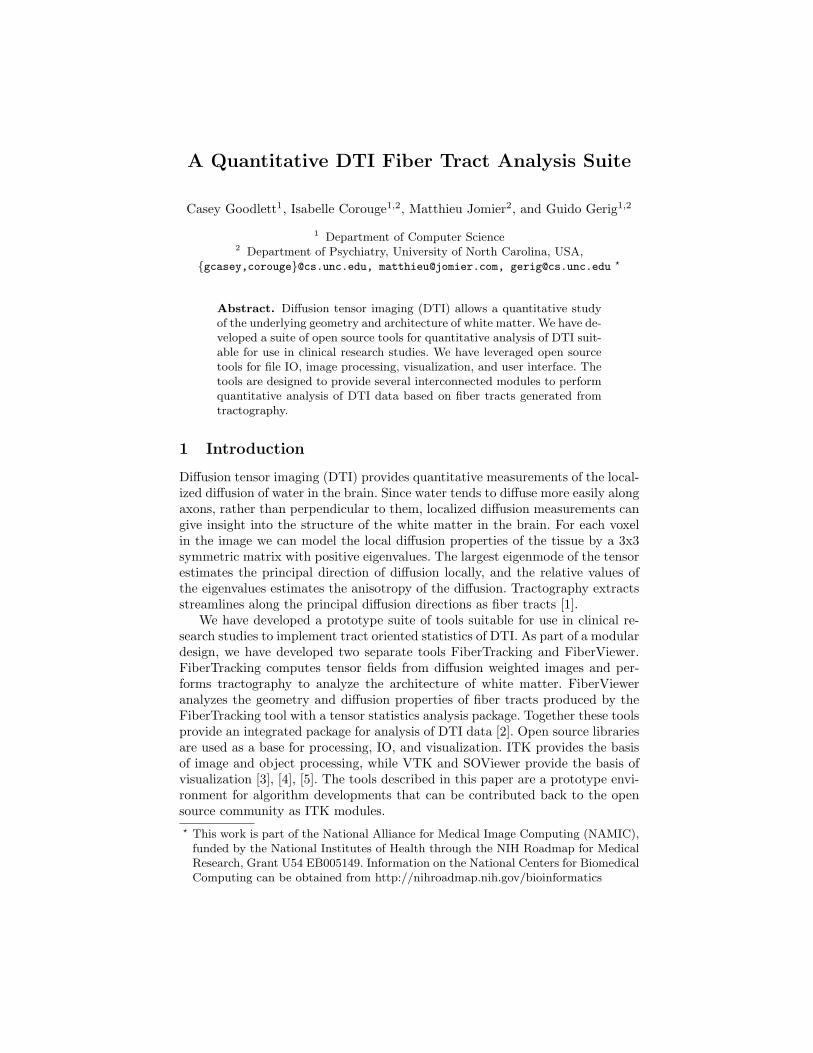
Fig. 1. a) Interface of FiberTracking program showing 3 orthogonal views of the Frac-tional Anisotropy (FA) image as well as a 3D view of the image and the fibers whichhave been generated. b) Interface of SNAP tool which is used for ROI specification.
2 Prototype Tools for Quantitative Analysis
2.1 FiberTracking: Tensor Estimation and Tractography
FiberTracking is a program for tensor estimation and tractography. An early ver-sion of FiberTracking was developed by Pierre Fillard and described in [6]. Thepurpose of this tool is (1) estimation of the tensor field from diffusion weightedimages and (2) generation of fiber tracts for exploration of the architecture ofthe white matter. Fibers generated by the program are streamlines through thediffusion tensor field and serve as a coordinate system for understanding thegeometry and connectivity of the white matter.
The full diffusion tensor field is recovered from seven diffusion weighted im-ages by solving the Stejskal and Tanner equation using the method described in[7]. Currently the software uses the directional coding scheme defined by Basser.Data with other direction coding schemes can be processed by using an exter-nal tool, and loading the estimated tensor field directly in the FiberTrackingtool. Once tensors have been estimated for each voxel, tractography can be per-formed to extract probable fiber bundles in the white matter. Tractography isimplemented by following streamlines according to the principal diffusion di-rections defined by the largest eigenvector of the diffusion tensor as describedin [8]. Our software uses backward tracking in order to improve stability. Seedpoints are generated in a destination ROI and tracked backwards. The tractsare rejected if they do not pass through the source ROI. The analysis suite usesthe ITK-provided DTITubeSpatialObject data structure for representing fibersand associated traits along the fibers. The user interface for the FiberTrackingprogram is shown in Fig. 1. ROI specification is accomplished by using Insight-SNAP which is distributed as part of the InsightApplications [9].
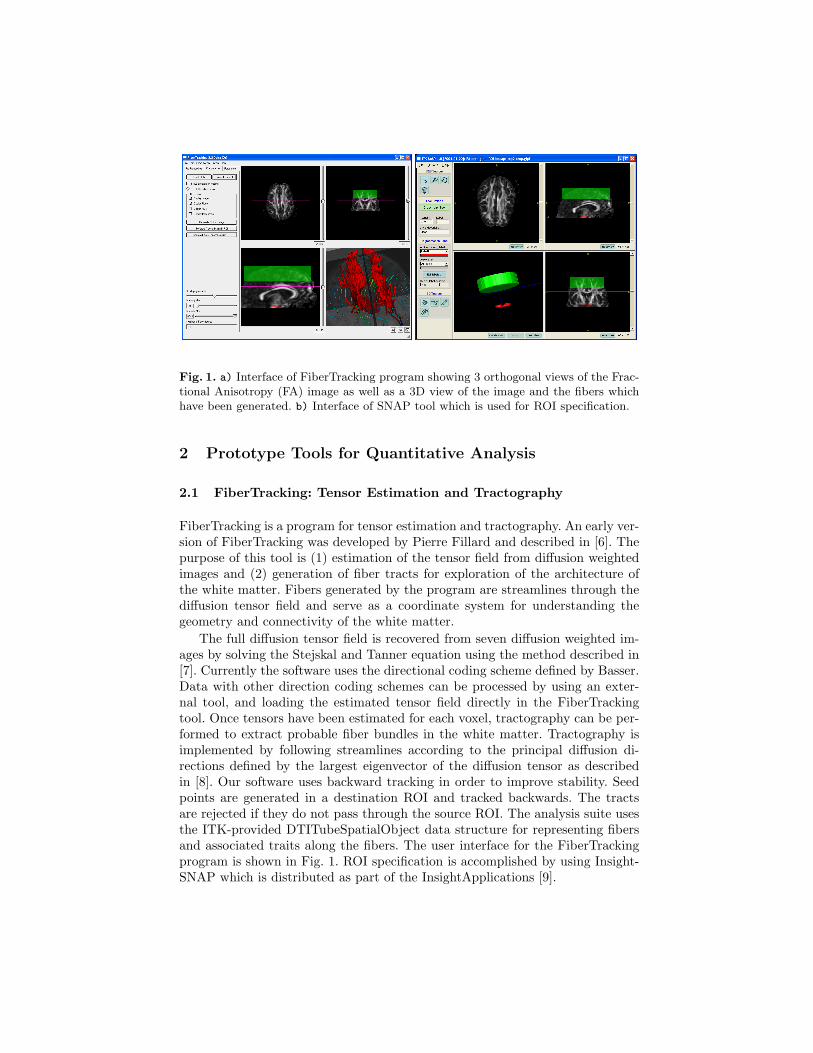
Fig. 2. Examples of fiber visualization a) Visualization of streamlines generated fromtractography. b) Visualization of FA value plotted along streamlines. c) Visualizationof the tensors representing diffusion properties along the streamlines colored by FAvalue.
2.2 FiberViewer: Fiber clustering and analysis
FiberViewer is a program for performing quantitative statistical analysis ofstreamlines generated using the FiberTracking program. The major componentsof FiberViewer are visualizing the geometry of fiber tracts, clustering fibers intobundles representing anatomically significant tracts, visualizing properties alongthe fibers, and performing quantitative statistics along bundles. Furthermore,several manual tools are provided for tasks such as cropping fibers.
Visualization of fiber tracts relies on the VTK and SOViewer libraries. Thegeometry of fibers can be visualized as a solid tube, or a sequence of tensors.Furthermore, various properties can be visualized as colors along the fiber. Forexample, users can see the fractional anisotropy, mean diffusivity, or one of thethe eigenvalues of the tensor volume plotted along the fiber bundle as shown inFig. 2.
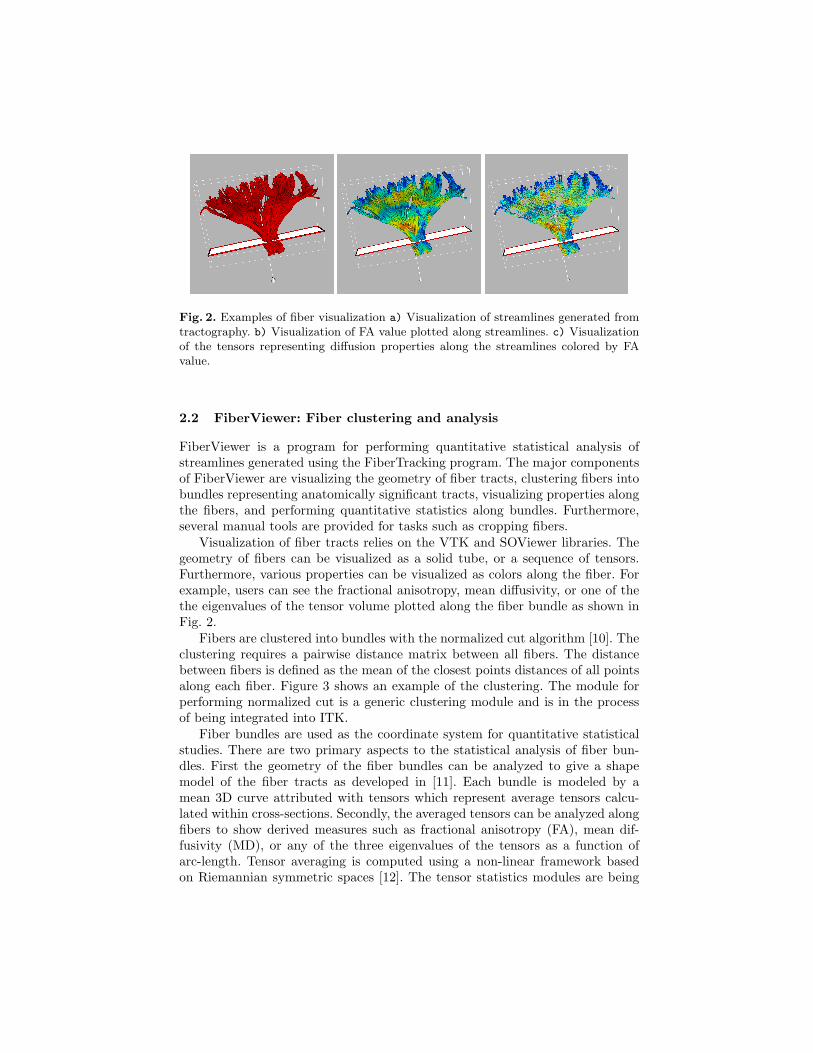
Fibers are clustered into bundles with the normalized cut algorithm [10]. Theclustering requires a pairwise distance matrix between all fibers. The distancebetween fibers is defined as the mean of the closest points distances of all pointsalong each fiber. Figure 3 shows an example of the clustering. The module forperforming normalized cut is a generic clustering module and is in the processof being integrated into ITK.
Fiber bundles are used as the coordinate system for quantitative statisticalstudies. There are two primary aspects to the statistical analysis of fiber bun-dles. First the geometry of the fiber bundles can be analyzed to give a shapemodel of the fiber tracts as developed in [11]. Each bundle is modeled by amean 3D curve attributed with tensors which represent average tensors calcu-lated within cross-sections. Secondly, the averaged tensors can be analyzed alongfibers to show derived measures such as fractional anisotropy (FA), mean dif-fusivity (MD), or any of the three eigenvalues of the tensors as a function ofarc-length. Tensor averaging is computed using a non-linear framework basedon Riemannian symmetric spaces [12]. The tensor statistics modules are being
Fig. 3. Automatic clustering of sets of streamlines into four main groups which char-acterize left and right uncinate and longitudinal fasciculi using the normalized cutalgorithm.
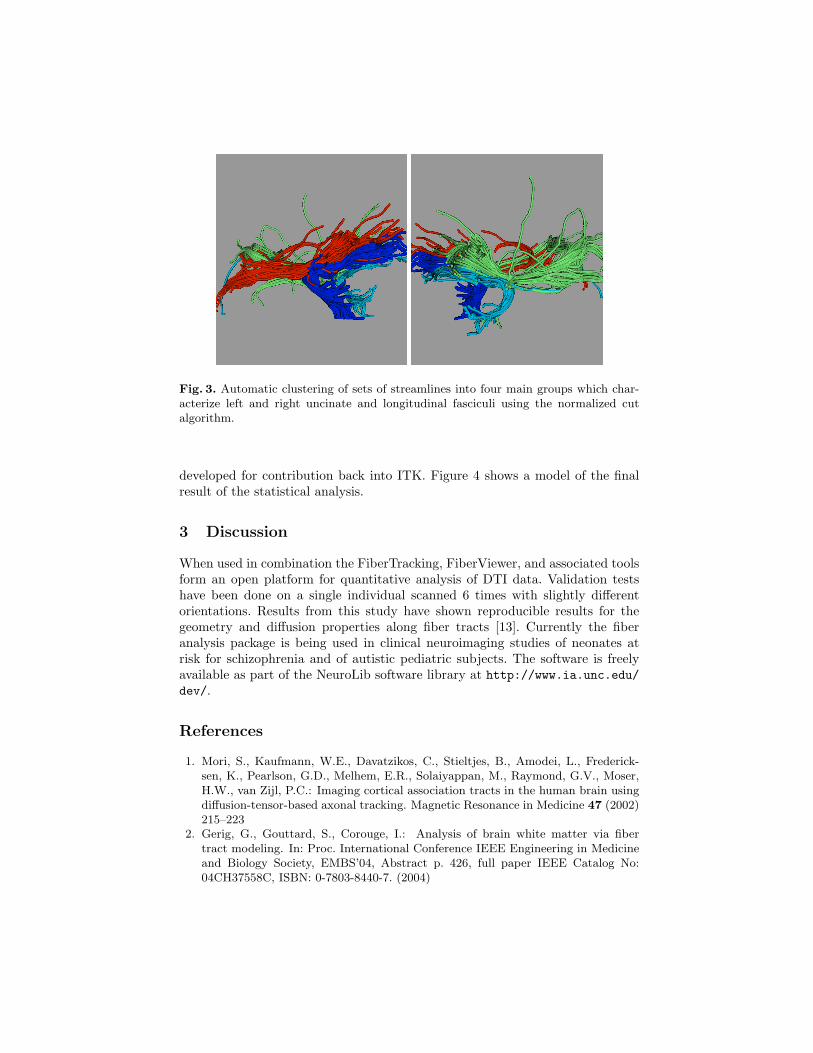
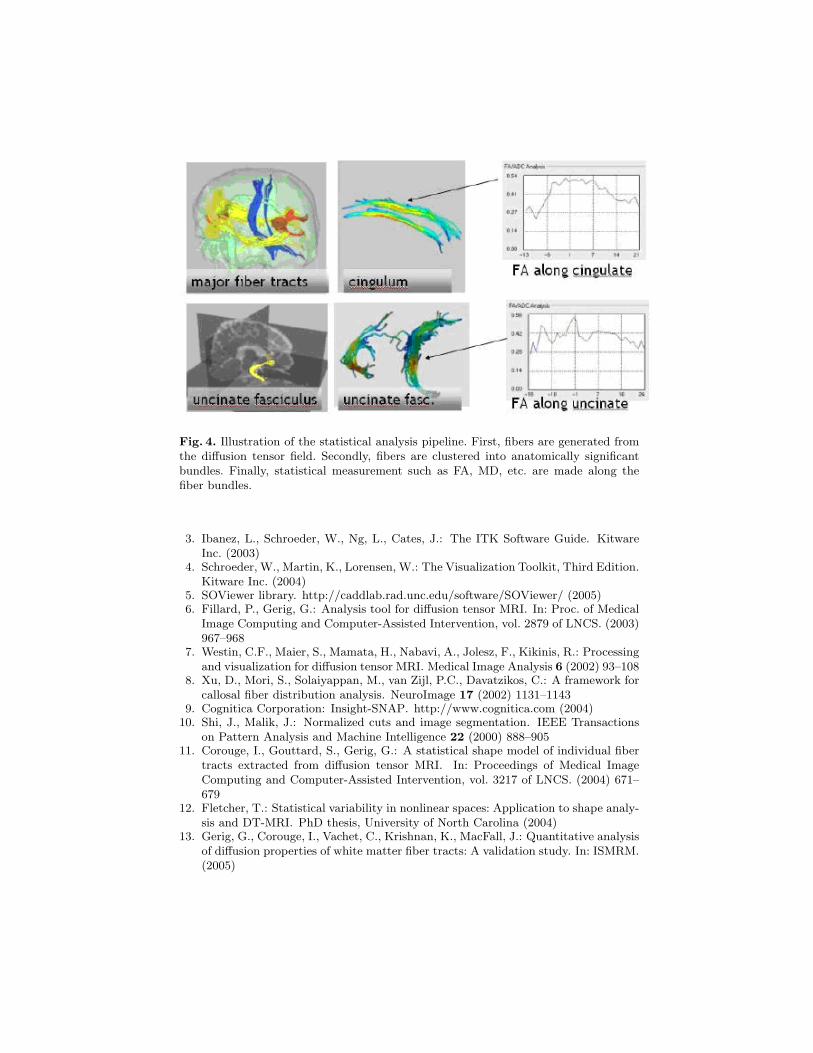
developed for contribution back into ITK. Figure 4 shows a model of the finalresult of the statistical analysis.
3 Discussion
When used in combination the FiberTracking, FiberViewer, and associated toolsform an open platform for quantitative analysis of DTI data. Validation testshave been done on a single individual scanned 6 times with slightly differentorientations. Results from this study have shown reproducible results for thegeometry and diffusion properties along fiber tracts [13]. Currently the fiberanalysis package is being used in clinical neuroimaging studies of neonates atrisk for schizophrenia and of autistic pediatric subjects. The software is freelyavailable as part of the NeuroLib software library at http://www.ia.unc.edu/dev/.
References
1. Mori, S., Kaufmann, W.E., Davatzikos, C., Stieltjes, B., Amodei, L., Frederick-sen, K., Pearlson, G.D., Melhem, E.R., Solaiyappan, M., Raymond, G.V., Moser,H.W., van Zijl, P.C.: Imaging cortical association tracts in the human brain usingdiffusion-tensor-based axonal tracking. Magnetic Resonance in Medicine 47 (2002)215–223
2. Gerig, G., Gouttard, S., Corouge, I.: Analysis of brain white matter via fibertract modeling. In: Proc. International Conference IEEE Engineering in Medicineand Biology Society, EMBS’04, Abstract p. 426, full paper IEEE Catalog No:04CH37558C, ISBN: 0-7803-8440-7. (2004)
Fig. 4. Illustration of the statistical analysis pipeline. First, fibers are generated fromthe diffusion tensor field. Secondly, fibers are clustered into anatomically significantbundles. Finally, statistical measurement such as FA, MD, etc. are made along thefiber bundles.
3. Ibanez, L., Schroeder, W., Ng, L., Cates, J.: The ITK Software Guide. KitwareInc. (2003)
4. Schroeder, W., Martin, K., Lorensen, W.: The Visualization Toolkit, Third Edition.Kitware Inc. (2004)
5. SOViewer library. http://caddlab.rad.unc.edu/software/SOViewer/ (2005)6. Fillard, P., Gerig, G.: Analysis tool for diffusion tensor MRI. In: Proc. of Medical
Image Computing and Computer-Assisted Intervention, vol. 2879 of LNCS. (2003)967–968
7. Westin, C.F., Maier, S., Mamata, H., Nabavi, A., Jolesz, F., Kikinis, R.: Processingand visualization for diffusion tensor MRI. Medical Image Analysis 6 (2002) 93–108
8. Xu, D., Mori, S., Solaiyappan, M., van Zijl, P.C., Davatzikos, C.: A framework forcallosal fiber distribution analysis. NeuroImage 17 (2002) 1131–1143
on Pattern Analysis and Machine Intelligence 22 (2000) 888–90511. Corouge, I., Gouttard, S., Gerig, G.: A statistical shape model of individual fiber
tracts extracted from diffusion tensor MRI. In: Proceedings of Medical ImageComputing and Computer-Assisted Intervention, vol. 3217 of LNCS. (2004) 671–679
12. Fletcher, T.: Statistical variability in nonlinear spaces: Application to shape analy-sis and DT-MRI. PhD thesis, University of North Carolina (2004)
13. Gerig, G., Corouge, I., Vachet, C., Krishnan, K., MacFall, J.: Quantitative analysisof diffusion properties of white matter fiber tracts: A validation study. In: ISMRM.(2005)