A Quantitative Investigation and Inventory of the Vegetation and Soils of Coastal Lowland Wetlands in Hawai‘i A THESIS SUBMITTED TO THE GRADUATE DIVISION OF THE UNIVERSITY OF HAWAI‘I IN PARTIAL FULFILLMENT OF THE REQUIREMENTS FOR THE DEGREE OF MASTER OF SCIENCE IN NATURAL RESOURCES AND ENVIRONMENTAL MANAGEMENT MAY 2008 By Meris Bantilan-Smith Thesis Committee: Greg Bruland, Chairperson Michael Robotham Wendy Wiltse
Transcript
A Quantitative Investigation and Inventory of the
Vegetation and Soils of Coastal Lowland Wetlands in
Hawai‘i
A THESIS SUBMITTED TO THE GRADUATE DIVISION OF THE UNIVERSITY OF HAWAI‘I IN PARTIAL FULFILLMENT OF THE
REQUIREMENTS FOR THE DEGREE OF
MASTER OF SCIENCE
IN
NATURAL RESOURCES AND ENVIRONMENTAL MANAGEMENT
MAY 2008
By Meris Bantilan-Smith
Thesis Committee:
Greg Bruland, Chairperson
Michael Robotham Wendy Wiltse
i
We certify that we have read this thesis and that, in our opinion, it is satisfactory in scope
and quality as a thesis for the degree of Master of Science in Natural Resources and
Environmental Management.
THESIS COMMITTEE
_____________________________________
Chairperson
_____________________________________
_____________________________________
ii
Acknowledgements I would like to express my sincere appreciation to my advisor, Dr. Greg Bruland,
for inspiring me to pursue a career in wetland ecology and for his direction and guidance
throughout this project. I also thank Dr. Michael Robotham and Dr. Wendy Wiltse for
their service as committee members, and their valuable input on the content of this thesis.
A special thanks to Dr. Richard MacKenzie, Adonia Henry, and Christina Ryder
for their friendship and role in implementing this project. Thanks to Kim Peyton,
Arleone Dibben-Young, Dr. Scott Fischer, Dr. Diane Drigot, Mike Silbernagle, Sylvia
Pelizza, Glynnis Nakai, David Smith, Dave Burney, Mike Mitchell, Fern Duvall, David
Ivy, Jamie Redunzle, Thomas Kaiakapu, Sally Beavers, Greg Koob, Steve Berkson, Gary
Blaich, Hugo and Cindy deVries, and Propane Pete for help with site selection and
access.
I am grateful to Napua Harbottle and the Bishop Museum Herbarium staff for
plant identification assistance.
I would like to recognize the U.S. Environmental Protection Agency (EPA)
Region IX Wetland Program Development Grant program for funding this project.
Although the research described in this thesis has been funded by the U.S. Environmental
Protection Agency, it has not been subjected to any EPA review and therefore does not
necessarily reflect the views of the Agency, and no official endorsement should be
inferred.
Finally, I would like to thank my family especially my mom and my dad for their
support and unconditional love.
iii
Abstract
Due to the loss and degradation of coastal lowland wetlands throughout the
Hawaiian Islands, created (CW) and restored (RW) wetland projects are becoming more
common. A comprehensive, quantitative assessment of the conditions of these wetlands
has yet to occur, and it has not been resolved whether CWs and RWs provide the same
ecological functions as natural wetlands (NWs). This study was conducted to generate
baseline data and to examine differences in the vegetation characteristics and soil
properties among CWs, RWs, and NWs in Hawai‘i. Forty coastal wetlands sites across
the five major Hawaiian Islands (Kauai, Oahu, Moloka‘i, Maui, and Hawai‘i) were
intensively sampled for vegetation and soils.
Wetland status (i.e. CW versus RW versus NW) accounted for a significant
proportion of the variation in vegetative characteristics and soil properties among sites,
while position along the hydrologic gradient accounted for a significant proportion of the
variation in vegetative characteristics and soil properties within sites. Specifically, NWs
had the greatest number of species observed with 67, of which 20 were unique to NWs.
By comparison, forty-two species were observed in RWs and 30 in CWs. Furthermore,
only 17 (17%) of the 101 plant species identified across the 40 wetland sites were native,
indicating that coastal lowland wetlands in Hawai‘i are highly impacted by exotic species
regardless of their status. Differences in soil properties between wetland status were
quantified with a general linear model (GLM) and Principle Components Analysis
(PCA). Soils in NWs had higher soil organic matter (SOM), total nitrogen (TN), and clay
content, and lower bulk density (BD) and pH. Soils in RWs were characterized by high
iv
BD and silt and clay content, and low SOM, TN, and total carbon (TC); and soils of CWs
were characterized by high BD and sand content, and low SOM and TN. These
differences in vegetative and edaphic characteristics suggested that coastal lowland RWs
and CWs in Hawai‘i currently do not exhibit the same functions as NWs. Management
strategies including seeding newly restored and created sites with native plant species and
applying organic soil amendments should be incorporated into wetland restoration and
creation practices in Hawaii in order to facilitate the colonization and proliferation of
native vegetation and development of soil properties of future RWs and CWs.
v
Table of Contents Acknowledgements ............................................................................................................. ii Abstract .............................................................................................................................. iii List of Tables ..................................................................................................................... vi List of Figures .................................................................................................................. viii List of Abbreviations .......................................................................................................... x Chapter 1. Introduction ....................................................................................................... 1
Introduction ..................................................................................................................... 1 Wetland Functions and Values ....................................................................................... 4 Wetland Policy and Mitigation ....................................................................................... 6 Reference Wetlands and Mitigation Success .................................................................. 7 Objectives and Hypotheses ........................................................................................... 12
Chapter 4. Conclusions ..................................................................................................... 68 Integrated Rankings of Semi-Natural, Restored, and Created Wetland Sites in Hawai‘i....................................................................................................................................... 74 Summary ....................................................................................................................... 79
Appendix A ....................................................................................................................... 81 Appendix B. ...................................................................................................................... 84 Appendix C. .................................................................................................................... 122 Literature Cited ............................................................................................................... 132
vi
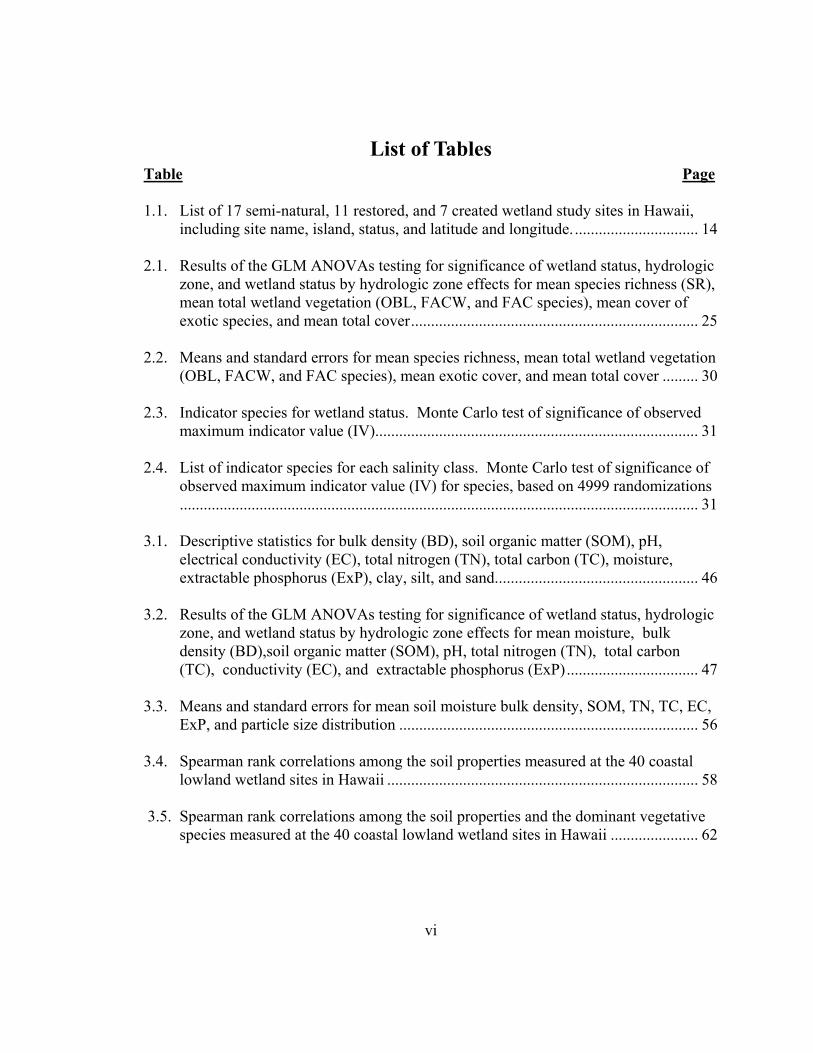
List of Tables Table Page 1.1. List of 17 semi-natural, 11 restored, and 7 created wetland study sites in Hawaii,
including site name, island, status, and latitude and longitude. ............................... 14 2.1. Results of the GLM ANOVAs testing for significance of wetland status, hydrologic
zone, and wetland status by hydrologic zone effects for mean species richness (SR), mean total wetland vegetation (OBL, FACW, and FAC species), mean cover of exotic species, and mean total cover ........................................................................ 25
2.2. Means and standard errors for mean species richness, mean total wetland vegetation
(OBL, FACW, and FAC species), mean exotic cover, and mean total cover ......... 30 2.3. Indicator species for wetland status. Monte Carlo test of significance of observed
maximum indicator value (IV)................................................................................. 31 2.4. List of indicator species for each salinity class. Monte Carlo test of significance of
observed maximum indicator value (IV) for species, based on 4999 randomizations.................................................................................................................................. 31
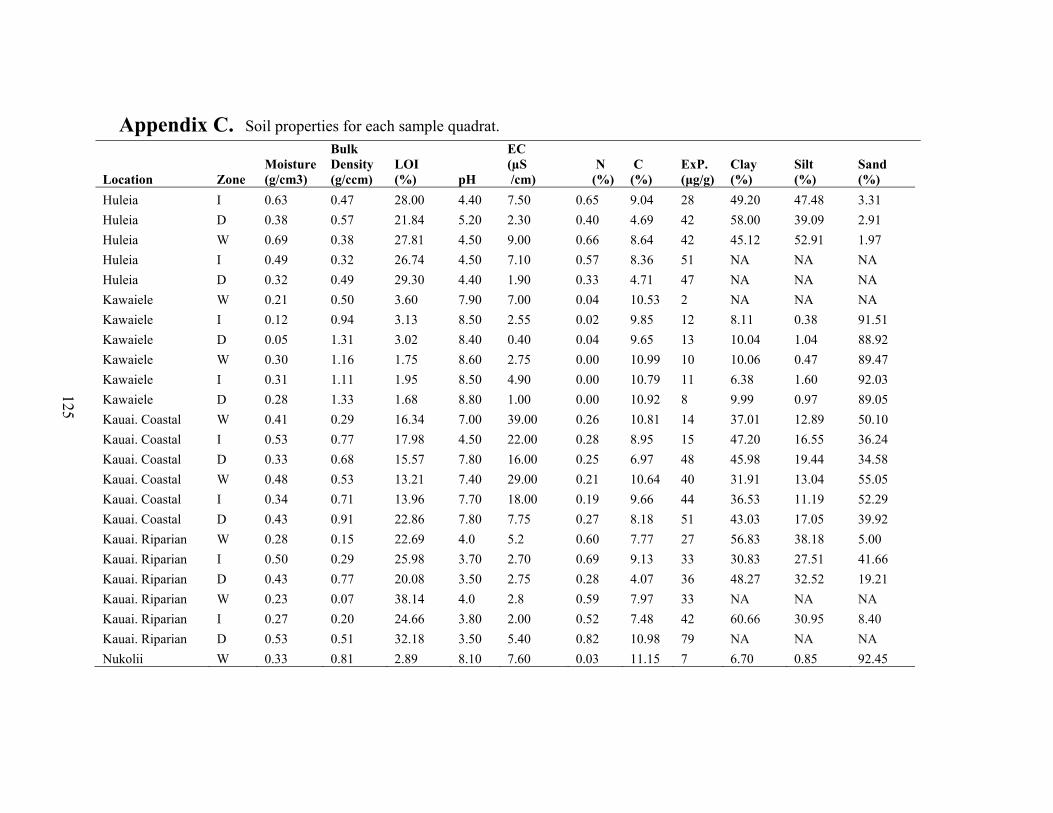
3.1. Descriptive statistics for bulk density (BD), soil organic matter (SOM), pH,
electrical conductivity (EC), total nitrogen (TN), total carbon (TC), moisture, extractable phosphorus (ExP), clay, silt, and sand. .................................................. 46
3.2. Results of the GLM ANOVAs testing for significance of wetland status, hydrologic
zone, and wetland status by hydrologic zone effects for mean moisture, bulk density (BD),soil organic matter (SOM), pH, total nitrogen (TN), total carbon (TC), conductivity (EC), and extractable phosphorus (ExP) ................................. 47
3.3. Means and standard errors for mean soil moisture bulk density, SOM, TN, TC, EC,
ExP, and particle size distribution ........................................................................... 56 3.4. Spearman rank correlations among the soil properties measured at the 40 coastal
lowland wetland sites in Hawaii .............................................................................. 58 3.5. Spearman rank correlations among the soil properties and the dominant vegetative
species measured at the 40 coastal lowland wetland sites in Hawaii ...................... 62
vii
4.1. Fishpond site descriptive statistics for bulk density (BD), soil organic matter (SOM), pH, electrical conductivity (EC), total nitrogen (TN), total carbon (TC), moisture, extractable phosphorus (ExP), clay, silt, sand, and vegetative characteristics. .......................................................................................................... 73
4.2. Actual means of soil organic matter (SOM %) and native vegetative cover (%), as
well as site assessment rank for natural, restored, and created coastal lowland wetlands in Hawai‘i. ................................................................................................ 75
4.3. Natural, restored, and created wetland site ranks. Rank 1 weighs the native cover
and SOM equally; Rank 2 gives a 50% weight to native cover, 40% weight to SOM, and 10% weight to site assessment; and Rank 3 equally weights native cover, SOM, and site assessment .................................................................................................. 76
viii
List of Figures Figure Page 1.1. Study site locations for the 17 semi-natural, 11 restored, and 7 created wetlands in
Hawaii. ..................................................................................................................... 11 2.1. Sampling Design for riparian and isolated wetland sites. ........................................ 21 2.2. Effect of position along the hydrologic gradient and wetland status on species
richness .................................................................................................................... 26 2.3. Effect of position along the hydrologic gradient and wetland status on total cover . 26 2.4. Effect of position along the hydrologic gradient and wetland status on exotic
species cover (%). .................................................................................................... 28 2.5. Effect of position along the hydrologic gradient and wetland status on total wetland
vegetation cover (OBL, FACW, FAC species) ....................................................... 28 2.6. Principle components analysis (PCA) of the species composition of coastal lowland
Hawaiian wetlands. Vectors represent the magnitude of correlation with axis 1 and 2 (i), and 1 and 3 (ii).. .............................................................................................. 33
3.1. Effect of position along the hydrologic gradient and wetland status on bulk density.
.................................................................................................................................. 49 3.2. Effect of position along the hydrologic gradient and wetland status on soil organic
matter (SOM) ........................................................................................................... 49 3.3. Effect of position along the hydrologic gradient and wetland status on total nitrogen
(TN).......................................................................................................................... 52 3.4. Effect of position along the hydrologic gradient and wetland status on total carbon
(TC) .......................................................................................................................... 52 3.5. Effect of position along the hydrologic gradient and wetland status on soil pH ..... 53 3.6. Effect of position along the hydrologic gradient and wetland status on clay content.
.................................................................................................................................. 53 3.7. Effect of position along the hydrologic gradient and wetland status on silt content.
3.8. Effect of position along the hydrologic gradient and wetland status on sand content. .................................................................................................................................. 54
3.9. Effect of position along the hydrologic gradient and wetland status on soil moisture.
.................................................................................................................................. 55 3.10. Effect of position along the hydrologic gradient and wetland status on soil
conductivity (EC) ................................................................................................... 55 3.11. Principle Components Analysis (PCA) of the soil properties of coastal lowland
Hawaiian wetlands. Includes all soil cores, and excludes the particle size distribution variables.. ............................................................................................ 60
3.12. Principle components analysis (PCA) of the soil properties of coastal lowland
Hawaiian wetlands. Includes sites with mineral soils only (SOM < 30%) .......... 61
x
List of Abbreviations
ACOE Army Corps of Engineers ADSC Agricultural Diagnostic Service Center ANOVA Analysis of Variance BD Bulk Density CWs Created Wetlands EC Electrical Conductivity EPA Environmental Protection Agency ExP Extractable Phosphorus GLM General Linear Model NRCS National Resources Conservation Service NWs Natural Wetlands PCA Principle Components Analysis PSD Particle Size Distribution RWs Restored Wetlands SOM Soil Organic Matter TC Total Carbon TN Total Nitrogen UHM University of Hawai‘i, Mānoa
1
Chapter 1. Introduction
Introduction Wetlands are characterized by saturated and/or inundated soil conditions, which
are physically, chemically, and biologically distinct from adjacent upland soils, and
support hydrophytic (water tolerant) vegetation (NRC 1995, Mitsch and Gosselink 2000).
They are important features in the landscape that provide numerous functions and values
for both people and wildlife, including water quality improvement, flood attenuation,
endangered species habitat, and provide a means of economic livelihood for millions of
people (Richardson 1994). For these reasons, the United States has a “no-net-loss”
policy for wetlands (Mitsch and Gosselink 2000). Compensatory wetland mitigation
plays a central role in this policy and has increased the interest in and practice of wetland
creation and restoration by state and federal agencies (Brown and Batzer 2001)
consulting firms, and private landowners.
Wetland mitigation is defined as the "restoration, creation, or enhancement of
wetlands to compensate for permitted wetland losses" (EPA 2007). Wetland mitigation
may compensate for losses caused by urban and industrial development, agriculture,
forestry, road construction, and military activities. When damage or destruction of a
wetland is unavoidable, mitigation is required in the form of wetland creation protection
or restoration (Race and Fonseca 1996, Zedler 1996). Wetland creation is defined as the
conversion or construction of a site that originally was not a wetland to a site that meets
the three parameter test (contains hydric soils, hydrophytic vegetation, and wetland
2
hydrology), whereas wetland restoration is the return of a site that has been degraded by
human activities (i.e. drainage, fill, agriculture) to its pre-existing wetland condition
(Brinson and Rheinhardt 1996).
Currently, numerous wetland restoration and creation projects are being
undertaken across the state of Hawai‘i by an array of governmental and non-
governmental organizations such as the U.S. Fish and Wildlife Service (USFWS),
Natural Resources Conservation Service (NRCS), Department of Transportation (DOT),
Hawai‘i Department of Land and Natural Resources (DLNR), Ducks Unlimited (DU),
and private land owners. The ability of created (CWs) and restored (RWs) wetlands to
functionally replace natural wetlands (NWs) has become a topic of considerable debate
(Zedler 1996, Zedler and Callaway 1999, Kentula 2000).
Studies comparing CWs and RWs to NWs have examined differences in
vegetation communities (Heaven et al. 2003, Spieles 2005), physical and chemical soil
properties (Bishel-Machung et al. 1996, Craft 2001, Campbell et al. 2002, Bruland et al.
2003, Bruland and Richardson 2005a, Bruland and Richardson 2006), hydrology
(Zampella and Laidig 2003), and biological communities (Hannaford 1998, King et al.
2000).
The soil physical and chemical properties of CWs and RWs have almost always
been shown to differ from NWs (Bruland and Richardson 2006). There are several
primary reasons that contribute to these differences. First, the creation or restoration of a
wetland generally results in disturbance of soils during the construction project,
especially the excavation and removal of the topsoil (Shaffer and Ernst 1999). The
3
removal of topsoil is an important factor accounting for low concentrations of soil
organic matter (SOM) in CWs and RWs. Differences in SOM have been shown to
significantly affect many other soil properties, such as total-percent nitrogen, bulk
density, and pH (Bishel-Machung et al. 1996). Second, the use of heavy machinery in
project construction results in the compaction of soils, further increasing the bulk
densities in CWs and RWs. Finally, differences in hydrology between CWs RWs, and
NWs, have also been shown to affect soil properties. For example, during flooding ,
anaerobic conditions slow decomposition rates and allow for organic matter to
accumulate in the soil, decreasing the bulk density and pH as well as increasing porosity
and N (Craft et al. 2002).
In contrast to NWs, the vegetation of RWs and CWs often differs in species
richness, total cover, and species composition. Differences in vegetative characteristics
are typically attributed to the young age or the lack of maturity of the mitigation sites,
differences in landscape position, or differences in hydrology (Heaven et al. 2003). The
creation or restoration of wetlands usually involves the use of heavy machinery to scrape
the surface and remove the topsoil (Bruland and Richardson 2005b). In doing so, not
only is the topsoil removed but so is the vegetation and seed bank. A Newly created or
restored sites are also rather unstable, and as such they tend to support a suite of species
that are adapted to disturbed environments (Balcombe et al. 2005). Differences in total
cover as well as in species composition have also been attributed to differences in
maturity, such that with time total cover and composition of CWs and RWs approaches
that of NWs (Reinartz and Warne 1993, Balcombe et al. 2005).
4
The landscape position of a mitigation site has also been found to have profound
effects on the vegetative characteristics of mitigation wetlands (Jarman et al. 1991).
Many mitigation wetlands are established in uplands, with few nearby wetland seed
sources (Campbell et al. 2002). Reinartz and Warne (1993) observed correlations with
distance to seed sources, and found that as distance to the nearest wetland seed source
increased, species richness of mitigation sites decreased.
No comprehensive investigation of both the vegetation and soil characteristics of
wetlands in the state of Hawai‘i has previously been conducted. In order to provide base-
line data about coastal lowland wetlands, soil properties and vegetative community
composition will be discussed in relation to semi-natural “reference” wetlands and
created and restored wetlands in Hawai‘i. The results of this study will further our
knowledge of Hawaiian wetland ecosystems by providing data, results, and
recommendations that are applicable to wetland sites across the state of Hawai‘i.
Ultimately, the data collected from semi-natural wetlands will also help us to establish
criteria that can be used to assess restored and created wetlands and make
recommendations on how to improve wetland mitigation activities in Hawai‘i.
Wetland Functions and Values Wetlands are a diverse natural resource, which provide many useful functions and
values for society. The Natural Resource Council (1995) defines wetland functions as
“processes and manifestations of processes that occur within wetlands.” Most functions
fall into three broad categories: hydrologic, biogeochemical, and habitat and food web
5
maintenance (NRC 1995, Brinson and Rheinhardt 1996). Costanza et al. (1997)
estimated that wetlands provide a total of $14,785 (1994 US$) per hectare in annual
ecosystem services. These ecosystem services include the maintenance of water quality
such as promoting denitrification, trapping sediment, and phosphorus sorption;
minimizing flood surges by storing storm water, among others (Environmental Protection
Agency 2001). Wetlands also hold aesthetic value to millions of people, and provide a
variety of recreational opportunities such as fishing and bird watching.
Wetlands are also extremely important to wildlife, serving as critical habitat for
many endemic waterfowl, macroinvertebrates, and algae. More than one third of the
threatened and endangered species in the United States’ live exclusively in wetlands, and
approximately half use wetlands at some point in their lives (EPA 1995). Throughout the
Hawaiian Islands, wetlands provide important habitat for seven native resident
waterbirds, six of which are listed as endangered species. Migratory waterfowl and
shorebirds also use Hawaiian wetlands as critical stopover and wintering habitat.
Approximately 30 species of migratory ducks and geese as well as 30 species of
migratory shorebirds have been recorded in Hawaiian wetlands (Erickson and Puttock
2006, DU 2007).
The U.S. Fish and Wildlife Service, National Wetlands Inventory estimates that
over 50% of U.S. wetlands have been lost since the 1780’s. The state of Hawai‘i has lost
approximately 7,000 acres which amounts to a 12-percent loss of wetlands statewide
(Dahl 1990). Kosaka (1990) analyzed wetlands below 305 m (1000 ft) elevation and
estimated a 3 % loss of coastal wetlands between the 1780s and the 1980s. According to
6
Dahl (1990), Hawai‘i currently has 9,095 hectares of lowland wetlands and 14,701
hectares of upper/mid-elevation wetlands remaining.
Wetland Policy and Mitigation Through most of the twentieth century wetlands have been viewed as either
wastelands or as areas providing little benefits beyond support of waterfowl populations
(Kusler and Kentula 1990). This negative perception of wetlands was encouraged by
policies and incentives of the United States federal government which encouraged or
subsidized the draining or filling of wetlands. Due to these policies, the total wetland
area in the United States was reduced to half of the original total by the mid-1980s
(Kusler and Kentula 1990, NRC 1995, Dahl 2006). In recent years the negative trend of
wetland loss has shifted, and as of 2004, the contiguous United States has experienced an
annual net gain of wetland area (Dahl 2006).
The shift in trends of wetland area in the U.S. are due to changes in nation-wide
wetland policy as well as increased scientific knowledge of wetland values over the past
35 years. The origin of this shift can be traced to the Federal Water Pollution and Control
Act of 1972 (later retitled the Clean Water Act), which identified a goal to restore and
maintain the biological, physical, and chemical integrity of the nation’s waters. This act
was followed by the Coastal Barrier Resource Act of 1972, the 1985 Food Security Act,
and the 1986 Tax Reform Act (Mitsch and Gosselink 2000). Wetlands are currently
regulated through Section 404 of the Clean Water Act, with regulatory duties being
7
assumed by the US Army Corps of Engineers (USACE) and the US Environmental
Protection Agency (EPA) (Cole and Shafer 2002).
Another significant initiative in developing U.S. wetland policy was undertaken in
1987, when the National Wetland Policy Forum convened and set a significant goal for
the nations remaining wetlands, “no net loss.” The “no net loss” policy seeks to replace
lost wetland habitat with new habitat by restoring and/ or constructing wetlands. This
policy introduced wetland mitigation as the leading tool in combating wetland loss, and is
now the cornerstone of wetland conservation in the U.S. (Zedler 1996, Mitsch and
Gosselink 2000).
Reference Wetlands and Mitigation Success Although the increased pace of wetland restoration and construction is
encouraging, a key question still remains, “do the created and restored wetland sites
provide the same ecological and environmental functions as the natural wetlands they
were created to replace?” The ability of CWs and RWs to functionally replace natural
wetlands has become a topic of considerable debate (Mitsch and Wilson 1996, Zedler and
Callaway 1999, Kentula 2000).
Within compensatory mitigation there are three recognized levels of success:
compliance, landscape, and functional success. Compliance success is determined by
evaluating permit compliance, such as whether the mitigation site meets the acreage and
the percent vegetation cover specified in the permit. Landscape success is a measurement
of how restoration has contributed to the ecological integrity of the region or watershed,
8
whereas functional success is determined by evaluating whether the ecological attributes
of a system have been restored (Quammen 1986, Kentula 2000). In a memorandum of
agreement in 1990 the US EPA and USACE agreed that mitigation was to focus on
functional replacement in addition to the replacement of area or structure (Hoeltje and
Cole 2007).
Several approaches have been used by researchers to assess mitigation success.
The Wetland Evaluation Technique (WET) assigns values to specific functions of
individual wetlands such as groundwater recharge and discharge, flood-flow alteration,
sediment stabilization and retention, nutrient removal/ transformation, wildlife and
aquatic diversity, production export, recreation, and uniqueness/ heritage (Adamus 1983).
The Environmental Monitoring and Assessment Program-Wetlands (EMAP) was
developed by the Environmental Protection Agency. This technique identifies indicators
of wetland condition which are used to determine the ecological functions of a group of
wetlands by comparing the function of a statistical sample of wetlands to reference
wetlands in a region (Novitzki et al. 1997). The hydrogeomorphic (HGM) method
developed by Brinson (1993) represents a combination of the WET and EMAP
approaches. The HGM method classifies and separates wetlands based on their
hydrodynamics and geomorphology, and then analyzes the functional characteristics of
wetlands within a single hydrogeomorphic class at both reference sites and sites across a
disturbance gradient (Brinson 1993, EPA 1997).
Today many researchers use reference wetlands to assess mitigation success
(Confer and Niering 1992, Bishel-Machung et al. 1996, Moore et al. 1999, Stolt et al.
9
2000, Campbell et al. 2002, Bruland et al. 2003, Balcombe et al. 2005). Reference
wetlands are naturally-occurring, relatively-undisturbed systems that contain hydric soils,
support some if not all native, hydrophytic vegetation for some part of the year, and have
water tables near the surface for a considerable duration of the growing season (Brinson
and Rheinhardt 1996, Kentula 2000). Semi-natural wetlands (NWs) were used as
reference wetlands because there are few, if any, true “pristine, undisturbed” coastal
lowland wetlands left in Hawai‘i. Semi-natural wetlands serve as a standard for
comparison when evaluating the success of mitigation projects. Generally the ecological
attributes of a similar or nearby wetland are most commonly used. Single site studies and
comparisons of pairs of sites have been used to effectively evaluate the status of
individual projects; however the results cannot be extrapolated beyond the specific study
sites. Kentula (2000) recommends comparing samples of populations of NWs, RWs, and
CWs within an area in order to capture an entire range of conditions and factors
important to the function of wetlands.
Many of the functions discussed in previous sections, such as traps for sediments,
sinks for non-point source pollution, and denitrification of ground water are difficult and
costly to measure directly. Thus the use of reference wetlands is based on the underlying
assumptions that NWs represent high levels of functioning and that wetlands sharing
similar soil properties, hydrology characteristics, vegetation community, or
environmental conditions, function in a similar or equivalent manner (Brinson and
Rheinhardt 1996, Stolt et al. 2000, Zampella and Laidig 2003). Numerous variables have
been used when evaluating the success of CWs and RWs, with measurements of
10
vegetation being most common (Galatowitsch and van der Valk 1996, Mitsch and Wilson
1996, Kentula 2000), followed by soils (Stolt et al. 2000, Craft 2001, Bruland and
Richardson 2004), hydrology (Ashworth 1997), and macrofauna (Brown and Batzer
2001). In this study, a quantitative investigation and inventory of coastal lowland
Hawaiian wetlands, I will assess vegetation community composition and soil chemical
and physical properties of NWs, RWs, and CWs in Hawaii.
Vegetative community composition and soil characteristics of 40 coastal lowland
wetland sites located across the 5 major Hawaiian Islands were sampled between March
and April 2007 (Figure 1.1). The sites consisted of 17 NWs, 11 RWs, 7 CWs, 4 former
fishponds, and 1 site under a flooded agriculture (taro) regime. The sites sampled met
three criteria: 1) they occurred across the 5 major Hawaiian Islands (Hawai‘i, Kauai,
Maui, Moloka‘i, and Oahu); 2) they were located between 0 – 300 meters in elevation;
and 3) they were representative of CWs, RWs, and NWs found within the state and were
available for sampling during the study period. A summary of the site characteristics is
provided in Table 1.1.
Although there are a wide variety of wetlands present throughout the state of
Hawai‘i, the focus of this project was on coastal lowland wetlands. The decision to focus
on one specific type of wetland stems from several factors. First, the objectives of the
project called for the comparison of wetland status (CWs vs. RWs vs. NWs). It was
assumed that wetlands that are of the same type, coastal lowland, will have similar
11
Figure 1.1. Study site locations for the 17 semi-natural, 11 restored, and 7 created wetlands in Hawai‘i.
12
physical and chemical properties or characteristics. Thus, the unexplained variability/
variance between wetlands will be minimized and the observed differences attributed to
their differences in status. Second, coastal wetlands play an important role in
maintaining water-quality in near-shore habitats. Theses wetlands are particularly
important to coral reefs because they protect reefs from turbidity, sediment, and pulses of
fresh water during heavy rains. The protection of coral reefs is important to numerous
commercial and recreational fisheries as well as tourism in Hawai‘i. Both recreational
and commercial fishing is important to Hawai‘i’s economy, which contribute $48 and
$63 million respectively (Stedman and Hanson 2007). Lastly, the accelerating
urbanization in coastal environments has resulted in greater pressure on these ecosystems
and the increased use of wetland restoration and construction as a tool for replacing NWs
(Craft et al. 1999).
Objectives and Hypotheses The overall objective of this study was to document the vegetative and edaphic
attributes of created, restored, and semi-natural coastal lowland Hawaiian wetlands. Site
characteristics were used to calculate statistical differences among wetlands of different
status (created vs. restored vs. semi-natural) and across hydrologic gradients within sites.
Both chapters of original research, the first which deals with wetland vegetation and the
second which deals with wetland soils, have their own specific objectives. Details
regarding the scientific background behind these objectives and hypotheses will be
13
presented in the introduction to the individual chapters. The following is an outline of the
thesis chapters, objectives, and hypotheses:
Chapter 2: Wetland Vegetation
Objective 2-1: Compare vegetative community composition of CW, RW, and NWs.
Objective 2-2: To examine differences in vegetation across a hydrologic (wetness)
gradient within sites.
Hypothesis 2-1a: Vegetative community composition is different in CW/RW and NWs.
Hypothesis 2-2a: There are differences in vegetative community composition across the
hydrologic gradients present within the sites.
Chapter 3: Wetland Soils
Objective 3-1: To document soil properties such as bulk density, soil moisture content,
organic matter content, pH, extractable P, and total N and C in CW, RW, and NWs.
Objective 3-2: To compare soil properties of CW/NW to those of NWs.
Objective 3-3: To examine differences in soil properties across hydrologic (wetness)
gradient in CW/ RW and NWs.
Hypothesis 3-1a: Soil properties are different in CW/ RWs than in NWs.
Hypothesis 3-2a: There are differences in soil properties across the hydrologic gradient.
The concluding chapter will synthesize the individual objectives and hypotheses
to provide an overall assessment of the status of CWs, RWs, and NWs across the
Hawaiian Islands. It will also provide a ranking of CW, RW, and RW sites based on
vegetative characteristics, soil properties, and sites visits. Finally, recommendations on
how to improve wetland creation and restoration projects in Hawai‘i will be presented
14
Table 1.1. List of 17 semi-natural, 11 restored, and 7 created wetland study sites in Hawai‘i, including site name, island, status, and latitude and longitude.
Site Name Island Status Latitude Longitude Fed/State/ Private Water Source Bellows Oahu Semi-Natural 21.36368 -157.712 Federal Surface water Coconut Grove Oahu Semi-Natural 21.69591 -157.9682 Federal Groundwater Honoapu Hawaii Semi-Natural 19.08697 -155.5483 Private Surface water Kamilo Point 6 Hawaii Semi-Natural 18.9743 -155.6004 State Groundwater Kamilo Point 7 Hawaii Semi-Natural 18.97347 -155.60130 State Groundwater Kanaha Maui Semi-Natural 20.8889 -156.4569 State Surface water Kauaihau Riparian Kauai Semi-Natural 22.06493 -159.3308 Private Surface water Kawai Nui Oahu Semi-Natural 21.38363 -157.7616 State Surface water Kealia Maui Semi-Natural 20.79549 -156.476 Federal Groundwater Kilauea Kauai Semi-Natural 22.21847 -159.3878 Private Groundwater Lawai Kai Kauai Semi-Natural 21.89213 -159.5026 Private Surface water Nu‘u Maui Semi-Natural 20.62737 -156.1766 Private Groundwater Paiko Lagoon Oahu Semi-Natural 21.28202 -157.7234 State Surface water Paukukalo Maui Semi-Natural 20.91362 -156.4912 Private Groundwater Punamano Oahu Semi-Natural 21.69889 -157.9708 Federal Groundwater Waimea Oahu Semi-Natural 21.63894 -158.0604 Private Surface water Waipio Hawaii Semi-Natural 20.12094 -155.5988 Private Groundwater Hanalei Kauai Restored 22.20192 -159.471 Federal Groundwater Hamakua Oahu Restored 21.39082 -157.744 State Surface water Huleia Kauai Restored 21.94506 -159.3873 Federal Surface water Kauaihau Coastal Kauai Restored 22.06291 -159.323 Private Surface water
15
Table 1.1. Continued Site Name Island Status Latitude Longitude Fed/State/Private Water Source Ka‘elepulu Oahu Restored 21.37497 -157.7388 Private Surface water Kii Oahu Restored 21.68703 -157.9497 Federal Groundwater Koheo Molokai Restored 21.0844 -157.014 Private Surface water Ohiapilo Molokai Restored 21.10332 -157.05376 State Groundwater Pouhala Oahu Restored 21.3797 -158.006 State Surface water Waiawa Oahu Restored 21.38722 -157.982 Federal Surface water Waihe‘e Maui Restored 20.94133 -156.5102 Private Surface water Kakahaeia Molokai Created 21.06341 -156.9406 Federal Groundwater Kawaiele Kauai Created 22.01058 -159.769 State Groundwater Klipper Pond Oahu Created 21.45151 -157.7484 Federal Groundwater Moloka‘i Sea Farms Molokai Created 21.10474 -157.0862 Private Groundwater Nukolii Kauai Created 22.0138 -159.3387 Private Groundwater Percolation Ditch Oahu Created 21.4369 -157.7495 Federal Surface water Salvage Yard Oahu Created 21.43753 -157.7597 Federal Groundwater Keanai Maui Other 20.85939 -156.1473 Private Surface water Aimakapa Hawaii Fishpond 19.67635 -156.025 Federal Surface water Koloko Hawaii Fishpond 19.68707 -156.0313 Federal Surface water Mohouli Hawaii Fishpond 19.71549 -155.0765 State Surface water Ualapue Molokai Fishpond 21.05984 -156.8329 Private Surface water
16
Chapter 2. Wetland Vegetation
Introduction The saturated conditions found in wetlands during the growing season result in an
environment that favors the establishment and maintenance of hydrophytic vegetation
(Mitsch and Gosselink 1993). Hydrophytic vegetation is defined as:
“the sum total of macrophytic plant life that occurs in areas where the
frequency and duration of inundation or soil saturation produce
permanently saturated soils of sufficient duration to exert a controlling
influence on the plant species present” (Environmental Laboratory, 1987).
Due to characteristics of wetland ecosystems such as anoxia, wide ranges of salinity, and
water fluctuations, plants lacking certain physiological and structural adaptations are not
able to persist in wetland environments. This limiting effect has led to the use of
vegetation in the identification and delineation of wetland systems (Tiner 1999), such
that certain plant species and communities are characteristic of wetlands. The NRCS
(2007) has estimated that 7,000 species of plants are growing in U.S. wetlands, and the
affinity of these plants to grow in wetlands varies among plant species and regions.
Based on differences in expected frequency of occurrence in wetlands, these species
were designated to one of five “wetland indicator categories.” These include obligate
wetland species (OBL) that occur in wetlands greater than 99% of the time, facultative
wetland species (FACW) that occur in wetlands 67-99% of the time, facultative species
(FAC) that occur in wetlands 34-66% of the time, facultative upland species (FACU)
17
that occur in wetlands 1-33% of the time, and upland plant species (UPL) that occur in
wetlands less than 1% of the time (Tiner 1991, Erickson and Puttock 2006). This
classification system is used to categorize vegetation in sampling units. For example, if
50 percent of the dominant species are comprised of OBL, FACW, and FAC plants, then
the sampling unit meets the criterion for wetland vegetation as identified by the U.S.
ACOE (Environmental Laboratory, 1987). Besides their use in wetland identification
and delineation, vegetation has also been used to evaluate the success of mitigation
projects.
Vegetation plays a role in numerous wetland functions including nutrient uptake
and cycling, water quality regulation, flood retention and storm surge delay, and wildlife
habitat (Castelli et al. 2000). Numerous studies have shown that vegetative structure
and composition influence the quantity and quality of plant foods (Brown 1999), the
quantity and type of substrate available for invertebrates (Balcombe et al. 2005), and the
water chemistry (Goslee et al. 1997, Castelli et al. 2000). Due to the role that vegetation
plays in the aforementioned functions, wetland vegetation has also been used as an
indicator of environmental conditions. Herbaceous plants respond rapidly to both
degradation and improvement of wetland health and integrate disturbances at the
hydrologic, biogeochemical, and ecological scales (Ervin et al. 2006). Previous studies
have found significant relationships between water chemistry and soil physical and
chemical properties (pH, conductivity, temperature, or alkalinity) with plant community
composition (Ashworth 1997, Goslee et al. 1997, Hunt et al. 1999, Houlahan et al.
2006).
18
As vegetation is responsive to changes in environmental conditions, this
sensitivity to change can be used to identify or diagnose alterations in functions which are
difficult to directly measure. Because vegetation is relatively easy to sample and is
intricately involved in complex interactions that contribute to function, the composition
of wetland vegetation has become the most consistently measured ecological parameter
when it comes to monitoring the development of mitigation projects (Craft et al. 2002).
In this chapter, I compared vegetative community characteristics, including species
richness, percent cover, percent exotic species cover, and wetland indicator status, among
different types of wetlands (i.e. NWs vs. RWs vs. CWs) and along hydrologic gradients
within wetlands.
It should be noted that CWs and RWs in Hawai‘i are designed and managed for
open space and water which is desirable for waterbird habitat. Thus having a high
percentage of vegetative cover is not appropriate to maximize this function. Conversely,
waterbird habitat does not always favor ecological functions such as water quality
improvement. It is recognized that that there are multiple functions and uses of wetlands
and that these functions may be contradictory to one another. Therefore, for the purpose
of this study vegetation properties are evaluated based on environmental and ecological
functions, rather than for waterbird habitat.
Objectives and Hypotheses The two major objectives of this chapter were as follows: (3-1) To compare
vegetative community composition of CWs, RWs, and NWs; and (3-2) To examine
19
differences in vegetation across hydrologic (wetness) gradients within sites. As
previously noted, vegetation has often been the easiest and most common method used to
monitor the progress of mitigation projects (Wilson and Mitsch 1996). Many studies
have compared species richness, composition, and cover between natural and mitigation
wetlands throughout the conterminous U.S. Some studies have found that species
richness or cover is greater in RWs than NWs (Galatowitsch and van der Valk 1996,
Heaven et al. 2003), whereas other studies have found that NWs have greater species
richness or cover (Brown 1999, Brown and Veneman 2001, Campbell et al. 2002,
Seabloom and van der Valk 2003), or that there is no difference (Confer and Niering
1992, Parikh and Gale 1998). The findings in these studies were not in accordance with
each other, therefore non-directional hypotheses were used in this study. The two main
hypotheses tested were: (3-1a) Vegetative community composition is different in
CW/RW and NWs; and (3-2a) There are differences in vegetative community
composition across the hydrologic gradient.
Methods
Study Sites Forty coastal lowland wetlands across the state of Hawai‘i were sampled (Table
1.1, page 20-21; Figure 1.1, page 16). These sites were located below 300 m in elevation
on the islands of Oahu, Maui, Kauai, Moloka‘i, and Hawai‘i. Of the 40 wetlands studied,
17 sites were NWs, 11 sites were RWs, 7 sites were CWs, 4 sites were former fishponds,
and one site was under a flooded agricultural regime.
20
Vegetation Sampling
Vegetation sampling occurred between March and April of 2007. At each of the
40 wetland sites, four representative transects were identified and then two were
randomly selected for sampling. Transects spanned the major hydrologic gradient
present within each site, beginning at the wetter edge and continuing up to the drier edge
of the site. For riparian and tidal wetlands, transects ran perpendicular to the stream or
tidal creek, while for isolated wetlands transects radiated outward from deepwater zones
in random directions (Figure 2.1). The selected transects were then stratified into three
zones (wet, intermediate, and dry) based on wetness, elevation, and visual changes in
plant community composition. In each zone a single 1-m2 quadrat was randomly placed
along the two transects. The specific location of each quadrat corresponded to the
locations used for the soil core sampling (Chapter 3). This sampling design generated to
a stratified random sample and followed a protocol recommended by the Hawaii Wetland
Field Guide (Erickson and Puttock 2006).
Vegetation sampling consisted of recording species composition and percent
cover. Within each 1-m2 quadrat each unique species was identified in the field by genus
and species using Whistler (1994) and Erickson and Puttock (2006). A species was
recorded if any of their above-ground parts extended into the quadrat, even though they
were be rooted outside the plot. In addition to percent cover of each unique species,
exposed substrate, standing water, and percent cover of litter were recorded by visual
21
Figure 2.1. Sampling design for riparian and isolated wetland sites.
Transect 1
Transect 2
Stre
am /
Tida
l Cre
ek
Hydrologic Gradient
Wet
Inte
rmed
iate
Drie
r
S1 S2 S3
S4 S5 S6
Hydrologic Gradient
Wet
Inte
rmed
iate
Drie
r
a. Riparian or tidal sites
b. Isolated wetland sites
Transect 1
Transect 2
Pond
S1S2
S3
S4S5
S6
22
estimation. At least two investigators generated coverage values independently and then
compared values with one another. If the independently-generated values differed, the
average of the two values was recorded. Voucher specimens were collected when
additional identification was necessary. Upon returning to the University of Hawai‘i,
Mānoa, the voucher specimens were dried and pressed at 60oC for a minimum of 5 days
then delivered to Bishop Museum Herbarium located in Honolulu, Hawai‘i for further
identification.
Data Analysis All sites were included when summarizing the overall vegetative results such as
total number of species observed. Statistical analyses, however, were only conducted on
the sites designated as NWs, RWs, and CWs. Semi-natural wetlands, RWs, and CWs
were compared by calculating mean species richness, percent cover of exotic species,
percent cover of wetland plant species, and total cover for each zone. Native species
status was assigned based on Erickson and Puttock (2006) and Starr and Starr (2007).
Wetland indicator status was assigned based on the National Resource Conservation
Service Plant Database (2007). Species richness was defined as the total number of plant
species present in a quadrat (Kent and Coker 1992), and percent cover of wetland plant
species was defined as the sum of cover from species in a plot with a wetland indicator
status of facultative (FAC), facultative wet (FACW), or obligate (OBL) (Environmental
Laboratory, 1987).
Due to the unbalanced study design (17 NWs, 11 RWs, and 7 CWs) the data were
analyzed using a fixed, two-factor generalized linear model (GLM) procedure in Minitab
23
Statistical Software for Windows Version 15 (Minitab Inc., State College, PA) and SAS
for Windows Version 9.1 (SAS Institute, Cary, NC). The independent factors tested were
wetland status (NW vs. RW vs. CW), hydrologic zone (wet vs. intermediate vs. dry), and
the status by zone interaction. The response variables included mean species richness,
mean exotic cover, mean cover of wetland plant species, and mean total cover.
Additionally, a one-way analysis of variance (ANOVA) was used to evaluate the effect of
island on the same dependent variables in the GLM. Assumptions of normality were
evaluated and Levene’s Test was used for homogeneity of variances. A post-hoc Tukey
test was used in cases of a significant main effect (status, zone, or status x zone). A
significance level of p < 0.05 was used for both the GLM and ANOVA and the post-hoc
Tukey tests.
To examine and identify the similarities and/or differences in vegetative
composition as well as to summarize the vegetative data, a Principle Components
Analysis (PCA) was conducted using the PC-ORD program (McCune and Mefford
1999). PCA is an eigenanalysis ordination technique that produces orthogonal axes,
which captures the highest amount of variation that is present in the data set (Hair et al.
1995, McCune and Grace 2002). The species cover data was placed into a
species*quadrat matrix, then arcsine-square root transformed. In order to rescale the data
to range between 0 and 1, it was then multiplied by 2/π. As recommended by McCune
and Grace (2002), all rare species (species that occurred in fewer than 5% of the sample
units) were removed from the analysis. Additionally, the sites designated as fishponds
and the site under the flooded agriculture regime were removed from the PCA.
24
To assess affinities of species to wetland status and salinity classes an indicator
species analysis (Peterson and McCune 2001) was conducted on the vegetation cover
data using PC-ORD (McCune and Mefford 1999). Indicator species analysis is a
nonparametric technique used to identify species with a high fidelity for a particular
group (King et al. 2004). All positively-identified species were placed in a
species*quadrat matrix and 4,999 permutations were used in the Monte Carlo test of
significance. A significance level of p < 0.05 was used for the Monte Carlo test.
Results A total of 101 plant species were positively identified within 240 quadrats
(Appendix A and B). The number of species observed within the different zones
increased along the hydrological gradient, such that the wet zone had the least amount of
species (35 species) followed by the intermediate zone (57 species), and the dry zone (71
species). Furthermore, NWs had the greatest number of species observed with 67, of
which 20 were unique to NWs. Forty-two species were observed in RWs and 30 in CWs.
Finally, 40 species were found in the 4 fishponds and flooded agriculture site. For all
species sampled, mean species richness was significantly different among wetlands of
different status as well as across the hydrologic gradient (Table 2.1). Species richness
was significantly greater in CWs than in RWs as well as significantly increased along the
hydrologic gradient. The wet zone had the lowest species richness, followed by the
intermediate, and the dry zone (Figure 2.2). Like species richness, mean total vegetative
cover was significantly different for both wetland status and position along the
25
Table 2.1. Results of the GLM ANOVAs testing for significance of wetland status, hydrologic zone, and wetland status by hydrologic zone effects for mean species richness (SR), mean total wetland vegetation (OBL, FACW, and FAC species), mean cover of exotic species, and mean total cover. All significant effects (p < 0.05) are indicated by underlining.
Vegetation Property Source of Variation df† F P Species Richness status 2 5.20 0.007 zone 2 11.29 0.000 status x zone 4 0.38 0.822 Total Wetland Veg (%) status 2 2.37 0.099 zone 2 2.34 0.101 status x zone 4 1.68 0.161 Exotic Cover (%) status 2 0.95 0.392 zone 2 4.61 0.012 status x zone 4 0.91 0.461 Total Cover (%) status 2 3.70 0.028 zone 2 6.48 0.002 status x zone 4 1.20 0.314 † Error degrees of freedom = 100
26
Figure 2.2. Effect of position along the hydrologic gradient and wetland status on species richness. Data presented are means and error bars represent ±1 standard error. Data points with different letters are significantly different at the p < 0.05 level.
Figure 2.3. Effect of position along the hydrologic gradient and wetland status on total cover. Data presented are means and error bars represent ±1 standard error. Data points with different letters are significantly different at the p < 0.05 level.
BE
AC
A
B
DCE CDEBE
BEAD
0
0.5
1
1.5
2
2.5
3
3.5
4
4.5
5
Wet Intermediate Dry
Species Richne
ss
Hydrologic Zone
CWs
RWs
NWs
BC
AC
AC
B
AB
AC
AC
A
AC
20
30
40
50
60
70
80
90
100
Wet Intermediate Dry
(%) T
otal Cover
Hydrologic Zone
CWs
RWs
NWs
27
hydrologic gradient (Table 1). For example, NWs had significantly greater cover than
RWs (Figure 2.3), and total cover tracked the hydrologic gradient for all wetland types
according to the Tukey test. There was a major convergence of total cover in the dry
zones for all wetland types, such that each wetland type had approximately 80% total
cover in the dry zone.
The majority of the species observed were introduced with only 17 (17 %) native
species present across all sites. Overall, there was higher cover of exotic species cover in
NWs than CWs and RWs in the wet and intermediate zones. Statistical analysis of exotic
species cover indicated that position along the hydrologic gradient was significant, while
wetland status and their interaction were not (Table 2.1). The post-hoc Tukey test
indicated that mean percent cover of exotic species was greater in the dry zone than in the
wet zone (Figure 2.4). Overall, the most common species observed within the 210
sample quadrats were Urochloa mutica (California grass), Batis maritima (pickelweed),
Paspalum vaginatum (seashore paspalum), and Bacopa monneri (water hyssop). U.
mutica, B. maritima, and P. vaginatum are exotic and considered highly-invasive
(Erickson and Puttock 2006), whereas B. monneri is a native.
For all species sampled, 15 of 101 were obligate (OBL), 13 were facultative wet
(FACW), 29 were facultative (FAC), 21 were facultative upland (FACU), 3 were upland,
and the remaining 20 species were undesignated (Erickson and Puttock 2006, USDA and
NRCS 2007). Percent of species by wetland indicator status was calculated for all
species sampled within the quadrats. According to the two-factor GLM, neither wetland
status nor position along the hydrologic gradient were significant factors in accounting
28
Figure 2.4. Effect of position along the hydrologic gradient and wetland status on exotic species cover (%). Data presented are means and error bars represent ±1 standard error. Data points with different letters are significantly different at the p < 0.05 level.
Figure 2.5. Effect of position along the hydrologic gradient and wetland status on total wetland vegetation cover (OBL, FACW, FAC species). Data presented are means and error bars represent ±1 standard error. Data points with different letters are significantly different at the p < 0.05 level.
AC
AB
AB
A
AC
B
AC
BC BC
0
10
20
30
40
50
60
70
80
90
100
Wet Intermediate Dry
Exotic Cover
Hydrologic Zone
CWs
RWs
NWs
AB
BC
AB
AE
ADE
BCD
BCD
BCD
BCD
25
35
45
55
65
75
85
95
Wet Intermediate Dry
Total W
etland
Vegetation Co
ver (%
)
Hydrologic Zone
CWs
RWs
NWs
29
for the variability in mean percent cover of wetland vegetation (OBL, FACW, and FAC
species) (Table 1). Although not statistically significant, mean cover of wetland
vegetation was slightly greater at CWs (69.3%) than in NWs (68.4%) and RWs (53.6%)
(Figure 2.5).
The number of species observed at a given site (excluding Keanai) ranged from 1
to 13. The Percolation Ditch site located on Oahu was the most diverse with 13 species,
whereas the Moloka‘i Sea Farms and Ohiapilo sites, both located on the island of
Molaka‘i, were dominated by a single exotic species, B. maritima. Lastly, the Klipper
Pond site, a CW located at Marine Corps Base Hawai‘i on the island of Oahu, had the
greatest number of native species present with a total of 6.
In addition to the 101 identified species, another 10 species were observed but
could not be identified beyond the family level and were thus designated as unknowns.
Seven of the unknown plants were sterile grasses (Poaceae family), two were in the
Convolvulaceae family, and the final unknown was in the Chenopodiaceae family. The
number of unknowns was equally common in the intermediate and dry zones, and least
common in the wet zone. Furthermore, the unknowns occurred across a number of sites,
and were present on all islands, except Moloka‘i.
The effect of island on the vegetation properties was also evaluated. All means
and standard errors are presented in Table 2.2. The one-way ANOVA indicated that both
mean total cover (F4, 35 = 3.43, P = 0.018) and mean percent cover of wetland vegetation
(F4, 35 = 4.29, P = 0.006) were significantly different among islands. According to the
30
Table 2.2. Means and standard errors for mean species richness, mean total wetland vegetation (OBL, FACW, and FAC species), mean exotic cover, and mean total cover. Means with different letters are significantly different at the p < 0.05 level according to the Tukey test.
Vegetation Property Mean SE Mean SE Mean SE Mean SE Mean SE
Species Richness 1.30 a 0.19 2.60 a 0.24 2.23 a 0.41 2.30 a 0.31 2.21 a 0.52
Total Wetland Veg. (%) 82.5 a 15.2 68.04 ab 7.03 66.57 ab 9.48 50.52 b 5.24 80.54 a 6.30
Exotic Cover (%) 82.5 a 15.2 54.06 a 8.37 55.8 a 15.8 47.37 a 5.35 58.3 a 17.9
Total Cover (%) 82.5 a 15.2 71.67 ab 5.98 72.27 ab 9.70 59.32 b 5.53 92.21 ab 2.46
31
Table 2.3. Indicator species for wetland status. Monte Carlo test of significance of observed maximum indicator value (IV) for species, based on 4999 randomizations. A significance level of p < 0.05 was used for the Monte Carlo test.
Table 2.4. List of indicator species for each salinity class. Monte Carlo test of significance of observed maximum indicator value (IV) for species, based on 4999 randomizations. A significance level of p < 0.05 was used for the Monte Carlo test.
Tukey test, Hawai‘i had significantly greater total cover than Oahu, and Moloka‘i and
Hawai‘i had significantly greater wetland vegetation cover than Oahu. Neither species
richness (F4, 35 = 1.10, P = 0.373) nor exotic cover (F4, 35 = 1.92, P = 0.129) were
significantly different among islands (Table 2.2).
The results of the indicator species analysis are provided in Table 2.3 and Table
2.4. According to the Monte Carlo test, B. maritima was a significant indicator of CWs
and U. mutica was a significant indicator of NWs. The test failed to identify any
significant indicators species for RWs. When the fishpond sites were included in the
species indicator analysis, the Monte Carlo test identified numerous indicator species for
this wetland type. However due to the small sample size of fishponds and their
restriction to two islands, the fishpond sites were removed from the final indicator species
analysis. Eight species were significant indicators of freshwater sites, one species each
for brackish and euhaline sites. Commelina diffusa and U. mutica were the best
indicators for the freshwater sites, while the bare ground cover category was a significant
indicator for the hyperhaline sites, and B. maritima and P. vaginatum were significant
indicators for the euhaline and brackish sites, respectively. Each of these top-ranking
indicator species are considered highly invasive in Hawaiian wetlands. Two native
species were found to be significant indicators for freshwater sites, Cyperus polystachos
and B. monnieri.
Results of the PCA are shown in Figure 2.6. Each point on the graph represents
an individual quadrat. Points that are close together in ordination space represent
33
Axi
s 2
(13.
7%)
Figure 2.6. Principle components analysis (PCA) of the species composition of coastal lowland Hawaiian wetlands. Vectors represent the magnitude of correlation with axis 1 and 2 (i), and 1 and 3 (ii). Axes 1, 2, and 3 accounted for 14%, 14%, and 12% of the total variance respectively.
Batis maritima
Urochola mutica
Bolboschoenus maritimus
Bacopa monnieri Paspalum vaginatum
Axis 1 (14.4%)
x
Site Salinity Freshwater Brackish Euhaline Hyperhaline
i
34
Figure 2.6. Continued
Pluchea indica
Urochola mutica
Bolboschoenus maritimus
Sesuvium portulacastra
Paspalum vaginatum
Axis 1 (14.4%)
Site Salinity
Axis
3 (1
1.9%
)
ii.
X Euhaline
Fresh Brackish
Hyperhaline
35
quadrats that have similar species composition, whereas points that are farther apart
represent quadrats that share few if any common species. Axis 1, 2, and 3 accounted for
14%, 13%, and 12% of the total variance in the data (Figure 5). Species with relatively
strong positive loadings on axis 1 were U. mutica, P. vaginatum, and B. maritimus. Batis
maritima had a strong positive loading on axis 2, and Sesuvium portulacastrum (sea
purslane) and Pluchea indica (Indian fleabane) had strong positive loadings on axis 3.
The sites grouped together based on their site salinity class, regardless of their wetland
status, zone, and island (site salinities were measured using a handheld YSI Model 556
Multi probe system). Freshwater sites grouped together at the high end of axis 1 and axis
2, indicating greater cover of U. mutica. Additionally, brackish sites tended to group
together at the low end of axis 1 indicating high percent cover of B. maritimus, P.
vaginatum, and B. monnieri. Finally, both euhaline and hyperhaline sites appear to be
dominated by the highly invasive species, B. maritima.
Discussion This data set provides an overall picture of the vegetation of coastal lowland
wetlands in Hawai‘i. Based on this sample, a disproportionate amount of the species
sampled were exotic. Specifically, non-native plant species accounted for 83% of all
species observed. In this survey, species richness also varied widely from 1 to 13 across
the sites sampled. The sites with the fewest species (Moloka‘i Sea Farms and Ohiapilo)
were both located on Moloka‘i. Furthermore, the site with the greatest number species,
Percolation Ditch, and the site with the greatest number of natives, Klipper Pond, were
36
both CWs located at Marine Corps Base Hawai‘i on the island of Oahu. The largest
number of native species observed at Klipper Pond is the result of the planting of native
species during site creation and periodic removal of exotics.
A detailed comparison of CWs, RWs and NWs in Hawai‘i revealed that the effect
of position along the hydrologic gradient was more pronounced than the effect of wetland
status. Hydrologic zone accounted for a significant portion of variance in mean species
richness, mean exotic cover, and mean total cover. While wetland status accounted for a
significant portion of variance in mean species richness and mean total vegetative cover,
the effect accounted for a slightly smaller portion of the variability when compared to the
effect of position along the hydrologic gradient.
The effect of hydrologic zone differed with respect to most of the variables
measured. The only exception was the mean total cover of wetland vegetation (OBL,
FACW, and FAC species). The other variables, mean species richness, mean cover of
exotic species, and mean total cover, all followed the same trend, such that they were
greatest in the dry zone, followed by the intermediate, and then the wet zone. In all, the
dry zone was significantly greater than the wet zone and was only slightly greater than
the intermediate zone. The differences observed in the vegetative characteristics (species
richness, exotic cover, and total cover) among the wet, intermediate, and dry zones were
likely due to the major stresses that persist in wetland ecosystems: anoxia, wide ranges in
surface and porewater salinity, and fluctuations in water levels. Most organisms are
unable to survive in these conditions, thus limiting the number and species found within
wetlands (Mitsch and Gosselink 1993).
37
The vegetation of CWs and RWs were similar to that of NWs in a number of
ways. Mean species richness, mean cover of wetland vegetation, mean cover exotic
species, and mean vegetative cover of CWs compared favorably to NWs. Furthermore,
the performance of RWs is only in question with relation to the mean total vegetative
cover such that it was found that NWs (76%) have a significantly greater cover of mean
vegetation than RWs (59%). Some studies have shown NWs have a greater total
vegetative cover than mitigation wetlands, which can be attributed to differences in age
(Confer and Niering 1992, Heaven et al. 2003). Additionally, RWs in Hawai‘i are
typically managed for waterbird habitat which requires greater amounts of open water.
High values of vegetative cover are not necessarily desirable for bird habitat, thus greater
total cover in NWs than in RWs may be a result in differences in management goals.
Although I observed a significant difference between NWs and RWs, CWs and NWs had
similar mean total cover. The lack of a significant difference between mean total cover in
NWs and CWs could be due to an increase in soil nutrient availability caused by the
flooding of upland mineral soils (Confer and Niering 1992). As available nutrients are
used up over time a decrease in plant cover is likely to occur.
It was interesting that the mean cover of wetland vegetation and mean cover of
exotic species were similar among CWs, RWs, and NWs. Typically, the total cover of
exotic species increased from the wet to the dry zone. Again, this trend in increasing
cover from the wet to dry zone can be attributed to the environmental stresses associated
with living in the wet zone of a wetland. The exotic species observed in this study may
lack the physiological adaptations required to be successful in the wetland environment.
38
If this study were to have sampled more sites with Rhizophora mangle (mangrove), it
would be expected that this trend would be more subtle or reversed as it was at the
Bellows site on Oahu where R. mangle was present.
Although wetland status had a significant effect on mean species richness, the
difference occurred between CWs and RWs, with both having mean species richness
similar to NWs. It was expected that there would be more pronounced differences
between CWs, RWs, and NWs in the above mentioned explanatory variables. Although
the statistical results of this study indicated that mean species richness, mean cover of
wetland vegetation, and mean cover of exotic species were similar among wetland types,
not all studies have yielded similar results. Campbell et al. (2002) attributed differences
between vegetation features such as species richness and total vegetative cover in CWs,
RWs, and NWs to the age of the mitigation project. Seabloom and van der Valk (2003)
also found species diversity in RWs to be limited by age as well as by landscape
isolation. Heaven et al. (2003) further recommend evaluating mitigation projects not
only relative to their age, but also to their size, context, and disturbance, to better explain
differences and similarities between CWs, RWs, and NWs. Unfortunately metadata such
as the age of RWs and CWs is difficult to obtain as a number of the sites have changed
ownership multiple times and little if any information on site histories are available. It
would be useful to collect this information and perform additional analyses to determine
the root of the similarities and dissimilarities.
Using PCA, additional differences in vegetative composition were revealed that
were not obtained using univariate procedures. The ordination of vegetation quadrats
39
revealed that the association of quadrats in ordination space appeared to be driven more
by site salinity than wetland status, the hydrologic gradient, or island (Figure 2.6). In the
PCA, the majority of the freshwater sites were positioned in an area of ordination space
correlated with a high total cover of U. mutica. Brackish water sites were positioned in a
space correlated with a high percent cover of B. maritimus, P. vaginatum, and B.
monnieri and low cover of U. mutica. Although there appeared to be a correlation
between salinity and species composition, none of the principle component axes were
significant according to the broken-stick eigenvalue test. Axis 1, 2, and 3 only recovered
a total variance 40% in the vegetation data (Figure 2.6), thus suggesting that there may be
additional environmental variables driving the vegetation composition found in coastal
lowland Hawaiian wetlands.
The indicator species analysis identified two highly invasive species, B. maritimus
as an indicator for CWs and U. mutica as an indicator species for NWs. The analysis,
however, failed to identify any significant indicator species for RWs. This suggested that
RWs share common species with both NWs and CWs. The fact that both indicator
species listed above are invasive was not surprising given the overwhelming number of
exotic species (78) that were observed in this study. These findings raise some concerns
regarding the dominant presence of invasive species in coastal lowland Hawaiian
wetlands, such as a lack of management or removal of invasive species. This also
suggests that it may be difficult to locate “reference” sites for coastal lowland wetlands
due to the pervasive nature of invasive species encroachment in the Hawaiian Islands.
40
Chapter 3. Wetland Soils
Introduction While current monitoring of created and restored wetlands nearly always includes
some measure of vegetation as a performance standard (Mitsch and Wilson 1996, Cole
2002, Spieles 2005), it typically does not require monitoring of soil properties or
processes (Shaffer and Ernst 1999) since soil transformations are thought to be slow and
vegetation is relatively easy to sample (Atkinson et al. 2005). This is problematic
because soils are the physical foundation for every wetland ecosystem. Both plants and
animals are dependent upon wetland soils for growth and survival (Stolt et al. 2000). For
example, soils serve as a storage reservoir of available chemicals and nutrients for most
wetland plants and are also the medium in which many nutrient and chemical
transformations take place (Mitsch and Gosselink 2000).
The physical and chemical properties of soil reflect the condition of the wetland
environment, such that proper hydrological function will result in wetland soils with
characteristic pH values (Bishel-Machung et al. 1996, Galatowitsch and van der Valk
1996) and soil organic matter content (Campbell et al. 2002). As soils play an essential
role in many wetland functions and are a critical factor in project development, they are
also useful parameters for comparison. Given the important role that soils play in the
biogeochemical processes that occur in wetlands, the measurement of soil properties has
become more common when evaluating wetland mitigation projects. Soil properties,
such as soil organic matter (SOM), nutrient content, and particle-size distribution have
been shown to reflect the wetland environment and have thus been used to evaluate and
41
compare mitigation and reference wetlands (Craft et al. 1988, Bishel-Machung et al.
1996, Shaffer and Ernst 1999, Stolt et al. 2000, Craft 2001, Campbell et al. 2002, Bruland
and Richardson 2004, Bruland and Richardson 2005a, Bruland and Richardson 2006).
Soil organic matter is a frequent parameter used to assess soil development
(Campbell et al. 2002) because it is an important indicator of soil quality (Bruland and
Richardson 2004). Organic matter accumulates in wetlands as a result of the anaerobic
conditions caused by inundation or saturation of soils which slows down decomposition
and allows organic matter to accumulate (Hogan et al. 2004). The accumulation and
decomposition of SOM in wetland soils has an important effect on nutrient storage and
recycling, which in turn has numerous effects on the wetland structure and function.
Previous research has shown that SOM supports and regulates a number of wetland
functions, such as secondary production by contributing detritus to benthic organisms
(Craft et al. 1999). Soil organic matter also fuels microbial processes such as
denitrification and nitrogen fixation (Craft 2001). Low SOM has been associated with
poor plant community establishment and growth as well as altered nutrient cycling
(Shaffer and Ernst 1999). Additionally, SOM influences several other soil properties and
processes such as bulk density, pH, total nitrogen, moisture, and phosphorus sorption
(Bishel-Machung et al. 1996, Bruland and Richardson 2004).
Nutrient content, such as carbon and nitrogen levels have also been used to
evaluate the development of wetland mitigation projects. The measurement of nutrient
pools (C, N, and P) is important because they are critical for the development of
ecosystem processes (Craft 2001). Soils store the nutrients necessary for vegetative
42
growth and development. The availability of nutrients can greatly affect plant
distribution, abundance, productivity, reproductive potential, and standing biomass.
Extreme nutrient levels in a wetland soil can even prevent the colonization of some
vegetative species (Neckles et al. 2002). These features in turn influence vertebrate and
invertebrate biota by altering ecosystem processes such as primary productivity and food
chain support (Langis et al. 1991).
Soil properties such as water-holding capacity, cation exchange capacity,
permeability, and porosity are largely controlled by particle-size distribution (% clay, %
silt, % sand) (Stolt et al. 2000). Poach and Faulkner (1998) found that wetland soils
dominated by sands are much less effective in retaining nutrients as well as are unable to
hold sufficient water for plant survival as compared to soils dominated by silts and clays.
Additionally, exchange capacities have been shown to be directly correlated with clay
and organic matter content (Stolt et al. 2000). Cation exchange sites in soils are critical
for holding essential plant elements such as Ca, Mg, and K. Wetland sites with greater
amounts of sand have lower water-holding and exchange capacities, and greater porosity
and permeability compared to sites with lower amounts of sand.
Objectives and Hypotheses Due to the dynamic relationships between wetland soil properties, vegetation, and
hydrology, the comparison of physical and chemical soil properties across wetlands can
provide insights into the cumulative effects of hydrology and vegetation of a site. The
objectives of this chapter were as follows: (3.1) To document differences in soil
43
properties such as soil moisture, bulk density (BD), soil organic matter content (SOM),
pH, electrical conductivity (EC), extractable P (ExP), total N (TN), total carbon (TC), and
particle size distribution in CW, RW, and NWs; (3.2) To examine differences in soil
properties across hydrologic (wetness) gradients in CW/ RW and NWs; and (3.3) To
examine the correlation structure among the measured soil properties. The corresponding
hypotheses tested in this chapter were as follows: (3-1a) Soil properties are different in
CW/ RWs than in NWs; and (3-2a) There are differences in soil properties across the
hydrologic gradient.
Methods and Materials
Soil Survey Soil samples were taken in the center of each 1-m2 quadrat identified during the
vegetation survey (Chapter 2). Soil cores were collected from the upper 0 – 20 cm of the
soil profile using a stainless steel piston corer with a circular plastic sleeve insert of 4.8
cm diameter. Once collected, samples were capped and stored on ice until being
transported back to UHM Soil and Water Conservation Laboratory.
Laboratory Analysis Upon returning to UMH, the soil cores were removed from the plastic sleeves and
sliced in half vertically with a sharp knife. Half of the core was oven dried at 105ºC for
24 hours to determine moisture and BD. The ratio of the mass of water to the volume of
the core half (core radius = 2.4 cm) was used as soil moisture (g·cm-3) (Bruland and
Richardson 2004), and the ratio of oven dried soil to the volume of soil resulted in the
44
bulk density (g•cm-3) (Wilke 2005). The dry half of the core was passed through a 2mm
mesh sieve to remove rock fragments and other large organic debris. The dried and
sieved soil was used to determine the percent soil organic matter (SOM) content by loss
on ignition at 450oC for 4 hours (Bruland and Richardson, 2006), and soil texture (%
sand, % silt, % clay) by the pipette method (Tan 1996). Particle size was only
determined for soils with a SOM content less than 30%, as soils with SOM above this
threshold were considered to be organic.
Representative 30 gram sub-samples were placed in small plastic vials and
delivered to the College of Tropical Agriculture and Human Resources Agricultural
Diagnostic Service Center (ADSC) for analysis of pH, EC, TC, TN, and ExP. pH was
measured with a Beckman pH meter (Hue et al. 2000). Extractable phosphorus was
measured using the Olsen extraction (Olsen 1982). Total carbon and TN were measured
using a LECO CN2000 combustion gas analyzer (AOAC International 1997). Lastly, EC
was quantified with a conductivity bridge (Hue et al. 2000).
Data Analysis The fishpond sites and the site under the flooded agriculture regime (Table 1.1)
were excluded from all statistical analyses. Natural wetlands, RWs, and CWs were
compared by calculating mean moisture, BD (g•cm-3), SOM (%), clay, silt, sand, TN (%),
TC (%), pH, EC (mmho•cm-1), and ExP (µg•g-1).
Due to the unbalanced study design (17 NW sites, 11 RW sites, and 7 CW sites)
the data were analyzed using a fixed, two-factor generalized linear model (GLM)
procedure in Minitab Statistical Software for Windows Version 15 (Minitab Inc., State
45
College, PA) and SAS for Windows Version 9.1 (SAS Institute, Cary, NC). The
independent factors tested were wetland status (NW vs. RW vs. CW), hydrologic zone
(wet vs. intermediate vs. dry), and the status by zone interaction with response variables
being moisture, bulk density, SOM, clay, silt, sand, TN, TC, pH, EC, and ExP. As SOM,
EC, TN, and TC were non-normally distributed, SOM, EC, and TN were square-root
transformed and the last was log-transformed before conducting the GLM analysis. The
remaining soil properties met the assumption of normality. Levene’s Test was used to
test for homogeneity of variances. A post-hoc Tukey test was used in cases of a
significant main effect (status, zone, or status x zone). A significance level of p < 0.05
was used for both the GLM and the post-hoc Tukey tests.
A one-way analysis of variance (ANOVA) was used to evaluate the effect of
island on the same dependent variables in the GLM. As SOM, EC, TN, TC, and ExP did
not meet the assumption of normality of homogenous variances the data were log-
transformed before conducting the ANOVA. Both soil pH and BD did not meet the
assumption of homogenous variances even after transformation, and thus the effect of
island was not evaluated in respect to these properties. A post-hoc Tukey test was used
in cases of a significant island effect. A significance level of p < 0.05 was used for both
the ANOVA and the post-hoc Tukey tests.
A correlation analysis was also conducted to identify the relationships among the
eleven soil properties. Due to the non-normally distributed data, the soil properties were
46
Table 3.1. Descriptive statistics for bulk density (BD), soil organic matter (SOM), pH, electrical conductivity (EC), total nitrogen (TN), total carbon (TC), moisture, extractable phosphorus (ExP), clay, silt, and sand.
BD (g cm-3) SOM (%) pH EC
(µS cm-1) TN (%) TC (%)
Mean 0.55 22.1 6.87 28.7 0.53 10.01 Median 0.55 17.5 7.30 9.8 0.29 6.38 Standard Error 0.02 1.2 0.08 3.2 0.04 0.66 Range 1.73 87.4 5.30 399.6 2.96 55.73 Minimum 0.02 1.5 3.50 0.4 0.00 0.74 Maximum 1.76 88.9 8.80 400.0 2.96 56.47 Count 236 236 236 236 236 236 Moisture (g cm-3) ExP (μg g-1) Clay (%) Silt (%) Sand (%) Mean 0.41 60.39 33.70 29.14 37.16 Median 0.42 42.50 33.53 30.94 31.52 Standard Error 0.012 3.90 1.35 1.37 2.34 Range 0.92 438.70 78.20 65.30 97.09 Minimum 0.025 2.30 2.82 0.00 0.09 Maximum 0.95 441.00 81.03 65.30 97.18 Count 236 236 175† 175 175 † The count is 175 for clay, silt, and sand as particle size was not determined on samples with > 30 % SOM
47
Table 3.2. Results of the GLM ANOVAs testing for significance of wetland status, hydrologic zone, and wetland status by hydrologic zone effects for mean moisture, bulk density (BD),soil organic matter (SOM), pH, total nitrogen (TN), total carbon (TC), conductivity (EC), and extractable phosphorus (ExP). All significant effects (p < 0.05) are indicated by underlining.
48
Soil Property Source of Variation df† F P Moisture (g cm-3) Status 2 0.69 0.504 Zone 2 10.51 0.000 status x zone 4 0.94 0.444 BD (g cm-3) Status 2 12.74 0.000 Zone 2 6.24 0.003 status x zone 4 0.45 0.771 SOM (%)§ Status 2 8.43 0.000 Zone 2 2.73 0.070 status x zone 4 1.08 0.373 pH Status 2 6.80 0.002 Zone 2 0.99 0.376 status x zone 4 0.32 0.865 TN (%)§ Status 2 14.30 0.000 Zone 2 1.40 0.250 status x zone 4 0.98 0.424 TC (%)‡ Status 2 12.01 0.000 Zone 2 0.79 0.485 status x zone 4 0.65 0.626 EC (μS cm-1) § Status 2 0.09 0.914 Zone 2 4.75 0.011 status x zone 4 0.66 0.622 ExP (µg g-1) Status 2 0.18 0.835 Zone 2 1.26 0.288 status x zone 4 0.41 0.799 Clay (%)†† Status 2 4.34 0.016 Zone 2 0.46 0.631 status x zone 4 0.21 0.934 Silt (%) Status 2 4.73 0.011 Zone 2 1.24 0.293 status x zone 4 0.33 0.856 Sand (%) Status 2 5.49 0.006 Zone 2 1.09 0.342 status x zone 4 0.15 0.964 † Error degrees of freedom = 96 ‡ These soil properties underwent log transformations before the analysis § The soil properties underwent square-root transformations before the analysis †† Error degrees of freedom = 87 for clay, silt, and sand as particle size was not determined on samples with > 30 % SOM
49
Figure 3.1. Effect of position along the hydrologic gradient and wetland status on bulk density. Data presented are means and error bars represent ±1 standard error. Data points with different letters are significantly different at the p < 0.05 level.
Figure 3.2. Effect of position along the hydrologic gradient and wetland status on SOM. Data presented are means and error bars represent ±1 standard error. Data points with different letters are significantly different at the p < 0.05 level.
BC
AC
A
BC
AC A
BB
BC
0.2
0.3
0.4
0.5
0.6
0.7
0.8
0.9
1
Wet Intermediate Dry
Bulk Den
sity (g/ccm
)
Hydrologic Zone
CWs
RWs
NWs
AC
AA
AC A
A
BC
B
AC
2
2.5
3
3.5
4
4.5
5
5.5
6
Wet Intermediate Dry
Squa
re‐roo
t[ SOM ] (%
)
Hydrologic Zone
CWs
RWs
NWs
50
rank transformed and a Spearman correlation analysis conducted using SAS for Windows
Version 9.1 (SAS Institute, Cary, NC). A significance level of p < 0.05 was used to
assess the significance of the Spearman correlations.
To examine and identify the similarities and/or differences in soil data between
CWs, RWs, and NWs a Principle Components Analysis (PCA) was conducted using the
PC-ORD (McCune and Mefford 1999). PCA is an eigenanalysis ordination technique
that produces orthogonal axes, which capture the highest amount of variation that is
present in the data set (Hair et al. 1995, McCune and Grace 2002). The soil data was
placed into a properties*soil core matrix. The first PCA was run with all soils excluding
the particle size distribution (PSD) variables. The second ordination included both clay
and sand for only the mineral soils (SOM < 30%). Additionally, the sites designated as
former fishponds and flooded agriculture were removed from the PCA.
Finally, a correlation analysis was conducted to identify the relationships among
the eleven soil properties and the 4 most commonly sampled vegetative species: B.
maritima, U. mutica, P. vaginatum, and B. monneri. Due to the non-normally distributed
data, the soil properties and the vegetation cover data were rank transformed and a
Spearman correlation analysis conducted using SAS for Windows Version 9.1 (SAS
Institute, Cary, NC). A significance level of p < 0.05 was used to assess the significance
of the Spearman correlations.
51
Results Descriptive statistics for BD, SOM, pH, EC, TN, TC, ExP, and particle size
distribution are provided in Table 3.1. These data illustrated the wide range of soil
properties that occur in Hawaiian coastal lowland wetlands. A more detailed comparison
of these soil metrics among wetlands of different status and across hydrologic gradients
follows.
In contrast to the vegetation properties (Chapter 2), the effect of status appeared to
be more pronounced than the effect of position along hydrologic gradient. According to
the two-way GLM, most of the soil characteristics differed between NWs, RWs, and
CWs, whereas only three experienced a significant zone effect (EC, BD, and moisture)
(Table 3.2).
Statistical analysis of BD indicated that both wetland status and position along the
hydrologic gradient were significant explanatory factors (Table 3.2). Bulk density
tracked the hydrologic gradient at all three wetland types, and according to the Tukey test
the wet and intermediate zones of NWs had significantly lower BDs than the dry zones of
CWs and RWs, and the intermediate zones of RWs (Figure 3.1).
The analysis of SOM, TC, TN, pH, and particle size distribution (percent-sand,
silt, clay) indicated that wetland status was significant while position on the hydrologic
gradient and their interaction were not (Table 3.2). According to the Tukey test, both
SOM and TN were significantly greater in NWs than CWs and RWs for each zone
(Figures 3.2 and 3.3). Likewise TC was significantly greater in NWs than in RWs,
however is not significantly greater than CWs (Figure 3.4). Soil pH followed an opposite
trend from SOM and TC. Soil pH was significantly lower in NWs and RWs than in
52
Figure 3.3. Effect of position along the hydrologic gradient and wetland status on TN. Data presented are means and error bars represent ±1 standard error. Data points with different letters are significantly different at the p < 0.05 level.
Figure 3.4. Effect of position along the hydrologic gradient and wetland status on TC. Data presented are means and error bars represent ±1 standard error. Data points with different letters are significantly different at the p < 0.05 level.
ACA
A
AC ADAD
BC
B
BCD
0
0.1
0.2
0.3
0.4
0.5
0.6
0.7
0.8
0.9
1
Wet Intermediate Dry
Squa
re‐roo
t[TN
] (%)
Hydrologic Zone
CWs
RWs
NWs
B
AB
AB
AA A
B
BB
0.2
0.3
0.4
0.5
0.6
0.7
0.8
0.9
1
1.1
1.2
Wet Intermediate Dry
Logrithm
[TC] (%
)
Hydrologic Zone
CWs
RWs
NWs
53
Figure 3.5. Effect of position along the hydrologic gradient and wetland status on soil pH. Data presented are means and error bars represent ±1 standard error. Data points with different letters are significantly different at the p < 0.05 level.
Figure 3.6. Effect of position along the hydrologic gradient and wetland status on clay content. Data presented are means and error bars represent ±1 standard error. Data points with different letters are significantly different at the p < 0.05 level.
AC
AA
AB
ABAB
BC BAB
5
5.5
6
6.5
7
7.5
8
8.5
Wet Intermediate Dry
pH
Hydrologic Zone
CWs
RWs
NWs
AB
B
BC
A AC
ABABAC AB
0
5
10
15
20
25
30
35
40
45
50
Wet Intermediate Dry
Clay (%
)
Hydrologic Zone
CWs
RWs
NWs
54
Figure 3.7. Effect of position along the hydrologic gradient and wetland status on silt content. Data presented are means and error bars represent ±1 standard error. Data points with different letters are significantly different at the p < 0.05 level.
Figure 3.8. Effect of position along the hydrologic gradient and wetland status on sand content. Data presented are means and error bars represent ±1 standard error. Data points with different letters are significantly different at the p < 0.05 level.
AB
AB
B
AA A
ABAB
B
0
5
10
15
20
25
30
35
40
Wet Intermediate Dry
Silt (%
)
Hydrologic Zone
CWs
RWs
NWs
AB
A
AC
BBC
ABAB
ABAC
0
10
20
30
40
50
60
70
Wet Intermediate Dry
Sand
(%)
Hydrologic Zone
CWs
RWs
NWs
55
Figure 3.9. Effect of position along the hydrologic gradient and wetland status on soil moisture. Data presented are means and error bars represent ±1 standard error. Data points with different letters are significantly different at the p < 0.05 level.
Figure 3.10. Effect of position along the hydrologic gradient and wetland status on soil conductivity. Data presented are means and error bars represent ±1 standard error. Data points with different letters are significantly different at the p < 0.05 level.
ABAB
BCD
A
CA
BC
ACAD
B
0
0.1
0.2
0.3
0.4
0.5
0.6
Wet Intermediate Dry
Moisture (g/ccm
)
Hydrologic Zone
CWs
RWs
NWs
A
ABAB
ABAB
B
AB
AB
B
0
1
2
3
4
5
6
7
8
Wet Intermediate Dry
Squa
re‐roo
t [EC] (mmho
/cm)
Hydrologic Zone
CWs
RWs
NWs
56
Table 3.3. Means and standard errors for mean soil moisture, BD, SOM, TN, TC, EC, ExP, and particle size distribution. Means with different letters were significantly different at the p < 0.05 level according to the Tukey test.
† ANOVA analysis was not conducted due to heterogeneous variances.
57
CWs, and increased from the wet to dry zones (Figure 3.5). Percent clay, silt, and sand
all showed significant status effects. Soils of RWs had the highest clay and silt contents,
whereas CWs contained the highest sand contents. Natural wetlands and RWs contained
significantly more clay than CWs; RWs contained significantly more silt than CWs and
NWs; and CWs contained significantly more sand than RWs (Figures 3.6-3.8).
Position on the hydrologic gradient explained a significant portion of the variance
in both the moisture and EC data (Table 3.2). The Tukey test indicated that moisture was
significantly greater in the wet and intermediate zones (Figure 3.9). Furthermore, EC
was significantly greater in the wet than in the dry zones (Figure 3.10). Neither wetland
status nor position along hydrologic gradient were significant factors in accounting for
the variability in ExP (Table 3.2). Although not significant, ExP appeared to increase
slightly from wet to dry zones.
In addition to wetland status and hydrologic zone, the effect of island was
assessed. Of the eleven soil properties, the effect of island accounted for a significant
portion of variance in moisture, TN, TC, and ExP (Table 3.3). According to the one-way
ANOVA and Tukey test, soil moisture was significantly lower on Maui than on Moloka‘i
and Oahu. Furthermore, Oahu had a significantly greater TN concentration than both
Hawai‘i and Kauai. TC was also significantly different among islands, such that
Moloka‘i and Kauai were lower than Oahu, and Oahu was greater than Hawai‘i. Lastly,
both Moloka‘i and Oahu had a significantly greater ExP than Kauai according to the
Tukey test.
58
Table 3.4. Spearman rank correlations among the soil properties measured at the 40 coastal lowland wetland sites in Hawai‘i. Only those correlations significant at the p < 0.05 level were reported in the table. (ns = not significant).
The Spearman correlation analyses of the eleven soil properties revealed that
moisture had significant negative correlations with BD, pH, and sand content, as well as
significant positive correlations with SOM, EC, TN, and clay and silt content. Bulk
density had significant negative correlations with SOM, EC, TN, TC, ExP, and clay and
silt content, and a significant positive correlation with pH and sand content. Soil organic
matter showed a significant positive correlation to every soil property except pH and sand
content. Soil pH had a significant negative correlation with TN, clay and sand content,
and a positive correlation with sand content. Total nitrogen had significant positive
correlations with EC, TC, Exp, and clay content, and a significant negative correlation
with sand content. Total carbon was negatively correlated with BD, clay and silt content,
and was positively correlated with EC, ExP and sand content. Total carbon had
59
significant positive correlations with TN, EC, and ExP, and significant negative
correlations with clay and silt content (Table 3.4).
Results of the Principle Components Analysis are shown in Figures 3.11 and 3.12.
Each point on the graph represents an individual soil core. Points that are close together
in ordination space represent cores that have similar soil properties, whereas points that
are farther apart represent cores that share few similar soil properties. When PSD was
excluded from the PCA (Figure 3.12), the majority of the cores grouped together at the
high end of axis 1 and axis 2 regardless of wetland status. Additionally, there were more
outliers present when PSD was excluded. However, the inclusion of clay and sand into
the PCA (Figure 3.12) resulted in a greater grouping effect of wetland status. Axis 1, 2,
and 3 accounted for 42.5%, 16%, and 12% of the total variance in the data. Soil
properties with relatively strong loadings on axis 1 were percent sand and clay, pH,
moisture, and SOM. Total carbon had a strong positive loading on axis 2, and ExP had
strong positive loading on axis 3. NWs tended to group together at the low end of axis 1,
indicating greater SOM and clay content. Additionally, CWs tended to group together at
the high end of axis 1 indicating high sand content, pH, and BD. Finally, RWs appeared
to be loading at the high ends of axis 2 (Figure 3.12).
The Spearman correlation analyses of the soil properties and the four most
commonly-observed vegetative species revealed that B. maritima had significant positive
correlations with soil moisture, soil pH, EC, ExP, and silt, as well as significant negative
correlations with TC and sand content. U. mutica experienced a significant positive
60
Moisture
BDSOM
pH
EC
TN TC
ExP
Axis 1 (43.4 %)
Axis
2 (1
6.1
%)
STATUS Natural Restored
X Created
High BD High SOM, TC
Figure 3.11. Principle Components Analysis (PCA) of the soil properties of coastal lowland Hawaiian wetlands. Includes all soil cores, and excludes the particle size distribution variables. Vectors represent the magnitude of correlation with axis 1 and 2. Axes 1 and 2 accounted for 43.4 % and 16.1 % of the total variance respectively.
High ExP
High Moisture
61
Moisture BD
SOMpH
TN
TC
Clay
Sand
Axis 1 (42.5 %)
Status
Axis
2 (1
5.7
%)
Natural Restored
x Created
High BD, Sand, pH
High SOM, Clay
Figure 3.12. Principle components analysis (PCA) of the soil properties of coastal lowland Hawaiian wetlands. Includes sites with mineral soils only (SOM < 30%). Vectors represent the magnitude of correlation with axis 1 and 2. Axes 1 and 2 accounted for 42.5% and 15.7% of the total variance respectively.
Low TC
High TC
62
Table 3.5. Spearman rank correlations among the soil properties and the dominant vegetative species measured at the 40 coastal lowland wetland sites in Hawai‘i. Only those correlations significant at the p < 0.05 level were reported in the table. (ns = not significant).
† The count is 7 for clay, silt, and sand as particle size was not determined on samples with > 30 % SOM.
74
created hundreds of years ago. Additionally, the soil properties may also reflect the
preferential location of the fishponds on the shore line and near river mouths. Further
research into the physical, chemical, and ecological processes of Hawaiian fishpond
wetlands may reveal that these wetlands hold values beyond cultural significance as well
as may provide insight into wetland creation in Hawai‘i.
Integrated Rankings of Semi-Natural, Restored, and Created Wetland Sites in Hawai‘i
To identify the quality of CW, RW, and NW sites in Hawai‘i, each site was
ranked based on percent native cover, SOM content, and an assessment based on multiple
site visits. Soil organic matter was measured at all sample sites and is correlated with a
number of other soil properties, suggesting that SOM is a key component that relates to
the functions of other soil characteristics. Created wetlands, RWs, and NWs were also
ranked based on my site assessment, which took into consideration disturbance, wetland
size, and heterogeneity. Percent native cover, site mean SOM, and site assessment ranks
for CWs, RWs, and NWs are presented in Table 4.1. Each parameter was ranked and
assigned to a percentile using Microsoft Excel 2007. Wetland sites were ranked together
regardless of status. A rank of 1 (0%) was given to wetlands that scored the worst or
lowest value for a particular metric, whereas 40 (100%) was given to wetlands that
scored the best or highest value relative to the other evaluated wetlands. Wetlands with
similar means were averaged and ranked the same number. Three separate ranking
schemes were conducted: (1) native cover and SOM were equally weighted; (2) native
cover, SOM, and the site assessment were weighted at 50%, 40%, and 10% respectively;
75
Table 4.2. Actual means of soil organic matter (SOM %) and native vegetative cover (%), as well as site assessment rank for natural, restored, and created coastal lowland wetlands in Hawai‘i. Island location shown in parenthesis (Ma = Maui, Mo = Moloka‘i, Ka = Kauai, Hi = Hawai‘i, Oa = Oahu).
Table 4.3. Natural, restored, and created wetland site ranks. Rank 1 weighs the native cover and SOM equally; Rank 2 gives a 50% weight to native cover, 40% weight to SOM, and 10% weight to site assessment; and Rank 3 equally weights native cover, SOM, and site assessment. Data are sorted by Rank 2. Island names are in parentheses.
and (3) native cover, SOM, and site assessment were equally weighted. The final
wetland site ranks are provided in Table 4.2.
The wetland rakings in Rank 1 provide an assessment of the quality of individual
coastal lowland wetland sites in performing ecological functions relative to one another.
Ranks 2 and 3 incorporate the wetland values I assigned based on my best professional
judgment. Wetland sites located at the top of the lists (based on Rank 2) represent sites
that have high native vegetative cover and SOM, and thus represent high quality sites.
Wetland sites at the bottom of the tables contained little to no native cover and low SOM
(Table 4.3). Both NWs and RWs have a wide range of values for all three ranking
schemes, whereas CWs had a smaller range in values. Based on Rank 2, only 4 NWs and
1 RWs sites have a greater wetland scoring rank than CWs. While NWs and RWs have
the highest site values, they also have the lowest. It was interesting to note that the
lowest site rankings in CWs were more “successful” than the six least successful NWs
and RWs.
Additionally, the highest quality NWs are located on the islands of Hawai‘i and
Maui. Although Oahu had the lowest quality NWs, Oahu and Kauai had the highest
quality RW and CW sites. The evaluation of management/ownership in relation to the
wetland ranks identified that the highest ranking NWs sites were under State of Hawai‘i
and private management, whereas the highest ranking RWs and CWs were federally
managed. The results of this ranking scheme have identified the highest quality semi-
natural wetlands, as well as the highest and lowest quality restored, and created coastal
lowland wetlands based on native cover and SOM. These top listed sites from each
79
category could become long-term reference sites for future mitigation of coastal lowland
wetlands in Hawai‘i. This ranking system could also be used to prioritize sites in terms
of future management needs and invasive species removal efforts. Finally, based on the
data and research I have identified performance standards with regards to SOM and total
vegetative cover for CWs and RWs. A reasonable level of SOM is 20% as this is the
mean value of the NW sites sampled in this study. Based on the need for open space for
waterbird habitat I recommend that CWs and RWs have 60% vegetative cover with the
attempts to maximize the cover of native vegetation.
Although vegetation and soil properties are the most commonly sampled metrics
and have been linked to ecosystem functions, the inclusion of additional metrics, such as
water quality, macroinvetebrate community composition, and wildlife populations, into
the wetland rankings would provide a more complete picture of the overall condition of
coastal lowland wetlands in Hawai‘i. The inclusion of these metrics will allow for
greater understanding of these wetlands as well as may help to establish links between the
vegetation, soil, and hydrology in the functioning of these wetland ecosystems.
Summary Four key conclusions of this work are as follows: (1) species richness, total exotic
cover, and total vegetative cover were driven by position along hydrologic gradient, to a
greater degree than wetland status. (2) A broad spectrum of wetland plant species were
established across the 40 wetlands sampled. Eighty-four percent of the species observed
were exotic, indicating that coastal lowland wetlands in Hawai‘i are heavily impacted by
80
exotic species regardless of wetland status. (3) Vegetation composition of coastal
lowland wetlands in Hawai‘i appear to be driven by salinity to a greater degree than
wetland status, position along hydrologic gradient, and island. (4) Semi-natural wetlands
are characterized by high cover of U. mutica, SOM, TN, clay content, and low bulk
density and pH. The RWs sites are characterized by high BD and silt and clay content,
low SOM, TN, TC; and CWs are characterized by high cover of B. maritima, bulk
density, and sand content, and low SOM and TN.
These results suggest that there are considerable differences in the vegetative and
soil properties in this study of 40 semi-natural, restored, and created coastal lowland
wetlands in Hawai‘i as well as along hydrologic gradients within these sites. This
statement is not meant to imply that RWs and CWs lack value entirely, as they likely
provide beneficial environmental services. For example they may store and purify storm
water, process nutrients and toxins, or provide habitat for wildlife, however not to the
same degree as NWs.
More research is needed to examine the interactions between soils, hydrology,
vegetation, and wildlife to provide a comprehensive picture of the status of coastal
lowland wetlands in Hawai‘i. The participation and cooperation between academia and
federal and state organizations are encouraged, as it will result in the acquisition of more
baseline and detailed data. A better understanding of these systems will result in
improved design techniques, construction methods, adaptive management activities, and
long-term sustainability of these vital resources.
81
Appendix A. Species List, indicator status, and origin. (Indicator Status: OBL = Obligate, FACW = Facultative Wet, FAC = Facultative, FACU = Facultative Upland, UPL = Upland; Origin: I = Introduced, N = Native). Species Indicator Status OriginAgeratum conyziodes FAC I Alternanthera sessilis FAC I Amaranthus spinus FACU I Amaranthus virdis FACU I Asystasia gangentica FACU I Atriplex semibaccata FAC I Bacopa monnieri OBL N Batis maritima OBL I Bidens alba FAC I Bolboschoenus maritimus OBL N Canavalia cathartica FACU I Casurina equisetifolia FACU I Cenchrus ciliaris NI I Ceratiohyllum demersum OBL I Chamaesyce hirta FACU I Chamaesyce hypericifolia FACU I Chloris barbata FAC I Chloris radiata FAC I Coccinia grandis NI I Coix lachryma-jobi FACW I Commelina diffusa FACW I Coronopus didymus NI I Cuphea carthangensis FAC I Cyclosorus interruptus FACW N Cylosorus interruptus FACW N Cynadon dactylon FAC I Cyperus compressus FACW I Cyperus halpan FACW I Cyperus involucratus FACW I Cyperus javanicus FACW N Cyperus lavigatus OBL N Cyperus polystachyos FACW N Cyprus gracilis FAC I Desmanthus virgatus FACU I Dicliptera chinensis NI I Digitaria insularis FACU I Distichlis spicata FACW I Echinochola crus-galli FACW I Eclipta prostrata FACW I
82
Species Indicator Status OriginEgeria densa OBL I Eleocharis spp OBL I Eleusine indica FACU I Emilia fosbergii NI I Heteromeles arbutifolia NI I Hibiscus tiliaceus FAC I Hyptis pectinata UPL I Ipomoea alba FAC I Ipomoea indica FAC N Ipomoea pes-caprae FAC N Ipomoea triloba NI I Killinga brevifolia FAC I Lemmna aequinocital OBL I Lipochaeta succlenta FAC N Lucaena leucocephals NI I Ludwigi octovalis OBL I Macroptilium atropurpureum FACU I Melilotus indica UPL I Mimosa pudica FAC I Myoporum sandwicense NI N Nephrolepis spp. FAC N Nymphaea capensis OBL I Paederia foetida UPL I Panicum maximum FAC I Paspalum conjugatum FACW I Paspalum vaginatum FACW I Passiflora foetida FACU I Pennisetum setaceum NI I Persicaria indica OBL I Philadelphus spp. NI I Pluchea carolensis FAC I Pluchea indica FAC I Polygala paniculata FACU I Polypogon spp. FACW I Prosopis pallida FACU I Rhizophora mangle OBL I Ricinus communis FACU I Rivina humilis NI I Sacciolepis indica FAC I Sagittaria latifolia OBL I Scaevola sericea FACU N Schinus terebinthifolius FACU I Schoenoplectus spp. OBL I
83
Species Indicator Status OriginSesuvim portulacastrum FAC N Setaria parviflora FAC I Sida fallax NI N Solanum americanum FACU I Solanum seaforthianum NI I Solanum torvum NIN I Sonchus oleraceus FACU I Sphagneticola trilobata FACW I Thespesia populnea FAC I Thunbergia fragrans NI I Tillandsia spp. NI I Trifolium spp. NI I Typha spp. OBL I Urochola mutica FACW I Verbena litoralis FACU I Vigna marina FAC N Vitex rotundifolia NI N Waltheria indica NI N Xanthium strumariuim FACU I Youngia joponica FACU I Unknown Chenopodiaceae 1 Unknown Convolvulaceae 1 Unknown Convolvulaceae 2 Unknown Grass 1 Unknown Grass 10 Unknown Grass 2 Unknown Grass 3 Unknown Grass 4 Unknown Grass 5 Unknown Grass 6 Unknown Grass 7 Unknown Grass 8 Unknown Grass 9
Koheo W 0.49 1.44 11.21 8.00 46.00 0.05 4.14 34 22.16 23.16 54.69 Koheo I 0.29 1.18 9.06 8.10 48.00 0.02 4.40 30 16.08 14.68 69.25 Koheo D 0.29 0.93 7.89 8.40 7.30 0.07 5.24 23 9.30 13.65 77.05 Koheo W 0.25 0.74 7.71 8.10 23.00 0.01 5.44 23 13.14 15.35 71.51 Koheo I 0.31 0.66 15.60 8.00 48.00 0.10 2.63 38 21.80 45.52 32.68 Koheo D 0.51 1.09 12.05 8.20 16.00 0.15 2.33 156 25.81 53.94 20.24 Kakahaeia W 0.59 0.40 22.70 7.90 96.00 0.40 5.39 147 51.31 47.72 0.96 Kakahaeia I 0.77 0.65 20.12 8.10 70.00 0.30 3.83 156 NA NA NA Kakahaeia D 0.49 0.40 21.29 8.00 62.00 0.37 5.25 156 NA NA NA Kakahaeia W 0.51 0.48 16.18 8.20 22.00 0.23 3.24 160 42.11 55.88 2.01 Kakahaeia I 0.24 0.22 14.39 8.20 6.20 0.23 3.03 318 NA NA NA Kakahaeia D 0.58 0.68 14.44 7.50 6.00 0.24 3.03 128 50.24 46.75 3.01 Mo. Sea Farms W 0.60 0.46 18.66 6.20 53.00 0.31 3.89 60 46.36 49.34 4.29 Mo. Sea Farms I 0.50 0.59 13.88 7.00 28.00 0.24 2.63 150 19.18 57.03 23.79 Mo. Sea Farms D 0.61 0.61 16.82 6.30 36.00 0.31 3.87 79 53.17 42.91 3.92 Mo. Sea Farms W 0.68 0.31 25.71 5.70 70.00 0.71 9.99 62 34.13 58.47 7.40 Mo. Sea Farms I 0.65 0.57 18.92 6.60 40.00 0.31 3.80 53 NA NA NA Mo. Sea Farms D 0.54 0.61 17.14 6.50 34.00 0.26 2.87 75 40.58 58.43 0.99 Ualapue W 0.58 0.09 68.09 3.80 32.00 1.59 36.63 28 NA NA NA Ualapue I 0.52 0.12 49.77 5.80 9.20 1.65 24.21 43 NA NA NA Ualapue D 0.22 0.59 17.81 7.20 2.30 0.53 6.17 205 14.88 24.23 60.89 Ualapue W 0.53 0.62 16.53 7.00 6.10 0.34 4.69 38 30.97 50.40 18.63 Ualapue I 0.29 0.03 79.98 6.1 14 2.94 44.09 205 NA NA NA Ualapue D 0.18 0.67 12.20 7.10 1.00 0.32 4.18 94 16.27 24.25 59.48
Soil properties for each sample quadrat.
123
Appendix C.
Location Zone
Moisture (g/cm3)
Bulk Density (g/ccm)
LOI (%) pH
EC (µS /cm)
N (%)
C (%)
ExP. (μg/g)
Clay (%)
Silt (%)
Sand (%)
Ohiapilo W 0.66 0.39 19.15 6.90 40.00 0.33 4.08 51 65.95 32.21 1.84 Ohiapilo I 0.49 0.62 11.00 8.00 17.00 0.15 2.84 68 32.90 62.98 4.12 Ohiapilo D 0.43 0.87 11.10 8.00 24.00 0.21 2.79 216 24.31 59.62 16.07 Ohiapilo W 0.63 0.52 17.99 7.20 40.00 0.29 4.99 37 37.37 48.66 13.97 Ohiapilo I 0.46 0.73 8.28 8.00 12.00 0.17 8.96 96 20.92 15.81 63.26 Ohiapilo D 0.27 1.02 5.07 8.00 6.00 0.11 7.95 13 7.60 9.14 83.26 Kanaha W 0.58 0.08 47.66 7.9 54 1.83 25.52 24 NA NA NA Kanaha I 0.40 0.25 19.25 8.30 20.00 0.33 12.80 32 36.11 17.38 46.52 Kanaha D 0.54 0.23 24.51 8.40 20.99 0.61 11.55 24 56.06 26.99 16.95 Kanaha W 0.39 0.04 63.72 7.2 73 1.92 34.64 49 NA NA NA Kanaha I 0.42 0.06 66.78 6.9 65 1.66 35.35 52 NA NA NA Kanaha D 0.54 0.09 45.12 6.5 45 1.27 22.48 17 NA NA NA Waipio W 0.55 0.05 88.87 5.9 15 2.10 56.47 257 NA NA NA Waipio I 0.43 0.05 78.04 5.4 6.8 2.69 42.72 166 NA NA NA Waipio D 0.44 0.68 17.88 7.40 5.20 0.43 4.32 33 34.22 33.74 32.04 Waipio W 0.29 0.02 86.03 5.4 12 2.03 48.28 441 NA NA NA Waipio I 0.33 0.04 71.87 5.6 7.5 2.93 40.11 149 NA NA NA Waipio D 0.38 0.58 18.90 6.60 1.20 0.36 4.32 37 22.72 27.57 49.71 Mohouli W 0.33 0.08 30.46 4.70 19.98 0.98 11.68 81 NA NA NA Mohouli I 0.34 0.22 38.87 5.1 5.8 1.62 21.92 76 NA NA NA Mohouli D 0.29 0.16 43.95 3.70 2.40 1.42 20.04 92 NA NA NA Mohouli W 0.59 0.11 39.23 5.20 24.98 1.34 16.45 60 NA NA NA Mohouli I 0.67 0.39 26.03 5.6 12 1.42 20.74 57 2.24 0.00 97.76 Mohouli D 0.35 0.14 69.31 4.1 4.4 1.80 27.39 69 NA NA NA
Soil properties for each sample quadrat.
124
Appendix C.
Location Zone
Moisture (g/cm3)
Bulk Density (g/ccm)
LOI (%) pH
EC (µS /cm)
N (%)
C (%)
ExP. (μg/g)
Clay (%)
Silt (%)
Sand (%)
Aimakapa W 0.57 0.07 39.81 7.6 130 1.62 16.63 48 NA NA NA Aimakapa I 0.52 0.05 77.15 5.50 194.81 2.14 41.58 92 NA NA NA Aimakapa D 0.67 0.07 36.01 5.5 162 2.67 42.43 47 NA NA NA Aimakapa W 0.49 0.04 80.07 6.2 200 2.96 41.17 92 NA NA NA Aimakapa I 0.79 0.09 77.57 5.70 154.85 2.20 35.93 51 NA NA NA Aimakapa D 0.86 0.19 79.49 5.5 90 2.36 35.62 97 NA NA NA Hanalei W 0.45 0.57 13.98 5.00 0.95 0.21 2.43 19 30.19 48.45 21.35 Hanalei I 0.65 0.88 14.21 5.40 1.00 0.20 2.27 17 33.53 51.95 14.52 Hanalei D 0.57 0.83 15.05 6.10 1.40 0.25 3.33 23 31.67 50.75 17.58 Hanalei W 0.48 0.69 14.99 5.40 1.35 0.20 2.20 18 36.05 57.81 6.15 Hanalei I 0.53 0.70 14.61 5.30 1.20 0.19 2.07 16 35.05 54.79 10.16 Hanalei D 0.38 0.81 14.95 6.00 1.22 0.23 2.82 17 26.98 39.16 33.86 Kilauea W 0.47 0.27 21.70 4.80 9.60 0.36 6.22 19 NA NA NA Kilauea I 0.53 0.62 22.65 6.10 2.80 0.41 5.60 13 63.90 34.06 2.04 Kilauea D 0.16 0.43 15.27 7.40 1.20 0.16 2.24 34 36.50 25.30 38.19 Kilauea W 0.73 0.42 20.78 5.30 8.40 0.28 4.48 11 53.24 41.18 5.59 Kilauea I 0.39 0.62 19.51 6.80 1.48 0.28 3.62 21 54.23 30.94 14.82 Kilauea D 0.21 0.40 20.84 6.60 1.75 0.36 4.59 15 58.11 32.22 9.66 Lawai Kai W 0.51 0.38 16.98 6.70 15.50 0.22 6.28 27 33.31 22.03 44.67 Lawai Kai I 0.48 0.47 18.42 7.40 9.50 0.25 4.57 17 27.23 31.67 41.10 Lawai Kai W 0.18 0.18 17.52 7.10 9.50 0.32 7.01 28 36.42 23.61 39.97 Lawai Kai I 0.55 0.52 13.84 7.50 8.70 0.20 5.83 19 39.98 25.58 34.44 Lawai Kai D 0.21 0.51 19.66 6.80 2.55 0.34 4.10 28 58.08 34.47 7.45 Huleia W 0.43 0.16 40.29 4.70 10.50 1.19 16.35 13 NA NA NA
Soil properties for each sample quadrat.
125
Appendix C.
Location Zone
Moisture (g/cm3)
Bulk Density (g/ccm)
LOI (%) pH
EC (µS /cm)
N (%)
C (%)
ExP. (μg/g)
Clay (%)
Silt (%)
Sand (%)
Huleia I 0.63 0.47 28.00 4.40 7.50 0.65 9.04 28 49.20 47.48 3.31 Huleia D 0.38 0.57 21.84 5.20 2.30 0.40 4.69 42 58.00 39.09 2.91 Huleia W 0.69 0.38 27.81 4.50 9.00 0.66 8.64 42 45.12 52.91 1.97 Huleia I 0.49 0.32 26.74 4.50 7.10 0.57 8.36 51 NA NA NA Huleia D 0.32 0.49 29.30 4.40 1.90 0.33 4.71 47 NA NA NA Kawaiele W 0.21 0.50 3.60 7.90 7.00 0.04 10.53 2 NA NA NA Kawaiele I 0.12 0.94 3.13 8.50 2.55 0.02 9.85 12 8.11 0.38 91.51 Kawaiele D 0.05 1.31 3.02 8.40 0.40 0.04 9.65 13 10.04 1.04 88.92 Kawaiele W 0.30 1.16 1.75 8.60 2.75 0.00 10.99 10 10.06 0.47 89.47 Kawaiele I 0.31 1.11 1.95 8.50 4.90 0.00 10.79 11 6.38 1.60 92.03 Kawaiele D 0.28 1.33 1.68 8.80 1.00 0.00 10.92 8 9.99 0.97 89.05 Kauai. Coastal W 0.41 0.29 16.34 7.00 39.00 0.26 10.81 14 37.01 12.89 50.10 Kauai. Coastal I 0.53 0.77 17.98 4.50 22.00 0.28 8.95 15 47.20 16.55 36.24 Kauai. Coastal D 0.33 0.68 15.57 7.80 16.00 0.25 6.97 48 45.98 19.44 34.58 Kauai. Coastal W 0.48 0.53 13.21 7.40 29.00 0.21 10.64 40 31.91 13.04 55.05 Kauai. Coastal I 0.34 0.71 13.96 7.70 18.00 0.19 9.66 44 36.53 11.19 52.29 Kauai. Coastal D 0.43 0.91 22.86 7.80 7.75 0.27 8.18 51 43.03 17.05 39.92 Kauai. Riparian W 0.28 0.15 22.69 4.0 5.2 0.60 7.77 27 56.83 38.18 5.00 Kauai. Riparian I 0.50 0.29 25.98 3.70 2.70 0.69 9.13 33 30.83 27.51 41.66 Kauai. Riparian D 0.43 0.77 20.08 3.50 2.75 0.28 4.07 36 48.27 32.52 19.21 Kauai. Riparian W 0.23 0.07 38.14 4.0 2.8 0.59 7.97 33 NA NA NA Kauai. Riparian I 0.27 0.20 24.66 3.80 2.00 0.52 7.48 42 60.66 30.95 8.40 Kauai. Riparian D 0.53 0.51 32.18 3.50 5.40 0.82 10.98 79 NA NA NA Nukolii W 0.33 0.81 2.89 8.10 7.60 0.03 11.15 7 6.70 0.85 92.45
Soil properties for each sample quadrat.
126
Appendix C.
Location Zone
Moisture (g/cm3)
Bulk Density (g/ccm)
LOI (%) pH
EC (µS /cm)
N (%)
C (%)
ExP. (μg/g)
Clay (%)
Silt (%)
Sand (%)
Nukolii I 0.39 0.85 3.03 8.00 9.00 0.02 10.94 5 8.86 0.06 91.08 Nukolii D 0.30 0.71 3.77 8.30 10.60 0.05 10.89 8 12.09 3.17 84.74 Nukolii W 0.30 0.53 2.67 8.10 4.80 0.02 10.88 7 10.50 0.58 88.92 Nukolii I 0.43 0.83 2.79 8.20 4.50 0.03 10.94 6 7.35 1.79 90.86 Nukolii D 0.39 1.14 2.67 8.40 5.20 0.02 11.00 5 7.02 1.20 91.79 Kaloko W 0.64 0.36 20.34 6.9 72 0.74 9.39 133 21.06 10.10 68.84 Kaloko D 0.03 0.40 28.16 7.0 5.8 1.78 21.57 166 26.30 10.88 62.82 Kaloko W 0.67 0.09 63.26 6.2 165 2.07 30.74 118 NA NA NA Kaloko I 0.36 0.31 31.29 6.6 66 0.86 13.16 31 NA NA NA Kaloko D 0.41 0.51 22.36 7.9 42 0.74 13.44 69 30.70 18.46 50.84 Honoapu W 0.48 0.39 19.90 5.90 30.00 0.15 2.03 15 22.41 56.05 21.54 Honoapu I 0.37 0.26 16.59 5.10 34.00 0.13 1.91 16 23.23 21.33 55.44 Honoapu D 0.53 0.59 20.08 6.60 24.00 0.44 5.36 47 30.22 39.14 30.63 Honoapu W 0.45 0.16 22.94 5.80 70.00 0.55 7.43 24 NA NA NA Honoapu I 0.45 0.07 64.32 4.6 120 1.76 33.27 82 NA NA NA Honoapu D 0.46 0.22 36.89 5.70 36.00 0.87 12.60 70 NA NA NA Kamilo Pt. 6 W 0.23 0.57 3.40 8.70 9.20 0.05 5.92 14 10.43 4.33 85.24 Kamilo Pt. 6 I 0.49 0.09 43.51 7.4 82 1.67 21.19 95 NA NA NA Kamilo Pt. 6 D 0.42 0.52 10.05 7.60 19.50 0.35 9.60 24 NA NA NA Kamilo Pt. 6 W 0.58 0.24 21.85 6.70 96.00 0.63 8.38 28 35.58 17.96 46.46 Kamilo Pt. 6 I 0.68 0.10 70.90 5.3 120 2.43 37.51 78 NA NA NA Kamilo Pt. 7 W 0.41 0.09 55.82 5.4 100 1.93 28.19 147 NA NA NA Kamilo Pt. 7 I 0.70 0.39 21.67 5.80 46.00 0.63 8.27 46 33.43 13.21 53.36 Kamilo Pt. 7 D 0.48 0.29 22.45 5.9 46 0.72 9.09 52 25.72 7.97 66.31
Soil properties for each sample quadrat.
127
Appendix C.
Location Zone
Moisture (g/cm3)
Bulk Density (g/ccm)
LOI (%) pH
EC (µS /cm)
N (%)
C (%)
ExP. (μg/g)
Clay (%)
Silt (%)
Sand (%)
Kamilo Pt. 7 W 0.95 0.15 73.79 5.00 100.00 2.63 38.22 58 NA NA NA Kamilo Pt. 7 I 0.65 0.11 75.14 5.3 125 2.34 37.22 130 NA NA NA Kii W 0.62 0.61 19.81 6.50 15.80 0.31 4.27 42 74.98 21.87 3.16 Kii I 0.58 0.62 18.98 7.80 11.50 0.23 4.25 40 NA NA NA Kii D 0.60 0.84 18.17 7.60 25.00 0.20 3.14 46 59.16 37.82 3.03 Kii W 0.49 0.59 17.85 7.40 9.40 0.22 3.61 79 59.93 39.41 0.66 Kii I 0.68 0.89 17.45 7.40 21.00 0.18 3.35 54 58.66 38.34 3.00 Kii D 0.66 0.82 16.98 7.60 27.00 0.19 3.57 34 52.50 41.41 6.09 Punamano W 0.49 0.53 7.36 8.20 1.40 0.14 10.50 26 42.98 31.09 25.94 Punamano I 0.55 0.31 24.81 7.90 7.40 0.69 12.51 91 60.96 26.54 12.50 Punamano D 0.40 0.58 14.50 8.10 5.90 0.44 11.56 42 43.59 13.55 42.86 Punamano W 0.26 0.14 15.76 8.00 2.55 0.21 4.64 33 76.37 22.04 1.58 Punamano I 0.56 0.51 9.92 8.10 2.70 0.21 9.55 28 49.94 29.15 20.91 Punamano D 0.36 0.47 14.40 7.60 10.60 0.29 7.82 30 57.63 6.65 35.72 Coconut Grove W 0.45 0.29 23.13 7.40 3.40 0.66 8.33 42 NA NA NA Coconut Grove I 0.69 0.65 20.71 7.60 3.65 0.39 5.61 51 79.14 17.00 3.86 Coconut Grove D 0.11 0.22 28.40 7.30 3.55 1.07 15.30 29 64.42 28.07 7.51 Coconut Grove W 0.55 0.55 11.90 7.60 3.90 0.33 4.51 58 78.89 20.15 0.96 Coconut Grove I 0.51 0.46 19.61 7.20 2.80 0.35 4.02 140 81.03 18.19 0.78 Coconut Grove D 0.25 0.52 12.81 7.80 3.30 0.34 10.02 72 49.67 26.83 23.50 Kealia W 0.48 0.65 16.12 7.90 54.00 0.12 2.19 40 25.44 63.54 11.02 Kealia I 0.29 0.39 21.50 7.70 49.00 0.43 6.32 65 37.19 62.72 0.09 Kealia D 0.18 0.29 27.89 6.90 57.00 0.56 6.47 30 NA NA NA Kealia W 0.46 0.70 25.46 7.90 50.00 0.11 1.74 47 28.26 65.30 6.45
Soil properties for each sample quadrat.
128
Appendix C.
Location Zone
Moisture (g/cm3)
Bulk Density (g/ccm)
LOI (%) pH
EC (µS /cm)
N (%)
C (%)
ExP. (μg/g)
Clay (%)
Silt (%)
Sand (%)
Kealia I 0.44 0.56 15.82 7.80 15.00 0.27 4.46 51 30.53 56.79 12.68 Kealia D 0.18 0.25 24.27 7.30 31.00 0.54 5.98 47 NA NA NA Keanai W 0.39 0.43 13.23 5.20 0.72 0.24 2.87 110 17.45 37.50 45.04 Keanai I 0.28 0.59 15.00 6.00 0.55 0.24 2.74 21 19.36 39.56 41.08 Keanai D 0.39 0.92 11.48 5.40 0.42 0.08 1.07 47 22.24 47.60 30.15 Keanai W 0.54 0.75 10.99 5.40 0.70 0.12 1.29 70 12.27 31.74 55.99 Keanai I 0.31 0.64 14.96 5.40 1.25 0.32 3.50 70 24.73 38.00 37.27 Keanai D 0.31 0.67 10.87 5.50 0.75 0.09 1.18 44 24.92 48.70 26.39 Waihe‘e W 0.42 0.45 8.29 7.70 4.90 0.26 7.69 70 21.59 10.20 68.20 Waihe‘e I 0.20 1.20 7.74 7.60 3.20 0.26 6.94 353 13.92 6.61 79.47 Waihe‘e D 0.12 1.14 6.21 7.80 1.50 0.19 6.21 161 12.87 4.63 82.50 Waihe‘e W 0.48 0.42 12.20 7.60 7.60 0.33 8.16 61 31.85 14.94 53.22 Waihe‘e I 0.22 0.97 7.39 7.70 1.05 0.22 7.27 234 13.82 3.80 82.38 Waihe‘e D 0.09 1.00 6.84 7.70 3.90 0.17 6.45 182 13.60 4.32 82.09 Paukukalo W 0.17 1.70 2.07 8.60 0.55 0.02 3.08 9 3.40 1.27 95.34 Paukukalo I 0.06 0.94 5.15 7.80 0.75 0.22 7.53 25 NA NA NA Paukukalo D 0.06 1.76 1.96 8.50 0.50 0.02 3.87 10 4.54 0.98 94.48 Paukukalo W 0.48 0.76 7.54 7.90 1.45 0.14 4.37 28 16.48 16.76 66.76 Paukukalo I 0.23 0.95 7.63 7.80 1.70 0.17 4.33 28 16.78 17.87 65.35 Paukukalo D 0.08 1.17 1.50 7.90 0.72 0.11 4.89 33 7.01 3.38 89.60 Nu‘u W 0.34 0.21 23.22 7.00 17.00 0.77 8.00 51 25.48 36.00 38.52 Nuu I 0.24 0.14 25.73 6.00 18.60 0.86 9.45 51 2.82 0.00 97.18 Nu‘u D 0.33 0.69 10.72 8.40 4.40 0.27 3.19 121 13.05 16.01 70.93 Nu‘u W 0.24 0.06 37.01 7.4 45 1.46 16.07 69 NA NA NA
Perc. Ditch I 0.25 0.65 8.11 8.2 1.6 0.07 7.36 88 34.97 26.36 38.67 Perc. Ditch D 0.12 0.67 14.04 7.7 2.2 0.29 10.72 166 29.82 28.45 41.73 Salvage Yard W 0.54 0.08 57.45 7.5 400 0.99 32.61 83 NA NA NA Salvage Yard I 0.17 0.79 10.21 7.9 27 0.13 10.82 28 14.93 15.06 70.00 Salvage Yard D 0.12 1.23 3.06 8.3 6.2 0.06 8.53 33 4.16 0.73 95.11 Salvage Yard W 0.45 0.07 59.96 5.9 390 1.21 33.28 103 NA NA NA Salvage Yard I 0.28 0.60 22.04 7.4 39 0.36 7.32 52 36.96 27.06 35.98 Salvage Yard D 0.31 0.81 15.65 7.6 23 0.17 4.87 78 24.70 17.92 57.39 Ka‘elepulu W 0.40 0.27 16.58 6.9 30 0.24 3.74 21 48.51 48.03 3.45 Ka‘elepulu I 0.52 0.69 19.37 7.1 33 0.22 2.87 20 NA NA NA Ka‘elepulu D 0.19 0.72 15.97 7.3 1.8 0.30 3.38 178 49.63 40.72 9.66 Ka‘elepulu W 0.27 0.31 13.22 6.8 18 0.16 2.02 21 56.78 41.72 1.50 Ka‘elepulu I 0.48 0.67 15.11 7.4 19 0.20 2.70 21 56.24 39.48 4.28 Ka‘elepulu D 0.23 0.95 14.74 7.5 1.7 0.30 3.27 166 40.78 34.29 24.93 Bellows W 0.73 0.48 20.01 7.1 12 0.32 8.22 59 39.01 37.23 23.77 Bellows I 0.57 0.22 27.33 5.8 29 0.91 16.98 71 47.57 31.51 20.92 Bellows D 0.09 0.76 8.25 7.6 1.4 0.18 12.06 95 12.97 9.36 77.67 Bellows W 0.76 0.41 25.20 6.0 14 0.44 8.32 69 49.64 42.87 7.49 Bellows I 0.51 0.24 40.27 5.7 66 0.81 15.34 66 NA NA NA Bellows D 0.13 0.83 7.87 7.8 1.3 0.19 12.71 76 14.63 9.52 75.85
Soil properties for each sample quadrat.
132
Literature Cited Adamus, P. R. 1983. HWA Assessment method, v. 2 of Method for wetland functional
assessment: Washington, D.C. FHWA-IP-82-24, U.S. Department of Transportation, Federal Highway Administration Report, no. FHWA-IP-82-24.
AOAC International. 1997. Official Methods of Analysis of AOAC International, 16th
Edition, AOAC International, Arlington, VA.
Ashworth, S. M. 1997. Comparison between restored and reference sedge meadow wetlands in south-central Wisconsin. Wetlands 17:518-527.
Atkinson, R., J. Perry, and J. Cairns. 2005. Vegetation Communities of 20-year-old Created Depressional Wetlands. Wetlands Ecology and Management 13:469-478.
Balcombe, C. K., J. T. Anderson, R. H. Fortney, J. S. Rentch, W. N. Grafton, and W. S. Kordek. 2005. A Comparison of Plant Communities in Mitigation and Reference Wetlands in the Mid-Appalachians. Wetlands 25:130-142.
Bishel-Machung, L., R. P. Brooks, S. S. Yates, and K. L. Hoover. 1996. Soil properties of reference wetlands and wetland creation projects in Pennsylvania. Wetlands 16:532-541.
Brinson, M. M. 1993. A hydrogeomorphic classification for wetlands. Technical Report WRP-DE-4, U.S. Army Engineer Waterways Experiment Station, Vicksburg, MS.
Brinson, M. M. and R. Rheinhardt. 1996. The Role of Reference Wetlands in Functional Assessment and Mitigation. Ecological Applications 6:69-76.
Brown, S. C. 1999. Vegetation Similarity and Avifaunal Food Value of Restored and Natural Marshes in Northern New York. Restoration Ecology 7:56-68.
Brown, S. C. and D. P. Batzer. 2001. Birds, Plants, and Macroinvetebrates as Indicators of Restoration Success in New York Marshes. Pages 237-248 in R. B. Rader, D. P. Batzer, and S. A. Wissinger, editors. Bioassessment and Management of North American Freshwater Wetlands. John Wiley & Sons.
133
Brown, S. C. and P. L. M. Veneman. 2001. Effectiveness of Compensatory Wetlands Mitigation in Massachusetts, USA. Wetlands 21:508-518.
Bruland, G. L., M. F. Hanchey, and C. J. Richardson. 2003. Effects of agriculture and wetland restoration on hydrology, soils, and water quality of a Carolina bay complex. Wetlands Ecology and Management 11:141-156.
Bruland, G. L. and C. J. Richardson. 2004. Hydrologic Gradient and Topsoil Additions Affect Soil Properties of Virginia Created Wetlands. Soil Science Society of America Journal 68:2069-2077.
Bruland, G. L. and C. J. Richardson. 2005a. Hydrologic, Edaphic, and Vegetative Responses to Microtopographic Reestablishment in a Restored Wetland. Restoration Ecology 13:515-523.
Bruland, G. L. and C. J. Richardson. 2005b. Spatial Variability of Soil Properties in Created, Restored, and Paired Natural Wetlands. Soil Science Society of America Journal 69:273-284.
Bruland, G.L. and C.J. Richardson. 2006. Comparison of Soil Organic Matter in Created, Restored and Paired Natural Wetlands in North Carolina. Wetlands Ecology and Management 14:245-251.
Campbell, D. A., C. A. Cole, and R. P. Brooks. 2002. A comparison of created and natural wetlands in Pennsylvania, USA. Wetlands Ecology and Management 10:41-49.
Castelli, R. M., J. C. Chambers, and R. J. Tausch. 2000. Soil-plant relations along a soil-water gradient in great basin riparian meadows. Wetlands 20:251-266.
Cole, C. A. 2002. The assessment of herbaceous plant cover in wetlands as an indicator of function. Ecological Indicators 2:287-293.
Cole, C. A. and D. Shafer. 2002. Section 404 Wetland Mitigation and Permit Success Criteria in Pennsylvania, USA, 1986-1999. Environmental Management 30:508-515.
134
Confer, S. R. and W. A. Niering. 1992. Comparison of created and natural freshwater emergent wetlands in Connecticut (USA). Wetlands Ecology and Management 2:143-156.
Contelmo, A. J. and J. G. Ehrenfeld. 1999. Effects of microtopography on mycorrhizal infection in Atlantic white cedar (Chamaecyparis thyoides (L.) Mills). Mycorrhiza 8:175-180.
Costanza, R., R. d'Arge, R. de Groot, S. Farber, M. Grasso, B. Hannon, K. Limburg, S. Naeem, R. V. O'Neill, J. Paruelo, R. G. Raskin, P. Sutton, and M. van den Belt. 1997. The value of the world's ecosystem services and natural capital. Nature 387:253-260.
Craft, C. B. 2001. Soil Organic Carbon, Nitrogen, and Phosphorus as Indicators of Recovery in Restored Spartina Marshes. Ecological Restoration 19:87-91.
Craft, C. B., S. W. Broome, and E. D. Seneca. 1988. Nitrogen, Phosphorus and Organic Carbon Poolsin Natural and Transplanted Marsh Soils. Estuaries 11:272-280.
Craft, C. B., J. Reader, J. N. Sacco, and S. W. Broome. 1999. Twenty-five Years of Ecosystem Development of Construced Spartina alteriflora (Loisel) Marshes. Ecological Applications 9:1405-1419.
Craft, C. B., S. Broome, and C. Campbell. 2002. Fifteen Years of Vegetation and Soil Development after Brackish-Water Marsh Creation. Restoration Ecology 10:248-258.
Dahl, T. E. 1990. Wetlands losses in the United States 1780's to 1980's. U.S. Department of the Interior, Fish and Wildlife Service, Washington, D.C.
Dahl, T. E. 2006. Status and trends of wetlands in the conterminous United States 1998 to 2004. U.S. Department of the Interior; Fish and Wildlife Service, Washington, D.C. .
DU. 2007. Ducks Unlimited: Conservation Today, Wetlands for Tomorrow: Hawai‘i. Ducks Unlimited, Inc. Available from: <http://www.ducks.org/conservation/initiative 32.aspx> [November 11, 2007]
135
EPA. 1995. America's wetlands: Our vital link between land and water. Office of Water, Office of Wetlands, Oceans and Watersheds. EPA843-K-95-001.
EPA. 1997. The National Action Plan to Implement the Hydrogeomorphic Approach To Assessing Wetland Functions. Pages 33607-33620. Federal Register 62 (119): 33607-33620.
EPA. 2007. River Corridor and wetlands restoration: Definitions and distinctions. Available from: <http://www.epa.gov/owow/wetlands/restore/defs.html> [September 10, 2007].
Erickson, T. and C. Puttock. 2006. Hawaii Wetland Field Guide: An ecological and identification guide to wetlands and wetland plants of the Hawaiian Islands. Bess Press Books, Honolulu, HI.
Ervin, G. N., B. D. Herman, J. T. Bried, and D. Christopher Holly. 2006. Evaluating Non-native Species and Wetland Indicator Status as Compoenets of Wetlands Floristic Assessment. Wetlands 26:1114-1129.
Galatowitsch, S. M. and A. G. van der Valk. 1996. The Vegetation of Restored and Natural Prairie Wetlands. Ecological Applications 6:102-112.
Goslee, S. C., R. P. Brooks, and C. A. Cole. 1997. Plants as indicators of wetland water source. Plant Ecology 131:199-206.
Hair, J. F., R. E. Anderson, R. L. Tatham, and W. C. Black. 1995. Multivariate Data Analysis. Fourth edition. Pentice Hall, Englewood Cliffs, New Jersey.
Hannaford, M. J. 1998. Development and Comparison of Biological Indicators of Habitat Disturbance for Streams and Wetlands. Dissertation. University of California, Berkeley Berkeley.
Heaven, J. B., F. E. Gross, and A. T. Gannon. 2003. Vegetation Comparison of a Natural and a Created Emergent Marsh Wetland. Southeastern Naturalist 2:195-206.
Hoeltje, S. M. and C. A. Cole. 2007. Losing Function through Wetland Mitigation in Central Pennsylvania, USA. Environmental Management 39:385-402.
136
Hogan, D. M., T. E. Jordan, and M. R. Walbridge. 2004. Phosphorus retention and soil organic carbon in restored and natural freshwater wetlands. Wetlands 24:573-585.
Hogan, D. M. and M. R. Walbridge. 2007. Urbanization and nutrient retention in freshwater riparian wetlands. Ecological Applications 17:1142-1155.
Houlahan, J. E., P. A. Keddy, K. Makkay, and C. S. Findlay. 2006. The Effects of Adjacent Landuse on Wetland Species Richness and Community Composition. Wetlands 26:79-96.
Hue, N. V., R. Uchida, and M. C. Ho. 2000. Sampling and Analysis of Soils and Plant Tissues: How to take representative samples, how the samples are tested. Pages 23-30 in J. A. S. a. R. S. Uchida, editor. Plant Nutrient Management in Hawaii Soils: Approaches for tropical and subtropical agriculture. CTAHR, UHM, Honolulu, HI.
Hunt, R. J., J. F. Walker, and D. P. Krabbenhoft. 1999. Characterizing hydrology and the importance of ground-water discharge in natural and constructed wetlands. Wetlands 19:458-472.
Jarman, N. M., R. A. Dobberteen, B. Windmiller, and P. R. Lelito. 1991. Evaluation of Created Freshwater Wetlands in Massachusetts. Restoration and Management Notes 9:26-29.
Kent, M. and P. Coker. 1992. Vegetation Description and Analysis: A practical approach. CRC Press Inc., Boca Raton, Florida.
Kentula, M. E. 2000. Perspectives on setting success criteria for wetland restoration. Ecological Engineering 15:199-209.
King, R. S., K. T. Nunnery, and C. J. Richardson. 2000. Macroinvertebrate assemblage response to highway crossings in forested wetlands: implications for biological assessment. Wetlands Ecology and Management 8:243–256.
King, R. S., C. J. Richardson, D. L. Urban, and E. A. Romanowicz. 2004. Spatial Dependency of Vegetation-Environmental Linkages in an Anthropogenically Influenced Wetland Ecosystem. Ecosystems 7:75-97.
137
Kosaka, E. 1990. Technical review of draft report, wetlands losses in the United States, 1780’s to 1980’s. U.S. Department of Interior, Fish and Wildlife Service.
Kusler, J. A. and M. E. Kentula, editors. 1990. Wetland Creation and Restoration: The status of the science. Island Press, Washington, D.C.
Langis, R., M. Zalejko, and J. B. Zedler. 1991. Nitrogen Assessments in a Constructed and a Natural Salt Marsh of San Diego Bay. Ecological Applications 1:40-51.
McCune, B. and J. B. Grace. 2002. Analysis of Ecological Communities. MjM Software Design, Gleneden Beach, Oregon.
McCune, B. and M. J. Mefford. 1999. PC-ORD: Multivariate analysis of ecological data MjM Software Design, Gleneden, Beach Oregon, USA.
Mitsch, W. J. and J. G. Gosselink. 1993. Wetlands. Second edition. Van Nostrand Reinhold, New York.
Mitsch, W. J. and J. G. Gosselink. 2000. Wetlands. Third edition. John Wiley & Sons, Inc., USA.
Mitsch, W. J. and R. F. Wilson. 1996. Improving the Success of Wetland Creation and
Restoration with Know-How, Time, and Self-Design. Ecological Applications 6:77-83.
Moore, H. H., W. A. Niering, L. J. Marsicano, and M. Dowdell. 1999. Vegetation change in created emergent wetlands (1988–1996) in Connecticut (USA). Wetland Ecology and Management 7:177-191.
Neckles, H. A., M. Dionne, D. M. Burdick, C. T. Roman, R. Buchsbaum, and E. Hutchins. 2002. A Monitoring Protocol to Assess Tidal Restoration of Salt Marshes on Local and Regional Scales. Restoration Ecology 10:556-563.
Novitzki, R. P., D. Smith, and J. D. Fretwell. 1997. National Water Summary on Wetland Resources. United States Geological Survey Water Supply Paper 2425.
138
NRC. 1995. Wetlands: Characteristics and Boundaries. National Academy Press, Washington, D.C.
Olsen, S. R., and L.E. Sommers. . 1982. Phosphorus. Pages 403-430 in R. H. M. a. D. R. K. A.L. Page, editor. Methods of Soil Analysis. Part 2. SSSA Inc., Madison, WI.
Parikh, A. and N. Gale. 1998. Vegetation Monitoring of Created Dune Swale Wetlands, Vandenberg Air Force Base, California. Restoration Ecology 6:83-93.
Peterson, B. J. and B. McCune. 2001. Diversity and succession of epiphytic macrolichen communities in low-elevation managed conifer forests in western Oregon. Journal of Vegetation Science 12:511-524.
Poach, M. E. and S. P. Faulkner. 1998. Soil Phosphorus Characteristics of Created and Natural Wetlands in the Atchafalaya Delta, LA. Estuarine, Coastal and Shelf Science 46:195-203.
Quammen, M. L. 1986. Summary of conference and information needs for mitigation in wetlands. Pages 151-158 in R. Strickland, editor. Wetland Functions, Rehabilitation, and Creation in the Pacific Northwest: The State of Our Understanding. Washington State Department of Ecology, Olympia, WA.
Race, M. S. and M. S. Fonseca. 1996. Fixing Compensatory Mitigation: What Will it Take? Ecological Applications 6:94-101.
Reinartz, J. A. and E. L. Warne. 1993. Development of Vegetation in Small Created Wetlands in Southeastern Wisconsin. Wetlands 13:153-164.
Richardson, C. J. 1994. Ecological functions and human values in wetlands: A framework for assessing forestry impacts. Wetlands 14:1-9.
Seabloom, E. W. and A. G. van der Valk. 2003. Plant Diversity, Composition, and Invasion of Restored and Natural Prairie Pothole Wetlands: Implications for Restoration. Wetlands 23:1-12.
139
Shaffer, P. W. and T. L. Ernst. 1999. Distribution of soil organic matter in freshwater emergent/open water wetlands in the Portland, Oregon metropolitan area. Wetlands 19:505-516.
Spieles, D. J. 2005. Vegetation Development in Created, Restored, and Enhanced Mitigation Wetlands Banks of the United States. Wetlands 25:51-63.
Starr, F. and K. Starr. 2007. Plants of Hawaii. Available from: <http://www.hear.org/starr/hiplants/> [November 11, 2007].
Stedman, S. and J. Hanson. 2007. Part one: Wetlands, Fisheries, and Economics in the Pacific Coastal States, IN: Habitat Conections: Wetlands, Fisheries and Economics. Department of Commerce, National Marine Fisheries Service. Available from: <http://www.nmfs.noaa.gov/habitat/habitatconservation/publications/habitatconections/habitatconnections.htm> [December 1, 2007].
Stolt, M. H., M. H. Genthner, W. Lee Daniels, V. A. Groover, S. Nagle, and K. C. Haering. 2000. Comparison of Soil and Other Environmental Conditions in Constructed and Adjacent Palustrine Reference Wetlands. Wetlands 20:671-683.
Tan, K. H. 1996. Soil Sampling, Preparation, and Analysis. Marcel Dekker, Inc., New York.
Tiner, R. W. 1999. Wetland Indicators: A guide to wetlands identification, delineation, classification, and mapping. Lewis Publishers, Washington, D.C.
Tiner, R. 1991. The concept of a hydrophyte for wetland identification. Bioscience 41: 236-246.
USDA and NRCS. 2007. The PLANTS Database: Wetland Indicator Status. Available
Whistler, W. A. 1994. Wayside Plants if the Islands: A guide to the lowland flora of the Pacific Islands. Isle Botanica, Honolulu, Hawaii.
Wilke, B.M. 2005. Determination of Chemical and Physical Soil Properties. Pages 74-76 in R. Margensin and F. Schinner, editors. Manual of Soil Analysis. Springer.
140
Wilson, R. F. and W. J. Mitsch. 1996. Functional assessment of five wetlands constructed to mitigate wetland loss in Ohio, USA. Wetlands 16:436-451.
Zampella, R. A. and K. J. Laidig. 2003. Functional equivalency of natural and excavated coastal plain ponds. Wetlands 23:860-876.
Zedler, J. B. 1996. Ecological Issues in Wetland Mitigation: An Introduction to the Forum. Ecological Applications 6:33-37.
Zedler, J. B. and J. C. Callaway. 1999. Tracking Wetland Restoration: Do Mitigation Sites Follow Desired Trajectories? Restoration Ecology 7:69-73.