A quantitative flood risk analysis methodology for urban areas withintegration of social research data
I. Escuder-Bueno1, J. T. Castillo-Rodrıguez1, S. Zechner2, C. Jobstl2, S. Perales-Momparler3, and G. Petaccia4
1Universitat Politecnica de Valencia, Research Institute of Water and Environmental Engineering, Valencia, Spain2Graz University of Technology, Institute of Hydraulic Engineering and Water Resources Management, Graz, Austria3PMEnginyeria, Valencia, Spain4University of Pavia, Department of Civil Engineering and Architecture, Pavia, Italy
Received: 12 December 2011 – Revised: 24 July 2012 – Accepted: 30 July 2012 – Published: 12 September 2012
Abstract. Risk analysis has become a top priority for author-ities and stakeholders in many European countries, with theaim of reducing flooding risk, considering the population’sneeds and improving risk awareness. Within this context,two methodological pieces have been developed in the period2009–2011 within the SUFRI project (Sustainable Strategiesof Urban Flood Risk Management with non-structural mea-sures to cope with the residual risk, 2nd ERA-Net CRUEFunding Initiative). First, the “SUFRI Methodology for plu-vial and river flooding risk assessment in urban areas to in-form decision-making” provides a comprehensive and quan-titative tool for flood risk analysis. Second, the “Method-ology for investigation of risk awareness of the populationconcerned” presents the basis to estimate current risk from asocial perspective and identify tendencies in the way floodsare understood by citizens. Outcomes of both methods areintegrated in this paper with the aim of informing decisionmaking on non-structural protection measures. The results oftwo case studies are shown to illustrate practical applicationsof this developed approach. The main advantage of apply-ing the methodology herein presented consists in providinga quantitative estimation of flooding risk before and after in-vesting in non-structural risk mitigation measures. It can beof great interest for decision makers as it provides rationaland solid information.
1 Introduction
In the recent past, flooding from a wide range of sources(river, pluvial, coastal or maritime flood events) seemed tohappen more frequently with snowballing effects for thelandscape and society. In fact, one-third of the annual nat-ural disasters and economic losses and more than half of allvictims are flood related (Douben, 2006). In the period 1975–2001, floods due to drainage problems, flash floods and riverfloods accounted for 9 % of all deaths from natural disas-ters, claiming about 175 000 fatalities worldwide (Jonkman,2003). Furthermore, present requirements of residential andindustrial areas have resulted in new urban developments inflood prone areas, increasing risk to people and assets.
As a result, social demand for higher levels of safety hasbecome a major challenge for the governments of Europeancountries. Though safety is typically linked in engineeringto “existing margin to structural collapse”, when it comes toflooding, methodologies to support decision making shouldbe based on a much broader concept such as risk (societal,economic, etc.). This allows us to analyze the combined ef-fect of hazard and vulnerability so that the impact on riskof a wide range of options – from an increase of structuralsafety to a series of non-structural actions such as flood fore-casting, warning, emergency management, etc. – can be ac-counted. The SUFRI project (Sustainable Strategies of Ur-ban Flood Risk Management with non-structural measures tocope with residual risk, 2nd ERA-Net CRUE Funding Initia-tive) focused on non-structural measures and their impact inrisk reduction, including how they enhance social resilience.
Published by Copernicus Publications on behalf of the European Geosciences Union.
2844 I. Escuder-Bueno et al.: A quantitative flood risk analysis methodology integrating social research data
However, flood risk cannot be completely eliminated andthere will always remain a residual risk.
Additionally, under the EU Floods Directive 2007/60/EC(EC, 2007), a broad basis of knowledge and tools, as wellas improved strategies for flood risk management, are beingdeveloped. In particular, a key aspect of effective flood riskmanagement is the evaluation of the current situation and theeffect of implementing new measures.
In more detail, the need for strategies to improve flood riskmanagement requires the development of advanced warningsystems, vulnerability analysis and risk communication tooptimize emergency management (Baana and Klijna, 2004;Roos, 2006; Samuels et al., 2006; Sayers et al., 2002; Si-monovic, 1999; Graham, 1999).
This submission presents a comprehensive methodologyfor urban flood risk analysis integrating social research sur-vey data to support the study of non-structural measures. Theaim of this approach is to combine both technical and socialaspects to inform the decision-making process, showing theimpacts of such measures on economic and societal risk.
Two case studies, one focused on an application for a mu-nicipality affected by pluvial flooding (Benaguasil, Spain)and a second focused on an urban area (Lodi, Italy) affectedby river flooding, are also included to show how the method-ology can be applied and used.
2 Overall framework
This section describes the integration of social research datainto quantitative flood risk analysis in urban areas with theaim of prioritizing actions for flood risk reduction.
First, Sect. 2.1 summarizes a methodology for pluvial andriver flooding risk analysis in urban areas to inform decisionmaking, developed within the SUFRI project and describedin detail in its final report (Escuder-Bueno et al., 2011a). Sec-ond, Sect. 2.2 summarizes the conceptual basis and a shortdescription of the public opinion poll proposed in the project(Zechner et al., 2011) for estimating public risk awarenessand perception of non-structural measures. Next, Sect. 2.3presents the original approach for the integration of social re-search data into quantitative flood risk analysis and how theresults of opinion polls can be used to incorporate informa-tion into the analysis and evaluate the effect of non-structuralmeasures on flood risk reduction.
2.1 Quantitative flood risk assessment in urban areas
The methodology herein presented aims at combining the useof risk models andF–N plusF–D curves to provide a com-plete and quantitative tool for flood risk estimation (Escuder-Bueno et al., 2011b).
F–N curves are a graphical representation of the proba-bility of events causing a specified level of harm to a specificpopulation (IEC 31010).F–N curves show the cumulative
frequency (F ) at which N or more members of the popu-lation will be affected. Similarly,F–D curves show the cu-mulative frequency (F ) for each level of potential economicdamages (D).
This methodology can be applied for analysing any sourceof flood hazard, but it has been developed in detail for pluvialand river flooding. In addition, the methodology could be ap-plied not only to urban areas but also to flood risk analysis atdifferent scale levels (e.g. a number of municipalities withinthe flooded area of a river course, regional level, etc.).
2.1.1 Basis
TheF–N andF–D curves are quantitative and comprehen-sive tools for estimating flood risk in a certain area. TheF–N
curve presents the cumulative annual exceedance probabilityof the expected estimated level of potential fatalities and thearea under the curve corresponds to total societal risk. TheF–D curve illustrates the estimated level of economic dam-ages and the area under the curve represents economic risk.
These curves are a useful way of presenting risk infor-mation that can be used by managers and system designersto help decision making about risk (IEC 31010), and theyare appropriate for comparison of risks from different sit-uations when sufficient data is available, such as the com-parison between the situation with and without a number ofnon-structural measures.
At this point, a short clarification on the definition of non-structural measure is given. In contrast to structural mea-sures, the term “non-structural measure” is not clearly speci-fied and often used ambiguously. The project FLOOD-ERA(1st CRUE ERA-Net Funding Initiative) analyzed and com-pared existing concepts and proposed a new systematiza-tion of structural and non-structural measures (CRUE, 2009;Schanze et al., 2008). Following this systematization, struc-tural measures are considered as any intervention in the floodrisk system based on (structural) works of hydraulic engi-neering. As a result, non-structural measures are all otherinterventions, mainly focused on acting on potential conse-quences.
Figure 1 shows theF–D curve for a hypothetic urbanarea as an example (Escuder-Bueno et al., 2010). This figuredepicts the effect of structural and non-structural measureson flooding risk, using typical (but fictitious) values in bothaxes (annual exceedance probability and estimated economicdamages) that have to be properly estimated for each partic-ular case.
Three different curves are presented in Fig. 1: first, the sit-uation without any protection measures (dashed line); sec-ond, the situation of the study area with structural measuressuch as drainage systems, dikes, small and large dams (solidline); and, finally, the situation with both structural and non-structural measures (dotted line).
Depending on what kind of structural measure is consid-ered, theF–N or F–D curve will capture a decrease in the
I. Escuder-Bueno et al.: A quantitative flood risk analysis methodology integrating social research data 2845
Fig. 1.Effect of structural and non-structural measures on theF–D curve (Escuder-Bueno et al., 2010).
annual probability of exceedance (e.g. drainage systems), anincrease in the estimated consequences (e.g. breakage of alarge dam or levee), or any other change in the frequency ormagnitude of the alternative being analyzed. Moreover, theF–N andF–D curves capture the impact of non-structuralmeasures on flood consequence reduction. Consequently,these curves are the basis of the presented methodology forquantitative flood risk analysis in urban areas.
Based on the definition of theF–N or F–D curves as therepresentation of the annual cumulative exceedance proba-bility of a certain level of consequences, both societal andeconomic risk can be represented in terms of potential fatal-ities or economic damages, respectively.
On the one hand, societal risk can be obtained by estimat-ing potential fatalities based on guidelines found in the liter-ature (e.g. Graham, 1999; DHS, 2011a, b; Penning-Rowsellet al., 2005). In general, these guidelines focus on estimatingthe population at risk, the population exposed to the floodand fatality rates that are coupled with flooding simulations(peak discharges, arrival wave times, water depths, veloci-ties, flooded areas, etc.).
On the other hand, economic risk can be obtained byestimating potential economic damages from flooded ar-eas, land-use values and depth-damage curves. These curvesprovide an expected percentage of damages in households,buildings, vehicles, etc. (e.g. COPUT, 2002; Dawson, 2003;Scawthorn et al., 2006) for a certain flood depth. Conse-quently, extent of flooded areas, reference costs for affectedassets and depth-damage curves are used to estimate directcosts. Estimation of indirect costs (e.g. Messner et al., 2007)requires detailed information of the urban area (e.g. loss ofproduction, traffic disruption, costs of emergency services,etc.). In general, indirect costs may be estimated as a per-centage of direct costs based on local characteristics. A more
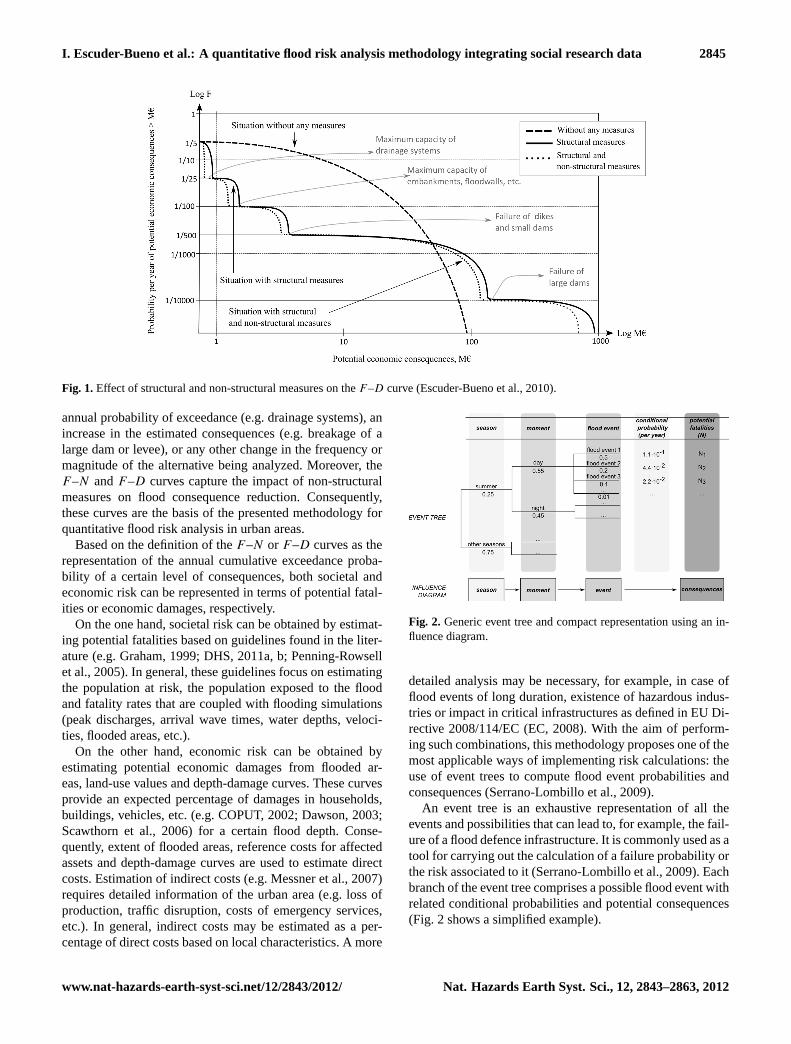
Fig. 2. Generic event tree and compact representation using an in-fluence diagram.
detailed analysis may be necessary, for example, in case offlood events of long duration, existence of hazardous indus-tries or impact in critical infrastructures as defined in EU Di-rective 2008/114/EC (EC, 2008). With the aim of perform-ing such combinations, this methodology proposes one of themost applicable ways of implementing risk calculations: theuse of event trees to compute flood event probabilities andconsequences (Serrano-Lombillo et al., 2009).
An event tree is an exhaustive representation of all theevents and possibilities that can lead to, for example, the fail-ure of a flood defence infrastructure. It is commonly used as atool for carrying out the calculation of a failure probability orthe risk associated to it (Serrano-Lombillo et al., 2009). Eachbranch of the event tree comprises a possible flood event withrelated conditional probabilities and potential consequences(Fig. 2 shows a simplified example).
2846 I. Escuder-Bueno et al.: A quantitative flood risk analysis methodology integrating social research data
Within the event tree framework, risk models are proposedto perform the analysis by using a simplified scheme or influ-ence diagram that includes all necessary information to de-velop the event tree and characterize flood risk.
Consequently, influence diagrams are a compact concep-tual representation of the logic of a system. In its mostgeneric form, an influence diagram can be any graphic repre-sentation which includes the relationships between possibleevents (loads), state and response of the system, and conse-quences. An influence diagram offers a visual representationof the risk model, in which each variable is represented by anode and each relationship by an arc.
In particular, the iPresas software (Serrano-Lombillo et al.,2009) has been used to carry out risk calculations. Influencediagrams are built instead of directly using event trees, pro-viding a clear, concise and visual workflow. The software al-gorithm transforms influence diagrams into event trees and itcan be used for any problem that may arise in the field of riskanalysis.
The methodology here summarized (presented in Escuder-Bueno et al., 2011b) is flexible enough for performing differ-ent risk models as required in any urban area.
2.1.2 Phases to apply the methodology
Phase I – Scope of the case study
This phase consists of properly defining the scope of thestudy and the required level of detail, with focus on dataand time requirements to perform the risk model and calcu-lations.
Phase II – Review of available data
The level of uncertainty in risk estimations will depend onavailable information (data collection, site visits, etc.). Theanalysis may include a wide range of studies such as seasonaland daily variations in population, value of assets, land-usedistribution, flood prone areas, hydraulic and hydrologicalstudies.
Phase III – Study of the system situation: definition of theBase Case
Before analysing non-structural measures, it is necessary tostudy the current situation of the urban area (defined as BaseCase). The risk model of the Base Case considers the range ofpossible flood events due to different load scenarios, includ-ing the potential failure of all existent infrastructures (e.g.levees, dikes, dams, drainage system, etc.).
Phase IV – Flood events
Once the proper range of flood events to be considered in theanalysis is established, each of these events, characterized bya certain annual probability of exceedance, will be linked to
conditional probabilities and potential consequences throughthe risk model.
Phase V – Risk model architecture
The risk model comprises three generic parts or categories ofinformation: loads, system response and consequences. First,“loads” refers to nodes with information on load scenarios(e.g. if a dam is located upstream of the urban area, it in-cludes data on floods, previous water pool levels, gate reli-ability and flood routing); next, “system response” includesnodes with information on failure and non-failure cases offlood defence systems; and finally, “consequences” includespotential economic damages and fatalities.
Phase VI – Input data for the risk model
Information from hydrological studies of the catchment area,analyses of system response (failure modes, hydraulic char-acteristics of the flood, etc.), and estimations of life-loss andeconomic damages are used as input data to calculate societaland economic risk.
First, life-loss is estimated following different methods forpluvial and river flooding (Escuder-Bueno et al., 2011a), but,in general, the number of potential fatalities is obtained bymultiplying population at risk times the fatality rate for eachevent resulting in flooding. Second, economic losses are as-sessed by identifying homogenous areas, defining referencecosts, and estimating percentages of damage, etc. to calculatedirect and indirect costs (e.g. COPUT, 2002).
Phases VII and VIII – Risk calculation and developmentof F–N curves
All flood events and potential consequences are implementedinto the risk model to provide values of societal and eco-nomic risk (Phase VII). Then, series of annual probabilityof exceedance for each value of consequences (loss of life oreconomic losses) are obtained to representF–N andF–D
curves (Phase VIII). Thus, societal and economic risk can becalculated and represented.
Phase IX – Risk evaluation
Societal and economic risk can be potentially evaluated bycomparing results with existing tolerability criteria or stan-dards when available.
Phase X – Study of non-structural measures
Non-structural measures cover a wide spectrum of differentactions like, for instance, warning tools, flood proofing andplanning instruments (Schanze et al., 2008). In this paper,existing non-structural measures for flood risk reduction areclassified into four main groups:
I. Escuder-Bueno et al.: A quantitative flood risk analysis methodology integrating social research data 2847
– Public education (denoted as PE),
– Warning systems and emergency management (denotedas EM),
– Coordination between authorities and emergency ser-vices (denoted as CO),
– Communication to the public (denoted as CM).
Typically, these measures can have a significant impact onthe overall risk by diminishing consequences, both on livesand the economy.
Consequently, the methodology captures the effect of thepreviously mentioned four groups of non-structural protec-tion measures into existent flood severity understanding andrisk awareness of population at risk with the aim of charac-terizing the expected consequences. Therefore, a review ofprevious phases is required to estimate new potential con-sequences and the correspondingF–N or F–D profiles inorder to compare the Base Case with the situation after im-plementing such measures on risk reduction.
2.1.3 Impact of non-structural measures on potentialconsequences
This section summarizes how potential consequences are es-timated in pluvial and river flooding, including the impact ofnon-structural measures on this stage of the flood risk analy-sis.
Pluvial flooding
In pluvial flooding, potential consequences in terms of lossof life can be estimated as the combination of population ex-posed to the flood and fatality rates related to the character-istics of the flood. With that purpose, a classification of fiveflood severity levels (from S0, where low levels of victimsare expected, to S4, extreme severity) was established, basedon a set of data collected from literature review (Gomez andRusso, 2009; Reiter, 2001; Nanıa, 2002; Temez, 1991) in-cluding theoretical studies and experimental data. After rep-resenting all the available data together, five flood severitylevels were defined by the combination of different hydraulicparameters such as flood depth, velocity, dragging and slid-ing parameters (Table 1 and Fig. 3).
Once each flood severity level had been defined based onhydraulic characteristics, fatality rates were obtained basedon the method proposed by Penning-Rowsell et al. (2005).This method focuses on the estimation of the total number ofpeople located in flood-prone areas, the proportion of thosepeople who are likely to be exposed to it, and those who maybe injured or killed.
With the aim of providing different fatality rates based onthe existence of warning systems and their impact on poten-tial loss of life, three different levels of flood warning are
Fig. 3. Flood severity levels for estimating consequences in pluvialflooding (Escuder-Bueno et al., 2011a).
considered. These levels are based on the three factors pro-posed by Penning-Rowsell et al. (2005) to characterize areavulnerability (flood warning, speed of onset and nature ofarea). Flood warning is captured by the FW parameter. Thisfactor score ranged from 1 to 3 depending on available warn-ing systems, which are characterized in terms of emergencyplanning, awareness and preparedness of the affected pop-ulation, and preparing and issuing flood warnings. Conse-quently, any urban area can be classified in one of the threecategories shown in Table 2 and linked to one of the threevalues of FW.
Table 2 lists the established categories concerning the ex-istence of flood warning systems: first, urban areas where nowarning systems are available; second, areas where warningsystems do exist, but their effectiveness cannot be ensured;and finally, areas with verified or advanced warning systems.Consequently, any urban area can be classified in one of thesethree different situations as shown in Table 2.
For each category (Cp1 to Cp3) and flood severity level(S0 toS4), fatality rates are estimated using mean values forbuilding typology, people vulnerability and the so-called areavulnerability factors (except for the FW parameter, Table 2).If other characteristics of the population are considered, fa-tality rates should be corrected following the guidelines givenin Penning-Rowsell et al. (2005). In addition, mean valuesof water depth and velocity were used for each flood sever-ity level to provide a reference value for each category,Cp,and flood severity level,S. Consequently, fifteen fatality rateshave been proposed as shown in Fig. 4.
River flooding
Flood hydraulic characteristics (e.g. water depths, velocities,rise-rate, flood areas, etc.) in river flooding differ from plu-vial flooding. As a result, different methods should be appliedto estimate potential consequences. Ten categories were es-tablished (Escuder-Bueno et al., 2011a) to assess potential
2848 I. Escuder-Bueno et al.: A quantitative flood risk analysis methodology integrating social research data
Table 1.Flood severity levels for estimating consequences in pluvial flooding (Escuder-Bueno et al., 2011a).
Flood severity levels Depth Velocity Dragging parameter Sliding parameterID (S) y (m) v (m s−1) vy (m2 s−1) v2y (m3 s−2)
S0 No victims are expected. People expected to survive. < 0.45 < 1.50 < 0.50 < 1.23
S1 Low severityPedestrians may suffer loss of stability. People in dan-ger.
< 0.80 < 1.60 < 1.00 < 1.23
S2 Medium severitySignificant loss of stability. Cars can lose road holding.Floating.
< 1.00 < 1.88 < 1.00 < 1.23
S3 High severityHigh risk for people outside.Low risk for buildings.
> 1.00 > 1.88 > 1.00 > 1.23
S4 Extreme severityStructural damages on buildings.
> 1.00 > 1.88 > 3.00 > 1.23
Table 2.Categories for defining fatality rates in pluvial flooding (Escuder-Bueno et al., 2011a).
FW parameterID Category Penning-Rowsell et al. (2005)
Cp1 No warning systems are available 3Cp2 Warning systems do exist but not used 2Cp3 Verified and advanced warning systems 1
Fig. 4.Fatality rates for pluvial flooding for each category and floodseverity level.
loss of life in urban areas in case of river flooding. This clas-sification of ten categories (C1 to C10) has been developeddepending on the existence of public education on flood risk,warning systems, risk communication, and coordination be-tween emergency agencies and authorities. It defines a cer-tain level of flood severity understanding for each category,linked to fatality rates based on a compilation of historicaldata and existing reference values on loss of life (Graham,1999; USBR, 2001). Consequently, different fatality ratesare considered for each category (C1 to C10) depending
on available warning times (from 0 to 24 h) and three floodseverity levels (Table 3). These three severity levels dependon characteristics of river flooding such as the peak dischargein the flooded area, mean annual peak discharge and extentof the flood (Graham, 1999). Thus, once the existing publiceducation, emergency management, communication and co-ordination systems are evaluated for the urban area, a certaincategory is used to associate fatality rates with the analyzedflood events. Accordingly, the analysis of a non-structuralmeasure (e.g. implementation of an Emergency Action Planfor Dams) will potentially result in a new category with re-spect to the Base Case.
2.2 Social research to investigate population riskawareness
2.2.1 Basis
Different groups are involved in the flood risk managementprocess. Alongside the task forces, the affected populationis asked to act in a proper way to reduce possible conse-quences of flooding. In this context, effective risk commu-nication plays a major role to initiate, support, maintain andkeep up the knowledge about flood reducing measures andadequate behaviour. To be able to design an effective com-munication plan for a crisis, the following factors must betaken into consideration: people’s behaviours, as well as their
I. Escuder-Bueno et al.: A quantitative flood risk analysis methodology integrating social research data 2849
Table 3.Fatality rates in case of river flooding (Escuder-Bueno et al., 2011a).
ID Category for the case study Warning timeFlood severity
(C) TW (h)(Sv)
High (3) Medium (2) Low (1)
C1
– There is no public education on flood risk terms.– No warning systems, no EAP (Emergency Action Plan).– There is no coordination between emergency agencies andauthorities.– No communication mechanisms to the public.
0 0.9 0.3 0.020.25 0.9 0.3 0.02
0.625 0.7 0.08 0.0151 – 0.06 0.0006
1.5 – 0.0002 0.000224 – 0.0002 0.0001
C2
– There is no public education on flood risk terms.– There is no EAP, but there are other warning systems.– There is no coordination between emergency agencies andauthorities.– No communication mechanisms to the public.
0 0.9 0.3 0.020.25 0.9 0.3 0.02
0.625 0.675 0.075 0.0141 – 0.055 0.00055
1.5 – 0.0002 0.000224 – 0.0002 0.0001
C3
– There is no public education on flood risk terms.– There is EAP, but it has not been applied yet.– Some coordination between emergency agencies and authori-ties (but protocols are not established).– No communication mechanisms to the public.
0 0.9 0.3 0.020.25 0.85 0.2 0.015
0.625 0.6 0.07 0.0121 – 0.05 0.0005
1.5 – 0.0002 0.000224 – 0.0002 0.0001
C4
– There is no public education on flood risk terms.– EAP is already applied.– Coordination between emergency agencies and authorities(there are protocols).– No communication mechanisms to the public.
0 0.9 0.3 0.020.25 0.75 0.15 0.01
0.625 0.5 0.04 0.0071 – 0.03 0.0003
1.5 – 0.0002 0.000224 – 0.0002 0.0001
C5
– There is no public education on flood risk terms.– EAP is already applied.– Coordination between emergency agencies and authorities(there are protocols).– Communication mechanisms to the public (not checked yet).
0 0.9 0.3 0.020.25 0.75 0.15 0.01
0.625 0.5 0.0375 0.00651 – 0.0275 0.000275
1.5 – 0.0002 0.000224 – 0.0002 0.0001
C6
– There is no public education on flood risk terms.– EAP is already applied.– Coordination between emergency agencies and authorities(there are protocols).– Communication mechanisms to the public.
0 0.9 0.3 0.020.25 0.75 0.15 0.01
0.625 0.475 0.035 0.0061 – 0.025 0.00025
1.5 – 0.0002 0.000224 – 0.0002 0.0001
C7
– Public education.– EAP is already applied.– Coordination between emergency agencies and authorities(there are protocols).– Communication mechanisms to the public.
0 0.9 0.3 0.020.25 0.65 0.1 0.0075
0.625 0.4 0.02 0.0021 – 0.01 0.0002
1.5 – 0.0002 0.000224 – 0.0002 0.0001
C8
– Public education.– EAP is already applied. It has been proved or used previously.– Coordination between emergency agencies and authorities(there are protocols).– Communication mechanisms to the public.
0 0.9 0.3 0.020.25 0.55 0.06 0.006
0.625 0.35 0.01 0.00151 – 0.005 0.00015
1.5 – 0.0002 0.0001524 – 0.0002 0.0001
C9
– Public education.– EAP is already applied. It has been proved or used previously.– High coordination between emergency agencies and authori-ties (there are protocols).– Communication mechanisms to the public.
0 0.9 0.3 0.020.25 0.55 0.06 0.006
0.625 0.35 0.008 0.00151 – 0.004 0.000125
1.5 – 0.0002 0.000124 – 0.0002 0.0001
C10
– Regular activities and plans for public education.– EAP is already applied. It has been proved or used previously.– High coordination between emergency agencies and authori-ties (there are protocols).– Communication mechanisms to the public.
0 0.9 0.3 0.020.25 0.5 0.03 0.005
0.625 0.3 0.005 0.0011 – 0.002 0.0001
1.5 – 0.0002 0.000124 – 0.0002 0.0001
Note: CategoryC7 also used for case studies which correspond to categoriesC8, C9 orC10 if dam break occurs with no-hydrologic scenario.
2850 I. Escuder-Bueno et al.: A quantitative flood risk analysis methodology integrating social research data
needs. In this respect, science currently provides us with lim-ited empirical data. Therefore, the questionnaire developedwithin the SUFRI project, as part of the “Methodology forinvestigation of risk awareness of the population concerned”(Zechner et al., 2011), provides empirical data on the sub-jective view of the citizens regarding flooding. Particular at-tention is paid to the desired communication and informa-tion before, during and after a flood (Grossmann and Seiser,2011).
With the standardized questionnaire, an appropriate instru-ment is available to investigate the risk awareness of the pop-ulation. For the survey, a written questionnaire in combina-tion with a personal hand-out and collection has been cho-sen. The written questionnaire provides the possibility to ob-tain a wide range of answers; it allows a higher level of sen-sitive questions due to the higher anonymity, which fostersthe honesty of answers, the respondent has more flexibilityto fill-out the questionnaire (e.g. time, reconsideration), andexternal effects through interviewer’s attitude and interpre-tation do not occur. The standardization of the questions andthe possibilities for answering facilitate the analysis and eval-uation of the level of flood risk awareness for a particular re-gion by using relevant survey practices. Since this method isless time consuming, the costs are lower.
The personal contact at the beginning improves the un-derstanding of the research request and leads to an increaseof the return rate, as well as the arrangement of a collectiontime and date, even if this is at the expense of a high degreeof anonymity.
The opinion poll consists of 69 questions and an addi-tional field where the respondent has the chance to give fur-ther comments (Grossmann and Seiser, 2011). To counteractthe limited answer possibilities, supplementary open ques-tions were added into the questionnaire. Questions are re-lated to natural hazards and floods, consequences of floodevents (physical, mental and financial), communication andinformation, as well as self-protection and individual precau-tions. In addition, aspects of the current warning situationand emergency management, along with level of informa-tion, are included.
However, it is important to keep in mind that the levelof awareness changes with the participation of people in theopinion poll.
2.2.2 Description
The methodology consists of four different phases:
Phase I – Preparation
Good preparation on defining the study area is the basis forthe success of the opinion poll. For example, the physicalmeasurement parameter for defining the number of house-holds can be related to a potential flood event, at least in therange of the 100-yr flood (this means that all the households
taken into consideration for the random sampling are situ-ated in the respective area of a 100-yr flood). A detailed de-mographic survey of the study area is necessary, i.e. socio-economic data collection, number of people to investigate,period of time for the survey, etc.
Besides the determination of these “hard facts”, consid-eration of “soft factors” is also important. Therefore, it isnecessary to make a survey of existing associations, citizens’initiatives, non-governmental organizations (NGOs), or othergroups who may be working in this field. Depending on thelocal circumstances, an involvement of these groups can beconsidered, or at least information about the scheduled opin-ion poll may be provided. To guarantee the success of theopinion poll and further use of the results, the local govern-ment has to be involved too.
The opinion poll is implemented at the scale of commu-nities (cities or villages) or counties to get a clear picture ofthe current risk perception, population requirements and theircooperativeness regarding flood protection measures.
Phase II – Procedure
Phase II consists of two main steps.
– Distribution: Questionnaires will be handed out face-to-face. The presentations of the questionnaire are con-ducted along a street or a certain area at different times.
– Collection: The type of collection of the questionnairesis selected depending on local circumstances (e.g. face-to-face, by mail, e-mail or fax).
Phase III – Analysis
The opinion poll is analyzed using a data base of all questionsand corresponding answers, including answers to open andclosed questions which can be statistically or qualitativelyanalyzed, respectively.
In this paper, the analysis has been qualitative. In futureworks, research on which statistical tools are more suitableto validate and extend the scope of the results should be un-dertaken.
In addition, hypothesis and connectivity testing of prede-fined questions for the following subjects has to be done (anexample is given for each subject):
– Risk awareness, self-protection and individual precau-tion (17 hypotheses);Hypothesis 1: The more knowledge people have aboutfloods, the higher the awareness about the residual riskand the willingness to take self-protection measures inthe future.
– Communication and information (9 hypotheses);Hypothesis 26: The younger the persons are, the morethey would like to retrieve (obtain) information from theinternet.
I. Escuder-Bueno et al.: A quantitative flood risk analysis methodology integrating social research data 2851
– Economic consequences of flood events/insurances (3hypotheses);Hypothesis 28: Those previously affected differ fromthose previously unaffected in their willingness to in-sure themselves against potential damages from catas-trophes in the future.
Consequently, a series of 29 hypotheses was developedin the project. These 29 hypotheses allow detailed analy-ses concerning correlations between different factors, whichmeans between two or more different questions, e.g. gen-der and knowledge concerning floods. These hypotheses aregenerally applicable, depending on results of questions (e.g.if there are enough answers for each correlated question).Also, these hypotheses should be statistically tested whendata from future surveys are available.
Phase IV – Follow-up activities
It is essential to present the results for those who supportedand took part in the opinion poll in Phase I (e.g. local gov-ernment, emergency services, citizens, citizens’ initiatives orNGOs). Thus, a positive effect can be obtained, and the pub-lic feels that their opinions are taken into account, whichcould lead to new approaches in flood risk management. De-pending on local circumstances and target groups, differentforms of communication can be used, e.g. assemblies, news-paper reports or presentations.
2.3 Integrating social research into quantitative urbanflood risk analysis
2.3.1 Basis
The existing risk awareness has to be analyzed to define theBase Case, not only with the aim of estimating current floodvulnerability of the urban area, but also to establish the basisfor analyzing how each non-structural measure will influencepotential consequences.
Thus, results of the proposed opinion poll in the previoussection will provide information to estimate current floodvulnerability and new case scenarios with non-structuralmeasures. These new case scenarios will be compared withthe Base Case to inform decision makers when prioritizingflood risk reduction actions.
For the integration of social research data into themethodology for quantitative flood risk analysis described inSect. 2.1, questions of the opinion poll are assigned to thefour main groups of non-structural protection measures de-fined in Sect. 2.1.2 or to an extra group which collects gen-eral information (e.g. age, gender, etc.). These groups are:
– General information (GO),
– Public education (PE),
– Warning systems and emergency management (EM),
– Coordination between authorities and emergency ser-vices (CO), and
– Communication to the public (CM).
Table 4 classifies all questions (from Q1 to Q69) into theaforementioned five groups and checkmarks the identifiedconnections between them and parameters defined within theoverall methodology for estimating potential consequences.
In pluvial flooding, loss of life depends on population atrisk (PAR) and the estimated fatality rates, based not onlyon the existence of warning systems, flood severity, area andpeople vulnerability, but also on the percentage of people ex-posed to the flood (f ). Hence, results of the survey will sup-port the estimation of factors shown in Table 4. In addition,the opinion poll provides information on current potentialeconomic costs (e.g. land-use values, indirect costs and theexpected reduction of damages by self-protection measures).
In river flooding, results of the opinion poll support the cat-egory selected from the classification described in Sect. 2.1.4(C1 to C10) related to different levels of flood severity un-derstanding depending on the four groups shown in Table 4(public education, warning systems and emergency manage-ment, coordination between actors (e.g. authorities, emer-gency services, etc.) and communication to the public).
2.3.2 Evaluation of non-structural measures
The abovementioned four groups of non-structural protectionmeasures are included in this section to describe how to in-tegrate new information into the risk model (in Phase X). Atthis point, results of social research will provide informationto incorporate the change in risk awareness into the modelwith the aim of assessing the impact on flood risk reduction.
– Public education (PE):
Public education programmes can reduce flood risk con-siderably. A better knowledge of the existing risk, emer-gency management practices, sources of risk, protectivemeasures and procedures in case of flooding can re-duce potential flood consequences. An increase in pub-lic awareness can be either considered in the analysis asa better flood severity understanding, that is, as a highercategory (C1–C10) for estimating potential fatalities inriver flooding, or as a reduction on population at risk orthe percentage of people exposed to the flood due to amore effective response and more rapid evacuation pro-cesses.
– Warning systems and emergency management (EM):
The purpose of a flood system is to provide warning onimpending flooding and help flood management agen-cies and the members of flood-prone communities tounderstand the nature of developing floods so that theycan take action to mitigate the flood’s effects. A floodwarning system is made up of a number of components
Note:Q = question of the opinion poll, PAR= population at risk,f = percentage of people exposed to the flood,Cp = category for defining the range of fatality rates inpluvial flooding, PD= percentage of damages in assets, CI= indirect costs, WT= warning time;C = category for defining the range of fatality rates in river flooding,GO= General information; PE= Public education; EM= Warning systems and emergency management; CO= Coordination, and CM= Communication to the public.
which must be integrated. These components include(AEMS, 2009):
– monitoring of rainfall and river flows that may leadto flooding,
– prediction of flood severity and the time of onset,
– interpretation of the prediction to determine floodimpacts,
– construction of warning messages describing whatis happening and will happen, the expected impactand what actions should be taken,
– dissemination of warning messages,
– response to the warnings by involved agencies andcommunity members, and
– review of the warning system after flood events.
The improvement of the effectiveness of existent warn-ing systems or the implementation of advance systems
can increase the available warning time and the percent-age of people who receive the message during the floodevent. In addition, the improvement of emergency man-agement plans can reduce considerably potential con-sequences. In pluvial flooding, this can be assessed byusing a higher categoryCp related to the existence ofa warning system, and in river flooding by means of ahigher categoryC.
– Coordination between emergency agencies and authori-ties (CO):
A high level of coordination between emergency agen-cies and authorities will increase the effectivenessof flood emergency management. This will result inprompt responses, larger warning times and efficientevacuating procedures providing shelter and assistance.
I. Escuder-Bueno et al.: A quantitative flood risk analysis methodology integrating social research data 2853
Fig. 5. Example of risk information based on comparison ofF–D
curves obtained by integrating social research data into quantitativeflood risk assessment.
– Communication to the public (CM):
Risk communication is the basis for an effective floodrisk management. The combination of public educationand risk communication will provide information to thepublic, increasing risk awareness and decreasing vulner-ability.
Survey data can be considered for estimating potentialconsequences for the current situation or the impact of a non-structural measure (or set of measures) based on the relationsshown in Table 4. As an example, Fig. 5 shows theF–D
curves of a hypothetical analysis including four alternatives(the situation with only structural measures, and alternativesA, B, and C).
Results of the opinion poll can be used to estimate poten-tial consequences for each alternative. For example, if Alter-native A includes the existence of an advanced warning sys-tem which increases the available warning time from 1 to 2 hand the results of the survey show that citizens need less than1.5 h to take self-protection measures (such as waterstops,flood defence barriers, etc.), then the expected damages tohouseholds should be adapted to an evaluation of Alterna-tive A; consequently,F–D curves will differ from the casewith only structural measures to this alternative. Other out-comes of the survey, such as the confidence of people in lo-cal authorities, can be included in the estimation of potentialconsequences of other alternatives such as new emergencyprocedures or planning policies.
In conclusion, after evaluating the effect of a non-structural measure (or set of measures) on the estimation ofpotential consequences by including the evaluation of out-comes of a social research survey to characterize public riskawareness, the flood risk can be quantified to representF–N
andF–D curves. These curves can be used to analyze the im-pact of different measures on the magnitude and frequency ofconsequences. Conclusions of this comparison will supportdecision making in developing a proposal of non-structuralprotection measures.
3 Case studies: Benaguasil and Lodi
The integration of social research data into flood risk analy-sis has been applied to two case studies (Fig. 6), Benaguasil(Spain) and Lodi (Italy), as examples of pluvial and riverflooding, respectively. This section includes a short descrip-tion of both urban areas (Sect. 3.1), outlines results of thepublic opinion poll (Sect. 3.2) and their integration into riskanalysis (Sect. 3.3), and further, outlines conclusions to sup-port decision making on non-structural protection measures(Sect. 3.4).
3.1 Description
Benaguasil is located in the east of Spain, 20 km inland fromthe city of Valencia, placed in the catchment area of the TuriaRiver. The town is not affected by river floods as it is locatedfar from the river bed. Thus, flood risk is mainly due to plu-vial flooding as a result of the low capacity of the drainagesystem that reaches its maximum capacity with precipitationrates higher than 20 mm in a few minutes, flooding garages,ground floors, houses and roads.
The exceedance of the capacity of the drainage sys-tem produces flooding of basements and ground floors ofmany houses every year and, consequently, significant eco-nomic damages. Furthermore, new residential areas havebeen connected directly to the existing drainage system. Con-sequently, flooding problems have increased in the last years.
Lodi is located in the north of Italy, crossed by the AddaRiver with a dam located at Olginate 75 km upstream of thetown. The city of Lodi has been flooded during the last cen-tury 30 times (ten of these were caused by the main tribu-taries of Adda River, Brembo and Serio, in the 60’s). Themost recent flood event occurred in November 2002, with apeak discharge around 1800 m3 s−1 with an estimated returnperiod of 100 yr.
In both cases, flood risk has been analyzed in two situa-tions: first, the current situation of the urban area, and sec-ond, the situation with the implementation of non-structuralmeasures concerning public education and improved warn-ing systems.
3.2 Social research
In Benaguasil, 201 households with approximately 800 res-idents are located within the potential flooded area relatedto the 100-yr rainfall event. In June 2010, these householdswere considered for the survey. Interviews were carried outpersonally with a high return rate of 32 % (Zechner et al.,2011).
More women (64 %) than men (36 %) took part in theopinion poll (with a total of 33 interviewees). With anaverage age of 40 yr in this urban area, 92 % of the re-spondents were older than 30 yr, with a percentage of 21 %older than 60 yr. There is a wide distribution of the highest
2854 I. Escuder-Bueno et al.: A quantitative flood risk analysis methodology integrating social research data
Table 5.Excerpt of questions (Q) and hypotheses (H) chosen for the analysis of Benaguasil and Lodi case studies referring to two groups ofnon-structural measures: public education (PE) and communication to the public (CM).
ID Question/Hypothesis PE CM
Q5 How would you rate your personal knowledge about floods and their causes?X
Q22 How much time do you need to prepare sufficiently for a flood? X
Q24 How would you like to obtain information in case of a flood event? X
Q25 Rate the following statements: I can assess flood risk well; Due to a lack ofinformation, the feeling of insecurity may arise; . . .
X
Q26 How reasonable are the following means of communication to keep oneselfinformed on a regular basis about flood issues: . . .
X
Q28 How well informed did you feel during the last flood event? X
Q29 How long did it take between the first warnings and the onset of the flood? X
Q30 This time span was . . . X
Q36 Do you know concrete measures to protect yourself in case of flood? X
Q38 Where have you learned about these measures? X
H6 The estimated meaningfulness of self-protection measures and the willingnessto take self-protection measures in the future depend on information access.
X
H19 Dependent on the level of education, the need for information differs in case offloods.
X
H26 The greater the knowledge of a person with regard to floods, the shorter thenecessary time span in order to be prepared sufficiently for floods.
X
educational achievement, with 36 % finishing compulsoryeducation, 21 % professional training, 14 % upper secondaryschool, and 21 % university.
In Lodi, 3000 residents are living in the area of the 100-yrflood (750 households). Within this group, every 3rd house-hold was interviewed in October and November 2010 per-sonally, resulting in a high return rate of 64 %.
More men (62 %) than women (38 %) took part in theopinion poll (with a total amount of 188 questionnaires). Inthis case, 98 % of the respondents were older than 30 yr, witha percentage of 43 % older than 60 yr. The highest educa-tional achievement in Lodi differs from those in Benaguasil,with 28 % of the interviewees of the former having finishedcompulsory education, 8 % professional training, 44 % uppersecondary school, and 14 % university.
With the aim of providing information for flood risk analy-sis and capturing the influence of the non-structural measuresregarding public education and improved warning systems, aset of questions of the opinion poll have been selected con-cerning two of the four groups identified in Sect. 2.1.2 (pub-lic education (PE) and communication to the public (CM)).
Table 5 shows selected questions and hypotheses re-garding Benaguasil and Lodi case studies from Jobstl etal. (2011). These questions have been related in this paperto the aforementioned groups: public education (PE) andcommunication to the public (CM). The three hypotheseslisted in Table 5 were obtained from data analysis of surveys.
Questions shown in Table 5 are then classified followingthe aforementioned two groups: public education (PE) andcommunication to the public (CM). Two examples of resultsof the opinion poll are also given in this section (Figs. 7 and8).
3.2.1 Public education (PE)
Question Q5 shows current risk perception and knowledge ofthe interviewed inhabitants of Benaguasil and Lodi. In bothcases, more than 65 % rate their knowledge about floods verygood, mostly good or somewhat good.
The general knowledge about flood risk and the individualperception of the risk was analyzed through the answers toquestion Q25 (Fig. 7).
The individual knowledge of floods and the associated riskpresented differences between both cases: whereas in Be-naguasil the majority (69 %) can evaluate flood risk well; inLodi, only 7 % agree with this. In addition, 68 % feel uncom-fortable because of missing information.
However, results of questions Q36 and Q38 (Table 5)show the knowledge about self-protection measures differsin these two case studies; in Benaguasil, 73 % of the re-spondents know such measures (83 % gain their knowledgefrom friends and relatives), as opposed to 38 % in Lodi(where only 34 % obtained information from relatives, asmost of the people in Lodi stated to have other informa-tion sources). Results in Benaguasil show that measures are
I. Escuder-Bueno et al.: A quantitative flood risk analysis methodology integrating social research data 2855
Fig. 6.Location of Benaguasil in Valencia (Spain) and Lodi in Lom-bardy (Italy).
estimated effective or very effective by 62 % of the respon-dents. Only a few think that these measures are little or not ef-fective (13.8 %). However, most of respondents are not will-ing to take self-protection measures in the future. On the con-trary, in Lodi self-protection measures are estimated not, lit-tle or partially effective by approximately 62 % of the respon-dents. Only a few think that these measures are very effective(24.5 %), but despite this low rate, approximately 80 % ofthose interviewed intend to take self-protection measures in
the future. These results show that the estimated meaningful-ness of self-protection measures may vary depending on thecase study and the willingness to take these measures in thefuture will depend on the information access (hypothesis H6,Table 5), risk perception and also on public education.
In addition to the aforementioned results, no difference re-garding the level of risk awareness had been found depend-ing on gender or level of education. However, the preferredmeans to obtain information depended on the level of educa-tion (hypothesis H19, Table 5).
3.2.2 Communication to the public (CM)
Due to the influence of warning systems on potential conse-quences, it is important to know, for example, public percep-tion of the required warning time to prepare self-protectionmeasures.
In Benaguasil, 89 % of interviewees considered that theywould need less than 2 h to prepare themselves sufficientlyfor a flood (questions Q22, Q29 and Q30, Fig. 8). However,in Lodi this only applies for 7 %. Nearly half of Lodi’s in-habitants believe they would need more than 6 h, but 53 % ofthem had only up to 0.5 h during the last flood, and 16 % be-tween 0.5 and 2 h. The available time between the first warn-ing and the onset of the flood was far too short for 82 % ofall interviewed people.
From results of these questions, it was concluded in bothcases that the greater the knowledge of a person with regardto floods, the shorter the time span needed to be preparedsufficiently is (H26, Table 5).
Regarding the influence of communication and warningsystems on risk reduction, it has to be considered which typesof communication are preferred by the public in order todevelop adequate communication strategies. On this point,there are significant differences between both cases (Table 5,question Q24); in Lodi, information by emergency services(85 %) and community or local councils (67 %) are preferred,but in Benaguasil most prefer to get information by the media(62 %) or Internet (31 %).
In Benaguasil, advertisements in the media (71 %) and on-site information centres (50 %) as well as websites on theInternet (46 %) are the preferred communication means tokeep oneself informed on a regular basis (see Table 5, ques-tion Q26). In Lodi, the analysis has not shown such a clearpicture, but on-site information centres (40 %) and advertise-ments in the media (37 %) are also preferred.
In addition, regarding the information provided to peopleduring last flood events, most of the interviewees felt verybadly informed (Table 5, question Q28), Lodi with 85 % andBenaguasil with 68 %.
2856 I. Escuder-Bueno et al.: A quantitative flood risk analysis methodology integrating social research data
Fig. 7. General knowledge about flood risk. Note:(a) I am familiar with the risk of flooding (Lodin = 176, Benaguasiln = 9); (b) floodis a high risk in comparison to other natural hazards (Lodin = 177, Benaguasiln = 11); (c) because of missing information, I start to feeluncomfortable (Lodin = 182, Benaguasiln = 14); (d) flood is not a danger for my life (Lodin = 178, Benaguasiln = 20); (e) I can evaluateflood risks well (Lodin = 176, Benaguasiln = 16).
3.3 Flood risk analysis
3.3.1 Benaguasil
Risk due to pluvial flooding has been assessed for Benaguasilby defining two analyses: first, the study of the current situ-ation (denoted as Base Case), and second, the effect of non-structural measures regarding a public education program onflood risk and the existence of warning systems (denoted asPFR+WS-Case).
On one hand, the public education program would includethe following aspects:
– Annual information campaigns and workshops for ac-tion forces and the public;
– Design of a website with updated information and ad-vice to the public;
– Regular publications in the local bulletin; and
– An information desk at the Town Council.
On the other hand, the components of the warning systemare:
– Daily reports at a specific information desk;
– Information on prediction or monitoring of rain-fall events provided by Civil Protection, the SpanishAgency of Meteorology or local services of the CityCouncil;
– Interpretation of the prediction (identification of the cor-responding level of meteorological risk alarm, vulnera-ble areas, and expected hydraulic characteristics);
– Specific warning messages describing what is happen-ing, the expected impact and what actions should betaken depending on the level of meteorological riskalarm;
– Dissemination of warning messages, transmitted bymeans of loudspeakers located at the urban area; and
– Annual drills and tests to verify efficiency of warningmessages.
Based on the connections provided in Sect. 2.3 to integratesocial research data into flood risk analysis (Table 4) withthe aim of evaluating the current situation (Base Case) andthe effect of non-structural measures (PFR+WS-Case), Ta-ble 6 shows the impact of results of social research data onthe estimation of potential fatalities for the case study of Be-naguasil.
I. Escuder-Bueno et al.: A quantitative flood risk analysis methodology integrating social research data 2857
Fig. 8. (a)Time to prepare for a flood;(b) time passed between warning and onset of flood, and(c) evaluation of the time span. Note:(a) Lodin = 181, Benaguasiln = 18; (b) Lodi n = 120, Benaguasiln = −, and,(c) Lodi n = 122, Benaguasiln = −.
Table 6. Integration of social research data into flood risk analysis to estimate potential consequences for the case study of Benaguasil.
BENAGUASIL
Inputs for risk analysis Public edu-cation (PE)
Communicationto the public(CM)
Base Case(current situation)
PFR+WS-Case(including non-structural measures)
PLU
VIA
LF
LOO
DIN
G
LOSS OF LIFE Population atrisk(PAR)
– – – –
People exposedto the flood(f )
X X People exposed to thefloodf = Pexp/PAR
People exposedto the flood0.5× f
Category(Cp)
– X Cp1 Cp3
ECONOMICDAMAGES
Percentage ofdamages(PD)
X X PD depends onwater depth
Reduction of PDbased on water depthand waterstops(y < 1.2 m)
Indirect costs(CI)
X X 27 % 27 %*
* Although public education and improved warning systems would in some cases reduce indirect costs, no differences are considered for the Benaguasil case.Note: PAR= population at risk;f = percentage of people exposed to the flood with respect to population at risk;Cp1 = category for defining fatality rates for the Base Case;Cp3 = category for defining fatality rates for the PFR+WS-Case; PD= percentage of damages to assets which depends on water depth and the effect of waterstops asself-protection measures; and CI= indirect costs as a percentage of direct costs.
2858 I. Escuder-Bueno et al.: A quantitative flood risk analysis methodology integrating social research data
– The population of Benaguasil is estimated to be11 144 inhabitants (2010). Combining daily and sea-sonal variations (approx. 200 people), four time cate-gories are established to estimate the population at risk.
– Seven flood events are defined, relating to maximumdaily rainfall rates and annual probabilities of ex-ceedance ranging from 2 to 100-yr return periods.
– Benaguasil is mainly divided into residential zones, ex-cept for an industrial area located in the south. Threeland uses are identified and related to different referencecosts to estimate economic damages.
– Runoff rates have been obtained for each flood eventbased on the Rational Method (Temez, 1991) adapted tourban catchments. Six catchments areas have been iden-tified, obtaining flooded areas and runoff coefficientsbased on land-use characteristics and the capacity of theexisting drainage network. Flood hydraulic characteris-tics are estimated to obtain flood severity levels and fa-tality rates, as well as the percentage of damages basedon depth-damage curves (COPUT, 2002).
– The effect of a public education programme on floodrisk and the existence of warning systems is analyzedbased on social research data as described in Table 6,defining the categoryCp3 (as a result of the existenceof warning systems), a reduction on the percentage ofpeople exposed to the flood (due to an improved floodseverity understanding), and establishing a reduction ofthe percentage of damages to households (i.e. a bet-ter knowledge of self-protection measures and higherwarning times will reduce economic damages, as it wasobtained from social research that citizens need approx-imately 2 h to prepare sufficiently for a flood).
As it has been described in Sect. 2.1, the required informa-tion for characterizing all possible flood events and potentialconsequences can be incorporated into a risk model. The in-formation needed to feed the model, given in Table 7, is re-lated to rainfall events, hydraulic characteristics of the flood,potential consequences in terms of loss of life and economicdamages, etc. Table 7 describes the categories of the infor-mation used for the case study of Benaguasil. Risk resultsare compared and represented in Figs. 9 and 10.
As potential fatalities in the case of river flooding are usu-ally higher than in pluvial flooding, in Benaguasil economicrisk has more significance than societal risk. However, thereis no doubt that public education and warning systems havean effect on risk reduction in bothF–N andF–D graphs.
3.3.2 Lodi
River flooding has been assessed for the Lodi case. Two anal-yses are defined: first, the study of the current situation withstructural measures (levees nearby the urban area, without
considering Olginate dam), denoted as Base Case, and sec-ond, the situation after the application of public educationand warning systems, denoted as PFR+WS-Case.
On one hand, the public education program, set by CivilProtection, would include the following aspects:
– Annual information campaigns at schools;
– Guidelines, updates and training courses for public ad-ministration workers and volunteers;
– Practical exercises to test the response of action forces;and
– Organization and coordination of volunteers groups.
On the other hand, specific procedures for communicationand warning would be applied, such as:
– Identification of potential flooded areas based on the“Program of the Hydrogeological Assessment (PAI)” ofPo River and all its tributaries, by the Po River Agencyin 2001;
– Definition of the “alarm” if the Po level reaches a spec-ified water level;
– Specific messages to be transmitted by fax to local au-thorities;
– Specific messages to the population to be displayed onspecific notice boards; and
– Specific messages to the population to be announced bysirens.
As it has been described for Benaguasil and based on theconnections provided in Sect. 2.3 to integrate social researchdata into flood risk analysis (Table 4), Table 8 shows the im-pact of results of social research data on the estimation ofpotential fatalities for the Lodi case.
Social research results revealed a medium–high level ofrisk awareness, but no public education campaigns have beenperformed yet. In addition, the available warning times inpast flood events were too short, and, consequently, categoryC5 for estimating potential loss of life has been consideredfor the Base Case.
Main aspects of the analysis for Lodi are summarized be-low:
– Daily and seasonal variability of the population in Lodi(42 737 inhabitants).
– Eight flood events for return periods from 2 to 500 yrwere used, based on flow measures recorded at four sta-tions in the basin to estimate flood wave characteristics(discharge vs. duration) and using the Gumbel and GEV(Generalized Extreme Value) probability distributionsto evaluate the discharges for an assigned return period.
I. Escuder-Bueno et al.: A quantitative flood risk analysis methodology integrating social research data 2859
Table 7.Categories of information for the case study of Benaguasil.
Category Content
General To incorporate daily variability of population: includes probabilities of flood occuring during the day or at night.
General To incorporate seasonal variability of population: includes probabilities of flood occuring in summer or winter.Four time categories are defined (TC1: summer/day, TC2: summer/night, TC3: winter/day, and TC4: winter-night).
Loads To incorporate rainfall events which result in pluvial flooding in the urban area; includes probabilities of occur-rence in terms of return periods (T ) and annual exceedance probabilities.
System response To incorporate hydraulic characteristics of the flood for each rainfall event; includes peak runoff rates (Q),water depths, velocities, and flooded areas.
Consequences To incorporate consequences in terms of potential loss of life depending on flood hydraulic characteristics, floodseverity levels, people exposed to the flood, and fatality rates. Relates number of potential fatalities (N ) to floodcharacteristics (Q) and time categories (TC).
Consequences To incorporate consequences in terms of potential economic damages depending on flood hydraulic character-istics, depth-damage curves, and land uses. Relates potential economic costs (CT) to flood characteristics (Q)and time categories (TC).
Table 8. Integration of social research data into flood risk analysis to estimate potential consequences in Lodi.
LODI
Inputs for risk analysis Public educa-tion (PE)
Communicationto the public(CM)
Base Case(current situa-tion)
PFR+WS-Case (includingnon-structuralmeasures)
RIV
ER
FLO
OD
ING
LOSS OF LIFE Population at risk(PAR)
– – – –
Warning Times(WT)
X X Values fromhydraulicstudies
Values fromhydraulicstudies*
Category(C)
– X C5 C9
ECONOMICDAMAGES
Percentage of damages(PD)
X X PD depends onwater depth
Reduction ofPD based onwater depthand waterstops(y < 1.2 m)
Indirect costs (CI) X X 20 % 10 %
* Despite the expected increase in warning times, no differences are considered for Lodi case due to the complexity of estimating its estimation for this case study.Note:C5= category for defining fatality rates for the Base Case (see Table 3);C9= category for defining fatality rates for the PFR+WS-Case; PD= percentage ofdamages in assets which depends on water depth and the effect of waterstops as self-protection measures (Parker et al., 2005); and CI= indirect costs as a percentage ofdirect costs.
– Flooded areas were computed by a 2-D-model basedon shallow water equations written in conservative form(Cunge et al., 1990).
– Two land-use categories are considered: residential andagricultural areas.
– Population at risk was decreased by a factor of 2.53 bytaking into account building typologies in Lodi.
– Economic losses were estimated by multiplying a refer-ence cost with the percentage of damages from ad hocdepth-damage curves based on data of the 2002 flood.
Input data needed to feed the risk model was related torainfall events, peak discharges at the river, hydraulic charac-teristics of the flood, potential consequences in terms of lossof life and economic damages, etc. The main differences withthe case study of Benaguasil concern the nature of the systemresponse, in particular to the hydraulic characteristics of the
2860 I. Escuder-Bueno et al.: A quantitative flood risk analysis methodology integrating social research data
Fig. 9.F–N curve for Benaguasil: pluvial flooding. Base Case andPFR+WS-Case.
Fig. 10.F–D curve for Benaguasil: pluvial flooding. Base Case andPFR+WS-Case.
flood due to river flooding, including water depths, veloci-ties, flooded areas and peak discharges at the river. Resultsare compared and represented in theF–N andF–D curvesshown in Figs. 11 and 12.
Figure 11 shows that theF–N curve for the PFR+WS-Case captures the effect on flood risk of the existence ofa public education programme and warning system. Duringthe 2002 flood, having an estimated return period of 100 yr,the existence of these non-structural measures would havereduced flood risk to one tenth.
Data from the Lodi Town Council stated that there were15 949 800C of damages during the 2002 flood. Figure 12illustrates that theF–D curve for the current situation showsa similar level of potential economic damages for the sameprobability of occurrence, and economic costs would be re-duced by implementing non-structural measures of publiceducation and warning (resulting in higher levels of self-protection and lower damages).
Fig. 11. F–N curve for Lodi: river flooding. Base Case andPFR+WS-Case.
Fig. 12. F–D curve for Lodi: river flooding. Base Case andPFR+WS-Case.
3.4 Decision making on non-structural protectionmeasures
The obtained results illustrate, in both case studies, theimpact on risk reduction of the implementation of non-structural measures concerning public education and warn-ing systems.
Results of social research have supported the estimationof inputs for the analysis, and help to identify the popula-tion’s needs and preferred communication means in order todevelop adequate communication strategies and campaignsproviding information to select adequate procedures and in-crease risk awareness.
In addition, social research supports the estimations car-ried out to perform alternative analyses by evaluating theexisting public awareness and the expected effect of publiceducation campaigns on flood severity understanding. Thus,the preferred communication means can be identified as pro-vided in Table 9 for the Benaguasil and Lodi cases.
I. Escuder-Bueno et al.: A quantitative flood risk analysis methodology integrating social research data 2861
Table 9.Preferred communication types in Benaguasil and Lodi case studies.
Benaguasil Lodi
Preferred information sourcein case of flooding
Advertisement in the mediaSites on the Internet
Emergency ServicesCommunity/Local councils
Preferred communication to keep oneselfinformed on a regular basis about flood issues
Advertisement in the mediaOn-site information centresSites on the Internet
Community/Local councilsEmergency services
Once social research results have been used to character-ize preferred means of information or communication to thepublic or other aspects of public risk awareness, differentnon-structural measures, strategies or alternatives for risk re-duction can be assessed by using the methodology describedin Sect. 2.1 and the resultingF–N andF–D curves.
At this point, it has to be remarked that probability esti-mates for different alternatives should be assigned by an ex-pert group/consultation based on results of social researchand the analysis of the current situation. Whether resourcesare available for that or if it has to be done through a smallergroup, detailed justification of the reason for such elicitationshould be clearly provided (Ayyub, 2001).
When quantitative risk results through alternative analysisare displayed usingF–N andF–D curves, it is possible tosee the noticeable impacts of the structural and non-structuralmeasures as compared to the current risk. This display of in-formation can help to support decisions regarding the defi-nition of information campaigns, warnings, and communica-tion procedures, etc.
As an example, in the Lodi case, further analyses haveshown that there is no significant relation between the knowl-edge of a person with regard to flood and the necessary timespan in order to be prepared sufficiently for floods. There-fore, reducing the flood risk only by setting public educa-tion measures may not have a direct impact on the necessarywarning time (i.e. although people know about the risk andthe possibility of self-protection measures, it does not reducethe necessary time for preparation). Increase of the warningtime also must be a part of emergency management (not onlyto know about the existence of measures, but also to knowhow to use them efficiently).
For further detail of justification of prioritization amongdifferent alternatives, proper indicators should be developed,e.g. following dam safety examples (Bowles, 2004; Mungeret al., 2009). This cost-effective approach will require a de-tailed budget of any alternative and the achieved risk reduc-tion. The annual economic risk reduction can be subtractedfrom the annual cost of the measure and then divided by thesocietal risk reduction, which is beyond the scope of thispaper (more case studies and measures would be needed),before a formal proposal on a cost-effective post-processinganalysis can be validated.
4 Conclusions and further research
This paper has presented an approach to integrate social re-search data into flood risk analysis with the aim of supportingdecision making on non-structural protection measures.
This approach is mainly focused on the application of twomethodological pieces developed within the SUFRI projectthat allow qualification of flood risk in urban areas, evaluat-ing different case scenarios in order to compare them withthe current situation and the impact of non-structural mea-sures on risk reduction.
Social research data analysis revealed the importance ofcommunication and information strategies as well as self-precaution and warning systems from the point of view ofaffected people. The development of public education, coor-dination, communication and emergency management strate-gies can be reinforced by the outcomes of opinion polls.
Furthermore, common tendencies in the individual floodrisk understanding between case studies have been analyzed(a data set of five case studies has been developed withinthe SUFRI project). However, some differences have beenfound, and this confirms clearly the need for a survey basedon the specific characteristics of the urban area, defining aspecial strategy for each case study. Though the scope of thiswork has been limited to qualitative analysis of the surveydata, emphasis should be given to statistical tools in the fu-ture so that their validity can be tested and the scope of theresults broadened.
The relevance of quantitative flood risk analysis in urbanareas is supported by results, indicating thatF–N andF–D
curves are a helpful and comprehensive tool to representflood risk.
Results of both case studies show that the impact of non-structural measures on flood risk can be addressed by thepresented approach. Outcomes obtained by flood risk analy-ses provide new information to support emergency planning.Hence, results and conclusions of the flood risk analysis inBenaguasil are now being used to develop the Municipal Ac-tion Plan against Floods, which will include organization andcommunication schemes, content and planning of informa-tion campaigns, procedures in case of emergency, and recom-mendations for an improved flood risk management. In theLodi case, results will support information campaigns andemergency management plans.
2862 I. Escuder-Bueno et al.: A quantitative flood risk analysis methodology integrating social research data
Further work needs to be done to estimate the economiccost of the proposed non-structural measures and their ef-ficiency. Flood risk analysis can support decision makingby providing information to prioritize risk reduction mea-sures. Thus, it is important to measure not only the impactbut also the efficiency of different non-structural protectionmeasures. Further research could be conducted to evaluatethe efficiency of these measures by defining indicators, suchas those found in the literature for dam safety management(ANCOLD, 2003).
In addition, it has to be remarked that equity is anotherfundamental principle from which alternatives can be priori-tized and tolerability of risk guidelines are derived (ICOLD,2005). It should be considered that there can be conflict inachieving equity and efficiency (Munger et al., 2009). Thus,the need for society to reduce flood risk cannot overcome therights of individuals to protect themselves and their interests.
Regarding those tolerability risk guidelines, due to differ-ent characteristics of each investigation area, little researchhas been conducted to establish standards for flood risk as-sessment in urban areas. Several individual and societal cri-teria can be found in the literature (Vrijling, 2001), but tol-erability guidelines on urban flood risk still need to be de-veloped. Further investigation should therefore concentrateon the basis and development of a common standard to as-sess urban flood risk, but also include recommendations onhow to adapt each particular case based on various aspects in-cluding location, public risk awareness, historical data, andimpact of flood damages at regional/national/internationalscale, etc.
Acknowledgements.The work described in this paper was sup-ported by the 2nd ERA-Net CRUE Funding Initiative, particularlyfunded by the Ministry of Science and Innovation of Spain and theFederal Ministry of Agriculture, Forestry, Environment and WaterManagement of Austria (Department 19B of the Government ofStyria, Torrent and Avalanche control).
Authors would like to express their gratitude to the City Council ofBenaguasil and the town of Lodi for their help and willingness tocollaborate on this work.
Edited by: A. ThiekenReviewed by: W. Lehman and three anonymous referees
References
AEMS: Commonwealth of Australia, Flood Warning, Manual 21,Australian Emergency Manuals Series, ISBN 978-1-921152-17-7, 2009.
Australian National Committee on Large Dams (ANCOLD): Incor-porated Guidelines on Risk Assessment, October 2003.
Ayyub, B. M.: Elicitation of expert opinions for uncertainty andrisks, CRC Press, 2001.
Baana, P. J. and Klijna, F.: Flood risk perception and implicationsfor flood risk management in the Netherlands, Int. J. River BasinManage., 2, 113–122, 2004.
Bowles, D. S.: ALARP Evaluation-Using Cost Effectiveness andDisproportionality to Justify Risk Reduction, Australian Na-tional Commission on Large Dams (ANCOLD) – Bulletin, 127,89–106, August 2004.
Conselleria d’Obres Publiques, Urbanisme i Territori (COPUT):Plan de Accion Territorial de Caracter Sectorial sobre Prevencionde Riesgo de Inundacion en la Comunidad Valenciana (PATRI-COVA), 2002 (in Spanish).
CRUE Research Funding Initiative: Synthesis Report No I-2009,Addressing the key findings of research, Risk Assessmentand Risk Management: Effectiveness and Efficiency of Non-structural Flood Risk Management Measures, Project ContractNo: ERAC-CT-2004-515742, 2009.
Cunge, J. A., Holly, F. M., and Vervey, A.: Practical aspects of Com-putational River Hydraulics, Pitman Publ. Inc, London, 1990.
Dawson, W. R.: Generic depth-damage relationships for residen-tial structures with basements, Economic Guidance Memoran-dum (EGM) 04-01, USACE, 2003.
DHS: Estimating Economic Consequences for Dam Failure Sce-narios, Dams Sector, US Department of Homeland Security,September 2011, 2011a.
DHS: Estimating Loss of Life for Dam Failure Scenarios, DamsSector, US Department of Homeland Security, September 2011,2011b.
Douben, K. J.: Characteristics of river floods and flooding: a globaloverview, 1985–2003, Irrigation Drainage, 55, S9–S21, 2006.
EC: Directive 2007/60/EC of the European Parliament and of theCouncil of 23 October 2007 on the assessment and managementof flood risks, 2007.
EC: Directive 2008/114/EC of the European Parliament and of theCouncil of 8 December 2008 on the identification and designa-tion of European critical infrastructures and the assessment of theneed to improve their protection, 2008.
Escuder-Bueno, I., Morales-Torres, A., and Perales-Momparler, S.:Urban Flood Risk Characterization as a tool for planning andmanaging. Workshop Alexandria, March 2010: Exploration ofTolerable Risk Guidelines for Levee Systems, Washington DC(USA), available at:www.ipresas.upv.es, www.sufri.tugraz.at,2010.
Escuder-Bueno, I., Castillo-Rodrıguez, J. T., Perales-Momparler,S., and Morales-Torres, A.: SUFRI methodology for pluvial andriver flooding risk assessment in urban areas to inform decision-making, SUFRI project, WP3, final report, July 2011, availableat:www.sufri.tugraz.at, 2011a.
Escuder-Bueno, I., Castillo-Rodrıguez, J. T., Perales-Momparler,S., and Morales-Torres, A.: A complete and quantitative tool forflood risk analysis in urban areas: river and pluvial flooding, Pro-ceedings UFRIM Conference, Graz (Austria), September 2011,2011b.
Gomez, M. and Russo, B.: Criterios de riesgo asociados a escor-rentıa urbana, Jornadas de Ingenierıa del Agua, 2009 (in Span-ish).
Graham, W. J.: A procedure for estimating loss of life caused bydam failure, DSO-99-06, US Department of Interior, Bureau ofReclamation, 1999.
I. Escuder-Bueno et al.: A quantitative flood risk analysis methodology integrating social research data 2863
Grossmann, G. and Seiser, T.: Final Report – Survey about riskawareness – SUFRI project, 2011 (unpublished report).
IEC/FDIS 31010, ISO International Standard: Risk management –Risk assessment techniques, IEC/FDIS 31010:2009 (E), 2009.
International Commission on Large Dams (ICOLD): Risk Assess-ment in Dam Safety Management: A Reconnaissance of Bene-fits, Methods and Current Applications, Bulletin130, 2005.
Jobstl, C., Zechner, S., Knoblauch, H., Pohl, R., Bornschein, A.,Natale, L., Petaccia, G., Escuder-Bueno, I., Castillo-Rodrıguez,J. T., Perales-Momparler, S., Morales-Torres, A., Bateman, A.,Medina, V., Dıaz, A., Grossmann, G., Kulmhofer, A., and Seiser,T.: SUFRI – Sustainable Strategies of Urban Flood Risk Man-agement with non-structural measures to cope with the residualrisk, Final Report, Graz 2011, available at:www.sufri.tugraz.at,2011.
Jonkman, S. N.: Global Perspectives on Loss of Human Life Causedby Floods, Nat. Hazards, 34, 151–175, 2003.
Messner, F., Penning-Rowsell, E., Green, C., Meyer, V., Tunstall, S.,and van der Veen, A.: FLOODSITE Evaluating flood damages:guidance and recommendations on principles and methods, Re-port T09-06-01, January 2007.
Munger, D. F., Bowles, D. S., Boyer, D. B., Davis, D. W., Margo,D. A., Moser, D. A., Regan, P. J., and Snorteland, N.: Interimtolerable risk guidelines for US Army Corps of Engineers dams.In USSD Workshop on the future of dam safety decision making:combining standards and risk, April 2009.
Nanıa, L.: Metodos de transformacion lluvıa-escorrentıa y de propa-gacion de caudales, Hidrologıa superficial y subterranea, Univer-sidad de Granada, 2002 (in Spanish).
Parker, D., Tunstall, S., and Wilson, T.: Socio-economic benefits offlood forecasting and warning, Flood Hazard Research Centre,Middlesex University, Queensway, Enfield, EN3 4SF, London,UK, 2005.
Penning-Rowsell, E., Floyd, D., Ramsbottom, P., and Surendran,S.: Estimating injury and loss of life in floods: A deterministicframework, Nat. Hazards, 36, 43–64, 2005.
Reiter, P.: RESCDAM – Loss of life caused by dam failure, theRESCDAM LOL method and its application to Kyrkosjarvi damin Seinajoki, Water Consulting Ltd., 2001.
Roos, M.: Flood management practice in northern California, Irri-gation Drainage, 55, 93–99, 2006.
Samuels, P., Klijn, F., and Dijkman J.: An analysis of the currentpractice of policies on river flood risk management in differentcountries, Irrigation Drainage, 55, 141–150, 2006.
Sayers, P. B., Hall, J. W., and Meadowcroft, I. C.: Towards risk-based flood hazard management in the UK, Proceedings of ICE-Civil Engineering 150 May 2002, 36–42, Paper 12803, 2002.
Scawthorn, C., Flores, P.; Blais, N., Seligson, H., Tate, E., Chang,S., Mifflin, E., Thomas, W., Murphy, J., Jones, C., and Lawrence,M.: HAZUS-MH flood loss estimation methodology, II: Damageand Loss Assessment, Nat. Hazards Rev., 7, 72–81, 2006.
Schanze, J., Hutter, G., Olfert, A., Penning-Rowsell, E.C., Parker,D., Harries, T., Werritty, A., Nachtnebel, H., Holzmann, H.,Neuhold, C., Meyer, V., Kuhlicke, C., Schildt, A., Jessel, B., andKoniger, P.: FLOOD-ERA Joint Report, CRUE Research ReportNo I-1: Systematisation, evaluation and context conditions ofstructural and non-structural measures for flood risk reduction,Project Contract No: ERAC-CT-2004-515742, 2008.
Serrano-Lombillo, A., Escuder-Bueno, I., de Membrillera-Ortuno,M. G., and Altarejos-Garcıa, L.: iPresas – Software for risk anal-ysis, 23rd International Congress on Large Dams, Brasilia, 2009.
Simonovic, S. P.: Social criteria for evaluation of flood control mea-sures – Winnipeg case study, Urban Water, 1, 167–175, 1999.
Temez, J. R.: Extended and Improved Rational method, HighwaysAdministration of Spain, XXIV Congress Madrid Edition, 1991(in Spanish).
US Bureau of Reclamation (USBR): Risk Based Profiling System,Technical Service Center, 2001.
Vrijling, J. K.: Probabilistic design of water defence systems in TheNetherlands, Reliab. Eng. Syst. Safe., 74, 337–344, 2001.
Zechner, S., Jobstl, C., and Knoblauch, H.: SUFRI Methodologyfor investigation of risk awareness of the population concerned,SUFRI project, WP4, final report, December 2011.