A question • Homophily: similar nodes ~= connected nodes • Which is cause and which is effect? – Do birds of a feather flock together? (Associative sorting) – Do you change your behavior based on the behavior of your peers? (Social contagion) – Note: Some authors use “homophily” only for associative sorting, some use it for observed correlation between attributes and connectivity.
Transcript
A question
• Homophily: similar nodes ~= connected nodes• Which is cause and which is effect?
– Do birds of a feather flock together? (Associative sorting)
– Do you change your behavior based on the behavior of your peers? (Social contagion)
– Note: Some authors use “homophily” only for associative sorting, some use it for observed correlation between attributes and connectivity.
Associative sorting example
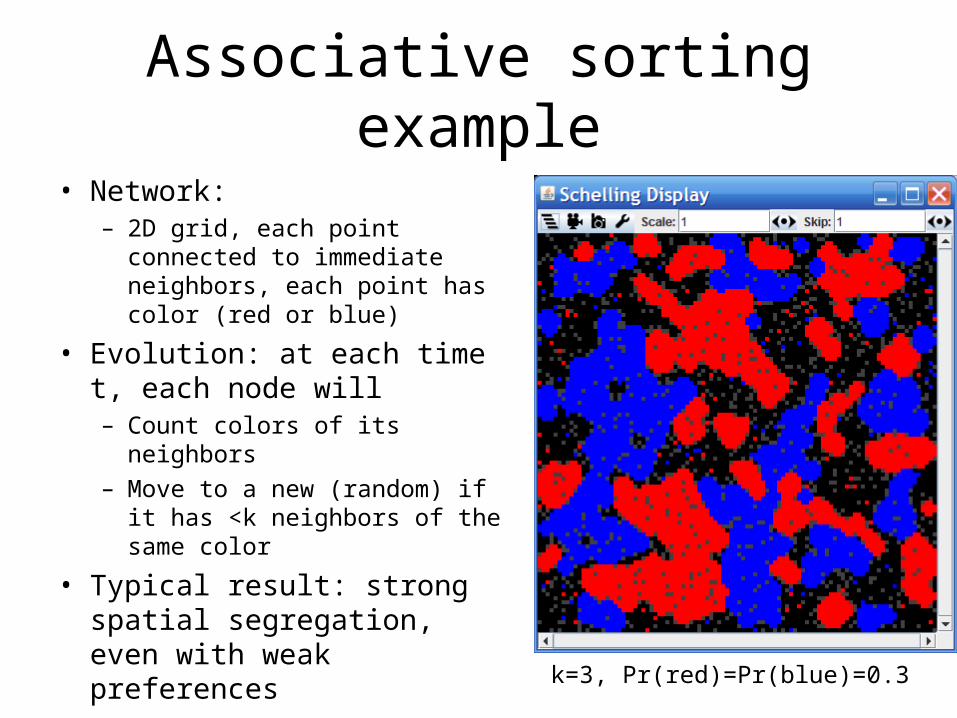
• Network: – 2D grid, each point connected
to immediate neighbors, each point has color (red or blue)
• Evolution: at each time t, each node will– Count colors of its neighbors– Move to a new (random) if it
has <k neighbors of the same color
• Typical result: strong spatial segregation, even with weak preferences
k=3, Pr(red)=Pr(blue)=0.3
Associative sorting example
k=3, Pr(red)=0.1, Pr(blue)=0.5 Same – neighborhoodSize=2
Social Contagion Example
• Lots of different reasons behavior might spread– Fads, cascades, …
• One reason: rational decisions made about products that have a “network effect”
• I.e., the benefits and costs of the behavior are not completely local to the decision-maker
• Example: PowerPoint, …• How can we analyze this?
– From Easley & Kleinberg’s text, ch 16-17– We’ll go into this more later on….
If v has d neighbors and p*d of them choose A, then v should chose A iff pda>-(1-p)db ie, iff p>=b/(a+b)
What if v is playing the game with many w’s ?
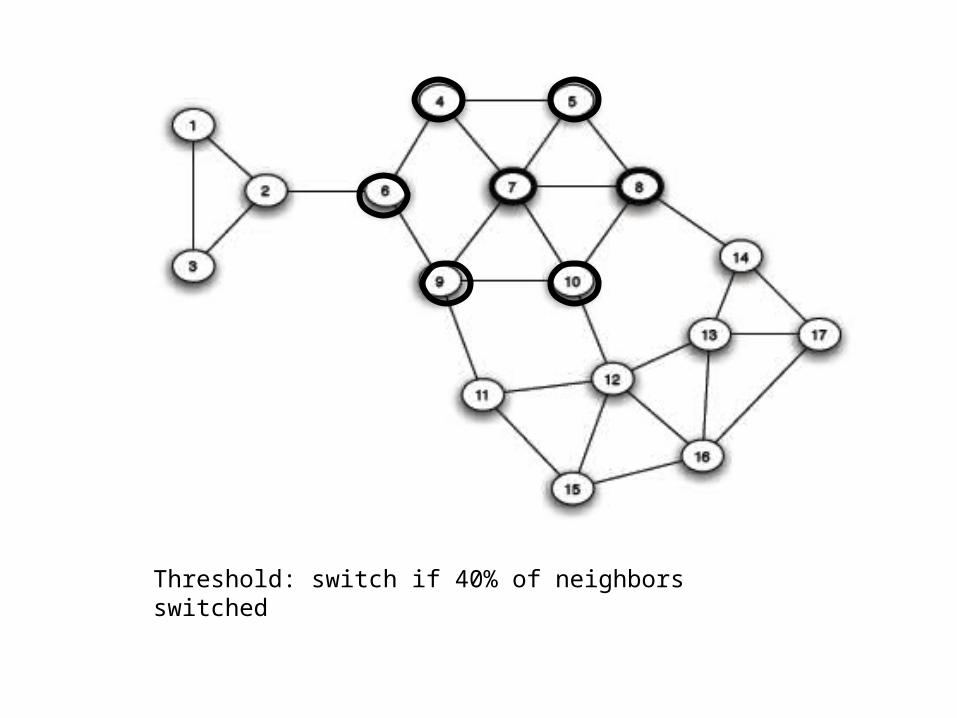
Threshold: switch if 40% of neighbors switched
Threshold: switch if 40% of neighbors switched
General claim: dense clusters are less susceptible to cascades.
Thinking it through
1. Close-knit communities can halt a cascade of adoptions
– Claim: a “complete cascade” happens iff there are no sufficiently close-knit clusters
2. A small increase in a/(a+b) might cause a big additional cascade.
3. Where the cascade starts might cause a big difference in the size of the cascade.
4. Marketing to specific individuals (e.g., in the middle of a cluster) might cause a cascade.
Thinking it Through
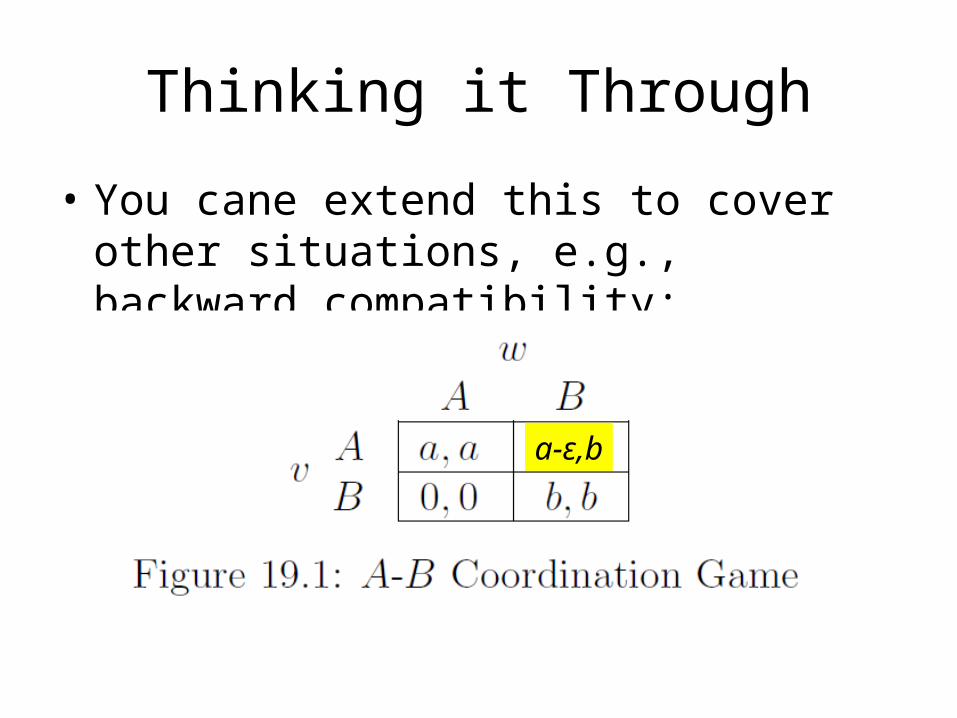
• You cane extend this to cover other situations, e.g., backward compatibility:
a-ε,b
A complicated example
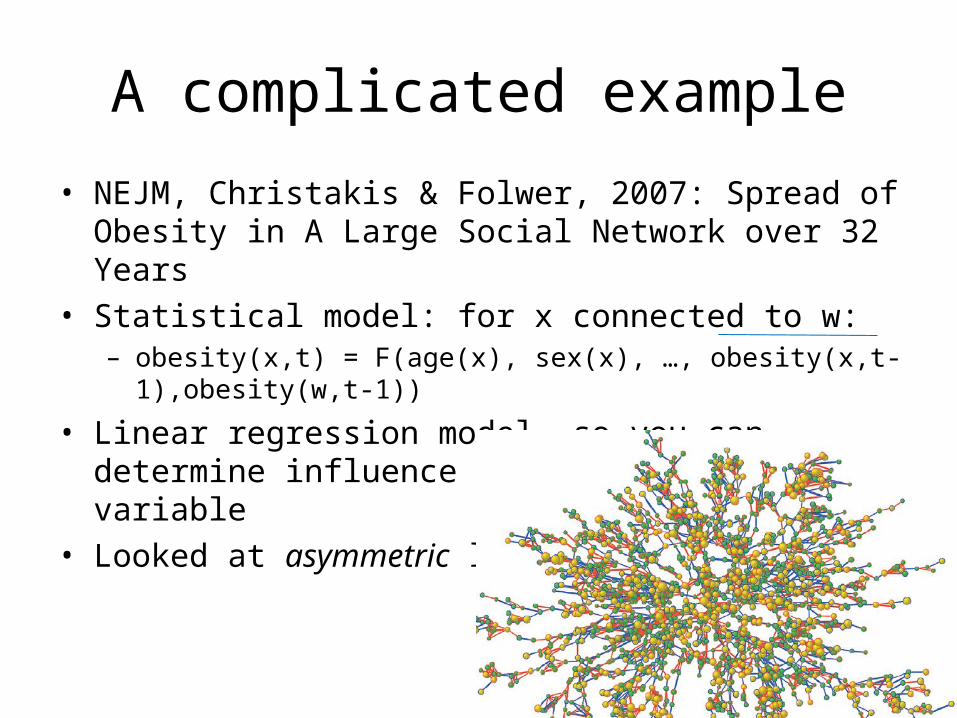
• NEJM, Christakis & Folwer, 2007: Spread of Obesity in A Large Social Network over 32 Years
• Statistical model: for x connected to w:– obesity(x,t) = F(age(x), sex(x), …, obesity(x,t-1),obesity(w,t-1))
• Linear regression model, so you can determine influence of a particular variable
• Looked at asymmetric links
A complicated example
A complicated example
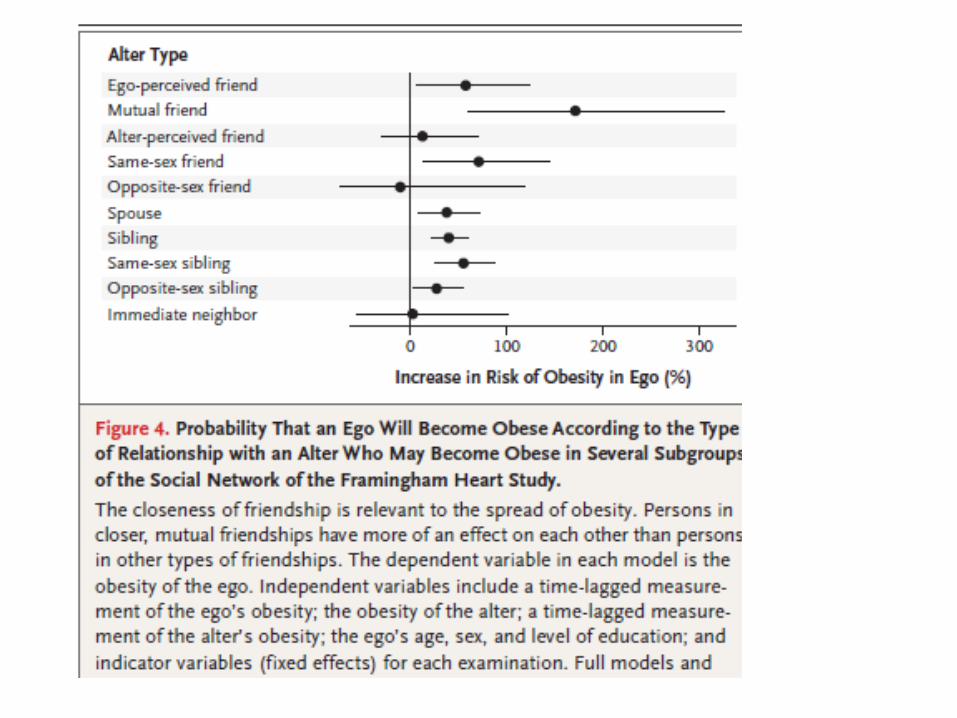
• NEJM, Christakis & Folwer, 2007: Spread of Obesity in A Large Social Network over 32 Years
• Statistical model: for x connected to w:– obesity(x,t) = F(age(x), sex(x), …, obesity(x,t-1),obesity(w,t-1))
• Linear regression model, so you can determine influence of a particular variable– But you’re tied to a parametric model and it’s assumptions
• Looked at asymmetric links– Seems like a clever idea but … what’s the principle here?
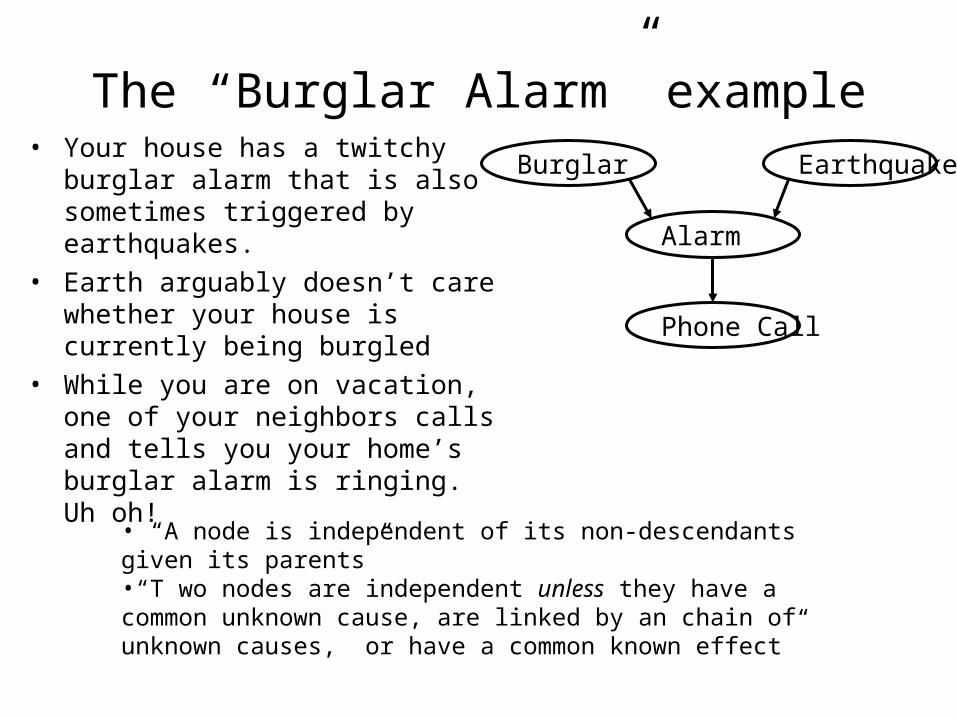
The “Burglar Alarm” example• Your house has a twitchy burglar
alarm that is also sometimes triggered by earthquakes.
• Earth arguably doesn’t care whether your house is currently being burgled
• While you are on vacation, one of your neighbors calls and tells you your home’s burglar alarm is ringing. Uh oh!
Burglar Earthquake
Alarm
Phone Call
• “A node is independent of its non-descendants given its parents”•“T wo nodes are independent unless they have a common unknown cause, are linked by an chain of unknown causes, or have a common known effect”
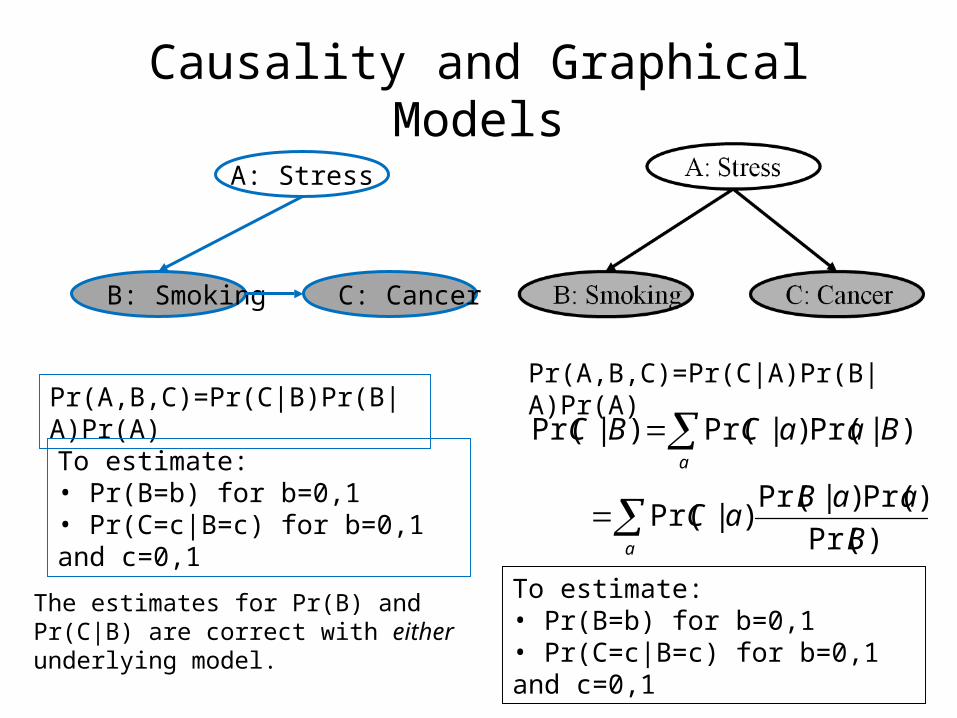
To estimate: • Pr(B=b) for b=0,1• Pr(C=c|B=c) for b=0,1 and c=0,1
a
a
B
aaBaC
BaaCBC
)Pr(
)Pr()|Pr()|Pr(
)|Pr()|Pr()|Pr(
To estimate: • Pr(B=b) for b=0,1• Pr(C=c|B=c) for b=0,1 and c=0,1
The estimates for Pr(B) and Pr(C|B) are correct with either underlying model.
Causality and Graphical Models
A: Stress
B: Smoking C: Cancer
These two models are not “identifiable” from samples of (B,C) only.
Def: A class of models is identifiable if you can learn the true parameters of any m in M from sufficiently many samples.
Corr: A class of models M is not identifiable if there are some distributions generated by M that could have been generated by more than one model in M.
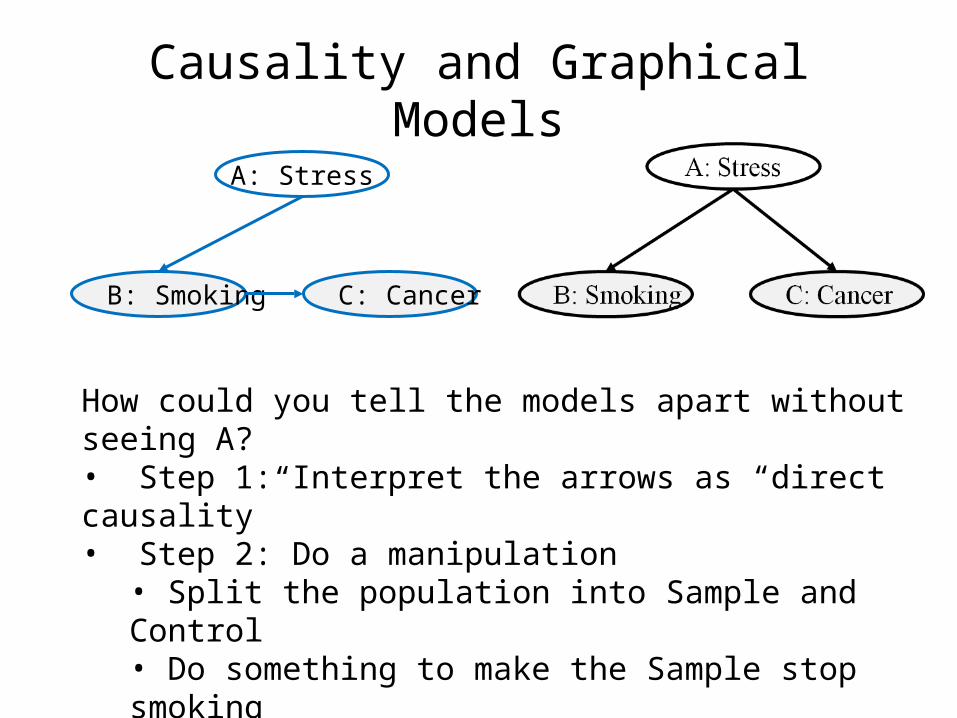
Causality and Graphical Models
A: Stress
B: Smoking C: Cancer
How could you tell the models apart without seeing A?• Step 1: Interpret the arrows as “direct causality”• Step 2: Do a manipulation
• Split the population into Sample and Control• Do something to make the Sample stop smoking• Watch and see if Cancer rates change in the Sample versus the control
A complicated example
• NEJM, Christakis & Folwer, 2007: Spread of Obesity in A Large Social Network over 32 Years
• Statistical model: for x connected to w:– obesity(x,t) = F(age(x), sex(x), …, obesity(x,t-1),obesity(w,t-1))
• Linear regression model, so you can determine influence of a particular variable
• Looked at asymmetric links
Not a clinical trial with an intervention
??
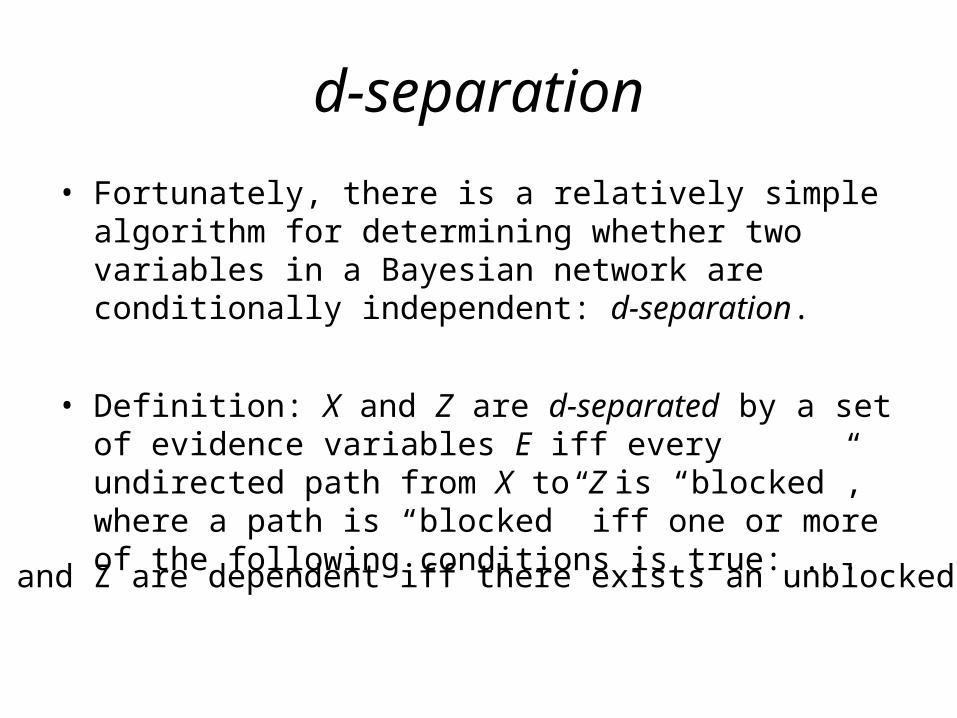
d-separation
• Fortunately, there is a relatively simple algorithm for determining whether two variables in a Bayesian network are conditionally independent: d-separation.
• Definition: X and Z are d-separated by a set of evidence variables E iff every undirected path from X to Z is “blocked”, where a path is “blocked” iff one or more of the following conditions is true: ...
ie. X and Z are dependent iff there exists an unblocked path
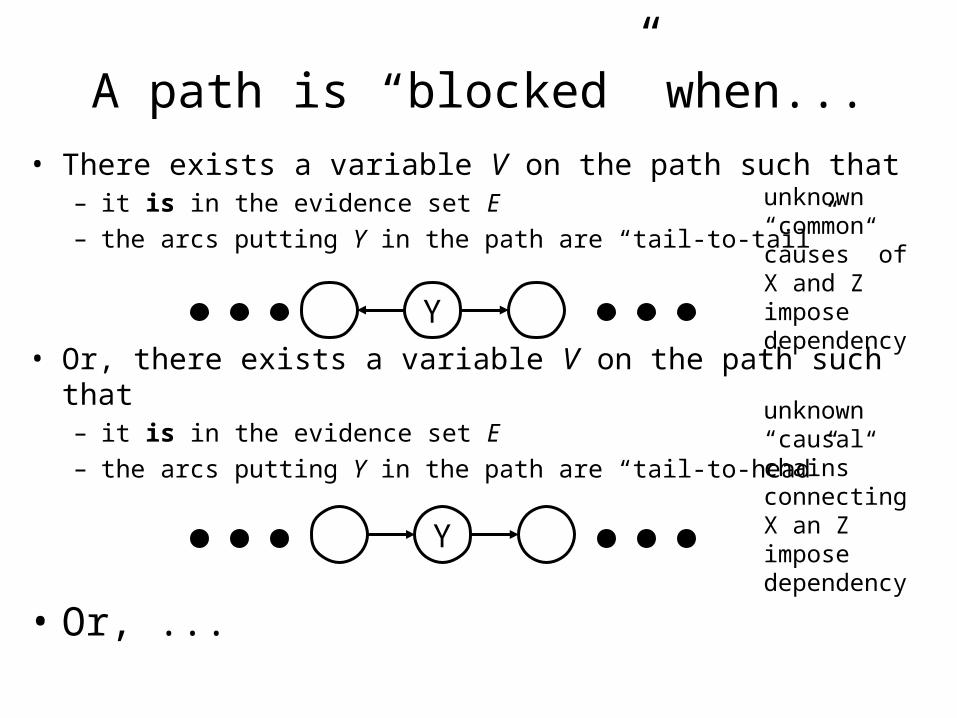
A path is “blocked” when...
• There exists a variable V on the path such that– it is in the evidence set E– the arcs putting Y in the path are “tail-to-tail”
• Or, there exists a variable V on the path such that– it is in the evidence set E– the arcs putting Y in the path are “tail-to-head”
• Or, ...
Y
Y
unknown “common causes” of X and Z impose dependency
unknown “causal chains” connecting X an Z impose dependency
A path is “blocked” when… (the funky case)
• … Or, there exists a variable V on the path such that– it is NOT in the evidence set E– neither are any of its descendants– the arcs putting Y on the path are “head-to-head”
Y
Known “common symptoms” of X and Z impose dependencies… X may “explain away” Z
• “A node is independent of its non-descendants given its parents”•“T wo nodes are independent unless they have a common unknown cause or a common known effect”
??
• Conclusion: • Y(j,t-1) influences Y(i,t) through latent homophily via the unblocked green path• There’s no way of telling this apart from the orange path (without parametric assumptions) – model is not “identifiable”
??
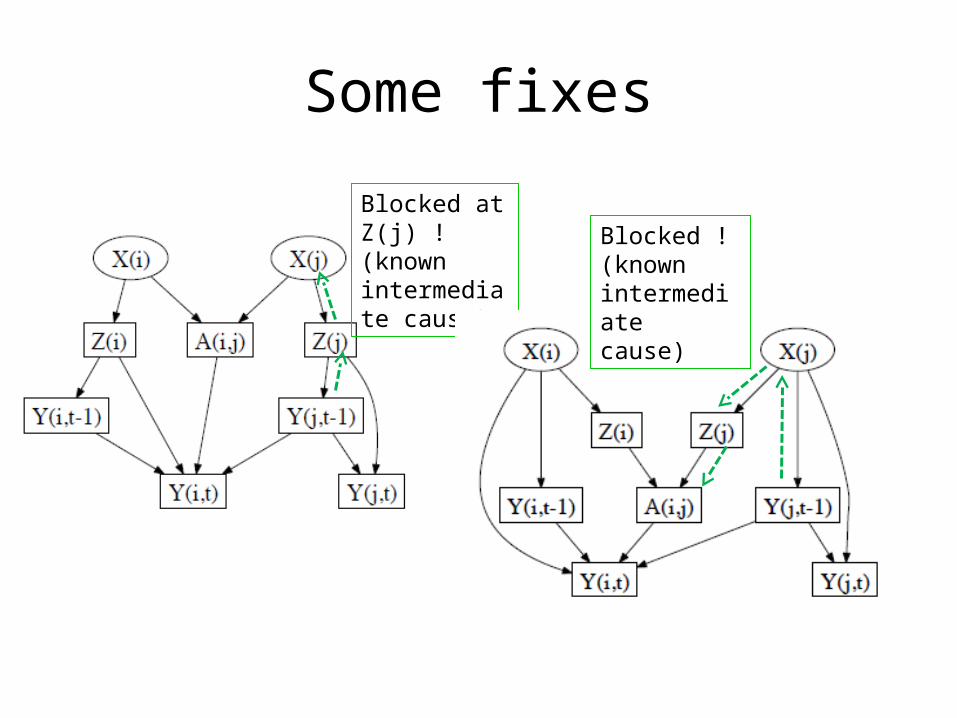
Some fixes
Blocked at Z(j) ! (known intermediate cause)
Blocked ! (known intermediate cause)
A consequence
One can instantiate this model to show the same effects observed by Christakis and Fowler … even though there is no social contagion
Assignment (due Fri 2/4): Write at least one wiki page describing a recent technical paper, and correctly link it to a dataset page and/or a methods page. If the dataset page and methods page don't exist, then create them as well.
Example pages: see http://malt.ml.cmu.edu/mw/index.php/Recent_or_influential_technical_papers_in_Analysis_of_Social_Media