International Journal of Computer Science & Engineering Survey (IJCSES) Vol.6, No.2, April 2015 DOI:10.5121/ijcses.2015.6202 11 A RISK-AWARE BUSINESS PROCESS MANAGEMENT REFERENCE MODEL AND ITS APPLICATION IN AN EGYPTIAN UNIVERSITY Mohamed H. Haggag 1 , Ayman E. Khedr 2 , Hend S. Montasser 2 1 Department of Computer Science, Helwan University, Cairo, Egypt 2 Department of Information Systems, Helwan University, Cairo, Egypt ABSTRACT Due to the environmental pressures on organizations, the demand on Business Process Management (BPM) automation suites has increased. This led to the arising need for managing process-related risks. Therefore the management of risks in business processes has been the subject of many researches during the past few years. However, most of these researches focused mainly on one or two stages of the BPM life cycle and introduced a support for it. This paper aims to provide a reference model for Risk-Aware BPM which addresses the whole stages of the BPM life cycle, as well as some current techniques are listed for the implementation of this model. Additionally, a case study for a business process in an Egyptian university is introduced, in order to apply this model in real-world environment. The results will be analyzed and concluded. KEYWORDS Risk-aware, Business Process Management, Business Process Management Systems, Risk Management. 1. INTRODUCTION Companies, nowadays, are facing many challenges running in today’s business environment, they need to be flexible, agile, and have a strong competitive advantage. Therefore they tend to automate their business processes and work on a process-oriented basis. Business Process Management Systems (BPMS) has proven a great success in automating business processes and managing the business processes as a whole. Those made many companies running in this environment adopt BPMS in order to be able to compete, monitor the performance, and reach efficiency. Business processes are exposed to different kinds of risks all the time. Risks could arise due to many reasons like a missed deadline; the costs have exceeded what has been planned, or a fraud case. Those risks could be a great danger for companies and it could threaten their existence. Therefore, researchers tend to integrate between BPM and risk management in a concept called Risk-Aware Business Process Management. Risk-aware Business Process management traces risk throughout the BPM life cycle, it should be able to identify risks related to business processes and analyze it during design stage which may be called Risk Prediction, also identify risk mitigation strategies, and monitor the emergence of risks during run time (risk detection). The logs produced from the execution of business processes should be analyzed and evaluated to be used in predicting the future risks.
Transcript
International Journal of Computer Science & Engineering Survey (IJCSES) Vol.6, No.2, April 2015
DOI:10.5121/ijcses.2015.6202 11
A RISK-AWARE BUSINESS PROCESS MANAGEMENT REFERENCE MODEL AND ITS APPLICATION IN AN
EGYPTIAN UNIVERSITY
Mohamed H. Haggag1, Ayman E. Khedr2, Hend S. Montasser2
1Department of Computer Science, Helwan University, Cairo, Egypt
2Department of Information Systems, Helwan University, Cairo, Egypt
ABSTRACT Due to the environmental pressures on organizations, the demand on Business Process Management (BPM) automation suites has increased. This led to the arising need for managing process-related risks. Therefore the management of risks in business processes has been the subject of many researches during the past few years. However, most of these researches focused mainly on one or two stages of the BPM life cycle and introduced a support for it. This paper aims to provide a reference model for Risk-Aware BPM which addresses the whole stages of the BPM life cycle, as well as some current techniques are listed for the implementation of this model. Additionally, a case study for a business process in an Egyptian university is introduced, in order to apply this model in real-world environment. The results will be analyzed and concluded. KEYWORDS Risk-aware, Business Process Management, Business Process Management Systems, Risk Management. 1. INTRODUCTION Companies, nowadays, are facing many challenges running in today’s business environment, they need to be flexible, agile, and have a strong competitive advantage. Therefore they tend to automate their business processes and work on a process-oriented basis. Business Process Management Systems (BPMS) has proven a great success in automating business processes and managing the business processes as a whole. Those made many companies running in this environment adopt BPMS in order to be able to compete, monitor the performance, and reach efficiency. Business processes are exposed to different kinds of risks all the time. Risks could arise due to many reasons like a missed deadline; the costs have exceeded what has been planned, or a fraud case. Those risks could be a great danger for companies and it could threaten their existence. Therefore, researchers tend to integrate between BPM and risk management in a concept called Risk-Aware Business Process Management. Risk-aware Business Process management traces risk throughout the BPM life cycle, it should be able to identify risks related to business processes and analyze it during design stage which may be called Risk Prediction, also identify risk mitigation strategies, and monitor the emergence of risks during run time (risk detection). The logs produced from the execution of business processes should be analyzed and evaluated to be used in predicting the future risks.
International Journal of Computer Science & Engineering Survey (IJCSES) Vol.6, No.2, April 2015
12
Most Researchers that attacked the field of Risk-Aware Business Process Management have concentrated their focus on analyzing risks at the design stage and how to integrate it in Business Process Modeling, only very few researchers wrote about detecting risks during execution of business processes (Run Time) and analyzing logs after the execution. Moreover, most of the approaches have not been validated by a case study or applied it in practice. That led to a big gap in this area of research. The aim of this research is to provide a reference model for risk-aware BPM that goes through the whole stages of BPM life cycle and provide some recommended techniques for its implementation. That is done after studying many researches in this field, and becoming aware of all its gaps and limitations. The selected approach was to trace risks throughout the whole BPM life cycle including risk prediction, defining some risk mitigation strategies that should be applied in case of the occurrence of unexpected risks, and detection of risks through the execution of business processes. This approach will be validated though real data in a case study and the results will be analyzed and concluded. This paper is organized as follows. Section 2 describes the related literature published in the area of Risk-aware BPM. Section 3 describes the reference model for Risk-aware BPM. Section 4 describes the application of this model using a case study from the real-world environment. An evaluation for the case study is provided in section 5. Finally, conclusions are provided in section 6. 2. RELATED RESEARCH Many researches addressed the same problem, which consists in aligning BPM and risk management. For example, Conforti et al. proposed many different researches in this field, for example: [1] aimed to detect risk at run time using the technology of sensors; the sensor notifies sensor manager when a risk is detected and the sensor manager interacts with the monitoring component of the business process management systems. Then the BPMS prompt results to the user who may take remedial actions. In [5], they aimed to predict risk and recommend to the user the best risk-minimized action mainly by two approaches: the first one uses decision trees generated from logs from historical data, while the other approach uses linear programming to compute optimal assignment of resources for this task. In [3], a proposed framework for the process-related risk management has been presented and a working implementation has been described. This framework includes three aspects of risk management: risk monitoring, risk prevention, and risk mitigation. Risk monitoring functionality is provided using a sensor-based architecture, where sensors are defined at design time and used at run-time for monitoring purposes. The Risk prevention functionality has been introduced in the form of recommendations about what should be executed by using decision trees. At last, the risk mitigation functionality was presented in the form of sequence of remedial actions that need to be executed to put the process back in its normal situation. In [2], an innovative technique has been introduced; this technique helps the process participants in taking risk-informed decisions, which aims to decrease the process risks. They reduce the risks by decreasing the probability and severity of a process risks from happening. These risks are predicted by traversing decision trees generated from the logs of past process executions and considering process data, involved resources, task durations and contextual information like task frequencies.
International Journal of Computer Science & Engineering Survey (IJCSES) Vol.6, No.2, April 2015
13
While in [4] they proposed an approach for real-time monitoring of risks in executable business process models. The approach considers risks in all phases of the business process management lifecycle, from process design, where risks are defined on top of process models, through to process diagnosis, where risks are detected during process execution. The approach has been based upon a sensor-based architecture. During the design-time, sensors will be defined in order to identify some risk conditions. When these conditions occur, it indicates the appearance of process risks. During run-time, each sensor will notify the sensor manager when a risk has been detected. Then the sensor manager will interact with the monitoring component of the business process management systems in order to send the results to the process administrators who behave according to the results. Jakoubi et al. also posted many researches about integrating the areas of BPM and risk management. In [6], scientific research efforts in the field of security and risk related business process/workflow management are examined. The major objective of this paper is to provide an overview of scientific research efforts regarding the integration of security as well as risk considerations into business process management. In this paper, selected approaches and methods have been discussed, which are: (1) Process Oriented Security Model (POSeM), (2) Extension of UML 2.0, (3) Process Mining and Security: Detecting Anomalous Process Executions and Checking Process Conformance, (4) Integrating Risks in Business Process Models, (5) Integrating Risks in Business Process Models with Value Focused Process Engineering, (6) Modeling Business Process Availability, (7) IT Risk Reference Model, (8) Risk-Oriented Business Process Evaluation (ROPE), (9) Business Process-based Valuation of IT-Security. In [7], the research provides a Roadmap or a vision on integrating process management and risk management. The overall objective of the research is to create a link between economic and security discipline. The research identified some steps for linking risk and process management in order to create the roadmap. While the research, in [8], aimed to propose a reference model to enable the modeling of risk aspects for providing the foundation of risk-aware business process simulations. The research in [9] discussed the integration of risk management and BPM; briefly described the ROPE (Risk-Oriented Process Evaluation) and the Security Ontology concept, which provides a solid knowledge base for an applicable and holistic company specific IT security approach. 3. RISK-AWARE BUSINESS PROCESS MANAGEMENT MODEL To integrate between BPM and risk management, we embed risk aspects into the BPM life cycle, which consists of four main stages which are analysis, design, execution, and evaluation as shown in Fig.1.
International Journal of Computer Science & Engineering Survey (IJCSES) Vol.6, No.2, April 2015
14
Fig.1 : Risk-aware Business Process Management life cycle
The input for this life cycle are the historical data from previous logs, the set of Key Performance Indicators KPIs, and rules that will help in identifying risks and guide us to the accepted risks. KPI is an indicator for performance measurement and evaluation. KPIs evaluate the success or failure of an organization or the performance of a particular activity in which it engages. Therefore, not only it differs from one business sector to another but also from organization to organization as every organization has its own set of goals and levels of success. The KPIs help organizations in continuous improvement, Timely identification of issues and resolution during the project process, Identification and commendation of exceptional performance, and compliance with international agreements recommendations. Those indicators can be divided to many categories (e.g. quantitative, qualitative, practical, directional, or financial). In the following the different phases of the model; namely analysis, design, execution and evaluation, will be described. 3.1 Analysis In the Analysis phase, the business processes are identified, as well as the sub processes if available, and the relationships between business activities are determined. The business objectives that were connected to the high-level business processes can be expanded into goals and KPIs that will be applied to the individual business processes. The identified KPIs can help us in this phase to identify the accepted risks and those risks that can threaten the organizations’ existence or reputation. Also risk analysis is carried out to identify process-related risks. Many traditional risk analysis methods can be used in this phase like Fault Tree Analysis or Root Cause Analysis both can be used to identify possible risks of faults that may occur during business process execution. Also the historical event logs can be studied and analyzed to determine the frequency of risks and the reasons that led to it, and to check if any new risk has been detected to be analyzed and develop a possible mitigation strategy for it. Conforti et al. predicted risks by using traversing decision trees produced from the event logs of past process executions and considering process data, involved resources, task durations and contextual information like task
Reports Modifications
Historical data
International Journal of Computer Science & Engineering Survey (IJCSES) Vol.6, No.2, April 2015
15
frequencies. An event log L is defined as a multiset of traces where each trace is a sequence of events of the form (t; r; d; Ф), where t ЄT represents a task, r Є R represents the resource performing t, d Є D represents the event’s timestamp, and Ф Є Ф represents an assignment of values to a sub set of variables in V. In every completed trace of the event log, a fault’s severity between 0 and 1 will be assigned, in which 0 identifies the execution with no fault and 1 identifies the fault with the highest severity. To model this, a risk analyst needs to provide a fault function f. The set of all such functions is: F = (T×R ×D ×Ф)* [0, 1] (1) The research in [2] discussed three faults that form a complete trace for a process instance: (1) Overtime fault. In order to avoid this risk, the process must terminate within a certain Maximum Cycle Time dmct. The severity of the fault increases with the amount of time that the process execution exceeds dmct. dσ will be the duration of the process instance, i.e. difference between the timestamps of the last and first event of σ. dmax will be the maximum duration among all process instances already completed (including б). The severity of an overtime fault will be measured as follows:
(2) (2) Reputation-loss fault. It is considered as any risk that may affect the reputation of an organization. The severity of this fault is between 0 and 1, where 0 identifies the execution with no fault and 1 identifies the fault with the highest severity. (3) Cost Overrun fault. Several activities will be executed during the implementation of business process, and each of these activities has an execution cost associated with it. Any company wants to increase the profits and reduce its costs. There is a minimum cost under which it is actually impossible to go and the severity grows as the cost goes above the minimum. Consider cmax will be the greatest cost associated with any process instance that has already been completed (including σ), cσ will be the cost of σ and cmin be the minimum cost that any process instance can undergo. The severity of a cost fault is:
(3) While [10] proposed an approach for predicting overtime risks based on statistical analysis of the event logs. They defined a set of time-related process risk indicators that highlight the likelihood of an overrun. Their approach consists of three steps: 1) the definition of Process Risk Indicators (PRIs); 2) introducing a way to identify instances of risk patterns in a log; and 3) the definition of a predictor function that characterizes the risk of a case failing. Process Risk Indicator was defined as a pattern observable in an event log where its presence indicates a higher likelihood of some process-related risk. Five time-related PRIs were identified: -PRI 1: Abnormal activity execution time. A case contains an activity where its duration is higher than its normal duration. -PRI 2: Abnormal waiting time. An activity execution that was not started for an abnormally long period of time after it has been enabled. -PRI 3: Multiple activity repetitions. An activity that is repeated multiple times in a case. -PRI 4: A typical activities. A case includes an activity that has not been performed often previously.
International Journal of Computer Science & Engineering Survey (IJCSES) Vol.6, No.2, April 2015
16
- PRI 5: Multiple resource involvement. The number of resources involved in a case clearly exceeds the norm. Their method for PRI identification consists of two steps: (1) Identify a cut-off threshold by analyzing a given event log; and (2) For a given case, identify the outliers using the learned threshold. For detecting the presence of PRI1 in a trace belonging to a run α of the process model, every activity a occurring in at least one trace corresponding to α: create a sample x of logarithms of the durations of all occurrences of a in traces corresponding to α(the difference between complete and start events); calculate the cut-off threshold t = x + 2s; for a given activity instance compare logarithm of its duration with the threshold t and if it exceeds the threshold set the value of the corresponding case's attribute PRI1 = 1. Also a similar procedure is followed for other PRIs. For PRI2, the waiting time will be calculated as the difference between the end time and the start time of two consecutive activities in a log (Note: this assumption may not always be true). For PRI3 and PRI5 the number of activity executions in a case and the number of resources involved in a case are assumed to follow a normal distribution. An activity can be considered atypical (PRI4) if it has been executed in less than a certain number of cases in the log. Suriadi et al. [11] introduced an approach for a Root Cause Analysis based on classification algorithms. First, the log is enriched with information like workload, occurrence of delay and involvement of resources, and then decision trees are used to identify the causes of overtime faults. The fault cause will be calculated as a disjunction of conjunctions of the enriching information. The output of this phase is a set of identified business processes and its related set of predicted risks or risk conditions. The main steps of this phase are shown in Fig. 2.
Fig.2: main steps of the Analysis phase 3.2 Design In the Design phase, those business processes identified in the Analysis stage are modeled using any modeling language like BPMN 2.0(Business Process Modeling Notation) or YAWL (Yet Another Workflow Language). Modeling involves transforming the theatrical design into a high level model, concentrating on ensuring that the high level detail is correct without being distracted by the detail of how it’s going to be implemented. Modeling is historically carried out
International Journal of Computer Science & Engineering Survey (IJCSES) Vol.6, No.2, April 2015
17
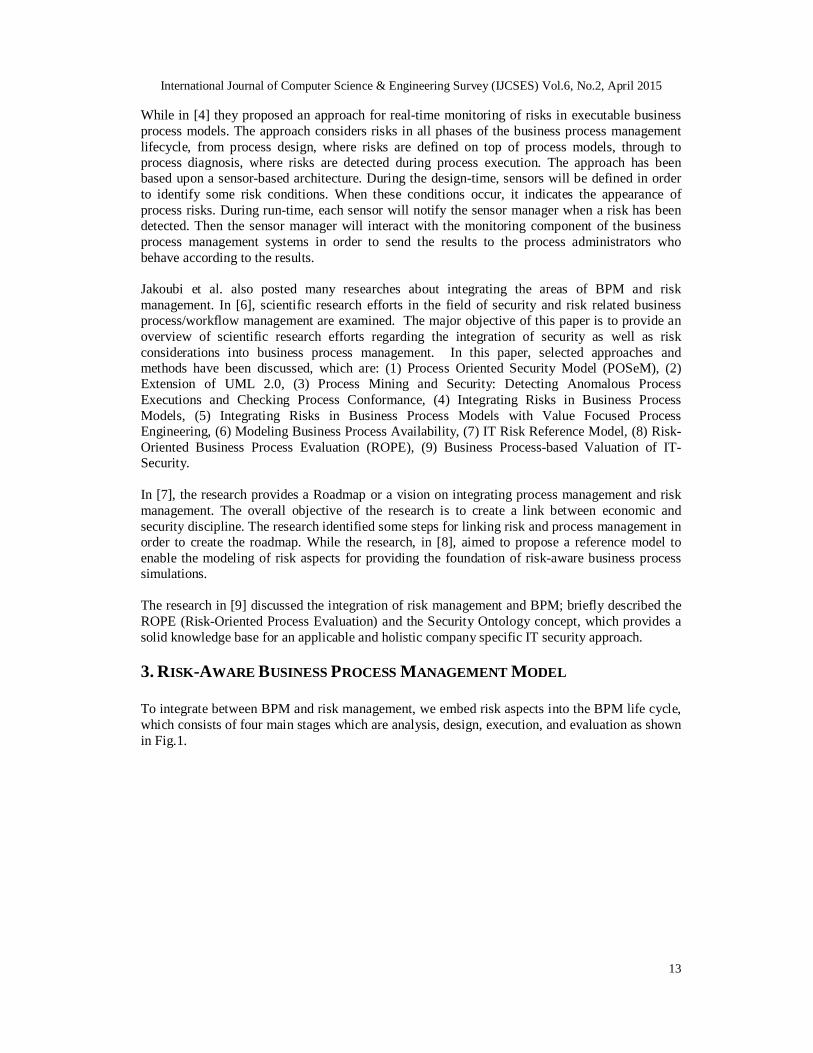
by business analysts but nowadays simple-to-use technologies like Sequence are allowing the business manager to undertake this task. KPIs will be added to the Business Process Model. Each Identified KPI should have a desired target value attached to them. During the monitoring and post runtime analysis of the business process model, the real value of the KPI will be compared to the desired target value. KPIs are defined in order to measure the characteristics of process instances, processes, resources, or of the overall business operations. After modeling, the risk conditions are mapped to their related business processes, so that each business process has an assigned risk condition. Also each risk aspect will be attached with a sensor to detect risk during process implementation. The sensor is used to detect unusual events or changes in quantities or resources that can be considered as an expected risk and trigger the sensor manager to take a decision or provide a solution. A sensor is defined through a Boolean sensor condition, constructed on a set of process variables, and a sensor activation trigger. The main steps of this phase are shown in Fig. 3 The output of this phase is a risk-annotated process model.
Fig. 3: Main steps of the Design phase 3.3 Execution: In the Execution phase, the risk-annotated process model created at the design phase is executed by a process engine, and business process instances will be launched and interacted with by end users. According to [1], the risks occurred during running will be detected by using the technology of sensors, defined sensors will be registered with a sensor manager to activate them and to be monitored during process enactment. Each sensor independently notifies the sensor manager when any risk is detected. On the other side, the sensor manager interacts with the monitoring component of a Business Process Management System (BPMS) to prompt the results to process administrators who may take remedial actions [3]. The sensor manager interacts with BPMS through three interfaces; the sensor-based architecture is shown in Fig.4 from [1]. Also, in case any risk mitigation strategy identified for this risk is found it will be executed automatically by the system. The main steps of this phase are shown in Fig. 5.
International Journal of Computer Science & Engineering Survey (IJCSES) Vol.6, No.2, April 2015
18
Fig.4: Sensor-based Architecture
Fig. 5: Main steps of the Execution phase The output of this stage is the current execution logs that will be analyzed in the next phase. 3.4 Evaluation In this phase, the business processes are evaluated through all the past phases through monitoring of activities and process mining techniques. Evaluation of the business process is very important in the business process life cycle, as organizations deploying Business Process Management systems are seeking continuous improvement of their business processes. This phase makes the system able to adapt itself and fix problems automatically which makes the organization more flexible. At the evaluation stage, the current execution logs and also the historical data will be analyzed to detect abnormal events and study the reasons of their occurrence. Moreover, performance evaluation analysis will be conducted in order to determine the risk occurrence reasons, and identify the inefficiencies and bottlenecks. Many strategies may be developed in order to overcome these inefficiencies and bottlenecks, and the most efficient and effective one will be chosen. The identified KPIs for the processes can be analyzed to check for deviations. The models presented to users for analyzing the critical factors which affects the KPI behaviors should be understandable [17]. By classifying process instances in a user-defined way depending on their characteristics, it facilitates the analysis of the historical data.
International Journal of Computer Science & Engineering Survey (IJCSES) Vol.6, No.2, April 2015
19
Modifications and changes can be done in this phase in order to decrease the risk occurrence probability. Then those changes will be input to the analysis phase to determine if the model needs to be reengineered or not, and it will be incorporated into the Business Process Model. The event logs from past execution will support in the risk prediction. Finally, reports can be produced and sent to stakeholders or interested people and the cycle will be repeated for continuous business process improvement. The main steps of this phase are shown in Fig. 6.
Fig. 6: Main steps of the Evaluation phase
4. RUNNING EXAMPLE In this section we use an example to illustrate how the proposed model for Risk-aware BPM can be implemented. In particular, we will show how risks can be predicted, detected, or mitigated throughout the BPM life cycle. Here we will go through all phases of the Risk-aware BPM life cycle using business processes for Egyptian universities working with credit-hours systems. 4.1 Analysis phase: First, the analysis is started in order to identify business processes, sub-processes, and their relationships. After many researches, Figures 7, 8, and 9 show the identified business processes and their sub processes for the credit-hours system at Helwan University using the YAWL tool.
Fig. 7: The main business processes for credit- hours system at Helwan University
International Journal of Computer Science & Engineering Survey (IJCSES) Vol.6, No.2, April 2015
20
Fig. 8: The Enrollment business process
Fig. 9: The Registration business process
Then, the KPIs will be identified for the previous business processes. According to [16], four categories of indicators are identified which are: • Internal performance indicators – are indicators based on the internal information produced by the institution, such as the pass rate, the graduate rate, the number of dissertations accepted, the average duration of the course, and the assessment of the professors by the students, amongst others. • Operational performance indicators – are those that refer to the internal activities of the departments and they are related with the internal activity of the university. For example, student/professor ratio, student/staff ratio, and the unit costs, size of the classes, ratio of employees, and student/computer ratio. • External performance indicators – referring to information external to the university, such as, employability of the graduates and reputation of the university in the work market. • Research Performance Indicators – aiming to evaluate the research activities of the university. For example, the number of publications, invitations to relevant scientific conferences, awards and distinctions [13]. In our business process, some KPIs have been identified according to business needs. First, KPIs in the enroll sub process have been identified, here are some:
Number of students. Number of students enrolled / Total number of teaching staff (per graduate and academic
courses).
International Journal of Computer Science & Engineering Survey (IJCSES) Vol.6, No.2, April 2015
21
Number of students enrolled / Square meters for the teaching activity and their complementary services.
Number students enrolled / Total number of administrative staff and services. Total enrolments time / Total number of students enrolled. Percentage of errors in the acceptance criteria.
Second, following are the KPIs for the registration sub process: Number of hours spent in registration/ Total number of students registered. Number of registered students in a subject / total number of available professors teaching
this subject. Number of registered students in a subject needs practical training / total number of
available labs. Percentage of errors in students’ registration for the prequisite subjects.
At last, the KPIs for the basic business process shown in figure are as follows: Number of students who failed / Total number of students enrolled. Number of students who complete their courses in their period set / Total number of
students enrolled. Number of Masters and Post-graduate courses / Total number of graduates. Number of complaints made by the students. Number of students engaged in social activities/ Total number of students enrolled. Number of students exceeds the no attendance limit for a course/ Total number of
registered students. Number of doctors’ theses with a favorable award / total number of doctorate candidates
(per academic course or degree) Number of students enrolled in doctorate courses / Number of graduates (per academic
course and degrees) Number of articles in magazines such as referee / Total number of researchers (per
knowledge area). Number of books published / total number of researchers (per knowledge area).
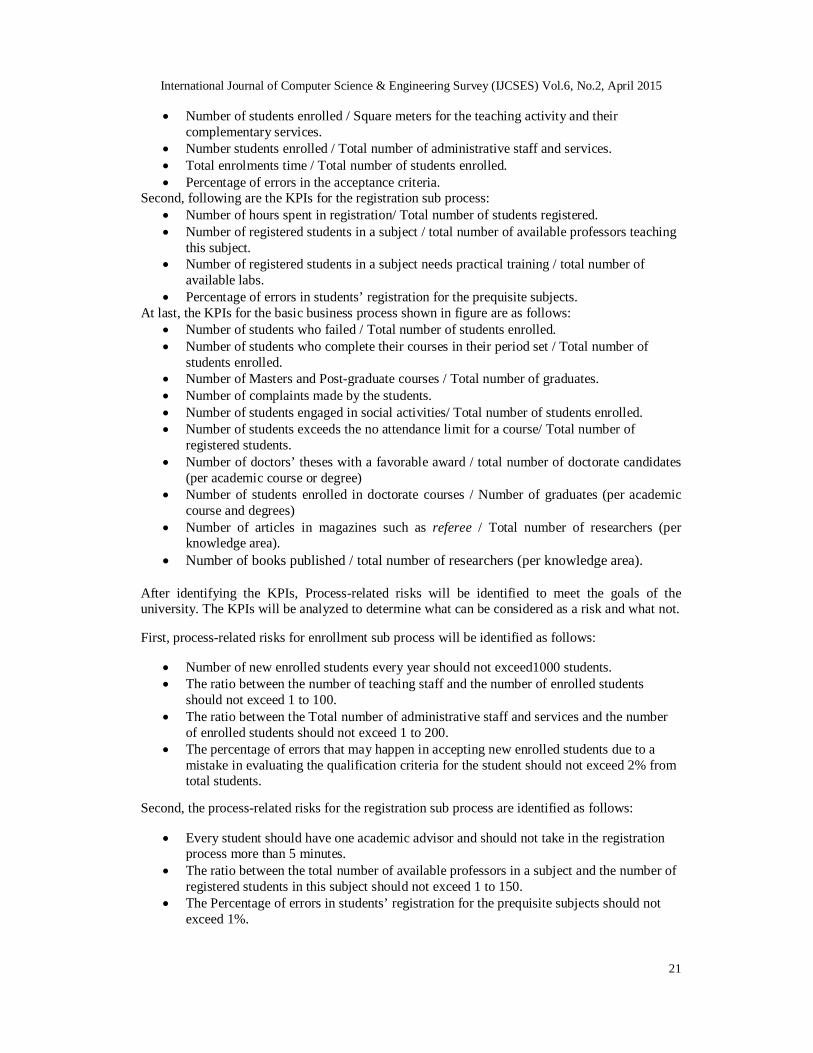
After identifying the KPIs, Process-related risks will be identified to meet the goals of the university. The KPIs will be analyzed to determine what can be considered as a risk and what not. First, process-related risks for enrollment sub process will be identified as follows:
Number of new enrolled students every year should not exceed1000 students. The ratio between the number of teaching staff and the number of enrolled students
should not exceed 1 to 100. The ratio between the Total number of administrative staff and services and the number
of enrolled students should not exceed 1 to 200. The percentage of errors that may happen in accepting new enrolled students due to a
mistake in evaluating the qualification criteria for the student should not exceed 2% from total students.
Second, the process-related risks for the registration sub process are identified as follows:
Every student should have one academic advisor and should not take in the registration process more than 5 minutes.
The ratio between the total number of available professors in a subject and the number of registered students in this subject should not exceed 1 to 150.
The Percentage of errors in students’ registration for the prequisite subjects should not exceed 1%.
International Journal of Computer Science & Engineering Survey (IJCSES) Vol.6, No.2, April 2015
22
Then the process-related risks for the basic business processes for the university are as follows:
The number of students who failed in a subject should not exceed 50% of total registered students in this subject.
The student should attend at least 75% of the lectures for every subject. The number of students that complete their courses in the period set should exceed 75%
of the students enrolled. The number of Masters and Post-graduate students should exceed 10% of the total
number of graduates.
Risk prediction: after identifying the process-related risks, the most possibly occurring risks will be predicted. Risk prediction will be applied mainly in this case study through analyzing of the previous event logs to determine the risks occurred and its fault severity. For example, in case of the risk of not attending 75% of the lectures for each subject, previous logs for the attendance list are analyzed. After the analysis for programming 1 subject, it has been found that about 10 students did not attend as needed. It was deducted that about 8 students will likely not attend. Also in case of the risk that a student takes more than 5 minutes to register, it is considered overtime fault which is predicted through the following equation [2]:
(3)
By applying the equation, it has been found that the overtime fault severity for this risk is 0.6, which means it is most likely to happen. Risk mitigation strategy: the last step for this phase is to develop a risk mitigation strategy for the predicted risks if possible. In our case study, in case of the attendance risk, an automatic mail could be sent to the student to warn him that he did not attend as much as needed. This mail will be triggered once the student will reach a defined cutoff threshold. In the registration time risk, a warning will be shown to the user before the ending of the 5 minutes to inform the user that the registration will be ended automatically in one minute. 4.2 Design phase: At this phase, identified business processes are modeled using the Yawl tool as was shown in figures 7, 8, and 9. Then each process- related risk will be mapped to their business processes. For example, the task Check criteria located in the enrollment process has been assigned three process- related tasks as shown in Figure 10.
Fig.10: Process-related risks for Check criteria
International Journal of Computer Science & Engineering Survey (IJCSES) Vol.6, No.2, April 2015
23
Also the choose schedule task of the registration process has been assigned three process-related which is having one academic advisor, the task instance does not take more than 5 minutes and the ratio between the total number of available professors in a subject and the number of registered students in this subject should not exceed 1 to 150 as shown in Figure 11.
Fig. 11: Process-related risks for Choose a schedule
At the end of the design phase, each risk condition defined will be attached to a sensor for risk detection during running. Sensors will be created using the YAWL editor. In our example, we considered two risks to be examined using the sensors technology. The first one is the attendance risk that occurs in the attendance of courses task where any student registered in a subject should attend more than 75% of the total lectures of this subject. So a sensor is created and attached to this task in order to detect this risk. A sensor named attendance is created, an attached variable called attNo is defined that count the number of times the student attends the lectures of the subject, and the risk condition will occur when the count of attNo is less than 2 times. The sensor will be triggered every 4 weeks to check the risk condition, and if the condition became true the message “Attendance risk (this student has attended less than needed)” will be sent to the BPM systems that will send a warning e-mail to the student and another mail to the professor teaching the subject. The second type of risk that will be examined is that the number of students that complete their courses in the period set does not exceed 75% of the students enrolled. This risk also will occur in the Attendance of courses task in the University business Process. So a sensor called completeCoursesWithinPeriodSet is created, variable called NoOfHoursCompleted is defined within this sensor to count the number of hours completed by each student every year, and the risk condition is designed to check if the number of hours completed is less than 25% of the total hours that should be taken by this student. The sensor will be triggered yearly to detect this risk and if the risk condition was true this message (“This student may not complete the courses within the Period set”) will be sent to the BPM systems to check the reasoning behind this risk. 4.3 Execution Phase: In this phase, the modeled business processes will be implemented, sensors will be activated and interact with BPM Systems for risk detection, and any defined risk mitigation strategy will be executed if needed. Using the Resource Service of YAWL the business Process will be uploaded and launched for running. Then each task by sequence will be offered, allocated, or started to a human resource to
International Journal of Computer Science & Engineering Survey (IJCSES) Vol.6, No.2, April 2015
24
be executed and non-human resources like computers and printers will be assigned to it as necessary. Each task will be sent to its assigned human- resource account, and then added to the human-resource work list waiting to be executed, and then the next task will be ready for allocation and so on. During running, sensors will interact with the BPM Systems to report about risk detections to be monitored. 4.4 Evaluation phase: At this phase, business processes will be monitored, event logs will be analyzed, and overall performance evaluation analysis will be held in order to detect deviations from the expected performance. Modifications and changes in the business process will be recommended to be applied in the next life cycle. Jans et al., [14] used Business Process Mining for internal risk fraud detection using Bozkaya et al. [15] methodology for process diagnostics by process mining, which consists of five phases: log preparation, log inspection, control flow analysis, performance analysis, and role analysis. Part of this methodology will be used in this case study for process mining of the event logs. Log preparation: here the event log is being prepared for the analysis. Shown in Table 1 the prepared event logs for the first two tasks of the universitpby business process that includes the process instance, task name, its timestamp, its lifecycle transition, and the user who originates it.
Log inspection: after preparing the logs, it will be analyzed or inspected for better understanding. For example, after analyzing the Enroll business process, it was found out that about 67% from the received applications has been accepted and enrolled in the university and the percentage of error in the enrollment process was 0.01%as shown in Table 2.
International Journal of Computer Science & Engineering Survey (IJCSES) Vol.6, No.2, April 2015
25
Table 2: Log Analysis for the Enrollment process
Task Original log occurrences
Corrected log occurrences
Receive application
1444 1444
Student
enrollment
980 986
Also by analyzing the Attendance of courses of task, it has been found that about74% of the registered students completed more than or equal to 25% of the total hours they should take as shown in the Log Analysis in Table 3.
Table 3: Log Analysis for Attendance-of-courses task
Task Registered students
Greater than or equal 25%
Smaller than 25%
Attendance of courses
2825 2090 735
Performance Analysis: According to the previous log inspection, there is a great probability that less than 75% of the total enrolled students will complete their courses during their period set. And that according to the identified KPIS is considered a risk; this will make an overload on the university’s human or non-human resources. To overcome this risk, the system will generate a report with the names of those students who failed to take more than or equal to 25% of their total hours in one year, in order to contact them and figure out the reasons or the problems they faced to try to solve it and encourage them to take summer courses. Modifications in the business process will be applied in the next life cycle. Role Analysis: in this analysis, we attempt to answer questions like "Who executes what activities?" and "Who is working with whom?" [14]. In this phase, the efficiency of the segregation of duty will be checked on[15]. During the registration process, it has been found that about 29% of the registered student could not complete their registration within the 5 minutes interval. Deeper analysis will be done to check if this problem is related with the academic advisor of those students or the user performing the operation. According to the outcomes of this analysis, decisions will be made regarding the suitable academic advisors for those students who perform these roles.
5. EVALUATION After going through the case study, in this section the overall performance of the model will be evaluated. The main start of this model is identifying a set of KPIs which helps in the performance measurement. Without identifying the KPI, the company would not have precise data to measure the degree of goal achievment. Most businesses set strategic goals they want to achieve. An important way to measure an organization’s progress toward achieving these goals is to use key performance indicators. Therefore, the KPIs can be considered a very important part of the model and it facilitates its performance evaluation. This led to identifying business processes and their related risks. Then the model has been created using the YAWL tool and also the
International Journal of Computer Science & Engineering Survey (IJCSES) Vol.6, No.2, April 2015
26
sensors for the risk conditions are identified by extending the YAWL tool. The sensor-based risk identification and modeling approach added a value in allowing participants to develop an understanding of process risks. It has been found that the approach was useful especially for users with limited experience in business process modeling or BPMSs [3]. Then during running the model, risks has been detected using sensors and interacted with the BPM Systems. This helped in avoiding many risks that can be a threat and also avoid the additional costs of healing from those risks. Finally, the logs were analyzed in order to evaluate the performance and identify the bottlenecks. Modifications on the business processes will be applied in the next life cycle. This will lead to continuous performance improvement and a more flexible and adaptive business process that is needed in today’s environment. Conforti et al. have done similar work by going through the risk prevention using decision trees and log analysis; they also introduced the risk detection using the sensors technology during run time. An implementation was done in these researches using a case study for the Order-fulfillment process. However, a clear reference model was not developed, the KPIs were not integrated in the model of the Risk-aware BPM, and an implementation with a real-world data has not been done. While Jakoubi et al. presented a roadmap and a reference model for the risk-aware BPM, their main focus was on the creation of a theory for integrating process management and risk management. They did not go through risk management aspects like risk detection and prevention, also an implementation with the real-world data was not presented. 6. CONCLUSION AND FUTURE WORK To run a successful organization, an efficient, effective and secured business process is needed. Business Process Management and Risk Management are two important fields for achieving business and security objectives; therefore there is an increasing demand for integrating both objectives. In this paper, we aimed at providing an approach for integrating risk and business aspects in a Risk-aware Business Process Management model. An integrated model for business processes and their related risks is provided as well as an explanation for several techniques and tools from recent researches that can be used to apply this model. This approach yields a more secured business process that helps organizations face the increasing environmental pressures and fulfill their demand for better performance. As said before, the main gap in this area of research is the implementation in the real-world environment. Therefore, a case study for a business process in Egyptian Universities has been introduced in order to implement this reference model in practice in a real-world environment to prove its efficiency. However, more implementations are needed in other fields for the Risk-aware BPM, thus this can be a rich area for future research. REFERENCES [1] Conforti, R., Fortino, G., La Rosa, M., ter Hofstede, A.H.M. (2011). “History-Aware, Real-Time Risk
Detection in Business Processes “, in: Proc. of CoopIS, Springer. [2] Conforti, R., De Leoni, M., La Rosa, M., & van der Aalst, W. M. (2013, January). Supporting risk-
informed decisions during business process execution. In Advanced Information Systems Engineering (pp. 116-132). Springer Berlin Heidelberg.
[3] Conforti, R., La Rosa, M., Fortino, G., Ter Hofstede, A. H., Recker, J., & Adams, M. (2013). Real-time risk monitoring in business processes: A sensor-based approach. Journal of Systems and Software, 86(11), 2939-2965.
[4] Conforti, R., La Rosa, M., Ter Hofstede, A. H., Fortino, G., de Leoni, M., van der Aalst, W. M., & Adams, M. J. (2013, June). A software framework for risk-aware business process management. In Proceedings of the CAiSE'13 Forum at the 25th International Conference on Advanced Information Systems Engineering (CAiSE): CEUR Workshop Proceedings, Volume 998 (pp. 130-137). Sun SITE Central Europe.
International Journal of Computer Science & Engineering Survey (IJCSES) Vol.6, No.2, April 2015
27
[5] Conforti, R., de Leoni, M., La Rosa, M., van der Aalst, W. M., & ter Hofstede, A. H. (2015). A recommendation system for predicting risks across multiple business process instances. Decision Support Systems, 69, 1-19.
[6] Jakoubi, S., S. Tjoa, G. Goluch, and G. Quirchmayr (2009a) “A Survey of Scientific Approaches Considering the Integration of Security and Risk Aspects into Business Process Management”, Proceedings of the International Workshops on Database and Expert Systems Applications (DEXA’09), Los Alamitos, CA: IEEE Computer Society, pp. 127–132.
[7] Jakoubi, S., T. Neubauer, and S. Tjoa (2009b) “A Roadmap to Risk-aware Business Process Management” in Kirchberg, M., P. Hung, B. Carminati, C. Chi, R. Kanagasabai, E. Della Valle, K. Lan, and L. Chen (eds.), Proceedings of the Fourth IEEE Asia-Pacific Services Computing Conference (APSCC’09), Los Alamitos, CA: IEEE Computer Society, pp. 23–27.
[8] Jakoubi, S, Simon Tjoa(Oct. 2009), “A Reference Model for Risk-Aware Business Process Management” , Risks and Security of Internet and Systems (CRiSIS), 2009 Fourth International Conference on 19-22.
[9] Gernot Goluch, Andreas Ekelhart, Stefan Fenz, Stefan Jakoubi, Simon Tjoa and Thomas M¨uck (Jan. 2008), “Integration of an Ontological Information Security Concept in Risk-Aware Business Process Management”, Hawaii International Conference on System Sciences, Proceedings of the 41st Annual ,7-10.
[10] Pika, A., van der Aalst, W. M., Fidge, C. J., ter Hofstede, A. H., & Wynn, M. T. (2013, January). Predicting deadline transgressions using event logs. In Business Process Management Workshops (pp. 211-216). Springer Berlin Heidelberg.
[11] Suriadi, S., Ouyang, C., van der Aalst, W. M., & ter Hofstede, A. H. (2013, January). Root cause analysis with enriched process logs. In Business Process Management Workshops (pp. 174-186). Springer Berlin Heidelberg.
[12] OMG. Business Process Model and Notation (BPMN) ver. 2.0 (January 2011), http://www.omg.org/spec/BPMN/2.0
[13] da Costa Marques, M. D. C. (2001). Key performance indicators in Portuguese public universities. Jano, 84.
[14] Jans, M., Lybaert, N., Vanhoof, K., & van der Werf, J. M. (2008). Business process mining for internal fraud risk reduction: results of a case study.
[15] Bozkaya, M., J. Gabriels, and J. M. van derWerf (2008). Process diagnostics:A method based on process mining.
[16] Robinson, P.B., Huefner, J. C., & Hunt, H.K. (1991). Entrepreneurial research on student subjects does not generalize to real world entrepreneurs. Journal of Small Business Management, 29(2), 42.
[17] Castellanos, M., Salazar, N., Casati, F., Dayal, U., & Shan, M. C. (2005). Predictive business operations management. In Databases in Networked Information Systems (pp. 1-14). Springer Berlin Heidelberg.
Authors Prof. Mohamed H. Haggag is a professor at Department of Computer Science, Faculty of Computers and Information, Helwan University. Currently he is the vice dean of students affairs, faculty of Computers and Information, Helwan University as well as director of scientific computing center, Helwan university. Prof. Haggag is managing the project of Helwan University Infrastructure and Data Center Development. Previously, Prof Haggag was entitled to head of Computer science department, vice dean of environmental affairs. His areas of research interests are machine learning, business intelligence, software engineering, computational linguistics and data mining. Dr. Ayman El-Sayed Khedr Associate Professor of Information Systems, Information Systems Department,Faculty of Computers and Information, Helwan University, Cairo, Egypt. He is also Guest Professor at LUSM, Lieden University, The Netherlands, General Manger of E-Learning Center of Helwan University, Technical Manager of ICCEM, Helwan University, Manager of Quality Assurance Unit, Faculty of Computers and Information, Helwan University, Cairo, Egypt Lecturer. Hend Montasser received the Bachelor degree in Management Information Systems from Helwan University, in 2009. She is a research student of Master’s degree in Information Systems. Currently, she is a lecturer at Management Information Systems department. Her interests are in business processes, web design, and programming languages.