1 An Examination of the Long-Term Business Value of Investments in Information Technology Vincent J. Shea II, St. John’s University, New York, United States, Email: [email protected]Kevin E. Dow, Nottingham University Business School China, University of Nottingham, Ningbo, China, Email: [email protected]*Alain Yee-Loong Chong, Nottingham University Business School China, University of Nottingham, Ningbo, China, Email: [email protected]Eric W.T. Ngai, Department of Management and Marketing, Hong Kong Polytechnic University, Hong Kong, Email: [email protected]Abstract In this paper, we examine the effects of investments in Information Technology (IT) on the long term business values of organizations. The regression discontinuity design is used in this research to examine eight hundred and ten IT investment announcements collected from the period 1982-2007. Our results found that press releases can affect the market value of a firm by possibly providing investors with a better idea of a firm’s current and future operations and strategy. On the other hand, these press releases also appear to attract more transient investors. The attraction of transient investors likely suggests the market believes the IT investing firm is serious about its potential for growth and expansion. 1.0 Introduction Information systems (IS) researchers have questioned the added value of the billions of dollars spent by firms on information technology (IT) over the past thirty years and the business value of IT has long been a subject for research and intensive debate (T. Li, van Heck, & Vervest, 2009; Lui e al., 2015). In spite of this uncertainty, IT spending steadily increased over the years. According to Gartner Group, worldwide IT spending reached 3.6 trillion dollar in 2012, and the spending is expected to continue to grow by 5.2 % in 2013 (Gartner, 2013). With the significant amount of money spent on information technology, companies are often challenged whether such investments will result in business value (Mithas and Rust, 2016). The results of studies that have examined the business value of information technology (BVIT) have been mixed. Early BVIT studies sought to explain the “productivity paradox,” the fact that intensive IT expenditures during the 1980’s did not appear to result in significant increases in firm productivity at that time (Erik Brynjolfsson, 1993; Dos Santos, Peffers, & Mauer, 1993). Subsequent studies suggested that the effects of
Transcript
1
An Examination of the Long-Term Business Value of Investments in Information Technology
Vincent J. Shea II, St. John’s University, New York, United States, Email: [email protected]
Kevin E. Dow, Nottingham University Business School China, University of Nottingham,
researchers to better isolate and measure more concisely changes in ROA, ROE and ROI (M. Li & Richard Ye,
1999). However, a weakness of these accounting metrics is that they only capture historical financial
information (Mitra, 2005).
5
The BVIT literature has also used several less common metrics including: risk (Dewan & Ren, 2007),
earnings volatility (K. Kobelsky, Hunter, & Richardson, 2008) and analysts’ forecasts (Dehning, Pfeiffer, &
Richardson, 2006). For example, VBIT research has shown that the risk premium increases due to IT
investments (Dewan & Ren, 2007). Similarly, (Dehning et al., 2006) report that investments in IT increase
analysts’ forecasting error due to the increase in information risk associated with the IT’s characteristics.
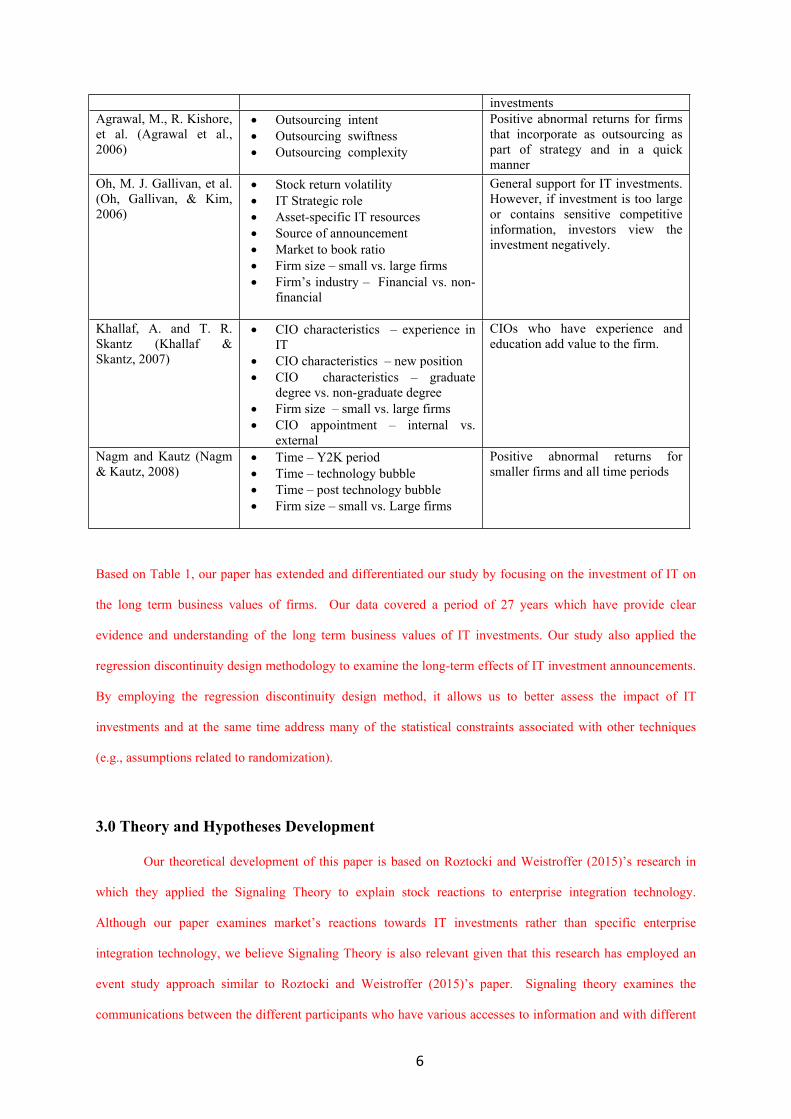
TABLE I: Summary of Selected BVIT Event Studies Study Primary Variables Examined Summary of Findings Dos Santos, B., G. K. Peffers, et al. (Dos Santos et al., 1993)
Firm’s Industry – financial vs. manufacturing
Innovation – innovative vs. non-innovative
No abnormal returns for full sample. Innovative IT investments present positive abnormal returns
Hayes, D. C., J. E. Hunton, et al. (David C. Hayes et al., 2000)
Firm Size – small vs. large firms Firm Financial health
ERP announcements display positive abnormal returns. Small healthy firms have more positive returns than large and small unhealthy firms
Im, K., K. Dow, et al. (Im et al., 2001)
Firm’s Industry – financial vs. non-financial
Firm Size – Small vs. large firms Time – Productivity Paradox (pre
1991 vs. post 1991)
Size and time help explain stock price reaction to all IT investment announcements. Reactions is initially negative and become positive over time
Chatterjee, D., V. J. Richardson, et al. (Chatterjee et al., 2001)
CIO hire - external vs. internal IT transformative vs. non IT
transformative Time – 1995-1998 vs. other
Positive abnormal returns for the creation of CIO positions for firms within IT transformative industries
Subramani, M. and E. Walden (Subramani & Walden, 2001)
Type of Firm – brick and mortar vs. net firms
Tangible versus digital goods
Compares business-to-consumer (B2C) and business-to-business (B2B) firms. E-commerce investments do increase shareholder value. B2C provide the biggest increase.
Chatterjee, D., C. Pacini, et al. (Chatterjee, Pacini, & Sambamurthy, 2002)
Firm Size – small vs. large firms IT infrastructure vs. IT application Growth prospects Diversity – number of lines of
business Firm’s Industry – service vs. non-
service Firm’s Industry – financial vs. non-
financial Firm’s Industry – IT producing vs.
non IT producing
More positive abnormal returns for IT infrastructure than IT application investments
Dehning, B., V. J. Richardson, et al. (Dehning et al., 2003)
Firm’s Industry – financial vs. non-financial
Firm’s Size – small vs. medium vs. large firms
Industry IT Strategic role IT investment strategic role
IT Strategic role help explains stock market response to IT investments. Largest positive abnormal returns for IT investment announcements with transformative strategic role for both industry and investment
Hunter, S. D. (Hunter, 2003)
IT investments – explorative vs. exploitative
No abnormal returns for either explorative or exploitative IT
6
investments Agrawal, M., R. Kishore, et al. (Agrawal et al., 2006)
Positive abnormal returns for firms that incorporate as outsourcing as part of strategy and in a quick manner
Oh, M. J. Gallivan, et al. (Oh, Gallivan, & Kim, 2006)
Stock return volatility IT Strategic role Asset-specific IT resources Source of announcement Market to book ratio Firm size – small vs. large firms Firm’s industry – Financial vs. non-
financial
General support for IT investments. However, if investment is too large or contains sensitive competitive information, investors view the investment negatively.
Khallaf, A. and T. R. Skantz (Khallaf & Skantz, 2007)
CIO characteristics – experience in IT
CIO characteristics – new position CIO characteristics – graduate
degree vs. non-graduate degree Firm size – small vs. large firms CIO appointment – internal vs.
external
CIOs who have experience and education add value to the firm.
Nagm and Kautz (Nagm & Kautz, 2008)
Time – Y2K period Time – technology bubble Time – post technology bubble Firm size – small vs. Large firms
Positive abnormal returns for smaller firms and all time periods
Based on Table 1, our paper has extended and differentiated our study by focusing on the investment of IT on
the long term business values of firms. Our data covered a period of 27 years which have provide clear
evidence and understanding of the long term business values of IT investments. Our study also applied the
regression discontinuity design methodology to examine the long-term effects of IT investment announcements.
By employing the regression discontinuity design method, it allows us to better assess the impact of IT
investments and at the same time address many of the statistical constraints associated with other techniques
(e.g., assumptions related to randomization).
3.0 Theory and Hypotheses Development
Our theoretical development of this paper is based on Roztocki and Weistroffer (2015)’s research in
which they applied the Signaling Theory to explain stock reactions to enterprise integration technology.
Although our paper examines market’s reactions towards IT investments rather than specific enterprise
integration technology, we believe Signaling Theory is also relevant given that this research has employed an
event study approach similar to Roztocki and Weistroffer (2015)’s paper. Signaling theory examines the
communications between the different participants who have various accesses to information and with different
7
interests. When the sender communicates the information to the receiver, the receiver has to decide how to
interpret the information (or signal) (Roztocki and Weistroffer, 2015). The sender would send the information
that will be received in a way that is advantageous to the sender, while the receiving party interprets the
information in order to gain accurate information about the sender (Roztocki and Weistroffer, 2015). Signaling
theory is applied in this study by treating the signal as the event (i.e. IT investments). The sender in our
research is the releaser of the announcement while the receiver is the potential investor that interprets the
announcements and takes the necessary actions. When the IT investment announcement is interpreted as a
prediction of a substantial change in a company’s future cash flow, the investor will react to the announcement
by buying or selling the stock. For more detailed explanation of the application of signaling theory to event
study, please refer to Roztocki and Weistroffer (2015).
Firms that invest in technology may also gain a competitive advantage over their competitors by
adopting technologies that fit well the firm’s long-term goals and mission. Although the technology itself (i.e.
its processes, standards, skill sets, etc.) may be replicable by its competitors, the technology is much more
difficult to imitate when the technology is matched with the specific needs of a particular firm (Chatterjee et al.,
2002).
Developing and implementing a successful technology investment can take a long time and involves a
significant amount of capital, human and other resources. While the success of the investment may not be
realized as quickly as expected or meet the original estimated budget, in the end most technology investments
are deemed successful by their adopters. For example, the Standish Group (The Standish Group International,
2009) reports that over time, more and more technology investments have been implemented successfully. Its
survey of 9,236 projects reported that from 1994 to 2000, successful technology adoptions increased from 16%
to 28% and challenged adoptions remained about the same (from 53% to 49%). The report defines a successful
project as one that is completed on time and within budget with all expected technological features
implemented. A challenged project is one that is completed later than expected, over budget, and with less than
the expected technological features implemented. While it may be alarming that roughly half of all projects
were over budget and delayed, even these projects were implemented with some degree of success. As noted by
(Compass, 2009), most executives believe that in the end their firm’s technological investments improved firm
performance, competitiveness, and cost management.
In the long run, investments in IT (even partially successful ones) should have a positive effect on firm
value that would be reflected in Jensen’s alpha. Thus, if Jensen’s alpha increases after the announcement of an
investment in technology, investors should perceive the IT investment as value adding. Thus, hypothesis one is:
8
H1: Firms that announce investments in information technology will experience a positive shift in
the abnormal rate of return (i.e. a positive shift in the alpha coefficient).
Transient investors typically search for news announcements that suggest an increase in a stock’s
momentum as a result of changes in firm growth due to development and expansion (SERWER, 1997) or
changes in other important firm information including investments in IT (Bushee & Noe, 2000). For example,
firms that invest in transformational technologies are often planning an overhaul of their business that leads to
substantial future growth (Tanriverdi & Ruefli, 2004). Thus, we would expect IT investments to attract transient
investors in the short-term while attracting other institutional investors in the long-term. Thus, hypothesis two
is:
H2: Firms that announce investments in information technology will experience positive shifts in
relative volatility (i.e. a positive shift in the beta coefficient).
4.0 Regression Discontinuity
The regression discontinuity design (RDD), a pre-post two-group design used to measure the causal
and treatment effects within different groups, is used to test the hypotheses in this research. While RDD has had
little exposure in the business literature, it has been used extensively in the psychology and education literatures.
Interestingly, a number of recent studies in economics have used RDD as an alternative method for examining
causal effects for non-experimental data (Cook, 2008; Imbens & Lemieux, 2008).
(Thistlethwaite & Campbell, 1960) argue that RDD is preferable to the ex-post design because RDD
does not require the random assignment of subjects to experimental and control groups. The process of
assigning subjects to groups depends on a subject’s score on a relevant assignment variable (Campbell, D. T.,
Stanley, J. C., & Gage, 1963).
This research uses RDD to examine the effect of firm announcements of specific information
technology investments (i.e., the treatment) on the business valuation of the firm. This assumes that firms do
not make investments in IT randomly (K. W. Kobelsky, Richardson, Smith, & Zmud, 2008).
RDD is the preferred methodology for this research because it does not require strict statistical
compliance (i.e. sample size) except for a clearly, defined cutoff between the control group and the treatment
group for the assignment variable (Battistin & Rettore, 2002). In addition, the assignment variable does not
have to be correlated with the dependent variable and more than one assignment variable can be used (Shadish,
Cook, & Campbell, 2002). Finally, RDD does not require the sample to randomize the assignment of IT
9
investing firms to treatment and control groups (unlike OLS where we assume the sample is randomly collected)
(Campbell, D. T., Stanley, J. C., & Gage, 1963). These firms likely share similar characteristics, including large
financial resources, high institutional investor followings and complex operations (Dehning et al., 2006; Khallaf
& Skantz, 2007).
The requirements to use RDD are quite simple. First, the cutoff point must be clearly defined. In this
study, the cutoff point is the date of the IT investment announcement. Second, the cutoff point must clearly
separate the data into two groups: control and treatment groups. For this study, the control group is the time
prior to the IT announcement and the treatment group is the time after the IT announcement. Third, when
selecting the cutoff point, there cannot be any contemporaneous factors associated with the cutoff score. For
example, when the firm announces an investment in IT there cannot be an earnings or dividend announcement
on the same date. Finally, both the treatment and control groups must have complete sets of data.
While prior studies have typically used a small event window (often ten to forty days) to capture the
firm’s CAR, this study uses RDD to capture the firm’s CAR using a long-term event window. RDD is
acceptable under these circumstances as long as there are no discontinuous changes in the firm’s behavior (e.g.
the firm’s industry membership changes as a result of the IT investment).
This study estimates the impact of IT investment announcements on the business value of the firm
using the CAPM model in regression form based on Jensen’s modifications (Equation 1):
(1)
Where
= return for firm I at time t,
= risk free rate at time t,
= market return at time t.
is Jensen’s alpha, a risk adjusted performance measurement capturing excess returns,
= captures the relative volatility of the individual firm’s rate of return compared to the market’s
rate of return.
IT investment announcements were grouped based on the specific type of IT as well as other firm and
performance-related characteristics. The grouping criteria are described below.
10
4.1.1. Additional Control Variables
The IT literature suggests that not all technologies are equal and that different technologies provide
different financial benefits to a firm. This section describes the individual technologies and IT strategies that are
used in this study.
IT Strategic Role. IT Strategic Role is applied to the firm. These strategic roles include automate,
informate, or transformate. To code the IT strategic role for each announcement, three recognized scholars in
the area of IT strategy were independently asked to indicate the role that IT served in the particular
announcement – whether automate, informate, or transformate using the coding rules established by Dehning et
al. [24]. The inter-rater reliability was 0.83, and all differences were reconciled as a group.
4.1.2. Performance Metrics
This section describes the performance metrics used to group the IT investment announcements for
testing. The performance metrics described below are often used to measure the short-term effect of IT
investments. However, these metrics were used in this study to determine whether firms that show a short-term
benefit from IT investments maintain the benefit over a longer period of time.
Return on Sales (ROS) – ROS is net income (before interest and taxes) divided by sales. This ratio is
used to evaluate the firm’s operating efficiency. Investors use ROS to assess how much profit the firm
generates per dollar of sales.
Return on Assets (ROA) – ROA equals net income divided by total assets. It signals to investors how
well the firm’s assets are managed to generate profits.
Return on Equity (ROE) – ROE is net income divided by shareholders equity and is expressed as a
percentage. ROE tells investors how well shareholder investments are managed by the firm to generate profits.
4.1.3. Firm Characteristics
Finally, IT investment announcements are grouped based on firm characteristics. Firm characteristics
will likely have an effect on the results because not all firms that make investments in IT share similar firm
characteristics. These characteristics have often been used as control variables in prior research studies and are
used similarly in this study.
Size – Size is defined as the natural log of the firm’s total assets for the year of the IT investment
announcement. The inclusion of size as a control variable has produced mixed results in prior studies. For
11
example, while (Im et al., 2001) reported that small firms are much more sensitive to IT investments, their
results were not replicated in other studies.
Industry – Whether the firm is a member of the financial industry is examined for the sake of
consistency. This was done in spite of the fact that prior studies have not found that being a member of the
financial industry affects a firm’s return (Chatterjee et al., 2002; Davis, Dehning, & Stratopouos, 2003; Dos
Santos et al., 1993; Im et al., 2001; Oh, Gallivan, et al., 2006). Thus, if the firm is a member of the financial
industry it is coded as a “1”; otherwise it is coded as “0”.
Quick Ratio (slack) – The quick ratio equals the firm’s current assets less any inventories, divided by
the firm’s current liabilities. The quick ratio is a proxy for slack.
4.1.4. IT investment announcements
The IT investment announcements used in this research included 238 announcements collected by(Im
et al., 2001), 96 announcements collected by (Chatterjee et al., 2001), 112 additional unique announcements
collected by (Chatterjee et al., 2002), 150 announcements collected by Hunter (Hunter, 2003), and 85 ERP
announcements that were collected by (D. C. Hayes, Hunton, & Reck, 2001). After both duplicate and non-
locatable announcements were removed, a total of 532 existing IT investment announcements remained.
A total of 287 additional IT investment announcements were collected using the procedure described
by (Im et al., 2001) and (Duan, Grover, & Balakrishnan, 2009): using pre-selected keywords, the Lexis Nexus
and Business and Industry databases were searched for IT investment announcements during the period 1982-
2007. We selected the early 1980s as the starting time period of our study as this is the time period when the
IBM PCs, IBM PC Clones and Apple computers were introduced and organizations started to invest in
computers and IT as a result of more affordable computers. The time period selected in our study also include
the emergence of the Internet as well as the pre and post Internet Bubble period. The pre-selected keywords
infrastructure, and IT outsourcing. The additional requirements for the inclusion of the 287 new announcements
where:
The firms investing in IT were traded only on the NYSE, NASDAQ, and AMEX.
No potentially confounding events took place within three days surrounding the announcement
period (e.g. earnings, dividends, mergers/acquisition, etc.)
Financial information about the IT investing firms was available from CRSP and Compustat.
12
Table II provides a summary of the announcements by source and Table III provides a summary of the
announcements by year. After duplicate and non-locatable announcements were removed, the combined total
of usable existing and new IT investment announcements was 810.
Table II: Number of IT investment Announcements by Source Source Number of announcements (Chatterjee et al., 2002) 112 (D. C. Hayes et al., 2001) 85 (Im et al., 2001) 238 (Hunter, 2003) 150 (Chatterjee et al., 2001) 96 Additional Collected 287 Less Duplicates and non-locatable announcements (158) Total Usable IT Investment Announcements 810
Table III: Number of usable IT investment Announcements by Year Year Number Year Number 1982 5 1995 88 1983 1 1996 69 1984 3 1997 85 1985 26 1998 59 1986 11 1999 22 1987 17 2000 49 1988 17 2001 32 1989 18 2002 35 1990 22 2003 25 1991 21 2004 13 1992 38 2005 6 1993 57 2006 11 1994 74 2007 6 Total 810
13
Daily firm and market returns were collected from the CRSP database. The one-month Treasury bill
rate was used as the risk-free rate. Each firm’s financial and other characteristics were taken from the Research
Insight Compustat database.
4.1.5 Summary Statistics
Table IV presents descriptive statistics for the study variables. As indicated, the average firm return is
smaller than the average market return and firm returns vary slightly more than market returns (standard
deviation of firm return = .0298; market return = .0071). Thus, it appears that alpha and beta did not change
much across the time period surrounding the IT investment announcement. The average size of the firms
included in the study is large: average firm sales = $14.0 billion; average number of employees = 75,000;
average (median) total assets = $9.4 ($0.669) billion and average (median) total debt = $10.2 ($1.01) billion.
14
Table IV: Descriptive Statistics
Variable N Mean Median Std Dev Minimum Maximum Skewness Kurtosis
Firm return: calculated return for the individual firm from event date i to date t less the risk free rate, Market return: calculated return for the market from event date i to date t less the risk free rate, Size (Total Assets): Total assets of the firm, in millions, Sales: Total sales in millions, Return on Assets: Net income divided by total assets, Return on Equity: Net income divided by shareholders equity, Return on Sales: Net income divided by sales, Quick Ratio: Current assets less any inventories, divided by the firm’s current liabilities, Employees: Number of employees for the firm, in thousands, Total Debt: Total debt in millions, Debt to equity: Total debt divided by total shareholders’ equity
4.2 Regression Discontinuity Analysis
The general linear model (GLM) was used to analyze the shifts in alpha and beta related to firm
announcements of IT investments (see Equation 2).
(2)
The dependent variable in this analysis is the firm’s daily return adjusted for the daily risk-free rate
. The independent variables are the market’s daily return adjusted for the daily risk-free rate
henceforth labeled as market , a timing variable (prepost), signified as a 1 if the
15
observation occurred after the event date and a zero if before, and an interaction term
involving adjusted market returns and the timing
variable.
The results of the regression discontinuity analysis are presented in Table V: is the Jensen’s alpha
for the overall model and the overall model’s beta11. The alpha and beta shifts, and ,
respectively, measure the changes in alpha and beta at the post-IT investment announcement discontinuity point.
Table V: Results of the Regression Discontinuity Analysis Variable Estimate T –value P Value
According to Hypothesis One, there will be a positive shift in a firm’s alpha after the firm announces
an investment in IT. As indicated in Table V, there is a small, positive alpha shift , p = .0386)
after an IT investment announcement that supports Hypothesis One . This suggests that investors can
increase their returns by investing in firms that invest in IT even though this would have only a small effect on
the size of their portfolios.
According to Hypothesis Two, there will be a positive shift in a firm’s beta after the firm announces an
IT investment. As shown in Table V, the model supports a positive beta shift after the IT investment
announcement ( , p = .00003). Thus, although investors who invest in firms that invest in IT would
increase their risk, over the long term in a growing market investor returns would also increase.
1 We tested the robustness of the regression model (Leamer, 1983; Wooldridge, 2015) found in
equation 2 to determine the relative stability of the parameter estimates. To do so, we included control variables as described in table IV in the regression specification. When different control variables were introduced to the regression model, the overall direction and magnitude of the parameter estimates were structurally similar to the regression model found in equation 2 – which indicates the regression model is not likely to have been misspecified.
16
4.3 Additional Analyses
Additional analyses, including the timing of the announcement (pre or post productivity paradox), firm
size, IT intensity and IT strategic role, were performed to determine the effect of these variables on the observed
alpha and beta shifts in the overall model. This section describe these additional analyses.
Timing of the IT Investment Announcement (Pre or Post Productivity Paradox)
The existing BVIT literature suggests that firms did not benefit from IT investment investments until
after 1992 (E. Brynjolfsson & Hitt, 1996). This phenomenon was labeled the “productivity paradox”. It is
important to examine the productivity paradox because IT investment announcements prior to 1992 may reduce
the size and significance of alpha and beta shifts after 1992. To test for the productivity paradox affect, firms are
classified as pre and post 1992 by the year of the announcement.
Table VI presents the results of the regression discontinuity analysis of IT investment announcements
made pre (Panel A) and post (Panel B) 1992. Pre-Productivity Paradox results indicate that neither alpha nor
beta shifts occurred prior to 1992 (p = .0592 and .1851 respectively). The Post-Productivity Paradox results
indicate there were positive shifts in both alpha (.0647, p <.0001) and beta (.0003, p = .0085) after 1992. The
post-1992 increase in alpha suggests that the returns of investors who invest in firms that announced
investments in IT after 1992 will increase (E. Brynjolfsson & Hitt, 1996). However, the magnitude of the
increase will be very small. The post 1992 increase in beta suggests IT investment announcements attract more
investor types, such as transient investors (Ke & Petroni, 2004).
Table VI: Results of Regression Analysis Panel A: Productivity Paradox – Pre 1992 Variable Estimate T -value P Value Intercept -0.0001 -0.74 0.4597 Market (β1) 1.3313 75.97 <.0001 Prepost (β3) -0.0003 -1.89 0.0592 Market*Prepost (β2) -0.0327 -1.33 0.1851 Note: n=68,586, R2 = .1421, F = 3787.80, p<.0001 Panel B: Productivity Paradox – Post 1992 Variable Estimate T -value P Value Intercept -0.0007 -9.43 <.0001 Market (β1) 1.1552 105.22 <.0001 Prepost (β3) 0.0003 2.63 0.0085 Market *Prepost (β2) 0.0647 4.33 <.0001 Note: n=319,988, R2 = .0750, F = 8539.71, p<.0001
17
Firm Size
Prior BVIT studies have also examined the effect of firm size on shifts in alpha and beta. For example,
(Im et al., 2001) and (Dehning et al., 2003) reported that small firms often have lower stock prices and higher
volatility than large firms because small firms have the ability to incorporate technology quickly. On the other
hand, results reported by (Chatterjee et al., 2002) and (Oh, Gallivan, et al., 2006) did not support a firm-size
effect.
Firm size is defined as the total asset value of the firm at the time of its IT investment announcement.
The median asset value of the firms in the study ($670 million) was used to differentiate between large and
small firms. The regression discontinuity results for firm size are presented in Panels A and B in Table VI.
These results suggest that firms with total assets above $670 million experience a positive alpha shift (p =
.0493) while firms with total assets below $670 million experience a positive beta shift (p = .0002). The results
for firms with total assets below $670 million are not unexpected because small firms tend to be more volatile
(Bushee & Noe, 2000; Im et al., 2001). In additions, investors may believe smaller firms will generate greater
future cash flows from their IT investments than larger firms will (Nagm & Kautz, 2008). The positive alpha
shift for firms with total assets above $670 million suggests that the returns of investors who invest in large
firms that invest in IT will increase. However, the magnitude of the increase will be small.
Table VII: Results of Regression Analysis Panel A: Small Firms Variable Estimate T –value P Value Intercept -0.0005 -5.66 <.0001 Market (β1) 1.2465 81.75 <.0001 Prepost (β3) 0.0002 1.29 0.1973 Market *Prepost (β2) 0.0764 3.71 0.0002 Note: n=191,268, R2 = .0713, F = 5261.57, p<.0001 Panel B: Large Firms Variable Estimate T –value P Value Intercept -0.0006 -8.98 <.0001 Market (β1) 1.1152 104.93 <.0001 Prepost (β3) 0.0002 1.97 0.0493 Market *Prepost (β2) 0.0005 0.03 0.9724 Note: n=197,306, R2 = .1135, F = 7629.49, p<.0001
18
IT Intensive Firms
(Mittal & Nault, 2009) note that some firms are more IT intensive in their operations due to the nature
of their business and industry; as IT intensive firms have a greater need to maintain industry standards and
competitiveness. The IT Intensity of firms can be estimated based on the business sector in which the firm is
classified. Absent several exceptions (e.g., firms in the chemical and petroleum or the electrical and controlling
equipment industries), manufacturing firms are generally considered low in IT intensity (Mittal & Nault, 2009).
Firms are classified as highly IT intensive by their SIC code and membership in the following industries:
transportation, retail, financial and service. All remaining industries are classified as low IT intensive. Table
VIII presents the study results for low and high IT Intensive firms.
Table VIII: Results of Regression Analysis Panel A: IT Intensive Firms - Low Variable Estimate T -value P Value
Intercept -0.0005 -4.62 <.0001 Market (β1) 1.1764 74.6 <.0001 Prepost (β3) 0.0001 0.61 0.5399 Market *Prepost (β2) 0.0097 0.46 0.6481 Note: n=128,961, R2 = .0890, F = 4141.03, p<.0001 Panel B: IT Intensive Firms - High Variable Estimate T –value P Value
These results show that investors who invest in firms that adopt IT increase their portfolio returns.
However, not all investors have the resources needed to invest wisely in IT investing firms. Thus, this raises the
question of “Who is investing in IT investing firms?”
Future researchers can address this question using both experimental and market data. For example,
experimental data can be used to compare the investment results of expert and novice investors. Using market
2 Because the CAPM oversimplifies the market by comparing excess investor returns to the market using only beta, the Fama-French 3 factor model was used to control for the impact of important variables that influence the market’s movements including differences between small and large cap stocks and value and growth stocks.
25
data, researchers should be able to examine the buying/selling of the stock of IT investing firms surrounding an
IT investment announcement. This examination should provide additional support for prior studies’ conclusions
that IT investment announcements matter. This research should also provide practical insight about the types of
investors who profit from investing in IT investing firms.
Another question that should be addressed in future research is “Does the timing or informational
content of IT investment announcements affect investor behavior?” Because IT investment announcements are
selectively written and released, it would appear that the management of IT investing firms believes they do.
This examination could be best accomplished using content-analytic methods such as those developed in the
Lastly, our research used data from 1982 to 2007. Future studies can extend this by examining data
from 2007 onwards.
26
References
[1] Agrawal, M., Kishore, R., & Rao, H. (2006). Market reactions to E-business outsourcing announcements: An event study. Information & Management, 43(7), 861-873.
[2] Asekome, M.O. and Agbonkhese, A.O. (2015). Macroeconomic Variables, Stock Market Bubble, Meltdown and Recovery: Evidence from Nigeria.Journal of Finance, 3(2), 25-34.
[3] Alpar, P., & Kim, M. (1990). A microeconomic approach to the measurement of information technology value. Journal of Management Information Systems, 7(2), 55-69.
[4] Armstrong, C., & Sambamurthy, V. (1999). Information technology assimilation in firms: The influence of senior leadership and IT infrastructures. Information Systems Research, 10(4), 304-327.
[5] Asquith, P., Mikhail, M., & Au, A. (2005). Information content of equity analyst reports. Journal of Financial Economics, 75(2), 245-282.
[6] Barua, A., Kriebel, C. H., & Mukhopadhyay, T. (1995). Information technologies and business value - an analytic and empirical-investigation. Information Systems Research, 6(1), 3-23.
[7] Battistin, E., & Rettore, E. (2002). Testing for programme effects in a regression discontinuity design with imperfect compliance. Journal of the Royal Statistical Society: Series A (Statistics in Society), 165(1), 39-57.
[8] Bharadwaj, A. S., Bharadwaj, S. G., & Konsynski, B. R. (1999). Information technology effects on firm performance as measured by Tobin's q. Management Science, 45(7), 1008-1024.
[9] Brealey, R., Myers, S., & Marcus, A. (2007). Fundamentals of Corporate Finance (5th ed.). Boston: McGraw-Hill.
[10] Brynjolfsson, E. (1993). The productivity paradox of information technology. Communications of the ACM, 36(12), 67-77.
[11] Brynjolfsson, E., & Hitt, L. (1996). Paradox lost? Firm-level evidence on the returns to information systems spending. Management Science, 42(4), 541-558.
[12] Bushee, B. J., & Noe, C. F. (2000). Corporate disclosure practices, institutional investors, and stock return volatility. Journal of Accounting Research, 38(3), 171-202.
[13] Campbell, D. T., & Stanley, J. C. (1963). Experimental and quasi-experimental designs for research on teaching. [Chicago: American Educational Research Association.
[14] Chai, S., Kim, M. & Rao, H.R. (2011). Firms' information security investment decisions: Stock market evidence of investors' behavior. Decision Support Systems, 50(4), 651 – 661.
[15] Chan, Y.C. (2014). How does retail sentiment affect IPO returns? Evidence from the internet bubble period. International Review of Economics & Finance, 29, 235-248.
[16] Chatterjee, D., Pacini, C., & Sambamurthy, V. (2002). The shareholder-wealth and trading-volume effects of information-technology infrastructure investments. Journal of Management Information Systems, 19(2), 7-42.
[17] Chatterjee, D., Richardson, V. J., & Zmud, R. W. (2001). Examining the shareholder wealth effects of announcements of newly created CIO positions. MIS Quarterly, 25(1), 43-70.
[18] Chong, A.Y.L. and Bai, R. (2014). Predicting open IOS adoption in SMEs: An integrated SEM-neural network approach. Expert Systems with Applications, 41(1), 221- 229.
[19] Chou, D. C., Tan, X., & Yen, D. C. (2004). Web technology and supply chain management. Information Management & Computer Security, 12(4), 338-349.
[20] Compass. (2009). Aim low: The key to IT value contribution lies deep within business processes., from <http://www.compassmc.com/admin/uploaded/aim%20low.pdf>
[21] Cook, T. D. (2008). "Waiting for Life to Arrive": A history of the regression-discontinuity design in Psychology, Statistics and Economics. Journal of Econometrics, 142(2), 636-654.
[22] Davis, L., Dehning, B., & Stratopoulos, T. (2003). Does the market recognize IT-enabled competitive advantage? Information & Management, 40(7), 705.
[23] Dehning, B., Pfeiffer, G. M., & Richardson, V. J. (2006). Analysts' forecasts and investments in information technology. International Journal of Accounting Information Systems, 7(3), 238-250.
[24] Dehning, B., Richardson, V. J., & Zmud, R. W. (2003). The value relevance of announcements of transformational information technology investments. MIS Quarterly, 27(4), 637-656.
[25] Dewan, S., & Fei, R. (2007). Risk and return of information technology initiatives: Evidence from electronic commerce announcements. Information Systems Research, 18(4), 370-394.
[26] Dos Santos, B., Peffers, G. K., & Mauer, D. C. (1993). The impact of information technology investment announcements on the market value of the firm. Information Systems Research, 4, 1-23.
[27] Duan, C., Grover, V. & Balakrishnan, N.R. (2009). Business Process Outsourcing: an event study on the nature of processes and firm valuation. European Journal of Information Systems, 18(5), 442 – 457.
[28] Gartner Group (2013), Gartner Says Worldwide IT Spending Forecast to Reach $3.7 Trillion in 2013, http://www.gartner.com/newsroom/id/2292815 [accessed 18th of February, 2016].
[29] Hayes, D. C., Hunton, J. E., & Reck, J. L. (2000). Information systems outsourcing announcements: Investigating the impact on the market value of contract-granting firms. Journal of Information Systems, 14(2), 109.
[30] Hayes, D. C., Hunton, J. E., & Reck, J. L. (2001). Market reactions to ERP implementation announcements. Journal of Information Systems, 15(1), 3.
[31] Hendrick, K.B., Singhal, V.R., Stratman, J.K. (2007). The impact of enterprise systems on corporate performance: A study of ERP, SCM, and CRM system implementations. Journal of Operations Management, 25(1), 65-82.
[32] Hitt, L. M., & Brynjolfsson, E. (1996). Productivity, business profitability, and consumer surplus: Three different measures of information technology value. Mis Quarterly, 20(2), 121-142.
[33] Hunter, S. D. (2003). Information technology, organizational learning, and the market value of the firm. Journal of Information Technology Theory and Application, 5(1), 1-28.
[34] Im, K., Dow, K., & Grover, V. (2001). A Reexamination of IT investment and the market value of the firm: An event study methodology. Information Systems Research, 12, 103-117.
[35] Imbens, G., & Lemieux, T. (2008). Special issue editors' introduction: The regression discontinuity designs' Theory and applications Journal of Econometrics 142, 611-614.
[36] Ke, B., & Petroni, K. (2004). How informed are actively trading institutional investors? Evidence from their trading behavior before a break in a string of consecutive earnings increases. Journal of Accounting Research, 42(5), 895-927.
[37] Khallaf, A., & Skantz, T. R. (2007). The effects of information technology expertise on the market value of a firm. Journal of Information Systems, 21(1), 83-105.
[38] Kobelsky, K., Hunter, S., & Richardson, V. J. (2008). Information technology, contextual factors and the volatility of firm performance. International Journal of Accounting Information Systems, 9(3), 154-174.
[39] Kobelsky, K., Richardson, V. J., Smith, R. E., & Zmud, R. W. (2008). Determinants and consequences of firm information technology budgets. Accounting Review, 83(4), 957-995.
[40] Leamer, E. E. (1983). Let’s take the con out of econometrics. American Economic Review.73, 31-43. [41] Li, M. F., & Ye, L. R. (1999). Information technology and firm performance: Linking with
environmental, strategic and managerial contexts. Information & Management, 35(1), 43-51. [42] Li, T., Van Heck, E., & Vervest, P. (2009). Information capability and value creation strategy:
advancing revenue management through mobile ticketing technologies. European Journal of Information Systems, 18(1), 38-51.
[43] Loveman, G. W. (1994). An assessment of the productivity impact of information technologies. In T. J. Allen & M. S. S. Morton (Eds.), Information Technology and the Corporation of the 1990s: Research Studies B2 - Information Technology and the Corporation of the 1990s: Research Studies. Oxford: Oxford University Press.
[44] Lui, A.K., Ngai, E.W. and Lo, C.K. (2015). Disruptive information technology innovations and the cost of equity capital: The moderating effect of CEO incentives and institutional pressures. Information & Management, 53(3), 345 – 354.
[45] Mahmood, M. A., & Mann, G. J. (1993). Measuring the organizational impact of information technology investment: An exploratory study. Journal of Management Information Systems, 10(1), 97-122.
[46] Meng, Z. & Lee, S-Y.M. (2007). The value of IT to firms in a developing country in the catch-up process: An empirical comparison of China and the United States. Decision Support Systems, 43(3), 737 – 745.
[47] Mitra, S. (2005). Information technology as an enabler of growth in firms: An empirical assessment. Journal of Management Information Systems, 22(2), 279-300.
[48] Mittal, N., & Nault, B. (2009). Investments in information technology: Indirect effects and information technology intensity. Information Systems Research, 20(1), 140.
[49] Nagm, F., & Kautz, K. (2008). The market value impact of IT investment announcements - an event study. JITTA : Journal of Information Technology Theory and Application, 9(3), 61.
[50] Oh, W., Gallivan, M. J., & Kim, J. W. (2006). The market's perception of the transactional risks of information technology outsourcing announcements. Journal of Management Information Systems, 22(4), 271-303.
[51] Oh, W., Kim, J. W., & Richardson, V. J. (2006). The moderating effect of context on the market reaction to IT investments. Journal of Information Systems, 20(1), 19-44.
[52] Panko, R. R. (2008). IT employment prospects: beyond the dotcom bubble. European Journal of Information Systems, 17(3), 182-197.
[53] Rai, A., Patnayakuni, R., & Patnayakuni, N. (1996). Refocusing where and how IT value is realized: An empirical investigation. Omega-International Journal of Management Science, 24(4), 399-412.
[54] Ritter, J., & Warr, R. (2002). The decline of inflation and the bull market of 1982-1999. The Journal of
28
Financial and Quantitative Analysis, 37(1), 29-61. [55] Roztocki, N. and Weistroffer, H.R. (2015). Investments in enterprise integration technology: An event
study. Information Systems Frontiers, 17(3), 659-672. [56] Serwer, A. (1997). The scariest tech stock ever! Fortune, 136(9), 223-224. [57] Shadish, W. R., Cook, T. D., & Campbell, D. T. (2002). Experimental and quasi-experimental designs
for generalized causal inference. Boston [u.a.: Houghton Mifflin. [58] StandishGroup. (2009). Extreme chaos, from
<http://www.standishgroup.com/sample_research/showfile.php?File=extreme_chaos.pdf> [59] Subramani, M., & Walden, E. (2001). The impact of e-commerce announcements on the market value
of firms. Information Systems Research, 12(2), 135. [60] Tam, K. Y. (1998). The impact of information technology investments on firm performance and
evaluation: Evidence from newly industrialized economies. Information Systems Research, 9(1), 85-98. [61] Tanriverdi, H., & Ruefli, T. (2004). The role of information technology in risk/return relations of firms.
Journal of the Association of Information Systems, 5(11-12), 421-447. [62] Thiesse, F., Al-Kassab, J., & Fleisch, E. (2009). Understanding the value of integrated RFID systems: a
case study from apparel retail. European Journal of Information Systems, 18(6), 592-614. [63] Thistlethwaite, D. L., & Campbell, D. T. (1960). Regression-discontinuity analysis: An alternative to
the ex post facto experiment. Journal of Educational Psychology, 51(6), 309-317. [64] Verrecchia, R. (2001). Essays on disclosure. Journal of Accounting & Economics, 32(December), 97-
180. [65] Weill, P. (1992). The relationship between investment in information technology and firm
performance: A study of the value manufacturing sector Information Systems Research. 3, 307-333. [66] Wooldridge, J. (2015). Introductory econometrics: A modern approach, Nelson Education