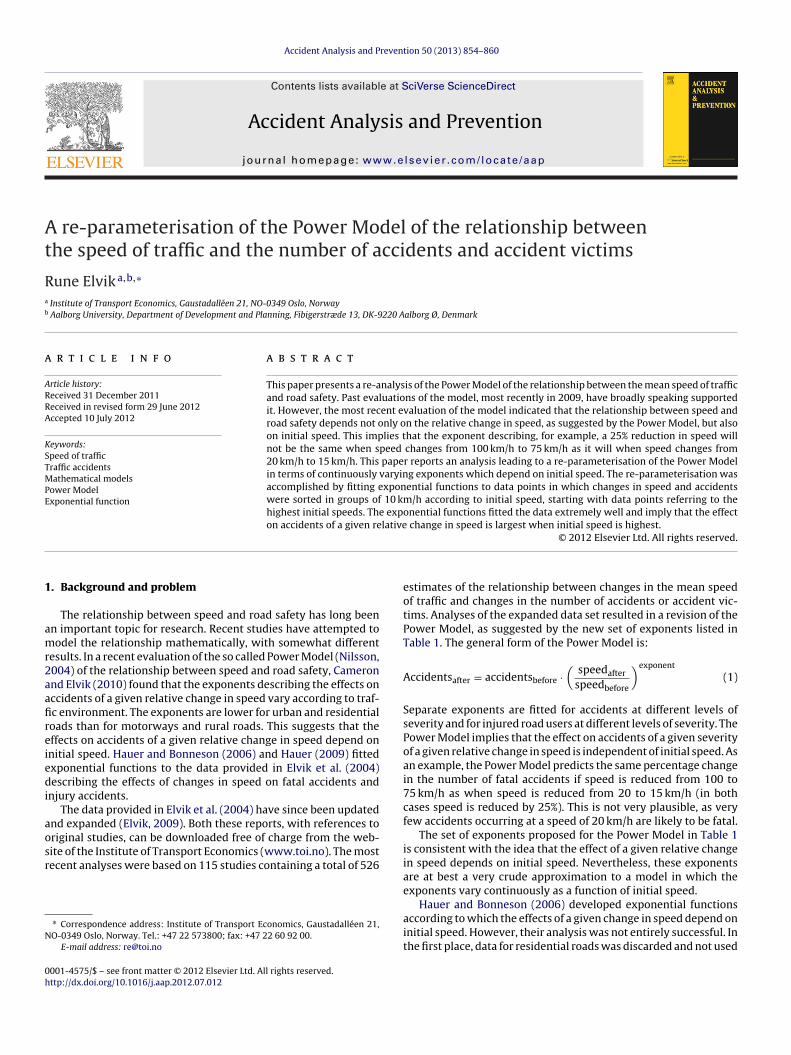
Accident Analysis and Prevention 50 (2013) 854– 860
Contents lists available at SciVerse ScienceDirect
Accident Analysis and Prevention
jo ur n al hom ep a ge: www.elsev ier .com/ locate /aap
re-parameterisation of the Power Model of the relationship betweenhe speed of traffic and the number of accidents and accident victims
une Elvika,b,∗
Institute of Transport Economics, Gaustadalléen 21, NO-0349 Oslo, NorwayAalborg University, Department of Development and Planning, Fibigerstræde 13, DK-9220 Aalborg Ø, Denmark
r t i c l e i n f o
rticle history:eceived 31 December 2011eceived in revised form 29 June 2012ccepted 10 July 2012
eywords:peed of traffic
a b s t r a c t
This paper presents a re-analysis of the Power Model of the relationship between the mean speed of trafficand road safety. Past evaluations of the model, most recently in 2009, have broadly speaking supportedit. However, the most recent evaluation of the model indicated that the relationship between speed androad safety depends not only on the relative change in speed, as suggested by the Power Model, but alsoon initial speed. This implies that the exponent describing, for example, a 25% reduction in speed willnot be the same when speed changes from 100 km/h to 75 km/h as it will when speed changes from
raffic accidentsathematical models
ower Modelxponential function
20 km/h to 15 km/h. This paper reports an analysis leading to a re-parameterisation of the Power Modelin terms of continuously varying exponents which depend on initial speed. The re-parameterisation wasaccomplished by fitting exponential functions to data points in which changes in speed and accidentswere sorted in groups of 10 km/h according to initial speed, starting with data points referring to thehighest initial speeds. The exponential functions fitted the data extremely well and imply that the effecton accidents of a given relative change in speed is largest when initial speed is highest.
. Background and problem
The relationship between speed and road safety has long beenn important topic for research. Recent studies have attempted toodel the relationship mathematically, with somewhat different
esults. In a recent evaluation of the so called Power Model (Nilsson,004) of the relationship between speed and road safety, Cameronnd Elvik (2010) found that the exponents describing the effects onccidents of a given relative change in speed vary according to traf-c environment. The exponents are lower for urban and residentialoads than for motorways and rural roads. This suggests that theffects on accidents of a given relative change in speed depend onnitial speed. Hauer and Bonneson (2006) and Hauer (2009) fittedxponential functions to the data provided in Elvik et al. (2004)escribing the effects of changes in speed on fatal accidents and
njury accidents.The data provided in Elvik et al. (2004) have since been updated
nd expanded (Elvik, 2009). Both these reports, with references to
riginal studies, can be downloaded free of charge from the web-ite of the Institute of Transport Economics (www.toi.no). The mostecent analyses were based on 115 studies containing a total of 526
∗ Correspondence address: Institute of Transport Economics, Gaustadalléen 21,O-0349 Oslo, Norway. Tel.: +47 22 573800; fax: +47 22 60 92 00.
estimates of the relationship between changes in the mean speedof traffic and changes in the number of accidents or accident vic-tims. Analyses of the expanded data set resulted in a revision of thePower Model, as suggested by the new set of exponents listed inTable 1. The general form of the Power Model is:
Accidentsafter = accidentsbefore ·(
speedafter
speedbefore
)exponent
(1)
Separate exponents are fitted for accidents at different levels ofseverity and for injured road users at different levels of severity. ThePower Model implies that the effect on accidents of a given severityof a given relative change in speed is independent of initial speed. Asan example, the Power Model predicts the same percentage changein the number of fatal accidents if speed is reduced from 100 to75 km/h as when speed is reduced from 20 to 15 km/h (in bothcases speed is reduced by 25%). This is not very plausible, as veryfew accidents occurring at a speed of 20 km/h are likely to be fatal.
The set of exponents proposed for the Power Model in Table 1is consistent with the idea that the effect of a given relative changein speed depends on initial speed. Nevertheless, these exponentsare at best a very crude approximation to a model in which theexponents vary continuously as a function of initial speed.
Hauer and Bonneson (2006) developed exponential functionsaccording to which the effects of a given change in speed depend oninitial speed. However, their analysis was not entirely successful. Inthe first place, data for residential roads was discarded and not used
n the analyses. In the second place, analysis was not successful forroperty-damage-only accidents. In the third place, analysis reliedn individual data points, some of which are very uncertain. In theourth place, the functions developed are somewhat complex andhe possibility of developing a more parsimonious version of themeserves to be explored. The functions developed by Hauer andonneson (2006) were formulated as follows:
MF (for speed change from v to v∗) = e˛[v−v∗+(ˇ/2)·(v2−v∗2)]
(2)
MF is the accident modification factor associated with a certainhange in speed. Thus, an AMF of, for example, 0.80 corresponds ton accident reduction of 20%. Speed is stated in miles per hour. ˛nd ̌ are coefficients estimated by means of regression analysis.he exponential functions developed by Hauer and Bonneson fittedhe data slightly better than the Power Model.
The objective of this paper is to continue analysis along the linesf Hauer and Bonneson. The Power Model will be compared to anxponential model in order to determine which model best fits theata. The next section explains the approach taken to analysis.
. Data and methods
.1. Data aggregation
The data base compiled by Elvik (2009) contains a total of 526stimates of the relationship between changes in speed in changesn road safety. The largest number of estimates is found for injuryccidents. Table 2 presents some summary statistics for the data.
Analysis relying on the data aggregation approach explainedelow was only feasible for fatal accidents, injury accidents androperty-damage-only accidents. The other categories listed inable 2 were not included in the analyses reported in this paper.ig. 1 shows the relationship between initial speed (km/h) and esti-ates of the exponent in the Power Model for injury accidents. Six
utlying data points were omitted to improve the readability ofhe figure. Each estimate of the exponent in the Power Model wasefined as:
stimate of exponent = ̨ = ln(Y1/Y0)ln(V1/V0)
here Y0 is the number of accidents before a change in speed, Y1 ishe number of accidents after a change in speed, V0 is speed beforehe change and V1 is speed after the change. The values of these
ariables were reported in each of the studies that were includedn the data base (Elvik, 2009). No clear relationship can be detectedetween initial speed and the value of the exponent. However, Fig. 1
gnores the fact that the standard errors of the data points vary
.8 (0.1, 1.5) 1.0 (0.5, 1.5)
considerably; more precise data points should count for more thanless precise data points. As an example, the standard error of theleftmost data point in Fig. 1 is 6.15. The best estimate of the expo-nent is 6.82. Hence, a 95% confidence interval ranges from −5.23to 18.87. Other data points are more precise and should thereforecarry greater weight. Since many of the data points are imprecise,a case can be made for aggregating data points to make them moreprecise and suitable for analysis.
In Table 3, the data for injury accidents has been placed in twelvegroups according to initial speed. Each group contains estimatesthat refer to initial speeds in a range of 10 km/h. Eleven of thesegroups contain one or more estimates of the exponent in the PowerModel. Thus, there were 16 estimates for initial speeds between100 and 109.9 km/h. The mean estimate of the exponent for these16 estimates and the standard error of the mean are also shownin Table 3. The mean estimates of the exponent were obtained bysynthesising individual estimates by means of meta-analysis. Eachestimate was assigned a statistical weight inversely proportional toits sampling variance and a weighted mean estimate of the expo-nent was developed. Technical details can be found in Elvik et al.(2004).
Even within each of the groups included in Table 3, estimates ofthe exponent vary considerably. Fig. 2 shows a funnel plot of the 16estimates of the exponent referring to initial speeds between 100.0and 109.9 km/h. The solid vertical line shows the mean estimateof the exponent (3.87). The dashed lines indicate the contours ofthe funnel. If the variation in the estimates of the exponent wererandom only, all data points ought to be located inside the contours.However, as seen in Fig. 2, many data points are located outsidethe contours of the funnel. Even so, one can discern a tendency forestimates with small standard errors to be clustered more closelytogether than estimates with large standard errors. The weightedmean estimate is close to the centre of the distribution, with sevenestimates greater than the mean and nine estimates smaller thanthe mean.
The exponents listed in Table 3 show a tendency, albeit some-what irregular, to become smaller as initial speed becomes lower.Thus, all exponents for initial speeds above 80 km/h are greaterthan 3. The majority of exponents for initial speeds from 70 km/hand below are smaller than 2. Thus, aggregating the data seems toreveal a pattern that was not readily observable in the swarm ofindividual data points shown in Fig. 1. The analyses have thereforebeen based on aggregated data as shown in Table 3.
2.2. Chaining estimates of accident modification factors
The estimates of the exponents in each of the groups in Table 3are based on quite different changes in speed. Thus, initial speeds inthe interval from 100.0 to 109.9 km/h varied between 100.0 km/h
856 R. Elvik / Accident Analysis and Prevention 50 (2013) 854– 860
Table 2Summary of key statistics for the data used in the analyses.
nd 106.8 km/h, with a mean of 103.0 km/h. Final speeds variedrom 91.4 to 107.0 km/h. The mean final speed was 100.6 km/h.hus, the final speed in this interval did not correspond to the initialpeed in the next interval (90.0–99.9 km/h), which was 95.0 km/h.
It is seen, however, that the mean values for initial speeds inable 3 (113.8; 103.0; 95.0; 84.6; 74.6; 64.5; 54.5; 45.8; 35.5) areuite close to the midpoint of each interval (115, 105, 95, 85, 75,5, 55, 45, 35). Initial and final speeds were therefore “chained” in
he following way: If initial speed was 115 km/h, final speed wasssumed to be 105 km/h. This in turn was treated as the initial speedn the next interval, and so on. Table 4 illustrates the approach.lthough these values for initial and final speed are not identical
-80.000
-60.000
-40.000
-20.000
0.000
20.000
40.000
60.000
80.000
100.000
60.040.020.00.0
Expo
nent
Ini�al sp
Rela�onship between ini �al speed (kmPower Mod el for in
Six out lying data po ints were omi�ed to improve the readabili ty of the figure
Fig. 1. Relationship between initial speed and value of the
13.7 6.82 6.15
65.9 2.12 0.12
to the observed values, no bias is introduced, since the mean expo-nent for an initial speed in the interval from, for example, 100.0to 109.9 km/h will apply to a speed of 105 km/h and to any finalspeed, at least in the range found for this interval, which spannedfrom 91.4 to 107.0 km/h. An assumed final speed of 95 km/h is wellwithin this range.
The exponents in Table 3 imply the following accident modifi-cation factor (AMF):
AMF =(
final speedinitial speed
)exponent
(3)
140.0120.0100.080.0eed (km/h)
/h) and value of expon ent in the jury accid ents
exponent in the Power Model for injury accidents.
R. Elvik / Accident Analysis and Prevention 50 (2013) 854– 860 857
Funnel plot of es�mates of expon ent for ini �al speed between 100 .0 and 109.9 km/h - injury accidents
Mean es�mate = 3.87
el for i
Tf
A
Tt
colirtsscntta42
ni
TC
a
Es�m
Fig. 2. Funnel plot of estimates of the exponent in the Power Mod
hus, for an initial speed of 105 km/h, the accident modificationactor is:
MF10595 =
(95
105
)3.87= 0.679
able 4 lists the accident modification factors estimated by usinghe exponents from Table 3. These were linked the following way:
A start value of 100 was set for the highest initial speed. Thisan be interpreted both as a percentage and as a relative numberf accidents. Applying the first of the accident modification factorsisted in Table 4, it is estimated than when the mean speed of traffics reduced from 115 to 105 km/h, the relative number of accidents iseduced from 100 to 72.8 (0.728). The statistical weight assigned tohis accident reduction is the statistical weight for a change in meanpeed from 115 to 105 km/h. Proceeding to the next interval, meanpeed is further reduced from 105 to 95 km/h. The accident modifi-ation factor is 0.679. Multiplying 72.8 by 0.679 gives a new relativeumber of accidents of 49.42. Continuing down to the lowest ini-ial speed (35 km/h), the relative number of accidents is reducedo 4.08 at the final speed of 25 km/h. All the relative numbers ofccidents are anchored to the initial value of 100. The final value of.08 shows that by reducing the mean speed of traffic from 115 to
5 km/h, the number of accidents is reduced by 96%.
The data listed in three columns for initial speed, relativeumber of accidents, and statistical weight in Table 4 served as
nput to the statistical analyses comparing the Power Model to an
able 4haining accident modification functions based on rounded values for initial speed.
Initial speed (km/h) Final speed (km/h) Estimated AMF bmean exponent
115 105 0.728
105 95 0.679
95 85 0.697
85 75 0.652
75 65 0.822
65 55 0.829
55 45 0.672
45 35 0.578
35 25 0.686
25
Statistical weight set equal to the mean of weights applying to initial speeds between 1
f expon ent
njury accidents at an initial speed between 100.0 and 109.9 km/h.
exponential function. The statistical analyses were performed bymeans of SPSS version 18 software, using the curve estimationroutine.
3. Results
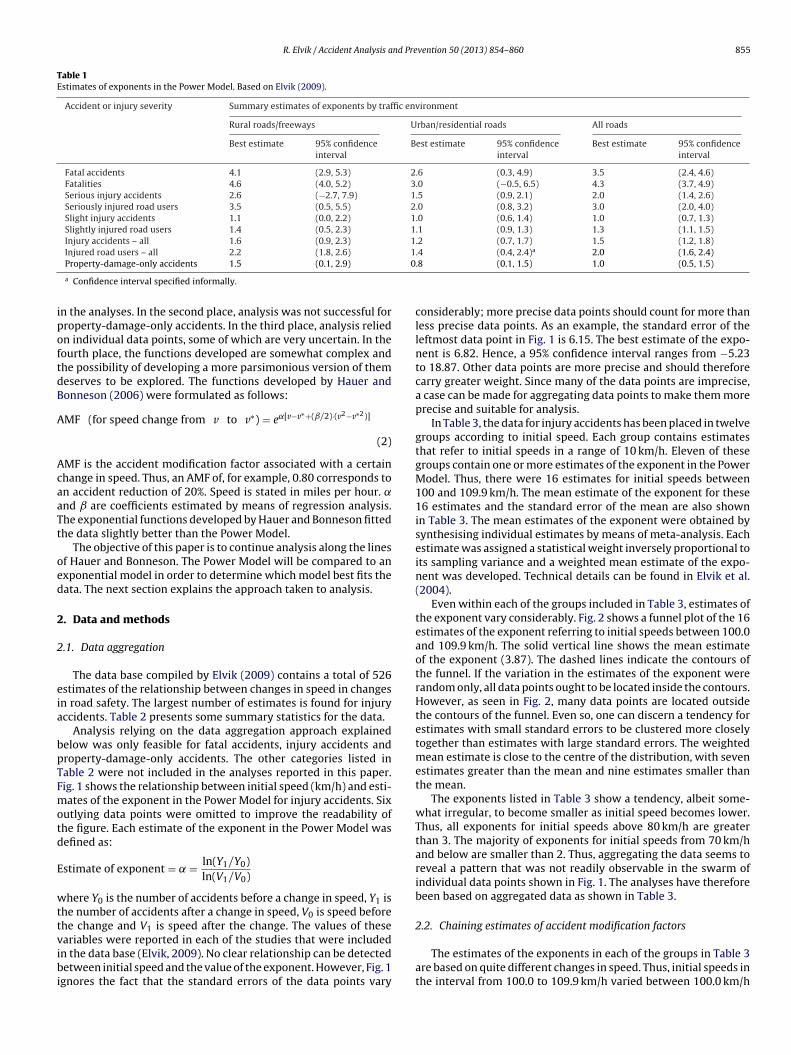
Sufficient data to permit analysis was available for fatalaccidents, injury accidents and property-damage-only accidents.Table 5 presents the results of the analyses.
It is seen that both the Power Model and the exponential func-tion fit the data extremely well. It is recognised that this to someextent probably is an artefact resulting from the data aggregation.However, both models fit the data so well that one might won-der whether there is any difference of practical interest betweenthe models. The use or non-use of statistical weighting of the datapoints does not seem to influence the results very much.
Fig. 3 shows the Power Model (weighted data) and the exponen-tial function (non-weighted data) fitted to the relative number offatal accidents. It is seen that the functions are distinct and clearlyhave different implications with respect to the effect on accidentsof a given change in speed.
For fatal accidents, the Power Model fits the data marginally
better than the exponential function in the analysis relying onweighted data. In the analysis relying on un-weighted data, theexponential function fitted better than the Power Model. For injuryaccidents and property-damage-only accidents, the exponential
Power Model and expon en�al func�on fi�ed to da ta for fatal accid ents
Data
Expon en� al
Power
Fig. 3. Power and exponential functions fitted to fatal accidents.
0.00
10.00
20.00
30.00
40.00
50.00
60.00
70.00
80.00
90.00
100.00
120100806040200
Rela
�ve
num
ber o
f acc
iden
ts (s
et to
100
for m
axim
um in
i�al
spee
d)
Ini�al spee d (km/h)
Power Mode l an d expon en�al fun c�on fi�ed to da ta for injury accid ents
Data
Expon en� al
Power
Fig. 4. Power and exponential functions fitted to injury accidents.
R. Elvik / Accident Analysis and Prevention 50 (2013) 854– 860 859
0.00
10.00
20.00
30.00
40.00
50.00
60.00
70.00
80.00
90.00
100.0 0
120100806040200Rela
�ve
num
bero
facc
iden
ts(s
etto
100f
orm
axim
umin
i�al
spee
d)
d (km
PowerM odel an d expon en�al func�o nfi�ed to data forprop ertyda mageonlyaccid ents
Data
Expo nen� al
Power
ns fitte
fFt
tpltobF
F
Hn
F
TttcdFi
TF
Ini�al spee
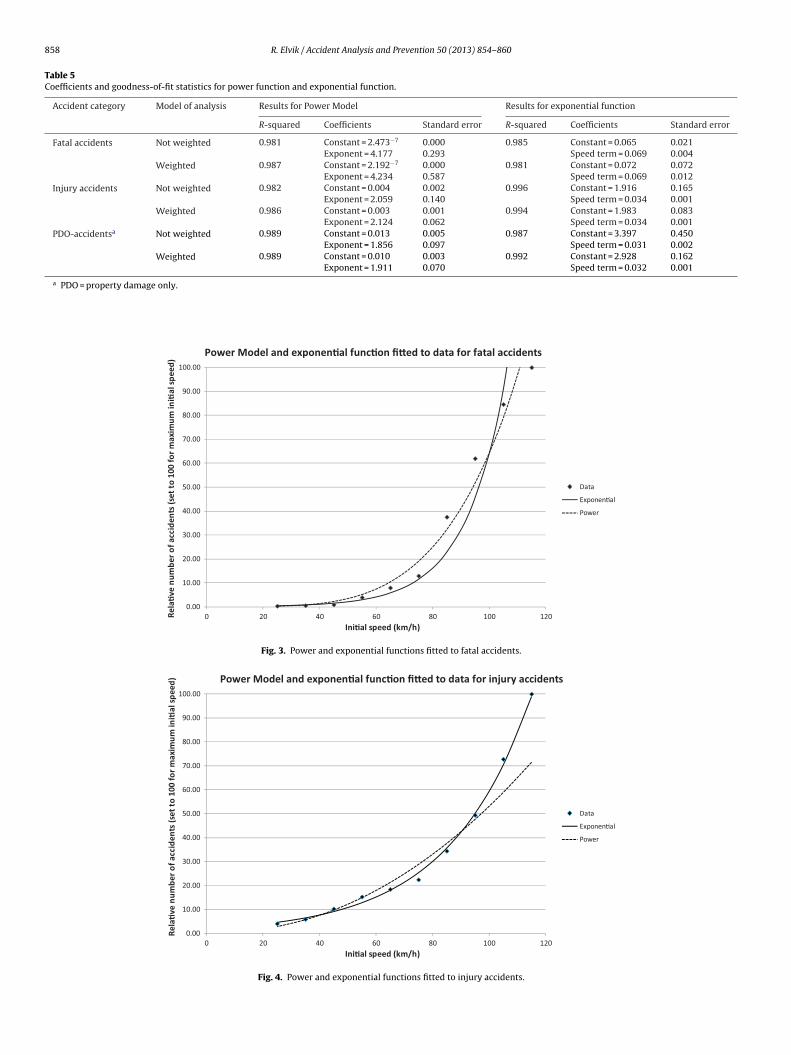
Fig. 5. Power and exponential functio
unction fitted the data slightly better than the Power Model.igs. 4 and 5 show power functions and exponential functions fittedo the data.
Although the power function and the exponential function fithe data almost equally well, the functions are clearly distinct, inarticular at high speeds. The exponential functions predict a much
arger effect of changes in speed at high levels of initial speed thanhe power functions do. How much larger the effect is when relyingn the exponential function, as opposed to the power function, cane determined by comparing the first derivatives of these functions.or the power function, the first derivative is:
irst derivative of power function = ̨ · ̌ · Xˇ−1 (4)
ere, ̨ is the constant term and ̌ is the exponent. For the expo-ential function, the first derivative is:
irst derivative of exponential function = ̨ · ̌ · eˇ·x (5)
able 6 compares the first derivatives of the functions assessed athe listed values for initial speed. The values listed in Table 6 showhe instantaneous slope of the function at a given initial speed. It
an, roughly, be interpreted as the increase in the number of acci-ents if speed increases by 1 km/h from the listed initial speed.or fatal accidents, the exponential function predicts a much largerncrease in the number of accidents at high speed than the power
able 6irst derivatives of power function and exponential function.
Initial speed (km/h) First derivative for fatal accidents First deriv
Exponential function Power Model Exponenti
115 12.53 6.57 3.36
105 6.28 4.85 2.39
95 3.15 3.48 1.70
85 1.58 2.40 1.21
75 0.79 1.59 0.86
65 0.40 0.99 0.61
55 0.20 0.57 0.44
45 0.10 0.29 0.31
35 0.05 0.13 0.22
25 0.03 0.04 0.16
Ratio 115/65 31.50 6.66 5.47
Ratio 65/25 15.80 23.95 3.90
/h)
d to property damage only accidents.
function. It is also seen that the dependence on initial speed of theexponential function for fatal accidents is much stronger than forthe power function; in other words the curvature of the exponentialfunction changes a lot more over the range of initial speeds than thecurvature of the power function. Table 6 also shows, which is plau-sible according to the laws of physics, that property damage onlyaccidents depend less on speed than both injury accidents and fatalaccidents.
4. Discussion
Hauer and Bonneson (2006) and Hauer (2009) argue that anexponential function is a better model of the relationship betweenspeed and safety than the Power Model, principally because theeffect of a given relative change in speed does not depend on ini-tial speed according to the Power Model, which seems implausible.However, the exponential functions fitted by Hauer and Bonneson(2006) were rather complex. An important objective of this paperwas therefore to investigate whether a more parsimonious functioncould be fitted to the data.
To eliminate the fairly large contribution of random variationto the spread of individual data points, data were aggregated forgroups of initial speed spanning 10 km/h. This greatly reduced thenumber of data points and removed most of the contribution of
ative for injury accidents First derivative forproperty-damage-only accidents
al function Power Model Exponential function Power Model
860 R. Elvik / Accident Analysis and Prevention 50 (2013) 854– 860
0.0 0
10.00
20.00
30.00
40.00
50.00
60.00
70.00
80.00
90.00
100.0 0
140120100806040200
Rela
�ve
num
ber o
f acc
iden
ts (s
et to
100
for h
ighe
st in
i�al
spee
d)
(km/h
The Pow er Model an d an expon en�al func�on fi�ed to 19 da ta poin ts for injur y acc idents as a sensi�vity anal ysis of da ta aggrega�on
Data
Power
Exponen�al
ta po
rsttnapsti
vetf1ir((at
wtp
Ini�al speed
Fig. 6. The Power Model and an exponential function fitted to 19 da
andom variation. Still, the data points that were retained wereufficient to determine whether a power function or an exponen-ial function best fitted the data. With respect to fatal accidents,he power function fitted the data slightly better than the expo-ential function. For injury accidents and property damage onlyccidents, the exponential function fitted the data better than theower function. The original data set contains data that refer toerious injury accidents and slight injury accidents. Unfortunately,hese data were too sparse to apply the aggregation procedure usedn this paper.
A reviewer of this paper raised concern about the very highalues found for R-squared. As noted above, this could to somextent be an artefact of the high level of data aggregation. To testhis, the bandwidth of the groups for injury accidents was reducedrom 10 km/h to 5 km/h. The new groups for initial speed were20–115 km/h, 115–110 km/h, etc. The number of data points thus
ncreased from 10 to 19. Simple and weighted regressions wereun on the 19 data points. R-squared was 0.957 (simple) and 0.965weighted) for the Power Model and 0.995 (simple) and 0.993weighted) for the exponential function, suggesting that the resultsre robust with respect to the level of data aggregation. Fig. 6 showshe functions fitted to the 19 data points.
Should a power function or an exponential function be appliedhen estimating the effects on accidents of changes in speed? On
he whole, the analyses presented in this paper lend stronger sup-ort to the use of an exponential function than to the use of a power
)
ints for injury accident as a sensitivity analysis of data aggregation.
function. It is important that the analyses presented in this paperare updated and refined as new studies of the relationship betweenspeed and road safety are published.
5. Conclusions
Data that have been used in earlier analyses of the relationshipbetween speed and road safety have been re-analysed. The analysessupport using an exponential function for modelling the relation-ship between speed and the number of accidents. The exponentialfunction fits particularly well for injury accidents.
References
Cameron, M.H., Elvik, R., 2010. Nilsson’s Power Model connecting speed and roadtrauma: applicability by road type and alternative models for urban roads. Acci-dent Analysis and Prevention 42, 1908–1915.
Elvik, R., 2009. The Power Model of the relationship between speed and road safety.Update and new estimates. Report 1034. Institute of Transport Economics, Oslo.
Elvik, R., Christensen, P., Amundsen, A.H., 2004. Speed and road accidents. An eval-uation of the Power Model. TØI Report 740. Institute of Transport Economics,Oslo.
Hauer, E., 2009. Speed and safety. Transportation Research Record 2103, 10–17.Hauer, E., Bonneson, J., 2006. An empirical examination of the relationship between
speed and road accidents based on data by Elvik, Christensen and Amundsen.
Unpublished manuscript data March 5, 2006. Prepared for the Highway SafetyManual Task Force.
Nilsson, G., 2004. Traffic safety dimensions and the Power Model to describe theeffect of speed on safety. Bulletin 221. Lund Institute of Technology, Departmentof Technology and Society, Traffic Engineering, Lund.