+ All Categories
Home > Documents > A Real Life Graphs B Complications

A Real Life Graphs B Complications

Date post: 23-Jan-2022
Category:
Upload: others
View: 2 times
Download: 0 times
Share this document with a friend
5
t T 20 10 20 40 60 80 0 0 5 15 25 100 Writing an Equation for a Line 2 12 A Real Life Graphs B Complications When writing an equation for a real life graph look carefully at the scale and replace x and y with the correct letters. Example : Find m and c and write an equation for this graph. Working : m = = = 2.5 c = 10 equation : H = 2.5t + 10 1 2 H t 20 15 10 5 0 3 4 25 5 2 rise run 1 In these graphs the ‘y-intercepts’ are unclear. Use substitution to obtain the equation for each straight line. a) ……………………………………………………………………. ……………………………………………………………………. ……………………………………………………………………. ……………………………………………………………………. ……………………………………………………………………. ……………………………………………………………………. ……………………………………………………………………. ……………………………………………………………………. ……………………………………………………………………. ……………………………………………………………………. ……………………………………………………………………. ……………………………………………………………………. ……………………………………………………………………. ……………………………………………………………………. b) x x x x x Sigma Maths Workbook AS 1.3 - Tables, Equations, Graphs © Sigma Publications Ltd 2014. ISBN 978-1-877567-54-4. A Copyright Licensing Ltd licence is required to copy any part of this resource. n P 4 8 50 0 0 2 6 100 150 200 250 1 Find m and c and write an equation for each graph. a) 10 20 C t 40 30 20 10 0 30 40 50 0 0 5 10 0 A d 20 40 60 m = ………………… , c = ………………… …………………………………………… …………………………………………… 2 4 n 6 8 0 0 T 100 200 300 400 b) c) d) 2 4 V t 40 30 20 10 0 6 8 50 0 60 m = ………………… , c = ………………… ………………………………… ………………………………… m = ………………… , c = ………………… ……………………………………… ……………………………………… m = ………………… , c = ………………… ……………………………………… ………………………………………
Transcript

t

T

20

10 20

40

60

80

0

0 5 15 25

100

Writing an Equation for a Line 2 12

A Real Life Graphs B Complications

When writing an equation for a real life graph look carefully at the scale and replace x and y with the correct letters.

Example : Find m and c and write an equation for this graph.

Working : m = = = 2.5 c = 10

equation : H = 2.5t + 10 1 2

H

t

20

15

10

5

03 4

25

52

riserun

1 In these graphs the ‘y-intercepts’ are unclear. Use substitution to obtain the equation for each straight line.

a)

…………………………………………………………………….

…………………………………………………………………….

…………………………………………………………………….

…………………………………………………………………….

…………………………………………………………………….

…………………………………………………………………….

…………………………………………………………………….

…………………………………………………………………….

…………………………………………………………………….

…………………………………………………………………….

…………………………………………………………………….

…………………………………………………………………….

…………………………………………………………………….

…………………………………………………………………….

b)

x

x

x

x

x

Sigma Maths Workbook AS 1.3 - Tables, Equations, Graphs © Sigma Publications Ltd 2014. ISBN 978-1-877567-54-4. A Copyright Licensing Ltd licence is required to copy any part of this resource.

n

P

4 8

50

0

0 2 6

100

150

200

250

1 Find m and c and write an equation for each graph.

a)

10 20

C

t

40

30

20

10

030 40

50

0

0 5 100

A

d

20

40

60

m = ………………… ,

c = …………………

……………………………………………

……………………………………………

2 4n

6 800

T

100

200

300

400

b)

c)

d)

2 4

V

t

40

30

20

10

06 8

50

0

60

m = ………………… ,

c = …………………

……………………………………………

……………………………………………

m = ………………… ,

c = …………………

……………………………………………

……………………………………………

m = ………………… ,

c = …………………

……………………………………………

……………………………………………

Linear Problems 4 18

A Free Give-Aways

Sigma Maths Workbook AS 1.3 - Tables, Equations, Graphs © Sigma Publications Ltd 2014. ISBN 978-1-877567-54-4. A Copyright Licensing Ltd licence is required to copy any part of this resource.

A fast food outlet is planning a promotion of a new child size hamburger. A little plastic figurine will be given away with each burger.

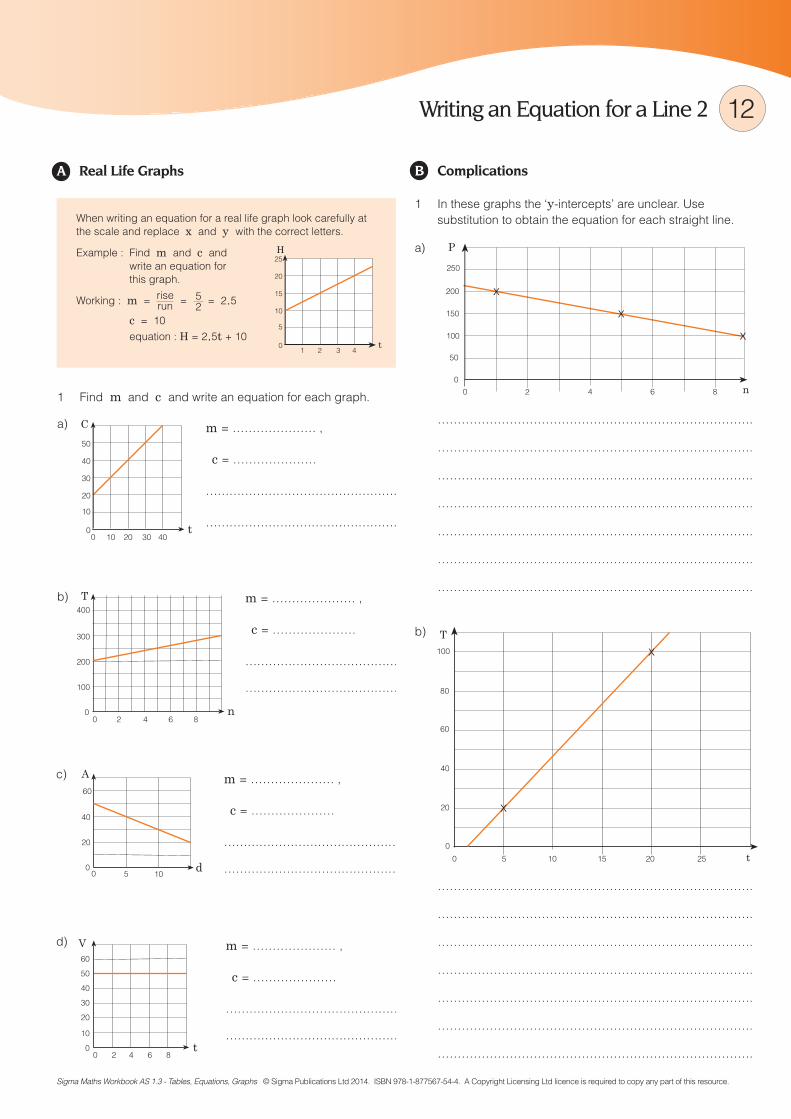
The cost of making these figurines is being investigated. Two factories have given their quotes.

1 Factory A’s quote shows a pricing structure where the amount charged per figurine reduces as larger numbers are ordered.

● There is a one off charge of $300 for producing the mould. ● For an order of up to 1000 figurines, the price per figurine is 10 cents, ● after the first 1000 the price per figurine goes down to 8 cents, ● after the first 2000 the price per figurine is 5 cents.

To illustrate their quote factory A provided the graph shown on the right.

a) Write equations for each line segment using n for the number of figurines and P for the payment for the lot.

for n ≤ 1000, equation : P = …………………………………….

for 1000 < n ≤ 2000 equation : P = …………………………………….

for n > 2000 equation : P = …………………………………….

b) Use your equations to calculate how much the fast food outlet would pay . . .

i) if they ordered 2200 figures.

………………………………………………………………………………….

ii) if they ordered 1600 figurines.

………………………………………………………………………………….

c) Calculate the average price per figurine if they ordered 4500 figurines.

…………………………………………………………………………………………………………………………………………………….

…………………………………………………………………………………………………………………………………………………….

2 Factory B charges $320 for the making of the mould, then a flat rate of 7 cents per figurine. Compare this quote with the one from factory A and advise the food outlet where they should place their order of the figurines.

…………………………………………………………………………………………………………………………………………………….

…………………………………………………………………………………………………………………………………………………….

…………………………………………………………………………………………………………………………………………………….

…………………………………………………………………………………………………………………………………………………….

…………………………………………………………………………………………………………………………………………………….

…………………………………………………………………………………………………………………………………………………….

…………………………………………………………………………………………………………………………………………………….

…………………………………………………………………………………………………………………………………………………….

…………………………………………………………………………………………………………………………………………………….

…………………………………………………………………………………………………………………………………………………….

00 1000

100

200

300

2000 3000 4000

400

500

600

$

x

x

x

x

x

28Factorised Equations 1

A Smart Plotting B Intercepts and Vertex

3 Calculate the coordinates of the vertex of . . .

a) the parabola y = (x + 3)(x - 5).

……………………………………………………………………..

……………………………………………………………………..

……………………………………………………………………..

……………………………………………………………………..

……………………………………………………………………..

b) the parabola y = x (x + 3).

……………………………………………………………………..

……………………………………………………………………..

……………………………………………………………………..

……………………………………………………………………..

……………………………………………………………………..

Sigma Maths Workbook AS 1.3 - Tables, Equations, Graphs © Sigma Publications Ltd 2014. ISBN 978-1-877567-54-4. A Copyright Licensing Ltd licence is required to copy any part of this resource.

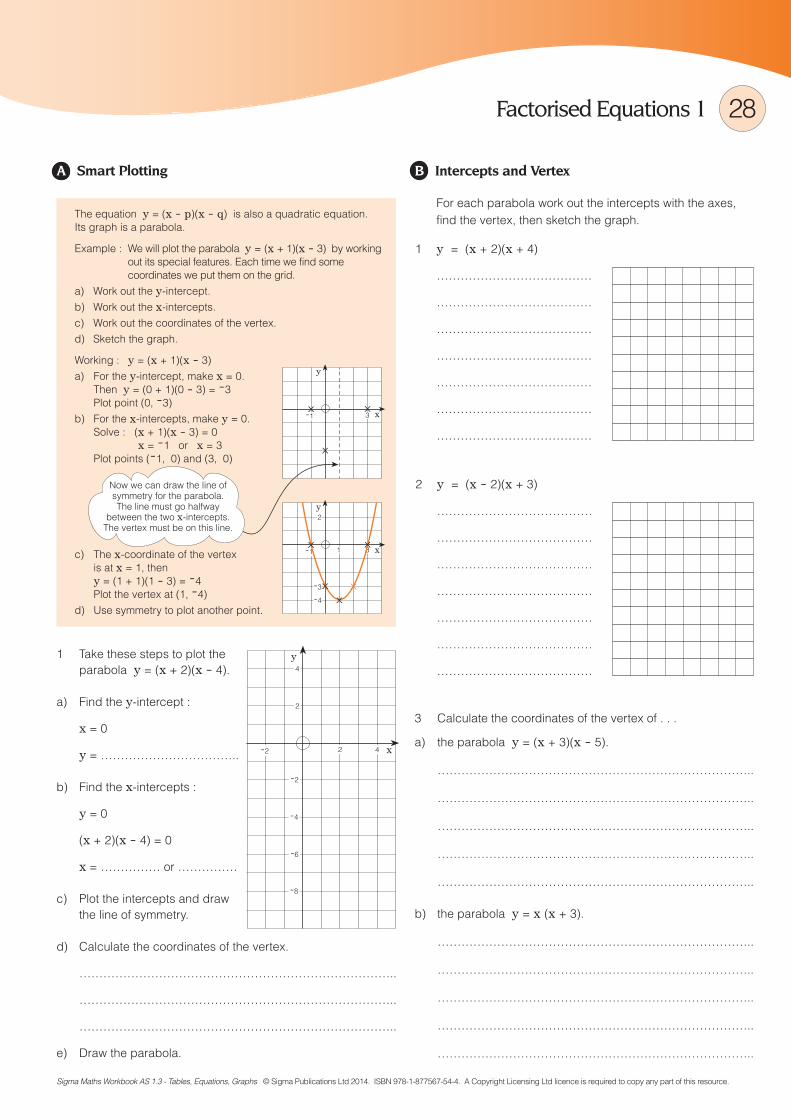
1 Take these steps to plot the parabola y = (x + 2)(x - 4).

a) Find the y-intercept :

x = 0

y = ……………………………..

b) Find the x-intercepts :

y = 0

(x + 2)(x - 4) = 0

x = …………… or ……………

c) Plot the intercepts and draw the line of symmetry.

d) Calculate the coordinates of the vertex.

……………………………………………………………………..

……………………………………………………………………..

……………………………………………………………………..

e) Draw the parabola.

x

y

2

-2

-4

-6

-8

4

2

4

-2

2 y = (x - 2)(x + 3)

…………………………………

…………………………………

…………………………………

…………………………………

…………………………………

…………………………………

…………………………………

For each parabola work out the intercepts with the axes, find the vertex, then sketch the graph.

1 y = (x + 2)(x + 4)

…………………………………

…………………………………

…………………………………

…………………………………

…………………………………

…………………………………

…………………………………

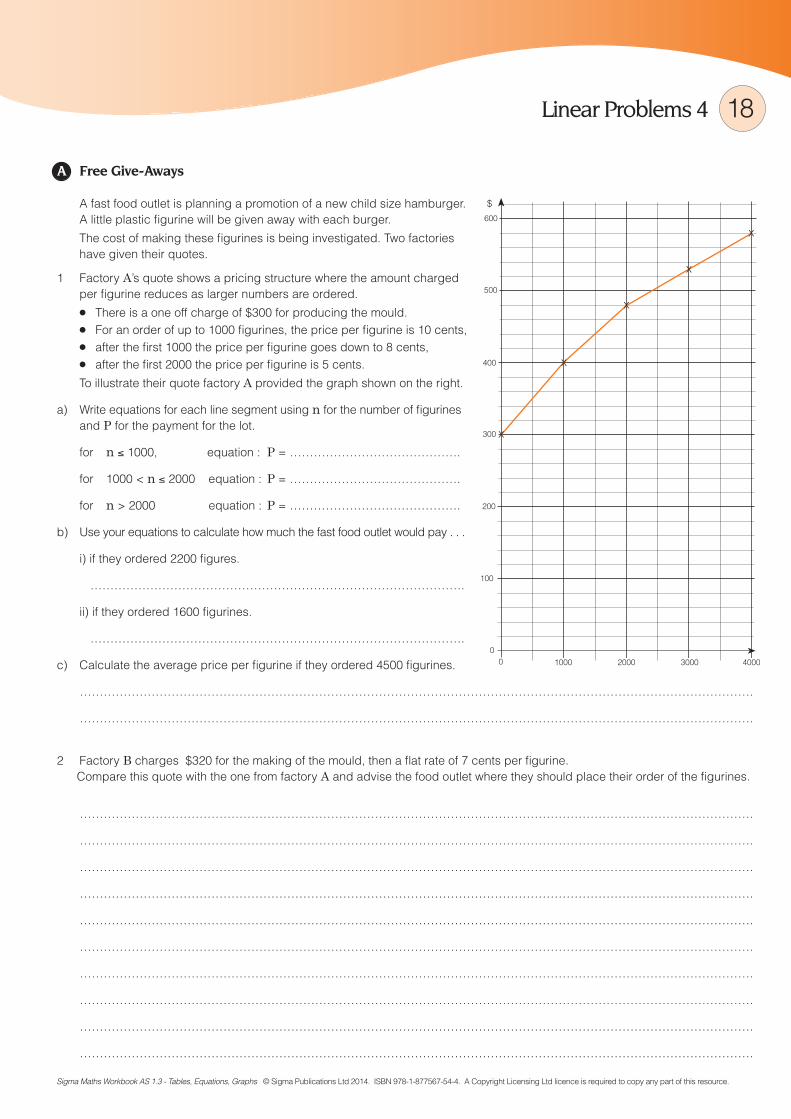
The equation y = (x - p)(x - q) is also a quadratic equation. Its graph is a parabola.

Example : We will plot the parabola y = (x + 1)(x - 3) by working out its special features. Each time we find some coordinates we put them on the grid.a) Work out the y-intercept. b) Work out the x-intercepts. c) Work out the coordinates of the vertex.d) Sketch the graph.

Working : y = (x + 1)(x - 3)a) For the y-intercept, make x = 0. Then y = (0 + 1)(0 - 3) = -3 Plot point (0, -3)b) For the x-intercepts, make y = 0. Solve : (x + 1)(x - 3) = 0 x = -1 or x = 3 Plot points (-1, 0) and (3, 0)

c) The x-coordinate of the vertex is at x = 1, then y = (1 + 1)(1 - 3) = -4 Plot the vertex at (1, -4)d) Use symmetry to plot another point.

x

y

-3

1

2

3-1

-4

xx

x x

x

x

y

3-1

x

x x

Now we can draw the line of symmetry for the parabola. The line must go halfway

between the two x-intercepts. The vertex must be on this line.

Quadratic Problems 2

A Reinforcements B Aqueduct

36

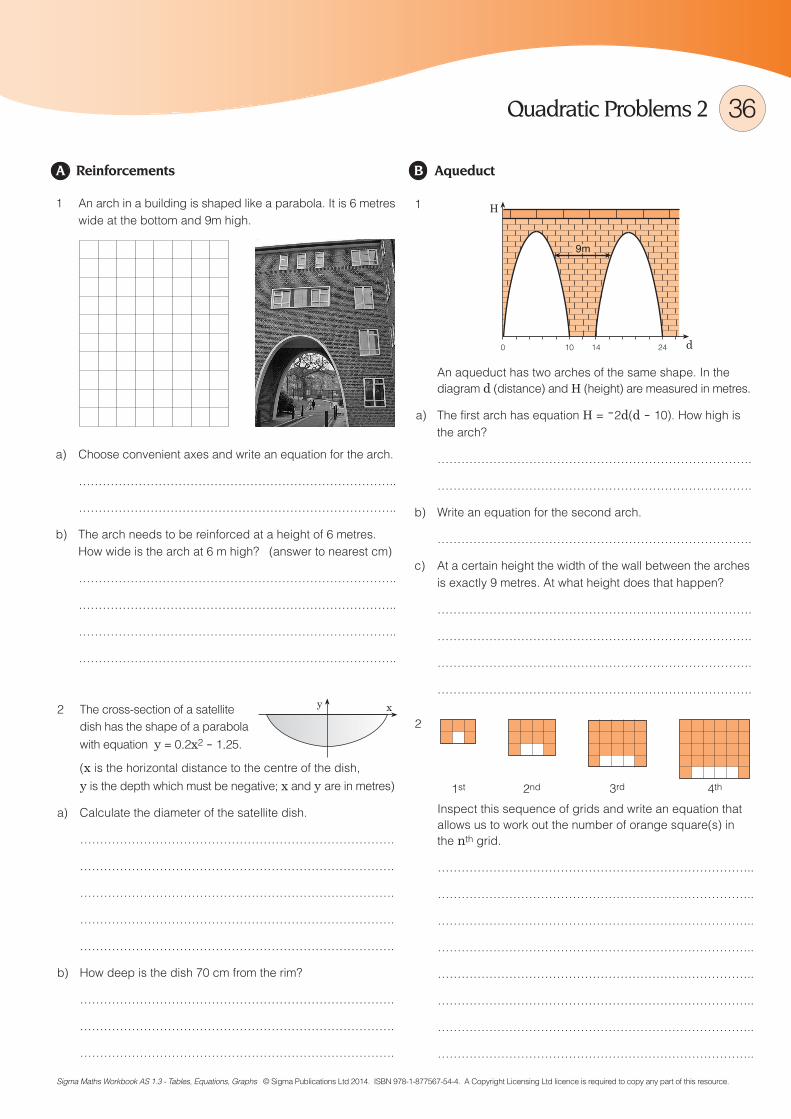
1 An arch in a building is shaped like a parabola. It is 6 metres wide at the bottom and 9m high.

a) Choose convenient axes and write an equation for the arch.

……………………………………………………………………..

……………………………………………………………………..

b) The arch needs to be reinforced at a height of 6 metres. How wide is the arch at 6 m high? (answer to nearest cm)

……………………………………………………………………..

……………………………………………………………………..

……………………………………………………………………..

……………………………………………………………………..

2 The cross-section of a satellite dish has the shape of a parabola with equation y = 0.2x2 - 1.25.

(x is the horizontal distance to the centre of the dish, y is the depth which must be negative; x and y are in metres)

a) Calculate the diameter of the satellite dish.

…………………………………………………………………….

…………………………………………………………………….

…………………………………………………………………….

…………………………………………………………………….

…………………………………………………………………….

b) How deep is the dish 70 cm from the rim?

…………………………………………………………………….

…………………………………………………………………….

…………………………………………………………………….

xy

Sigma Maths Workbook AS 1.3 - Tables, Equations, Graphs © Sigma Publications Ltd 2014. ISBN 978-1-877567-54-4. A Copyright Licensing Ltd licence is required to copy any part of this resource.

1

0 10 14 24 d

H

9m

An aqueduct has two arches of the same shape. In the diagram d (distance) and H (height) are measured in metres.

a) The first arch has equation H = -2d(d - 10). How high is the arch?

…………………………………………………………………….

…………………………………………………………………….

b) Write an equation for the second arch.

…………………………………………………………………….

c) At a certain height the width of the wall between the arches is exactly 9 metres. At what height does that happen?

…………………………………………………………………….

…………………………………………………………………….

…………………………………………………………………….

…………………………………………………………………….

1st 2nd 3rd 4th

2

Inspect this sequence of grids and write an equation that allows us to work out the number of orange square(s) in the nth grid.

……………………………………………………………………..

……………………………………………………………………..

……………………………………………………………………..

……………………………………………………………………..

……………………………………………………………………..

……………………………………………………………………..

……………………………………………………………………..

……………………………………………………………………..

Exponential Patterns 1

A Mould B Writing an Equation

44

Sigma Maths Workbook AS 1.3 - Tables, Equations, Graphs © Sigma Publications Ltd 2014. ISBN 978-1-877567-54-4. A Copyright Licensing Ltd licence is required to copy any part of this resource.

2 Show that the rule in question 1 c) can be simplified to

t = 2n+ 4

………………………………………………………………………

………………………………………………………………………

3 Shown is the graph of an exponential function. Make a table and use it to find an equation for the graph.

……………………………………………………………………..

……………………………………………………………………..

x

x21 3

100

200

300

y

x

xx

x

x

day 43210

1 A patch of mould is increasing in size. Daily measurements show the following pattern. Day 0 is the day the mould was first discovered.

x 2a) Complete the table.

b) This pattern has a constant forward ratio. What does that

mean? …………………………………………………………...

……………………………………………………………………..

……………………………………………………………………..

c) Complete this sentence : On day ………… the mould

covered an area of 5 x 2 x 2 x 2 = ……………… cm2.

d) Write a general rule for the area covered in mould on day n.

Area = …………………………………………………………..

e) A pattern like this is called an exponential pattern.

What would be the reason? .…………………………………..

……………………………………………………………………..

……………………………………………………………………..

f) How big would the mould patch be after 15 days?

……………………………………………………………………..

……………………………………………………………………..

g) Plot a graph for this pattern.

area (cm2)

5

4020105

0

area

(cm

2 )

1 2 3 4 50

20

40

60

80

100

120

6 days

140

160

h) Calculate the area of the patch of mould two days before it was discovered.

………………………………………………………………………

………………………………………………………………………

x y

0

1

2

3

4

…………

…………

…………

…………

…………

1 Below are 3 number patterns. Write an equation for each,

then work out the value of t when n = 10.

a) n 43210

t

10

8127931

rule : ………………………………………………………………

b) n 3210

t

10

25050102

rule : ………………………………………………………………

c) n 43210

t

10

256128643216

rule : ………………………………………………………………


Recommended