A Recommended New Approach on Motorization Ratio Calculations of Stepper Motors Ruben Nalbandian * , Thierry Blais ** and Richard Horth + Abstract Stepper motors are widely used on most spacecraft mechanisms requiring repeatable and reliable performance. The unique detent torque characteristics of these type of motors makes them behave differently when subjected to low duty cycle excitations where the applied driving pulses are only energized for a fraction of the pulse duration. This phenomenon is even more pronounced in discrete permanent magnet stepper motors used in the space industry. While the inherent high detent properties of discrete permanent magnets provide desirable unpowered holding performance characteristics, it results in unique behavior especially in low duty cycles. Notably, the running torque reduces quickly to the unpowered holding torque when the duty cycle is reduced. The space industry’s accepted methodology of calculating the Motorization Ratio (or Torque Margin) is more applicable to systems where the power is continuously applied to the motor coils like brushless DC motors where the cogging torques are low enough not to affect the linear performance of the motors as a function of applied current. This paper summarizes the theoretical and experimental studies performed on a number of space- qualified motors under different pulse rates and duty cycles. It is the intention of this paper to introduce a new approach to calculate the Motorization Ratios for discrete permanent magnet steppers under all full and partial duty cycle regimes. The recommended approach defines two distinct relationships to calculate the Motorization Ratio for 100 percent duty cycle and partial duty cycle, when the motor detent (unpowered holding torque) is the main contributor to holding position. These two computations reflect accurately the stepper motor physical behavior as a function of the command phase (ON versus OFF times of the pulses), pointing out how the torque contributors combine. Important points highlighted under this study are the torque margin computations, in particular for well characterized mechanisms. The rationale at CDR level versus TRR/TRB level will be discussed, aiming at avoiding too much conservatism for units that have extensive test and in flight heritage. A critical topic is related to the magnetic losses and how to sort out such phenomena as a function of the motor type being used. For instance, detent torque is a major contributor that has no reason to evolve during life and is not an uncontrolled torque loss. Introduction A large number of space based mechanisms use stepper motors. They are simple, low cost and reliable. There are several different types of stepper motors, each with different characteristics. The type of stepper motor discussed in this paper is the discrete permanent magnet stepper motor. Its rotor has a discrete magnet for each pole as opposed to a hybrid stepper motor that has only one annulus magnet in its rotor. The specificity of this type of stepper motor is that it exhibits large detent torque, as implemented in the well-known MOOG Type 3 and Type 5 Rotary Actuators and also by MDA for robotics applications. This detent torque is very useful to hold payloads in position without power when not moving. The effects on the torque produced and the computed Motorization Ratio of different power on duty cycles is * Moog, Inc., Chatsworth, CA ** Astrium SAS, Toulouse, France + MDA Corporation, Montreal, Canada 349 https://ntrs.nasa.gov/search.jsp?R=20150004072 2018-07-15T03:55:20+00:00Z
Transcript
A Recommended New Approach on Motorization Ratio Calculationsof Stepper Motors
Ruben Nalbandian*, Thierry Blais** and Richard Horth+
Abstract
Stepper motors are widely used on most spacecraft mechanisms requiring repeatable and reliable performance. The unique detent torque characteristics of these type of motors makes them behave differently when subjected to low duty cycle excitations where the applied driving pulses are only energized for a fraction of the pulse duration. This phenomenon is even more pronounced in discrete permanent magnet stepper motors used in the space industry. While the inherent high detent properties of discrete permanent magnets provide desirable unpowered holding performance characteristics, it results in unique behavior especially in low duty cycles. Notably, the running torque reduces quickly to the unpowered holding torque when the duty cycle is reduced. The space industry’s accepted methodology of calculating the Motorization Ratio (or Torque Margin) is more applicable to systems where the power is continuously applied to the motor coils like brushless DC motors where the cogging torques are low enough not to affect the linear performance of the motors as a function of applied current.
This paper summarizes the theoretical and experimental studies performed on a number of space-qualified motors under different pulse rates and duty cycles. It is the intention of this paper to introduce a new approach to calculate the Motorization Ratios for discrete permanent magnet steppers under all full and partial duty cycle regimes. The recommended approach defines two distinct relationships to calculate the Motorization Ratio for 100 percent duty cycle and partial duty cycle, when the motor detent (unpowered holding torque) is the main contributor to holding position. These two computations reflect accurately the stepper motor physical behavior as a function of the command phase (ON versus OFF times of the pulses), pointing out how the torque contributors combine.
Important points highlighted under this study are the torque margin computations, in particular for well characterized mechanisms. The rationale at CDR level versus TRR/TRB level will be discussed, aiming at avoiding too much conservatism for units that have extensive test and in flight heritage. A critical topic is related to the magnetic losses and how to sort out such phenomena as a function of the motor type being used. For instance, detent torque is a major contributor that has no reason to evolve during life and is not an uncontrolled torque loss.
Introduction
A large number of space based mechanisms use stepper motors. They are simple, low cost and reliable.There are several different types of stepper motors, each with different characteristics. The type of stepper motor discussed in this paper is the discrete permanent magnet stepper motor. Its rotor has a discrete magnet for each pole as opposed to a hybrid stepper motor that has only one annulus magnet in its rotor. The specificity of this type of stepper motor is that it exhibits large detent torque, as implementedin the well-known MOOG Type 3 and Type 5 Rotary Actuators and also by MDA for robotics applications.
This detent torque is very useful to hold payloads in position without power when not moving. The effects on the torque produced and the computed Motorization Ratio of different power on duty cycles is
discussed. Different Motorization Ratio computations are compared. Finally, a new motorization ratio computation is proposed.
Background
The three main institutional bodies that overlook space-based mechanisms are: NASA, ESA and AIAA. They each recommend slightly different methods of computing the margin on electrically driven drives. The three methods are presented below:
Presentation of Different Motorization Ratio Requirements
(1) NASA-STD-5017
Available Driving Torque Operating Torque Margin = - 1 Total Resisting Torque�
When test verified, an operating torque/force margin of 1.0 or greater is required at all applicable points of travel. Only verification by analysis shall require prior review and approval.
(2) ESA - ECSS-E-ST-33-01C
Table 1. Recommended Theoretical and Measured Uncertainty Factors
Component of resistance Symbol Theoretical
FactorMeasured
Factor
Inertia 8� 1.1 1.1
Spring �� 1.2 1.2
Motor magnetic losses +�� 1.5 1.2Friction �3� 3 1.5
Hysteresis +�� 3 1.5Others (Harness) +�� 3 1.5
Adhesion +,� 3 3
The minimum actuation torque (Tmin) shall be derived by the equation:
!� 8 is the inertial torque applied to a mechanism subjected to acceleration in an inertial frame of reference (e.g. spinning spacecraft, payload or other).
!� &, is the inertial resistance torque caused by the worst-case acceleration function specified by the customer at the mechanism level.
!� &L is the deliverable output torque, when specified by the customer.
350
(3) AIAA–S-114-2005
Table 2. Minimum Recommended Static Torque or Force Margin for New Designs
Design Phase Force or Torque Margin
Conceptual Design Review 175%
Preliminary Design Review 150%
Critical Design Review 125%Acceptance/Qualification Test 100%
The static torque margin shall be expressed in percentage and is calculated as follows:
Drive torque% = - 1 x 100
Resisting torque
The three methods of calculating Motorization Ratios (MR) as described above are the most widely accepted in the space industry. However, each method results in different ratios. It is quite obvious that defining a standard way of calculating MR to be applicable to every motor technology, design maturity level, and duty cycle is very challenging and not practical, resulting in unnecessary high level of conservatism, especially for well proven heritage designs.
Effects of Power Off Time on Output Torque and MR
Extensive testing has shown that output torque drops from the 100% duty cycle value to the unpowered holding torque and below as the time off duration is increased. As expected, when power is removed from the motor, only the magnetic torque prevents the motor rotor from backdriving under the drive train windup torque. It all becomes a question of timing. If the power is removed long enough for the rotor to move back by more than one step, then when the power comes back on to command the rotor to move to the next step, it is too late and the motor loses synchronization.
Effects of Maturity and Heritage and Available Power on Required MR
The rotary actuators discussed are of MOOG Type 3 and Type 5 family and have extensive in flight heritage and have gone through several life tests. Each of the life tests have proven that the rotary actuator internal losses do not increase with time in vacuum or mechanical use. The most recent life test on a Moog Type3 actuator accumulated 5.3 million output degrees of motion without any sign of degradation.
The consistency of measured threshold voltage/current throughout the life program at hot, cold and ambient conditions, especially the consistency of the initial functional and final functional is indicative of the fact that the internal losses did not increase after exposure to thermal vacuum and mechanical environments of the life test.
Rotary actuators of this design are also very simple, only one reduction stage (160:1) with the minimum number of bearings and gear meshes.
351
Table 3. Summary of Life Test Threshold Voltage Results (Type 3 actuator)
Test ConditionPrimary Redundant
CW CCW CW CCWInitial Functional @ 22.3°C 11.01 11.00 11.11 11.10One Times Life @ 107.1°C 13.00 14.00 12.40 13.20One Times Life @ -54.3°C 10.00 9.50 9.50 9.50One and a Half Times Life @ 25.1°C 11.61 11.92 11.60 11.62Final Functional @ 24.2°C 11.30 11.30 11.30 11.20Partial Disassembly and ExaminationInitial Functional @ 24.6°C 11.40 11.70 11.20 11.60Initial Functional in Vacuum @ 19.7°C 11.30 11.30 11.50 11.70One Times Life @ 106.2°C 12.70 13.50 12.60 13.60One Times Life @ -54.1°C 9.50 9.40 9.50 9.40One and a Half Times Life @ 105.4°C 12.50 13.20 12.80 13.50One and a Half Times Life @ -53.7°C 9.80 9.70 9.80 9.80One and a Half Times Life @ 22.6°C 11.70 11.60 11.50 11.70Final Functional @ 21.7°C 11.00 11.20 11.00 11.10
Table 4. Summary of Life Test Threshold voltage Variations
One Times Life testing @ HOT 106.2 12.7 13.5 144 158 -3.7 -1.3
One Times Life testing @ COLD -54.1 9.5 9.4 202 199 -5.7 -4.3
One and a Half Times Life @ HOT 105-4 12.5 13.2 147 156 -0.7 -3.3
One and a Half Times Life @ COLD -53.7 9.8 9.7 209 206 1.3 4.7
One and a Half Times Life @ AMB 22.6 11.7 11.6 180 178 3.9 0.4
Final functional testing 21.7 11.0 11.2 174 177 -2.1 -.06
Figure 1. Life Test Threshold Current Results
Threshold Current (mA)
0
50
100
150
200
250
Initita
l func
tiona
l testi
ng
1 x lif
e @ H
OT
1 x lif
e @ C
OLD
1.5 x
times
life @
AMB
Final fu
nctio
nal te
sting
Initita
l func
tiona
l testi
ng
Functi
onal
testin
g in v
acuu
m @ AMB
1x lif
e @ H
OT
1x lif
e @ C
OLD
1.5 x
life @
HOT
1.5 x
life @
COLD
1.5 x
times
life @
AMB
Final fu
nctio
nal te
sting
Test Case
Cur
rent
(mA
)
CWCCW
353
Space Robotics Example
Other important parameters to take into account when determining what motorization ratio is sufficient is the available power compared to the size of the mechanism and the simplicity of the electric motor used.
When relatively large amounts of power are available and the motor is a brushless DC from which the torque versus speed curve is well known, a reduced motorization ratio might be contemplated.
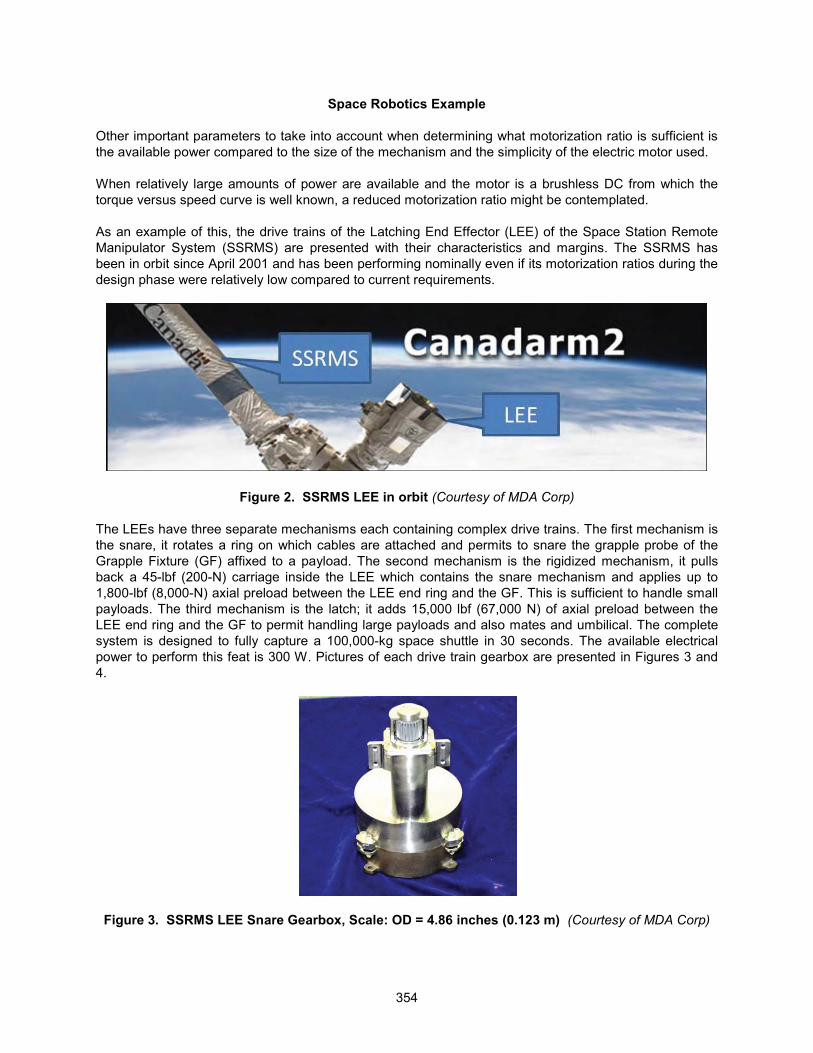
As an example of this, the drive trains of the Latching End Effector (LEE) of the Space Station Remote Manipulator System (SSRMS) are presented with their characteristics and margins. The SSRMS has been in orbit since April 2001 and has been performing nominally even if its motorization ratios during the design phase were relatively low compared to current requirements.
Figure 2. SSRMS LEE in orbit ?���������� ��,������@
The LEEs have three separate mechanisms each containing complex drive trains. The first mechanism is the snare, it rotates a ring on which cables are attached and permits to snare the grapple probe of the Grapple Fixture (GF) affixed to a payload. The second mechanism is the rigidized mechanism, it pulls back a 45-lbf (200-N) carriage inside the LEE which contains the snare mechanism and applies up to 1,800-lbf (8,000-N) axial preload between the LEE end ring and the GF. This is sufficient to handle small payloads. The third mechanism is the latch; it adds 15,000 lbf (67,000 N) of axial preload between the LEE end ring and the GF to permit handling large payloads and also mates and umbilical. The complete system is designed to fully capture a 100,000-kg space shuttle in 30 seconds. The available electrical power to perform this feat is 300 W. Pictures of each drive train gearbox are presented in Figures 3 and 4.
Figure 3. SSRMS LEE Snare Gearbox, Scale: OD = 4.86 inches (0.123 m) ?���������� ��,������@
354
Figure 4. SSRMS LEE Rigidized Gearbox With Ballscrew, Scale: ballscrew = 18-in long (46 cm) ?���������� ��,������@�
�
Figure 5. SSRMS LEE Latch Gearbox, Scale: OD = 5.4 in (14 cm) ?���������� ��,������@
The characteristics of each drive train are presented in Table 6. As can be seen in Table 6, during the design phase, the required worst-case torque margins were only 10%. The estimated worst-case torque margins were only 16% for two of the three mechanisms. This compared to the institutional minimum requirement of between 100% and 200%. This is evidence that it is possible to design successful mechanisms with much lower motorization ratios than currently required.
The authors do not believe the same Motorization Ratio should apply to the above designs as that of anewly designed complex multi-stage low-power drive train that has never flown.
Effects of Different External Load Characteristics
External loads may have different characteristics when applied to the output of the actuators. Pure resistive torques (friction), only resist to the actuator applied output torque. As soon as the actuator stops, the resistive torque drops to zero, as the pure frictional torque only opposes motion.
Spring, dynamical oscillatory response, and gravity torques are very different than the pure friction torques; they remain even when the motion command has stopped. That is why when the applied torque is removed by removing power to the windings, the gravity or the wind-up spring torque may overcome the unpowered holding torque and back-drive the stepper motor. This phenomenon has been investigated by conducting multiple tests at reduced duty cycles when power is removed for a proportion of the pulse period. The effect of the temperature on the performance of actuator for reduced duty cycle has been studied to select an acceptable and appropriate correction factor.
355
Table 6. Drive Train Characteristics
Gear Ratio
No of Stages
No of gears
No of bearings
Required Torque Margin
on nominal
case
Estimated Torque
Margin on nominal
case
Required Torque Margin
on Worst Case
Estimated Torque
Margin on Worst Case
Snare 230:1 3planetary,
2 spur
21 19 100% NA 10% 252%
Rigidize 11.6:1 1 spur, 2 planetary,1 ballscrew*
15 19 100% 414% 10% 16.7%
Latch 10.2:1 2planetary, 2 spur, 4
ballscrews*
19 25 100% 134% 10% 16%
*ballscrew pitch: 0.2 in/rev (5 mm/rev)
Measuring Torque at Reduced Duty Cycle on Moog Type 3 Actuators
BackgroundMoog has measured torque outputs of Type 3 Actuators using two different heritage testing methods. The first method was to measure the reduced duty cycle torque using a standard torque transducer and magnetic particle brake. In this method, the load applied is increased on the magnetic particle brake until the actuator stalls. This method tends to measure a torque a little less than unpowered holding torque and is a result of the unpowered holding torque and wind-up in the actuator and the test stand.
The second heritage method to measure torque of the actuator at reduced duty cycle was to add weight to a moment arm and gradually add more weight until the actuator backdrives. The results of this test correlated with the unpowered holding torque. When in the power OFF phase, the moment works against the unpowered holding torque. Beyond this level, backdriving occurs. This testing was done at numerous reduced duty cycles at 1 PPS and at 10 PPS. It was shown that the motor and actuator unpowered detents correlate. The values obtained were in the 22.6 N-m (200 lb-in) range (motor level testing showed 14 N-cm, which with a 160:1 gear reduction would result in 22.6 N-m at the output).
DiscussionBoth of the methods described in the background section above are thwarted because the dynamic, static and loss loads are combined into a torque that has a 3 times factor on it. This requires the actuator to overcome the torque at both the powered portion of the pulse and the unpowered portion of the pulse. Since movement of the actuator occurs only during the powered portion of the pulse, the demonstrated torque should be 3 X (IL + RT + IT), where IL is internal loss, RT is resistive torque, and IT is a calculatedtorque from the inertia load. During the unpowered portion of the pulse, the unpowered holding torque needs to hold only the maximum static load, which is the resistive torque and the addition of the inertial torque.
To further pinpoint the problem, internal loss (actuator output turning) is only present during the powered pulse and is not present when the actuator is at the unpowered portion of the pulse (non-dynamic). Inertia is present during actuator powered potion (motion) and the unpowered portion (dynamical response) of the pulse. Accurate measurement of torque during the powered portion of the pulse is needed to be able to show compliance.
356
Proposed Motorization Ratio Computation Method for Low Duty Cycle
The Rotary Actuator shall have its powered output torque high enough to successfully operate without adding or Iosing steps with a minimum motorization margin of 200%, i.e., the ratio of the powered output torque to the total resistive torque at actuator output shaft level shall be greater than 3:1. To that extent,the following two complementary approaches are usually considered:
� Either “mechanism design-oriented” approach: motorization margin shall be sufficient during the design phase considering all contributors – such as IL (internal losses) and customer needs (RT and IT). This is relevant at Critical Design Review
� Or “mechanism user-oriented” approach: motorization margins shall be sufficient to cover possible evolutions of internal properties (IL) and customer needs (RT and IT). This is particularly relevant for mechanisms featuring significant heritage at Acceptance Testing
As the pulse shape has a great influence on the powered output torque, the motorization margin shall be determined in two phases; at Critical Design Review and at Acceptance Testing:
Also, the motorization ratio computation shall properly reflect the two drive possibilities:• When driven at 100% duty cycle (see DMR formula hereafter); • When driven at Iow duty cycle (see DMR & SMR formula hereafter)
Motorization Ratio Calculations:i) When driven at 100 % duty cycle, the so called dynamic motorization ratio (DMR) shall be determined
as follows:
ART100- 0.5 x ILDMR = ------------------------ >3
(IT + RT)where:• ART100: minimum actuator running torque when driven by pulses at 100% duty cycle under any
• IL: internal Iosses due to friction• IT: inertial torque• RT: resistive torque
Concerning the DMR, it could be noticed that: � The formula is relevant during the ON time when the pulse is applied – so not only for the 100%
duty cycle case. However, the most reliable way to measure the DMR is to drive the actuator at 100% duty cycle
� The ART100 is obtained with nominal values as per manufacturing (i.e., 1 x IL). In order to anticipate any detrimental evolution, an uncertainty factor of 1.5 on IL is considered as per ESATable 1. The difference corresponds to the term “0.5 x IL” subtracted in DMR formula numerator.
� The minimum DMR value corresponds to the motor location/step featuring the highest detent torque. So it shall be measured at least over a complete motor revolution – and preferably 2 revs.
ii) When driven at Iow duty cycle, the rotary actuator is holding during the unpowered time of pulses on its motor detent torque. The unpowered portion of the pulse is the static part of the actuator torque holding capability. The internal loss should not be considered when the actuator is unpowered since it is a result of actuator stepping. Both resistive and inertial torques should use the static motorization ratio (SMR) formula and should be as follows:
One can notice that the minimum SMR will correspond to the motor step/location featuring the minimum detent torque. To that extent, the SMR shall be determined step by step over at least one motor rev (2 revs preferably), with a sufficient OFF time between each step.
The DMR and SMR are therefore relying on complementary properties of the motor, in particular the mapping of the detent torque over one motor rev. The ideal motor would feature a ratio close to 1 between maximum and minimum values of the detent torque over one rev – as the maximum detent is detrimental to DMR and the minimum detent is detrimental to the SMR. This reflects how accurately the motor is controlled by design and by manufacturing.
Testing and Results:
Unpowered Detent TorqueAs stated above, moment arm testing at 1 PPS and 10 PPS at numerous reduced duty cycle values yielded the minimum unpowered holding torque values as the actuator’s torque output. These results showed that the actuator could only demonstrate torques less than the unpowered holding torque levels during the un-powered portion of a reduced duty cycle. The test results have fidelity to 0.5 N-m and do not take into account the friction, any wind-up of the torque transducer and couplings between the moment arm and the actuator.
It was demonstrated that the decrease of torque below the unpowered holding torque was caused by adynamic component with regards to powered cardinal position versus unpowered holding position, test equipment (couplings and torque transducer), harmonic drive wind-up, possible inertia dynamics, and temperature of operation.
The range of results at 1 PPS through duty cycles of 4%, 5.1% and 8% is between 21.5 to 22.6 N-m of unpowered detent torque. The range of results at 10 PPS, keeping the duration of the powered portion of the pulse equivalent to the 1 PPS data, shows a decrease in the measured torques to 19.8 to 22.0 N-m.
The need for a correction factor for the Static Motorization Ratio calculation can be seen in the difference between the moment arm measured unpowered detent torque and the motor screening values. This particular actuator’s motor had a 14 N-cm (22.6 N-m at actuator output) minimum unpowered detenttorque during motor screening testing.
For this reason Moog recommends using a .75 correction factor (CF in SMR formula) for the Static Motorization Ratio calculation.
Powered TorqueUsing a KistlerTM Torque Sensor, a motor was tested to determine the actual torque output of the motor at various speeds and duty cycles. This sensor measures reactive torque of the stator housing when the rotor takes a step. The motor housing was attached to the KistlerTM torque table and the rotor was pulsed. The motor housing resultant (equal but opposite) torque was recorded. This torque was compared to the 100% duty cycle torque measured during motor screening testing. Correlation between the motor screening test at 100% duty cycle and the tests results taken with the KistlerTM Torque Sensor are presented in Table 8.
Table 8. KistlerTM Torque Sensor vs. Heritage Torque Measurement
The consistency of measured torque values show that the torque remains a function of current and windings throughout the testing regimes as measured with the KistlerTM Torque Sensor. See a graph of the results in Figure 6.
359
Figure 6. KistlerTM Torque Sensor vs. Heritage Torque Measurement
Interestingly, the comparison of wave forms between the slowest speed and shortest powered pulse (1 PPS and 4% duty cycle) and all three of the 100% duty cycle tests (1, 10 and 16 PPS) showed correlation. See the comparison of the wave forms in Figure 7.
Figure 7. Wave Forms of Motor Reaction Torques
1st Peak=Powered torque minus UHT
2nd Peak=Reduced level powered torque plus UHT contribution
Wave Forms of Motor Reaction TorquesAligned to within 0.1 msec
360
Actuator torque capability is reached after unpowered detent torque is overcome. The first peak shows this resulting torque which was used to show the torque capability of the motor. The second peak is the overshoot of the rotor to the cardinal powered position in combination with the unpowered detent torque helping to pull the rotor into the cardinal detent position. It should be noted that the major oscillations dampen out within approximately 45 msec of command at all three speeds and at the one reduced duty cycle compared.
The results above show that there is little change in torque between the powered portions of a pulse when comparing torques at 100% duty cycle and reduced duty cycle pulses. Unpowered Detent Torque is constant throughout the temperature extremes. Heritage testing at 100% duty cycle should be adequate to use in the powered portion
Similar tests were conducted independently on two (2) Moog Rotary Actuators at Astrium. Following is a summary of the tests and the conclusions.
The rotary actuator was gravity loaded using a moment arm. Fine and coarse potentiometers were monitored by the electrical test equipment during the test. To evaluate the dynamic performance, the Back Emf voltages of the redundant phases were plotted using an oscilloscope. Temperature was monitored throughout testing using an ohmmeter measuring the redundant winding resistance. The torque test was performed at 30 to 60 percent duty cycle.
Figure 8. Mechanical Setup at Astrium ?���������� ��������@
The test method was to increase the gravity loading as long as no miss-stepping is observed (over 240 steps). Bemf voltage was checked on the redundant winding. Figure 9 shows a sample of gathered data.
361
Figure 9. A Sample of Gathered Data ?���������� ��������@
Figure 10 highlights the behavior of the motor during transition from ON to OFF state. The testing concluded that the static torque is at its minimum for OFF time greater than 10 msec and it is independent of the applied voltage Vcc and of duty cycle,
A point of interest is also the small spikes recorded at the end of each ON time (end of command pulses). This reflects a transient motion of the rotor, moving between two different quasi-static equilibrium positions:
� During ON time and after completion of the rotor motion, the rotor position is the balance between detent, electromagnetic and external torque
� During OFF time, the rotor position is the balance between only the detent and the external torque.
These locations are not identical and is one origin of the “CF” factor applied in the SMR formula
Summary of the Predictions versus Measurements
Figure 11. SN#61 Predictions vs Measurements ?���������� ��������@�
Figure 12. SN#54 Predictions vs Measurements ?���������� ��������@
Similar pendulum (gravity) tests are currently being conducted at MDA, the results of which will be presented during the symposium
363
Conclusions
The above examples are presented in an attempt to show that having the same motorization ratio requirement across the board, regardless of several factors like available power vs. size, complexity, design maturity, heritage, knowledge of the system by the designers etc. is neither necessary nor the most effective. In fact, requiring large motorization ratios for well characterized mechanisms might even be detrimental as it could eliminate simpler, higher reliability mechanisms from future designs.
The work presented relies on design heritage gained by MOOG and MDA, together with knowledge acquired during various complementary test campaigns at MOOG, MDA and Astrium premises. It is possible to highlight the following lessons learned:
1- Do not blindly apply generic requirements to your designs. Use judgment. The required Motorization Ratio should depend on the design’s maturity, complexity and heritage.
2- Testing showed that during the powered portion of a pulse, whether the pulse is at 100% or at any reduced duty cycle, the maximum torque will be identical.
3- These results indicate that the actuator torque during any powered portion of any reduced duty cycle (as long as it is long enough (> 35 msec) for the rotor to step) pulse will be equal or greater to the heritage actuator torque measured at 100% duty cycle.
4- For actuators driven with duty cycles lower than 100%, motorization margin computation methods are proposed, sorting out carefully the two driving phases: during active part of the pulse (DMR formula) and during the off part of the pulse (SMR formula). These formulas aim at reflecting accurately the physical behavior and properties of the actuator.
5- Based on test data conducted on several actuators at environmental extreme temperatures,Moog recommends using a 75% correction factor (CF in SMR formula) for worst-case prediction of "static" torque using minimum motor detent torque.
6- Test results indicate that the minimum torque at reduced duty cycle, where the 0.75 CF applies, is for operation at hot temperatures.
7- Finally, the proposed Motorization Ratio calculation aims at ensuring both a safe utilization of the mechanisms and avoiding too much conservatism. Application of more conservatism could jeopardize the utilization of efficient solution (wrt to mass & heritage) in particular for applications requiring high torque capabilities.


![, Allen, C., & Rendall, T. (2019). Efficient Aero-Structural Wing AIAA Scitech … · In AIAA Scitech 2019 Forum [AIAA 2019-1701] (AIAA Scitech 2019 Forum). American Institute of](https://static.documents.pub/doc/80x56/6089b44b26d0b4646a6cbe59/-allen-c-rendall-t-2019-efficient-aero-structural-wing-aiaa-scitech.jpg)


