31
www.nicenergy.com A Refined Approach to Coal 1 Carlos A. Cabrera President and CEO National Institute of Clean & Low-Carbon Energy (NICE) Beijing, China

www.nicenergy.com
A Refined Approach to Coal
1
Carlos A. Cabrera
President and CEO
National Institute of Clean & Low-Carbon Energy (NICE)
Beijing, China

www.nicenergy.com 2

www.nicenergy.com
2182
2177
635 469 464
319 290
4628
World Energy Consumption (June, 2010)
3
US
19.5%
Million ton oil
equivalent (Mtoe)
at end 2009
China
19.5%
Russian Fed.
5.7%
India
4.2% Japan
4.2% Canada
2.9% Germany
2.6%
Rest of World
41.5%
0%
20%
40%
60%
80%
100%
World US China
Oil
Natural gas
Coal
Nuclear
Hydro
Primary Energy - Consumption by fuel
29.4% 22.8% 70.6%
Data source: BP Statistical Review of World Energy, 2010

www.nicenergy.com 4
World Coal Consumption (1990-2009)
0
500
1000
1500
2000
2500
3000
3500
19
90
19
91
19
92
19
93
19
94
19
95
19
96
19
97
19
98
19
99
20
00
20
01
20
02
20
03
20
04
20
05
20
06
20
07
20
08
20
09
China
US
India
Japan
South Africa
Russian Fed.
Rest of WorldCo
al C
on
sum
pti
on
(M
toe)
(Consumption at end 2009)
(46.9%)
(15.2%)
( 7.5%)
( 3.3%)
( 3.0%)
( 2.5%)
(21.6%)
Data source: BP Statistical Review of World Energy, 2010

www.nicenergy.com 5
2005 2015 2030
Gt rank Gt rank Gt rank
US 5.8 1 6.4 2 6.9 2
China 5.1 2 8.6 1 11.4 1
Russia 1.5 3 1.8 4 2.0 4
Japan 1.2 4 1.3 5 1.2 5
India 1.1 5 1.8 3 3.3 3
Sub-Total 14.7 24.8 19.9
Everybody has a problem……who owns it?
SOx, NOx, Hg and particulates are more urgent
Top 5 CO2 Emitters: IEA Ref. Case

www.nicenergy.com
Global Transportation Fuels By Source
0
500
1000
1500
2000
2500
3000
1990 2006 2015 2020
Millio
n T
on
ne
s O
il E
qu
iva
len
t
Other Fuels*
Biofuels
Oil
Source: IEA WEO 2008 * CNG, CTL, GTL
6
Transport Sector Poses Major Challenge for
Renewable Fuels
Crude Oil:
continues to be
dominant source
Biofuels:
expected to grow
at 13% annually
to > 2.2 MBPD

www.nicenergy.com 7
Despite Rapid Growth Impact on World Scale is Negligible
Renewable Energy: Solar and Wind
0
40,000
80,000
120,000
160,000
200,000
19
96
19
97
19
98
19
99
20
00
20
01
20
02
20
03
20
04
20
05
20
06
20
07
20
08
20
09
SolarWind
Global Cumulative Installed Capacity (MW)
Annual Power Generation:
~ 23 Mtoe (1500hs/year)
~ 0.2% of global energy
consumption in 2009
Net capacity grows at
29% annually since 1996
Data source: IEA PVPS, EPIA,
EurObserv’ER and SolarBuzz;
BTM Consult ApS

www.nicenergy.com 8
CO2 Emissions by Fuel (1971-2007)
Source: IEA CO2 Emissions from Fuel Combustion Highlights
(2009 Edition)
In 2007 Coal accounted for 42% of global CO2 emissions and 26%
of global energy consumption
Mill
ion
to
ns
of
CO
2

www.nicenergy.com 9
20000
25000
30000
35000
35% 37% 39% 41%
Mill
ion
to
ns
of
CO
2
Net Efficiency of Coal Utilization
-2.2%
Base* -4.3% -6.1%
Increasing efficiency of coal utilization –a rational and effective
approach to reduce CO2 emissions
* data from BP Statistical Review of World Energy, 2010, the net efficiency estimated as 35%
Data at end 2009
0
2000
4000
6000
8000
10000
35% 37% 39% 41%
Mill
ion
to
ns
of
CO
2 Net Efficiency of Coal Utilization
-4.4% Base*
-8.3% -11.8%
Data at end 2009
China Global
Coal; CO2 Emissions

www.nicenergy.com 10
CO2 Emission Reduction
*
CO2 Emission
Reduction (Million
tons)
5% Efficiency
Improvement of Coal
Utilization a)
Solar & Wind Displacing
Coal (or Oil, Natural Gas) b)
Global 1623 91 (77, 54)
US 246 18 (15, 11)
China 761 13 (11, 8)
a) The calculations are based on 2009 data, the current efficiency estimated as 35%;
b) CO2 emission factors are 3.96, 3.07 and 2.35 ton-CO2/toe for Coal, Oil and Natural Gas, respectively,
from BP Statistical Review of World Energy, 2010.
Increasing efficiency of coal utilization -- a very effective way to
reduce CO2 emissions.
Co-processing & utilization of biomass with coal s further reduces CO2.

www.nicenergy.com 11
Challenges for China
TOE/1000$
GDP 2005 2006 2007 2008 2009
Japan 0.114 0.119 0.118 0.104 0.092
US 0.189 0.177 0.172 0.163 0.153
China 0.702 0.648 0.552 0.464 0.443
Total Primary Energy Consumption by 1000 $ GDP
Data source: GDP data from World Bank; TPES data from
BP Statistical Review of World Energy, 2010
China: 37% improvement in last 5 years,

www.nicenergy.com
To meet growing demand on
energy, and yet reduce the
emissions, NICE was
established in Dec., 2009.
NICE is a national research
institute focused on energy
which is funded by the Shenhua
Group, an integrated energy
conglomerate.
12
National Institute of Clean & Low-Carbon Energy
(NICE)

www.nicenergy.com
Corporate Profile of Shenhua Group
• An integrated energy conglomerate with its businesses extending from coal to power, railway, port and CTL & coal chemical, featuring its cross-regional, multi-industrial and diversified operations
• No 6 and No 3 respectively in terms of its coal-fired installed capacity and wind power installed capacity
• 29 subsidiaries (Branches), 159,000 employees and RMB 411.1 billion total assets
One of the SOEs,
established in 1995
The largest coal company in
China and the largest coal
supplier in the world
13

www.nicenergy.com
NICE Mission, Areas of Focus
• Novel Routes for Conversion and
Upgrading of Coal & Biomass
• Novel Materials and Systems for Clean
and Low Carbon Energy Applications
• Emission Reduction of Coal Power
Plants & IGCC
• CCS and CO2 Utilization including
Enhanced Oil Recovery (EOR)
• Renewable Energy and Chemicals
• Modern Coal Power Plants / Energy
Storage
• Coal to Natural Gas
• Syngas to Fuels and Chemicals
Aims at the cutting-edge sustainable and affordable technology
with no adverse impact on climate change and environment and
focuses on ......
14

www.nicenergy.com 15
World Coal Reserves: Million tons at end 2009
US, 238308
China, 204000
Russian Fed., 157010
Australia, 76200
India, 58600
Rest of World, 181382
26.0%
R/P = 245
Data source: BP Statistical Review of World Energy, 2010;
Ministry of Land and Resources of PR China
22.3%
R/P = 67 year
17.2%
R/P = 527
8.3%
R/P = 186
6.4%
R/P = 105
19.8%
R/P = 110
46%
54%
lignite & sub-
bituminous
46%
54%
69%
31%
lignite & sub-
bituminous
lignite & sub-
bituminous

www.nicenergy.com
Low Rank Coal (LRC) Challenges • Low heating value, high moisture & volatiles Low price, high transportation costs
Higher plant capital, lower efficiency, carbon footprint
Limitation as feedstock: poor slurriability
• Highly active: handling issues, spontaneous ignition hazards
Use of LRC significantly
increases capital and
decreases efficiency of
existing power plants
16
Typical LRC
region
Coal Heating Value, Btu/lb HHV
Rela
tive H
eat R
ate
or
Capital C
ost
Source: EPRI, Gasification
Technologies 2004

www.nicenergy.com
Current Paths of Coal Utilization
Coal
Combustion
Gasification
Power
CO + H2
Methanol
Synthesis
FT
Conventional
Methanation
Fuels
CH4
MeOH ,
MTO &
MTG
IGCC or
H2 Production Direct coal to
liquids Liquid
Fuels
Power &
H2 (NH3)
> 90%
< 10%
Tiny
17

www.nicenergy.com
New Look at Old Coal Utilization – Coal Refining
Coal Pyrolysis
Pyrolysis
Gas
Pyrolysis
Oil
Semi-
Coke
C2H4
CH4
H2
Phenols
Diesel +
BTX
Smelting
Coke
CaC C2H2
Gasification CO+H2 Process
Optimization
Product
value
Combustion Power
NICE Strategy: Novel refining of coal & biomass
Modern coal power generation technologies
C1 Chemistry
18
www.nicenergy.com
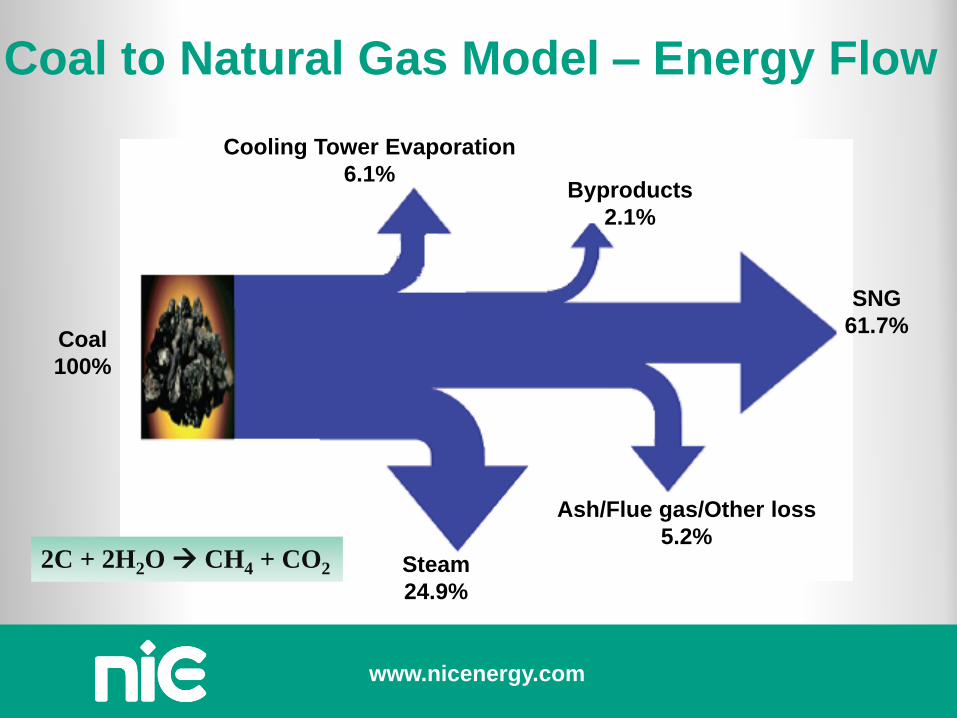
Coal to Natural Gas Model – Energy Flow
Coal
100%
SNG
61.7%
Steam
24.9%
Ash/Flue gas/Other loss
5.2%
Byproducts
2.1%
Cooling Tower Evaporation
6.1%
2C + 2H2O CH4 + CO2
www.nicenergy.com 20
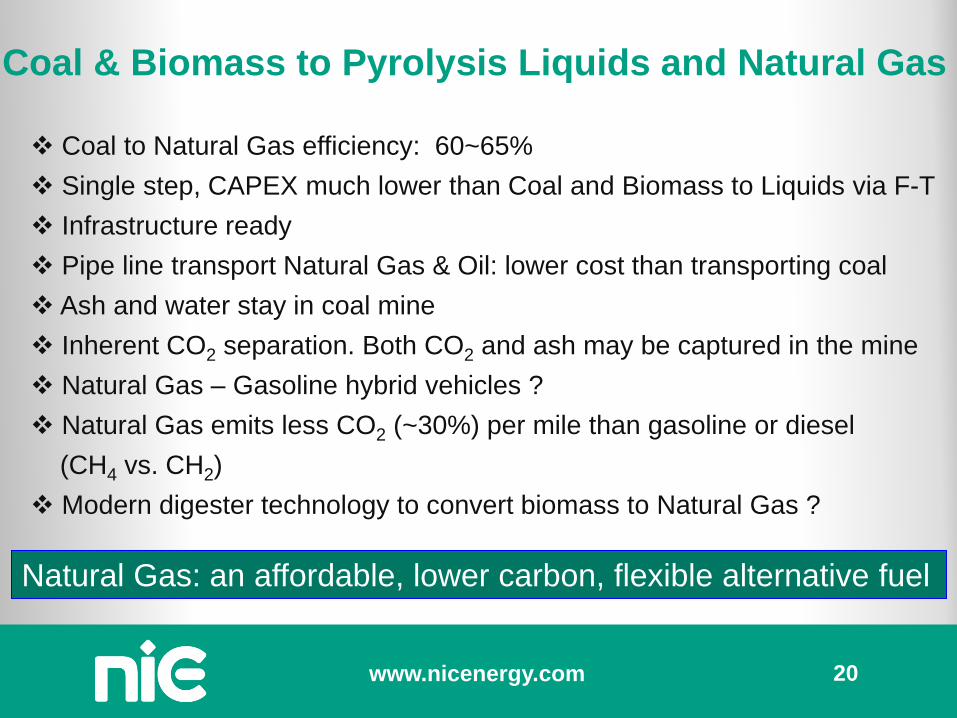
Coal to Natural Gas efficiency: 60~65%
Single step, CAPEX much lower than Coal and Biomass to Liquids via F-T
Infrastructure ready
Pipe line transport Natural Gas & Oil: lower cost than transporting coal
Ash and water stay in coal mine
Inherent CO2 separation. Both CO2 and ash may be captured in the mine
Natural Gas – Gasoline hybrid vehicles ?
Natural Gas emits less CO2 (~30%) per mile than gasoline or diesel
(CH4 vs. CH2)
Modern digester technology to convert biomass to Natural Gas ?
Coal & Biomass to Pyrolysis Liquids and Natural Gas
Natural Gas: an affordable, lower carbon, flexible alternative fuel

www.nicenergy.com
Thermal Efficiency from Different
Coal Chains
21
0%
10%
20%
30%
40%
50%
60%
70%
CFB PC SCPC IGCC NGCC IGCCw/CCS
Coal toSNG
Coal toLiquid
Th
erm
al e
ffic
ien
cy

www.nicenergy.com
CO2: Regulations & Policy
Enhance energy conservation, efficiency
Industry, buildings, transport
Mandatory fuel efficiency standards
Enhance energy security, particularly fossil hydrocarbons
Emissions reduction
• CO2 emissions - technology break through
• More stringent vehicle emissions standards
• SOx emissions: Possible bunker fuel sulfur reduction
Environmental legislation
• CO2, Climate Active Gas Emissions
• Let the markets work, learn from Natural Gas experience
CO2 emissions; US policy……Nuclear energy ?
22
www.nicenergy.com 23
Summary Coal is and will be one of the most important energy resources in the world.
Renewable energy will show most growth, but remain small percentage of total
supply.
More attention should be paid on low rank coal utilization.
Fossil Energy research should focus on SOx, NOx, Hg, particulates reduction and
more efficient conversion routes for coal and cost effective conversion of CO2.
Coal refining is an attractive new way to improve utilization of coal.
Storing CO2 with EOR is one of the most attractive approaches for CCUS.
Coal and biomass to produce NG and pyrolisis liquids -- a higher efficiency
solution.
Solutions best left for the Market to choose.

www.nicenergy.com
Acknowledgments
24
Dr. Ke Liu, Vice President & CTO of NICE
Dr. Changning Wu, Engineer
Dr. Xiaofen Guo, Senior engineer

www.nicenergy.com
Back up

www.nicenergy.com
Estimated Incremental Costs for a
Pulverized Coal Unit
to meet today’s best demonstrated criteria emissions control
performance vs. no control
26
a). Incremental COE impact, bituminous coal
b). Particulate control by ESP or fabric filter included in the base unit costs
c). When added to the “no-control” COE for SC PC, the total COE is 4.78₵/kWeh
Capital Cost
($/kWe)
Operation & Maintenance
Cost (₵/kWeh)
Cost of Electricity a)
(₵/kWeh)
Particulate Control b) 40 0.18 0.26
NOx 25 (50-90) 0.10 (0.05-0.15) 0.15 (0.15-0.33)
SO2 150 (100-200) 0.22 (0.20-0.25) 0.52 (0.40-0.65)
Incremental control cost 215 0.50 0.93 c)
Data source: MIT Study on the Future of Coal, 2007

www.nicenergy.com 27
CO2 emissions by fuel & sector
Data source: IEA CO2 Emissions from Fuel Combustion
Highlights (2009 Edition)

www.nicenergy.com
LRC Refining Opportunities
LRC
• Low Hv,~4000Kcal/Kg
• High moisture: ~30%
• Sulfur: 0.6%(DAF)
• Highly unstable
Refined coal
• Improved Hv,~6000Kcal/Kg
• Reduced moisture: ~8%
• Sulfur: 0.44%(DAF)
• Stable, similar as sub-bituminous
High value liquid products (Pyrolysis Oil)
LRC Refining
Technology
Commercially
available!
Poor quality
Low selling value
Transportation costs
Handling difficulties
Significantly Improved quality
High value-adding oil products
Suitable for Transportation
Stable and safe
Huge market potentials:
•Large LRC market: ~50% coal reserves in China, ~50% coal reserves in US
•With the high value products, market is not limited to LRC. In fact, the economics is
much better for the Shenhua’s oil-rich coal in Northern Shaanxi & Inner Mongolia
28

www.nicenergy.com
Modern Coal Power Plants Become a Chemical Plant
• Increasing importance of Chemical processes in modern coal-fired power plants
• Traditional power plant designs by thermal engineers, large room to improve/optimize
• System integration between chemical and thermal processes
Transmission Boiler
System
Thermal processes Chemical processes
Hg/Metal
control
SCR/Dust
removal
FGD CO2
Capture
Stack Water
Plant
Cooling
tower
29

www.nicenergy.com Slides from PNNL
Source: Southern Company
A Look At A Typical Coal Plant Reflects An Historical View Of The Problem- Slide From PNNL

www.nicenergy.com
Storing CO2 with EOR
Illustration of “Next Generation” Integration of CO2 Storage and EOR
Oil fields get old, requires injection of water & polymers for EOR, CO2 is
better than water for EOR
31


