A Report on Market Data for Private Sector Investments in Nepal Healthcare Sector Prepared By In partnership with Sept, 2014 [email protected]www.dolmafund.org With the support of DFID Nepal
Transcript
A Report on
Market Data for Private Sector Investments in Nepal
3.1 Structure of Healthcare in Nepal................................................................................................................. 19
3.1.1 Drugs or Pharmaceuticals .................................................................................................... 23
The private healthcare segment in Nepal is dynamic and changing rapidly. Given this, investors can also
expect to see interesting opportunities in businesses operating in medical consumables and equipment,
diagnostic clinics chains, primary clinics chains. Some early traction in these segments can already be seen.
Aside from these, models that are thriving in other developing countries such as telemedicine and emergency
healthcare services may also enter the Nepal healthcare market.
Valuation of healthcare companies in Nepal is challenging due to lack of historical data; however this
also gives early entrants in the private equity space an opportunity to buy stakes at lucrative prices
There is very little public information available on past equity investments into healthcare companies in Nepal.
The lack of data is primarily due to infancy of the investment value chain and support infrastructure such as
research and ratings. Further, sparse research coverage of capital markets in Nepal has resulted in limited
availability of historical data and limited access to updated industry benchmarks. However, the investment
landscape is witnessing brisk activity, with 2-3 institutional investment funds setup over the last three years.
This status of the investment landscape presents an opportunity for early private equity entrants to make
investments at lucrative valuations.
In the absence of industry benchmarks for valuation; data from comparable SAARC countries and
hurdle rates may be used as broad guides by investors
Valuation data from comparable countries like India, Sri Lanka, Bangladesh and Pakistan may be used as
broad guides by investors. However, investors should be cognisant that countries like India have much higher
market capitalisation and better investment value chains. Hence, even though some comparable valuation
ratios can be used from other developing SAARC countries, they can at best be broad guides since the
regulatory regimes, banking infrastructure, market capitalisation and other macro-economic indicators vary
widely from country to country.
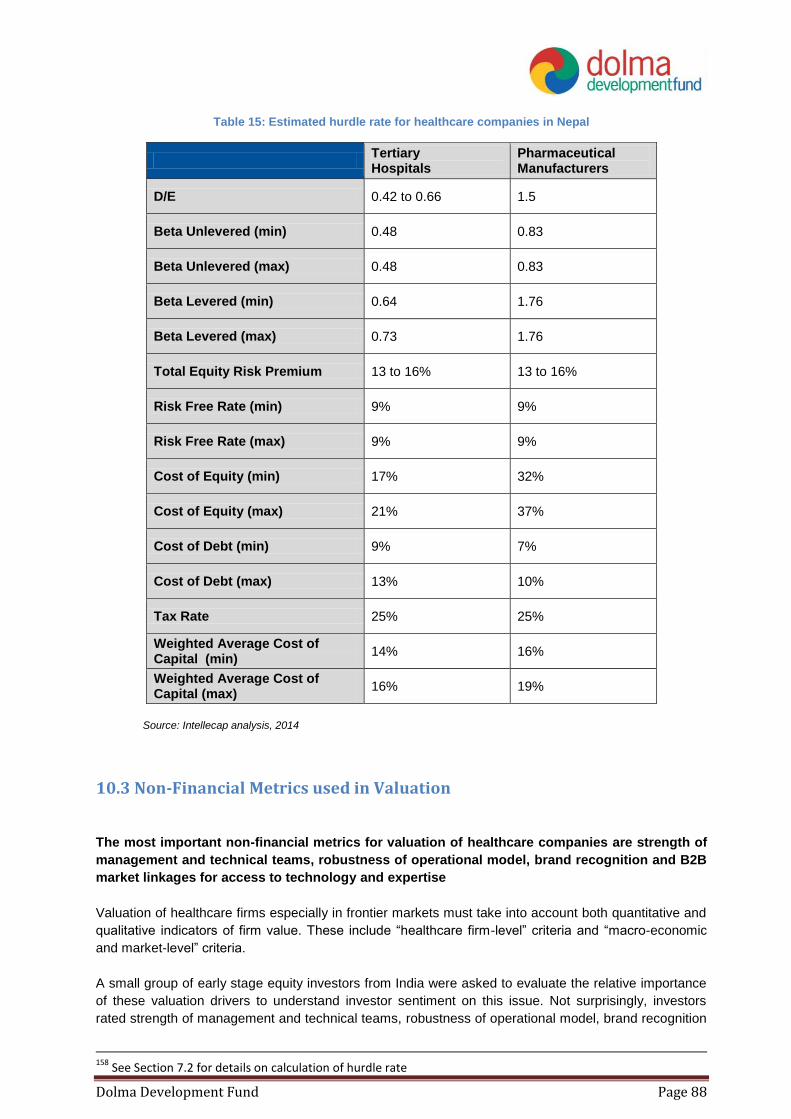
In the absence of consistent data on valuation ratios in the sector, hurdle rate can serve a good indicator of
minimum expected return from investments in the sector. Based on the data from the healthcare sector in
Nepal and comparable proxies, the Cost of Equity for investments in tertiary hospitals is estimated to vary
from 17% to 19%; and Weighted Average Cost of Capital is estimated to be 14% to 16%. The Cost of Equity
in pharmaceutical manufacturing is 32 to 37%; and the Weighted Average Cost of Capital is 16 to 19%.
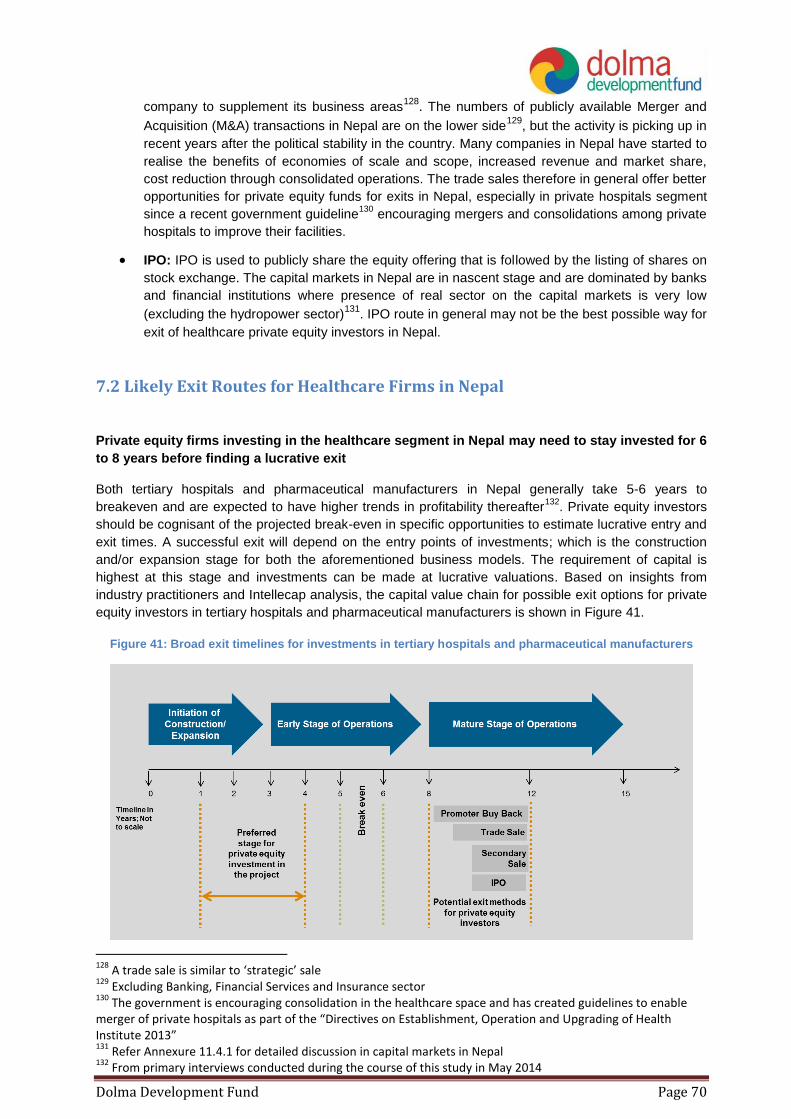
Promoter buy-back likely to be most popular approach for equity exits in Nepal in the next 4-5 years;
especially in tertiary hospitals
Re-purchase of private investor’s shared by promoter(s) is likely to be the more prevalent approach for exits in
Nepal; especially in tertiary hospitals which are higher margin businesses and comparatively higher market
opportunities. While promoter ability to buy-back will be one driver; the other will probably be the prevailing
promoter sentiment where existing promoters want to ultimately retain complete control of the firm. There
seems to be a high degree of apprehension about loss of control that could result from diluting management
stake18
.
Trade sale may be observed in smaller tertiary hospitals
Acquisition by a larger hospital or merger of two complementary smaller hospitals businesses is somewhat
likely as well. This is expected to be driven by the expansion drive that most tertiary hospitals seem to
18
From primary interviews conducted by Intellecap during the course of this study in May 2014
Dolma Development Fund Page 14
displaying to capture greater market share in underserved regions outside Kathmandu. Additionally, facilitative
regulation put in place by MoHP will also act as a facilitator19
. In addition to domestic mergers, acquisitions
and JVs with foreign hospitals are also likely to pick up as a trend driven by the success of the Medanta-
Norvic, Fortis-Vayodha, and Samitej-Grande partnerships20
.
Based on market landscape, business model, and valuation analysis, tertiary hospitals emerge as the
most attractive investment opportunity for private equity investors in Nepal
Market assessment of private healthcare in Nepal shows that the business model of pharmaceutical
manufacturers faces significant constraints to scale like complete import-reliance for raw materials (Active
Pharmaceutical Ingredients) and tough competition from foreign pharmaceutical firms. As a result of these
challenges, the cost of equity invested in pharmaceutical companies is high. On the other hand, due to
growing demand and increasing improvements in technology, skills and overall business model robustness,
cost of equity invested in tertiary healthcare is lower. Hence, while the systemic challenges plaguing the
pharmaceutical manufacturing industry persist; investors are likely to find more attractive opportunities in
tertiary hospitals.
However, given the limitation of market data in Nepal, this conclusion is at best a broad guide for private
equity investors. It is likely pharmaceutical manufacturers using innovative and low-cost approaches to
tackling these challenges also present attractive investment opportunities.
2. Introduction Healthcare is an important sector from a socio-economic perspective in Nepal. The quality of healthcare
impacts life expectancy and overall health of workforce; and at the same time the cost of healthcare impacts
household spending patterns and hence the economy. In Nepal, the sector ranks unfavourably against global
averages on both health “inputs” as well as “outcomes”. The inputs-side of healthcare includes infrastructure,
availability of skilled physicians, and availability as well as distribution of life saving vaccines and
pharmaceuticals. On average, Nepal has 0.9 hospital beds per 1000 people21
; and 0.36 physicians per
100022
.
As a result of underdeveloped and insufficient inputs, health-outcomes in Nepal are poor
The indicators of health outcomes such as life expectancy, maternal care, and incidence rates of
communicable diseases in Nepal compare unfavourably with global averages. The country ranks 139th in life
expectancy, notes 58% coverage of medical prenatal care for women as compared to 80.6% seen globally,
and incidence of Tuberculosis (TB) per 100,000 has remained nearly constant at about 160 over the past 8
years while the global incidence average fell by 15% in the same period23
.
While the sector is underdeveloped, it is showing signs of progress and considerable private sector
activity has been seen
Such activity is particularly vibrant in pharmaceutical industry, diagnostic clinics and hospitals. As a result,
health-related metrics are showing improvement in the past few years. Even though Nepal does compare
unfavourable against global benchmarks in maternal healthcare and TB; the country has recorded a
19
MoHP Nepal, Directives on Establishment, Operation and Upgrading of Health Institute 2013 20
See Table 3 for details 21
Ratio calculated based on number of hospital beds reported in WHO’s publication – “Nepal Pharmaceutical Profile 2012” 22
MoHP and WHO, Nepal Pharmaceutical Country Profile, 2012 23
World Bank Development Indicators; accessed in March 2014
Dolma Development Fund Page 15
consistent success rate of 90% in TB treatment since 2009; higher than the 87% global rate of success.
Maternal mortality during childbirth has fallen to 1/3rd of the deaths recorded in 199024
.
As healthcare infrastructure and availability grows, the impetus will also need to move towards
affordability and last mile reach
Ukaid’s Department for International Development (DFID)’s Nepal office estimates that the poorest women in
Nepal are “five times as likely as the richest to cite distance from a health facility as the main reason for not
accessing health care” – an insight that illustrates the need more clearly. The private sector will play a key role
in improving the state of healthcare over the next few decades; and it pace of growth can be accelerated by
access to risk capital across various stages of business growth. Investments in healthcare can only generate
positive financial returns as evidenced by examples in emerging economies like India25
; but also create
significant positive social impact.
2.1 Healthcare’s Role in Economic Development
While the healthcare industry makes a comparatively less direct contribution in terms of revenues and
employment to the economy; its indirect impact by improving quality and longevity of life is very significant.
Healthcare in Nepal comprises about 5.5% of the GDP and is an important part of the services industry26
. The
sector employs approximately 45,000 to 50,000 people including skilled and semi-skilled personnel27
.
Healthcare is delivered by public and private sector and accounts for a total expenditure of over US$ 1 billion
each year28
. This comprises 5.4% of the Gross Domestic Product (GDP) and translates to a per capita
expenditure of US$ 33. This is lower than the global average and also compares unfavourably with other
emerging economies like South Africa and Brazil; but is higher than most South Asian Association of Regional
Cooperation (SAARC) countries.
The sector employs 45,000 to 50,000 of the workforce, mostly in semi-skilled and skilled jobs as shown in
Figure 1.
Figure 1: Distribution of jobs in the healthcare sector
Source: Nepal Pharmaceutical Country Profile; MoHP; 2011
24
World Bank Development Indicators; accessed in March 2014 25
Over US$ 3.9 billion have been invested in the healthcare sector in India over the past 5 years; and investors have seen 59 exits (source: Venture Intelligence) 26
World Bank Development Indicators; accessed in March 2014 and Intellecap analysis; 2014 27
Nepal Pharmaceutical Country Profile; MoHP; 2011 28
World Bank Development Indicators; accessed in March 2014
72%
23%
3% 2%
Nursing and Midwifery Personnel
Physicians
Pharmaceutical Technicians and Assistants
Licensed Pharmacists
Dolma Development Fund Page 16
2.2 Overall State of Demand and Supply in Healthcare
There is a significant demand-supply gap in the healthcare sector in Nepal; where the supply of high quality
and accessible healthcare (both private and public) is inadequate to address the demand for healthcare. At
the same time, the expenditure on healthcare is rising buoyed by growing GNI and remittances. As a result,
there is an opportunity for private healthcare facilities to bridge this gap. One of the biggest growth hurdles
promoters of such facilities face is the prohibitive entry cost due to “capital-heavy” nature of business, as well
as lack of access to appropriate capital for operational expenditure. Private equity investors can help address
this challenge and catalyse the growth of a vibrant private healthcare landscape.
2.2.1 Analysis of Demand-Side Dynamics
Healthcare demand in Nepal is rising as evidenced by growing expenditure
Nepal spends 5.4% of the total GDP on health-related public and private expenditures including fee for
healthcare services (diagnosis, treatment), pharmaceuticals, and health-related insurance premiums.
Although the expenditure has been growing steadily over the past decade as shown in Figure 2; it is still only
half of the global average and so is expected to increase at a higher rate in the next few years.
Figure 2: Rising healthcare expenditure in Nepal
Source: World Bank Development Indicators; accessed in March 2014 (current US$)
A disproportionately high component of this expenditure consists of “out-of-pocket” private
expenditure
Nearly 55% of Nepal’s healthcare expenditure is “out-of-pocket” private expenditure i.e. direct outlay by
households when compared to the global average of only 18%29
. Such a high rate of “out-of-pocket”
expenditure is possible because of an increase in disposable income – driven in-part by growth in remittances.
Nepal has a large percentage of its population working abroad in countries like India and Malaysia. In fact,
over 30% of Nepalese working age males abroad. These non-residents annually remit over US$ 4 billion or
29
World Bank Development Indicators; accessed in March 2014
. As a result, households have more discretionary spending
power and are investing in higher quality healthcare.
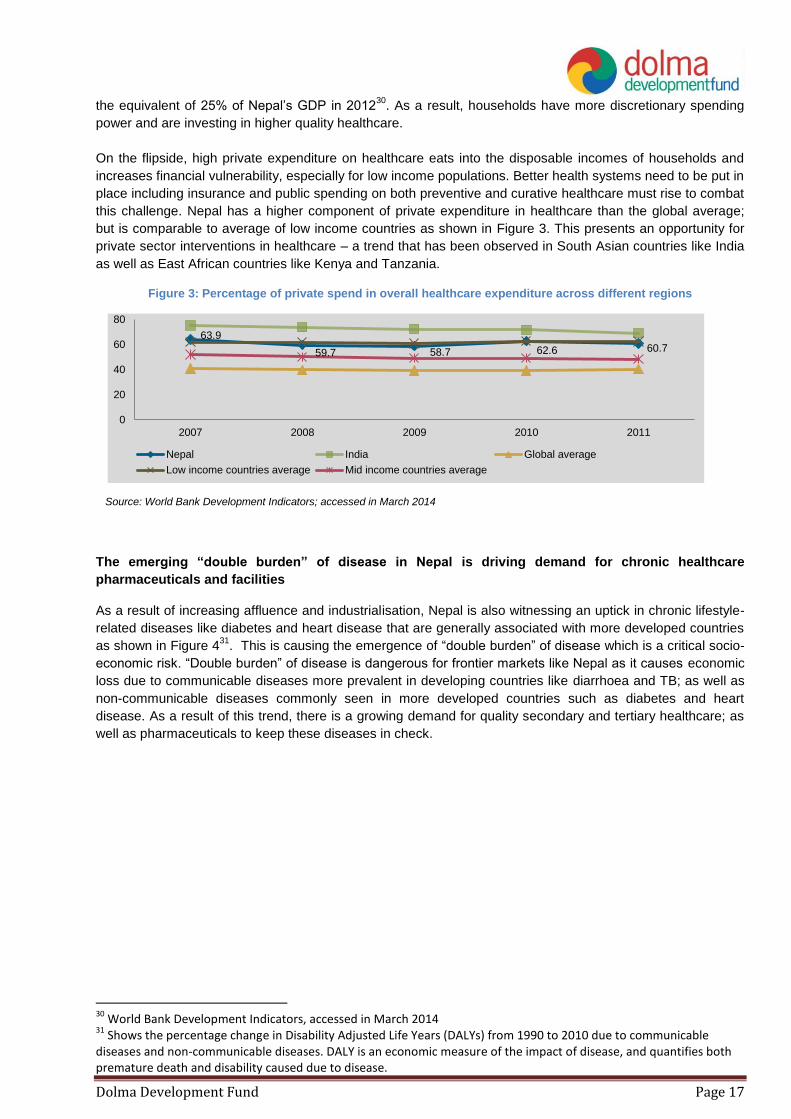
On the flipside, high private expenditure on healthcare eats into the disposable incomes of households and
increases financial vulnerability, especially for low income populations. Better health systems need to be put in
place including insurance and public spending on both preventive and curative healthcare must rise to combat
this challenge. Nepal has a higher component of private expenditure in healthcare than the global average;
but is comparable to average of low income countries as shown in Figure 3. This presents an opportunity for
private sector interventions in healthcare – a trend that has been observed in South Asian countries like India
as well as East African countries like Kenya and Tanzania.
Figure 3: Percentage of private spend in overall healthcare expenditure across different regions
Source: World Bank Development Indicators; accessed in March 2014
The emerging “double burden” of disease in Nepal is driving demand for chronic healthcare
pharmaceuticals and facilities
As a result of increasing affluence and industrialisation, Nepal is also witnessing an uptick in chronic lifestyle-
related diseases like diabetes and heart disease that are generally associated with more developed countries
as shown in Figure 431
. This is causing the emergence of “double burden” of disease which is a critical socio-
economic risk. “Double burden” of disease is dangerous for frontier markets like Nepal as it causes economic
loss due to communicable diseases more prevalent in developing countries like diarrhoea and TB; as well as
non-communicable diseases commonly seen in more developed countries such as diabetes and heart
disease. As a result of this trend, there is a growing demand for quality secondary and tertiary healthcare; as
well as pharmaceuticals to keep these diseases in check.
30
World Bank Development Indicators, accessed in March 2014 31
Shows the percentage change in Disability Adjusted Life Years (DALYs) from 1990 to 2010 due to communicable diseases and non-communicable diseases. DALY is an economic measure of the impact of disease, and quantifies both premature death and disability caused due to disease.
63.9
59.7 58.7 62.6 60.7
0
20
40
60
80
2007 2008 2009 2010 2011
Nepal India Global average
Low income countries average Mid income countries average
Dolma Development Fund Page 18
Figure 4: Shifting patterns of DALYs due to communicable and non-communicable diseases in Nepal
Source: Institute for Health Metrics and Evaluation, Global Burden of Disease Country Profiles, 2013
2.2.2 Analysis of Supply-Side Dynamics Public sector healthcare facilities are inadequate, Consumers towards higher quality private sector facilities Healthcare infrastructure in Nepal is inadequate and compares unfavourably against most global as well
BRICS (Brazil, Russia, India, China, and South Africa) countries’ averages as shown in Table 1.
Table 1: Comparison of Nepal's healthcare infrastructure with BRICS and Global Benchmarks
Metric Nepal BRICS
median
Global
average
Doctors per 1000 0.36 1.8 1.5
Nurses and midwives per 1000 1.17 4.9 3.3
Hospital beds per 1000 0.932
3.7 2.9
% of births attended by skilled health
staff 36% 77.07% 67.3%
Source: MoHP and WHO, Nepal Pharmaceutical Profile, 2012; and World Bank Development Indicators
database, accessed in May 2014
As a result of the poor state of healthcare infrastructure, 18% of Nepalese report healthcare as “inadequate”,
while 79% as “just adequate”. These metrics are worse for rural areas of the mid and far Western Hills where
up to 35% households report healthcare as “inadequate”33
. As a result, 63% of people in Nepal generally
32
This ratio was calculated using the number of hospital beds reported in WHO publication Nepal Pharmaceutical Profile 2012 33
Nepal Living Standards Survey, Volume 2; Central Bureau of Statistics; 2011
-60% -65%
8%
75%
-10%
100%
60%
200%
110%
20%
90% 85% 100%
60%
20%
Communicable Diseases
Non-Communicable Diseases
Dolma Development Fund Page 19
prefer to visit private healthcare practitioners and facilities. Figure 5 shows the distribution of healthcare
consultations in Nepal by facility type.
Figure 5: Distribution of healthcare consultations in Nepal by facility type
Source: Nepal Living Standards Survey – Volume 1, Central Bureau of Statistics, 2012
While private healthcare facilities have been growing over the past 5-7 years, they are still inadequate
to address the demand for healthcare in Nepal
While the healthcare sector has witnessed growth of private hospitals and diagnostic centres, as well as
growth in domestic pharmaceutical manufacturing; this growth remains inadequate to address demand. Most
hospital and diagnostic infrastructure is concentrated in larger cities like Kathmandu and Pokhara, and there is
little or no access in rural and peri-urban areas. Further, the hospital as well as pharmaceuticals industry
remains import-reliant to a high degree and this increases cost of healthcare for end-consumer. Nepal
imported US$ 95.4 million worth of healthcare-related commodities like pharmaceuticals, devices, and medical
supplies in 201334
; nearly as much as the total financial contribution the sector makes to the GDP.
3. Sector Overview
3.1 Structure of Healthcare in Nepal
Structure of the healthcare sector in Nepal can be analysed across 4 dimensions – (a) examining public and
private activity; (b) through 4 major sub-sectors – drugs or pharmaceuticals, diagnosis, delivery and data; (c)
through comparing different medical approaches like modern allopathic and traditional
ayurvedic/homeopathic; and (d) geographic trends in healthcare.
Analysing sector structure by public and private activity shows opportunity for greater private sector
engagement
The private sector dominates the healthcare landscape in Nepal as shown in Figure 6. Since public sector
data is more readily accessible, greater granularity can be seen but from the perspective of overall footprint
34
Trade and Export Promotion Centre Nepal database, accessed in March 2014
28%
25%
14%
8%
5% 7%
Private clinic Pharmacy
Government hospital/health center Sub-health post
Private hospital Others
Dolma Development Fund Page 20
the private sector is much larger. This is also evidenced by the high private component in annual healthcare
expenditure – which is 64% of the annual spend on healthcare.
Dolma Development Fund Page 21
Figure 6: Broad landscape of public and private sector activity in Nepal
Source: Government of Nepal, Department of Health Services, Annual Report 2011-12 and Intellecap analysis; 2014
Dolma Development Fund Page 22
Government allocation to healthcare expenditure is low at 9.6%35
as compared to the global average of
15.5%36
; and has been falling steadily since 2006 as shown in Figure 7.
Figure 7: Falling government allocation to healthcare expenditure
Source: World Bank Development Indicators; accessed in March 2014
While this presents a challenge for the country, it is also a great opportunity for the private sector to
serve this unmet need. The government has also recognised this in the 2012 Annual Report of the
Department of Health Services (DoHS), Nepal – where it has outlined need for greater private sector
participation, building a robust regulatory environment to support this, and scaling infrastructure for data
(like the Health Management Information System) and financing (like the recently unveiled National
Health Insurance Scheme).
Analysing sector by 4 major sub-sectors shows significant private sector activity in drugs,
diagnosis and delivery of tertiary healthcare
The healthcare sector can also be studied using a “4D framework” to identify sub-sectors of activity like
Drugs, Diagnosis, Delivery and Data as shown in Figure 8.
Figure 8: Sub-sectors of healthcare in Nepal
Source: Intellecap analysis; 2014
35
2011 data from World Bank Development Indicators; accessed in March 2014 36
2004 data from World Bank Development Indicators; accessed in March 2014
14.5%
11.3% 11.3% 10.8% 9.5% 9.6%
2006 2007 2008 2009 2010 2011
% of government expenditure allocated to healthcare
Dolma Development Fund Page 23
Analysing the sector from this lens shows significant formal sector activity in drugs (both importers and
local manufacturers), diagnosis and delivery; but very little in data. However with the growing footprint
of hospitals and Government-led impetus on health data collection, it is expected that Information and
Communications Technology (ICT) players seeking to service hospitals with Customer Relationship
Management (CRM) and Management Information System (MIS) products will start entering the market
as well.
Reviewing the sector by approaches to medicine shows that allopathic approaches are
dominant but there is some amount of ayurvedic and homeopathic activity as well
Ayurveda and homeopathy are traditional South Asia systems of medical care based on herbs, minerals
and animal products. The government recognises and supports these traditional approaches, and has a
special unit called “Ayurveda and Alternative Medicine (AAM)” unit in the DoHS responsible for
developing and overseeing ayurvedic and homeopathic infrastructure. The government infrastructure
for traditional care shown in Figure 2 served nearly 160,000 people in 201237
. On the other hand, most
ayurvedic activity in Nepal is unorganised and in the informal sector38
.
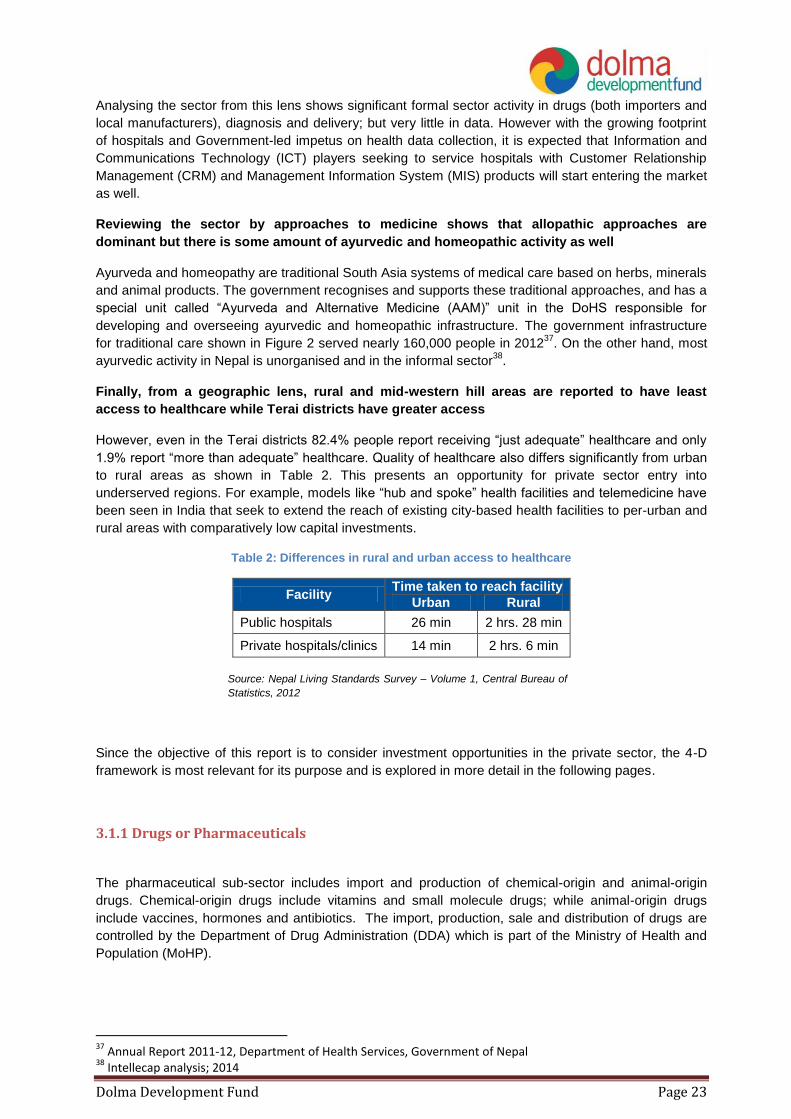
Finally, from a geographic lens, rural and mid-western hill areas are reported to have least
access to healthcare while Terai districts have greater access
However, even in the Terai districts 82.4% people report receiving “just adequate” healthcare and only
1.9% report “more than adequate” healthcare. Quality of healthcare also differs significantly from urban
to rural areas as shown in Table 2. This presents an opportunity for private sector entry into
underserved regions. For example, models like “hub and spoke” health facilities and telemedicine have
been seen in India that seek to extend the reach of existing city-based health facilities to per-urban and
rural areas with comparatively low capital investments.
Table 2: Differences in rural and urban access to healthcare
Facility Time taken to reach facility
Urban Rural
Public hospitals 26 min 2 hrs. 28 min
Private hospitals/clinics 14 min 2 hrs. 6 min
Source: Nepal Living Standards Survey – Volume 1, Central Bureau of
Statistics, 2012
Since the objective of this report is to consider investment opportunities in the private sector, the 4-D
framework is most relevant for its purpose and is explored in more detail in the following pages.
3.1.1 Drugs or Pharmaceuticals
The pharmaceutical sub-sector includes import and production of chemical-origin and animal-origin
drugs. Chemical-origin drugs include vitamins and small molecule drugs; while animal-origin drugs
include vaccines, hormones and antibiotics. The import, production, sale and distribution of drugs are
controlled by the Department of Drug Administration (DDA) which is part of the Ministry of Health and
Population (MoHP).
37
Annual Report 2011-12, Department of Health Services, Government of Nepal 38
Intellecap analysis; 2014
Dolma Development Fund Page 24
There are 3 major sources of drug supply in Nepal – (a) imported drugs which have a 55 to 60% market
share39
(b) drugs manufactured in Nepal; sometimes using imported Active Pharmaceutical Ingredients
(APIs) which have a 40 to 45% market share and (c) drugs donated by development partners of the
Nepalese government40
.
Drug importers cater to nearly half of the pharmaceutical market currently, but the market share
is expected to decrease with rise in domestic manufacturing capabilities
There are 80 registered importers of drugs who channel in both processed drugs and semi-processed
drugs or APIs for Nepalese pharmaceutical companies. Most of the imported drugs sold in Nepal
originate from India, and these imported drugs are a significant source of competition for the domestic
industry. Drug importers are offered attractive incentives by Indian pharmaceutical companies, which
often also take up the cost of marketing in Nepal. While the business of drug import is lucrative in terms
of assured revenues and good margins; there is little or no differentiation between businesses and as a
result competition is high. With growth in domestic manufacturing capacities, and decrease of reliance
on imports, drug importers may start to face more competition and margin pressures in the near future.
Drug importers are based out of Kathmandu and Birgunj, with very few in Nepalgunj as shown in Figure
5; and rely on surface transport through the Indian port city of Kolkata.
Figure 9: Geographic distribution of registered drug importers
Source: Department of Drug Administration, Nepal; accessed in March 2014
The domestic drug manufacturing industry is growing and as a result import-reliance on
processed drugs is decreasing; however there is little or no domestic manufacturing of APIs
which are completely import-reliant
Nepal has 45 registered pharmaceutical companies that produce modern medicines. Most import APIs
and then formulate, package and retail the drugs locally. The domestic manufacturing industry has been
picking up momentum over the past 4-5 years, and it is estimated that Nepal-manufactured drugs have
captured 40 to 45% of the domestic market41
.
Driven by the growth in domestic manufacturing, the import of processed drugs has seen a decline over
the past 3 years as shown in Figure 6. Nepal imported over US$ 33.1 million worth of processed drugs
39
Association of Pharmaceutical Producers Nepal, 2012 and Intellecap analysis from primary interviews conducted during the course of this study in February and May 2014 40
Quantitative data on this was not available 41
Association of Pharmaceutical Producers Nepal, 2012 and Intellecap analysis from primary interviews conducted during the course of this study in February and May 2014
Dolma Development Fund Page 25
and APIs in FY 201342
. In terms of sheer quantity, imports of APIs have been rising since FY 2011 while
import of processed drugs has been falling.
Figure 10: Changing import trends in drugs
Source: Trade and Export Promotion Centre Nepal, database accessed in March 2014
Pharmaceutical manufacturers are largely headquartered in Kathmandu and have factories on the
outskirts of the city or in another city. Aside from Kathmandu, Bara and Bhaktapur have clusters of
pharmaceutical manufacturing facilities. Figure 11 shows the geographic distribution of these facilities.
Figure 11: Geographic distribution of pharmaceutical factories in Nepal
Source: Department of Drug Administration, Nepal; accessed in March 2014
Ayurvedic drugs manufacturing is fragmented, though there has been some recent activity in
organised, large-scale manufacturing
Ayurvedic drugs are manufactured from natural products like essential oils, roots and leaves; mixed in
specific ratios. Individual ayurvedic clinics and treatment centres tend to follow different recipes and
manufacture their own drugs43
. As a result, this segment of the pharmaceutical industry is highly
fragmented. However, there have been some recent attempts at organised, commercial-scale
manufacturing of drugs. For instance, Grace Pharmaceuticals – a growing ayurvedic medicine
manufacturer – has recently set up a factory in Rupandehi district and has been supplying medicines to
neighbouring Terai and Hill districts. The factory was set up with an investment of US$ 1.56 million and
has an annual capacity to produce drugs worth US$ 1.25 million.
42
Data from July 2012 to June 2013 from Nepal’s Export-Import Database; accessed in March 2014 43
From primary interviews conducted during the course of this study in February and May 2014. See Annexure for list of interviewees.
0.43 0.45
11.1
6.1
2.3 1.03
FY 2011 FY 2012 FY 2013
APIs imported (mt) Processed drugs imported (mt)
Dolma Development Fund Page 26
Essential drugs are also donated by various philanthropic organisations and individuals
The import of these is regulated strictly by DDA and is only allowed when they meet specific quality
criteria and have been sent in response to a specific demand. Overall, 27 categories of essential drugs
consisting of over 135 different medications are allowed to be donated to Nepal from other countries.
Most of these are channelled through to hill and mountain districts of the Far Mid-West which have the
least access to healthcare. During the course of primary interviews done for this study, no reports were
found of these donated medicines distorting the pharmaceutical market.
3.1.2 Diagnostics
Diagnostic facilities in Nepal are operated by the private and public sectors
Healthcare diagnostics includes the testing, analysis and reporting of disease incidence primarily based
on organic samples like blood and saliva. In Nepal, diagnostic facilities are operated by both the public
and private sectors. The overall regulation for both is managed by the National Public Health Laboratory
(NPHL) including policies, guidelines, recommendations for improvement, and certification of private
diagnostic facilities.
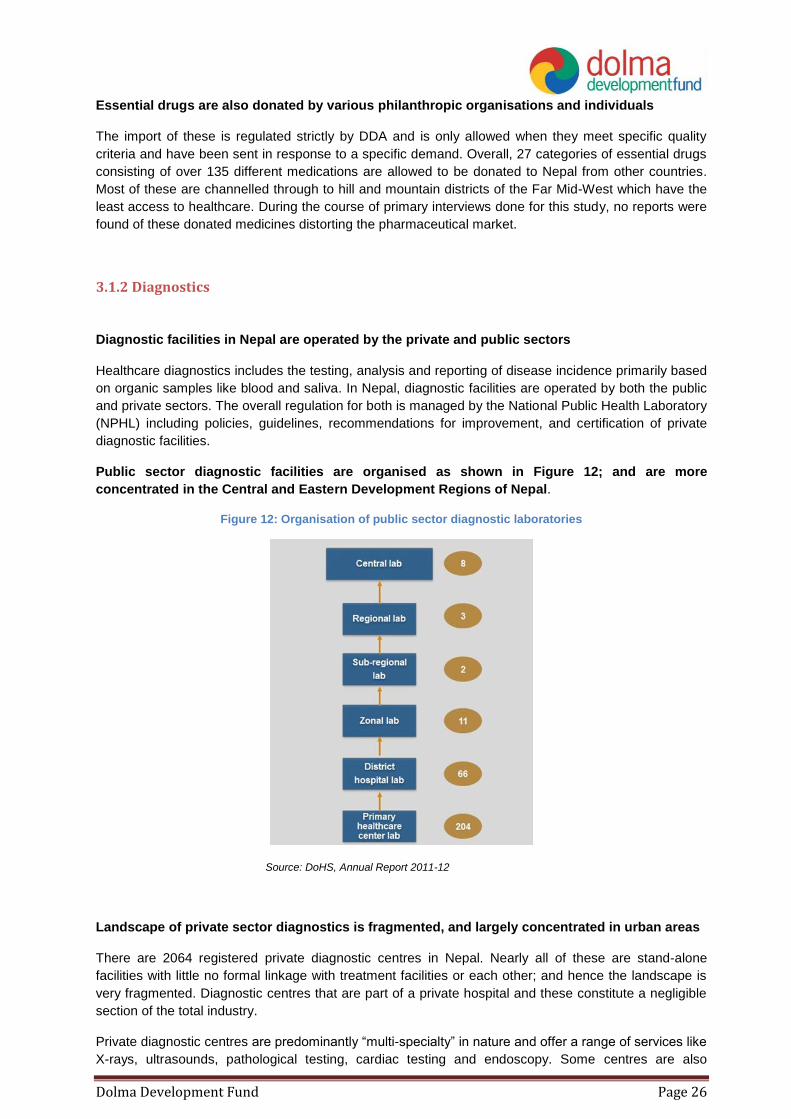
Public sector diagnostic facilities are organised as shown in Figure 12; and are more
concentrated in the Central and Eastern Development Regions of Nepal.
Figure 12: Organisation of public sector diagnostic laboratories
Source: DoHS, Annual Report 2011-12
Landscape of private sector diagnostics is fragmented, and largely concentrated in urban areas
There are 2064 registered private diagnostic centres in Nepal. Nearly all of these are stand-alone
facilities with little no formal linkage with treatment facilities or each other; and hence the landscape is
very fragmented. Diagnostic centres that are part of a private hospital and these constitute a negligible
section of the total industry.
Private diagnostic centres are predominantly “multi-specialty” in nature and offer a range of services like
X-rays, ultrasounds, pathological testing, cardiac testing and endoscopy. Some centres are also
Dolma Development Fund Page 27
partnered with Indian diagnostic facilities for conducting more advanced tests. For instance, Super
Religare Laboratories (SRL), one of India’s leading diagnostic networks has entered into a JV with Life
Care Sciences Ltd., a subsidiary company of the NE Group in 201044
.
Private diagnostic centres are largely concentrated in Kathmandu and some of the larger towns and
cities like Pokhara, Bharatpur and Biratnagar as shown in Figure 13.
Figure 13: Geographic distribution of private diagnostics facilities in Nepal
Source: Direct data for geographic distribution was unavailable; hence spread of private
diagnostic facilities was estimated based on footprint of private hospitals and geographic
spread of diagnostic clinics reported during primary interviews conducted during the course of
this study in February and May 2014
Overall, there is still a heavy reliance on invasive diagnosis approaches that require skilled staff
and significant laboratory infrastructure for processing
Most diagnostic clinics rely on outdated invasive technologies for collecting patient data, and as a result
are heavily reliant on skilled staff and laboratory infrastructure. Further, often the test results are not
available immediately and as a result there can be significant delay between a test and action taken to
remedy disease. There is an opportunity for private sector innovation in building non-invasive diagnostic
approaches45
- which can be incentivised by increasing availability of funding for R&D; and building
biases towards non-invasive rapid tests in public and private tendering.
3.1.3 Delivery
Nearly two-thirds of all healthcare delivery facilities in Nepal are privately owned and operated46
Delivery of healthcare treatment in Nepal can be analysed under 3 different categories – primary,
secondary and tertiary care as shown in Figure 14.
44
See Case Box 4 in Section 6.3.2 for details 45
No puncture or penetration of body is involved; instead data like pulse rate, imagery is used to diagnose health conditions 46
Source: National Department of Health Sciences, Annual Report 2011-12; and Intellecap Analysis; 2014
Dolma Development Fund Page 28
Figure 14: Types of healthcare delivery facilities in Nepal
Source: National Department of Health Sciences, Annual Report 2011-12; and Intellecap Analysis; 2014
The MoHP regulates operations of private healthcare facilities in Nepal and also sources annual
performance data which is can be used as a good indicator to estimate the landscape of private sector
activity in healthcare delivery.
Private primary healthcare in Nepal is largely fragmented and small-scale
Primary healthcare in Nepal is largely provided by government primary healthcare centres and activity
in the private sector in this space is largely fragmented and small-scale in nature. Most private primary
clinics and facilities are structured as a one-person operation with a doctor in lead supported by 1-2
technical personnel. There are no significantly large chains of branded primary healthcare clinics; and
from primary research done during the course of this study it was found that most private primary
healthcare clinics depend on the promoter-doctor’s brand equity to attract patients.
There are 74 registered private primary healthcare clinics in Nepal that report performance data to
Health Infrastructure Information System (HIIS) operated by the DoHS, of which Kathmandu alone has
40; indicating that private primary clinics are not yet built a significant footprint outside of Kathmandu.
Private sector activity in secondary and tertiary healthcare is thriving and organised; and far
outpaces services provided by the public sector
Secondary and tertiary healthcare has seen most private sector engagement and is currently the most
organised sub-sector in healthcare. The prohibitive capital expenditure involved in acquiring land and
setting up a hospital creates an entry-barrier that has limited activity in this sector mostly to medium and
large businesses. Private secondary hospitals have emerged at an accelerated pace since 1995, and
have multiplied 5-fold as shown in Figure 15. On the other hand; only 19 new public sector hospitals
were launched in the same time-frame.
Dolma Development Fund Page 29
Figure 15: Growth of public and private hospitals (secondary and tertiary) in Nepal
Source: Hospital Survey, Ministry of Health and Population, 2008; Annual Report
2011-12, Department of Health Services, Government of Nepal; Primary data
collected during the course of this study by Intellecap in 2014
Private secondary and tertiary hospitals are largely concentrated in Kathmandu and a few urban
centres like Pokhara. 110 of these facilities report performance data to HIIS, and their geographic
distribution is shown in Figure 16.
Figure 16: Geographic distribution of private hospitals that report performance data to DoHS
Source: MoHP geographical mapping of hospitals in Nepal
Tertiary healthcare facilities in Nepal are mostly “multi-specialty” in structure, with very few
focusing solely on one specialty
Most tertiary hospitals are structured as multi-specialised facilities offering care across disciplines like
cardiology, nephrology, trauma and emergency care, orthopaedics, obstetrics and gynaecology, and
neurology and neurosurgery. The demand for tertiary care services is driven by the shifting pattern of
disease burden in Nepal with increasing incidence of lifestyle diseases like diabetes and ischemic heart
disease as shown in Figure 4.
There are very few tertiary healthcare facilities with single specialisation focus; and these tend to
specialise in chronic healthcare issues like dental care and eye care.
Practice of alternate medicinal approaches is fragmented with high degree of informality
69
147
350
78 96 97
1995 2008 2013
Number of Private hospitals Number of Public hospitals
Dolma Development Fund Page 30
There are also some private clinics and hospitals that follow alternate systems of medicine like
Ayurveda, Homeopathy and Unani approaches; but this market is highly fragmented and mostly in the
informal sector. Hence, it has not been covered in detail in this study.
3.1.4 Data
Data sub-sector in healthcare has 4 major components – collection of patient and disease data,
analysis of trends, application of insights for improving services, and ancillary IT-enabled support like
Business Process Outsourcing (BPO). Nepal has very little activity in the data sub-sector.
On the public sector side, there is an open data collection initiative currently led by MoHP but the data
is not yet reported to an extensive degree in the public domain.
Private clinics and hospitals collect their own data, with newer facilities also using ICT tools like CRM
platforms to manage patient data. Firms use international providers like SalesForce as well as products
developed by Nepalese IT companies like GapsCo and MIDas Technologies. GapsCo has developed
VitalCare, (hospital management software) which is used by Advanced Poly Clinic and B.P. Koirala
Memorial Cancer Hospital47
. MIDas provides Medical Practice Management Solution including Hospital
Automation and Hospital Information Management Systems which are also used by several hospitals in
Nepal including Nepal Medical Hospital, Tribhuvan University Teaching Hospital, and Kanti Children’s
Hospital48
.
3.2 Current State of Healthcare Sector in Nepal
Over two-thirds of the private healthcare segment consists of diagnostics clinics
There are nearly 3000 private healthcare enterprises in Nepal of which most are diagnostic clinics,
followed by primary clinics, secondary and tertiary hospitals and pharmaceutical industry companies as
shown in Figure 17.
Figure 17: Distribution of healthcare businesses in Nepal
Source: Annual Report 2011-12, Department of Health Services, Government of Nepal
47
GapsCo website 48
MIDas website, primary interview conducted during the course of this study in May 2014
70%
26%
4%
Diagnostic clinicsPrivate clinics and hospitalsPharmaceutical companies
Dolma Development Fund Page 31
Of these, diagnostic clinics and primary healthcare clinics are fragmented businesses that are mostly
registered as “sole proprietorships”. Due to their fragmented nature, such businesses are inherently not
scalable unless consolidation takes place. They are especially inappropriate for private equity investors
since they do not have the ability to take in large amounts of equity capital as minority stake; and owing
to their legal structure as “sole proprietorships’ investments are not possible due to regulatory norms
explain in Table 19. Pharmaceutical companies include both manufacturers and importers, where
importers are essentially traders who supply to pharmaceutical manufacturers and retail chains, and are
not scalable businesses.
The current state of the healthcare industry differs across sub-sectors, with some sub-sectors
like tertiary healthcare and pharmaceuticals manufacturing being more advanced than others
These sectors show more organised and commercial scale activity, higher degree of firm-level
competitiveness49
, and are better positioned to absorb private equity capital as shown in Figure 18.
Figure 18: Market-level competitiveness in the healthcare sector in Nepal
Source: Intellecap analysis, 2014
From Figure 18, it is evident that:
Drugs manufacturing and tertiary healthcare are more advanced and organised sub-sectors
and hence are most institutional investment-worthy than other sub-sectors
Drugs import, diagnostic clinics, and secondary healthcare show some degree of organised and
commercial scale activity but have low degree of competitiveness and low ability to take in
private equity capital
Primary healthcare and health data-related ventures show little or no organised activity
Since this report is focused on analysing the market for investments in private healthcare sector, only
sub-sectors that show high to medium activity across all three criteria will be evaluated for a further
deep-dive from this point onwards.
49
Measured as a function of strength of the business model – including margins, brand value, use of technology and modern approaches, access to markets and financial health. Competitiveness is also a function of level of external competition that businesses in the sub-sector face; with overcrowded markets being less competitive.
Dolma Development Fund Page 32
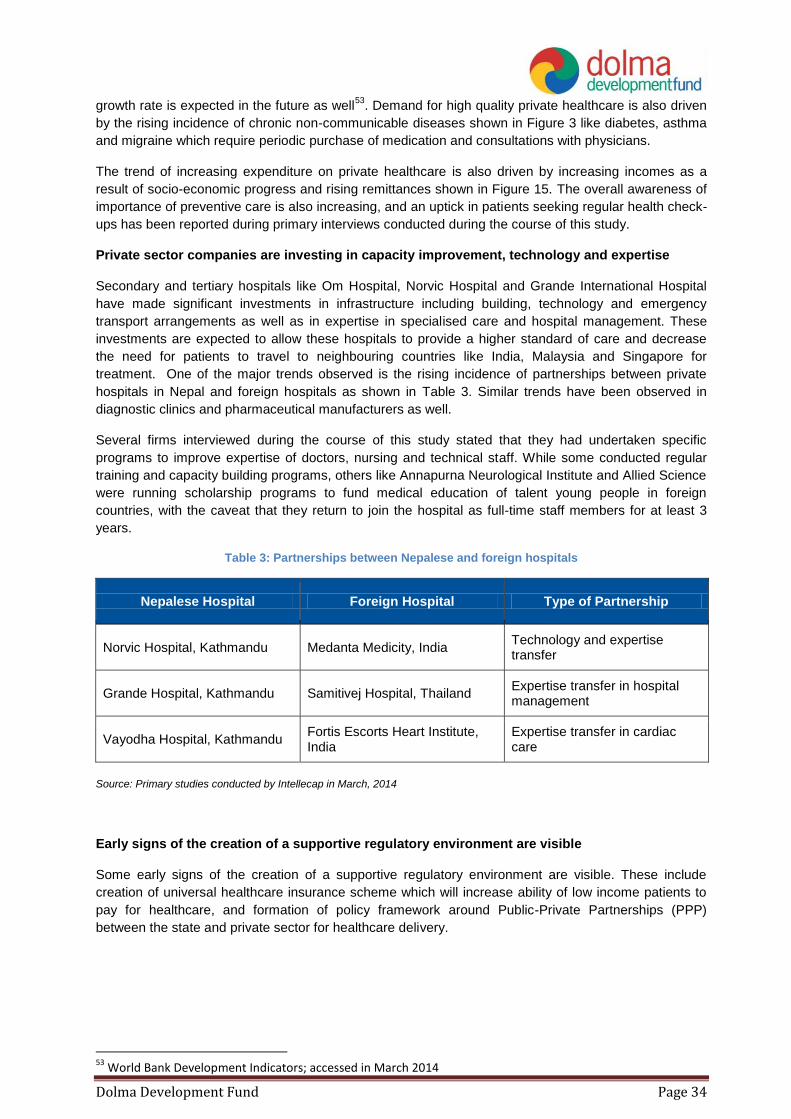
3.3 Market Opportunity in the Healthcare Sector
Market opportunity in private healthcare in Nepal is largely driven by out-of-pocket private
expenditure
The private healthcare sector in Nepal is primary driven by out-of-pocket private expenditure since
health insurance coverage is low. As a result, 90.4% of private healthcare expenditure originates from
out-of-pocket household spending, and this constituted a total of US$ 570 million in 201150
. The
government estimates that 48% of this expenditure in incurred in purchasing medicines and other
pharmaceutical products51
as shown in Figure 19.
Figure 19: Distribution of out-of-pocket expenditure on healthcare in Nepal
Source: Government of Nepal, Ministry of Finance, Nepal National Health Accounts 2003/04 to 2005/06
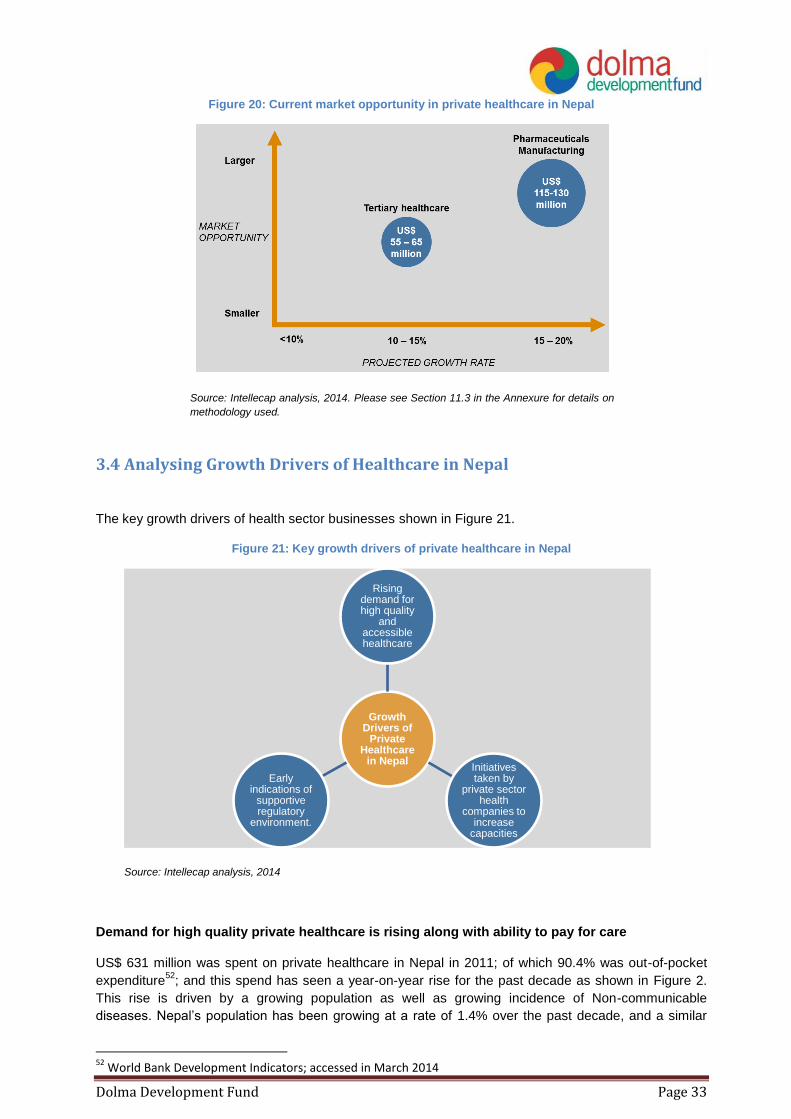
Tertiary healthcare and pharmaceutical manufacturing have a combined market opportunity of
US$ 170 to 200 million in Nepal as shown in Figure 20.
Companies operating in tertiary healthcare and pharmaceutical manufacturing have significant market
sizes and are reported to be growing at rates to 10 to 15% and 15 to 20% respectively, largely driven by
growing domestic demand as a result of shifting disease burden. Promoters and management teams in
these segments have also demonstrated more market-savviness by investing in improving capacities
and forging partnerships with foreign entities for technology and knowledge transfer. Since these firms
make comparatively larger investments in technology, infrastructure, and skilled talent; they are more
likely to meet basic criteria for private equity investment-readiness.
50
World Bank Development Indicators database, accessed in May 2014 51
Government of Nepal, Ministry of Finance, Nepal National Health Accounts 2003/04 to 2005/06
12. Permission for Foreign Investment & Technology Transfer
13. Registration of cooperatives
14. Registration of institutions
15. Trademark Registration
16. Value Added Tax (VAT) Registration
Source: Nepal Business Licence e-portal
4.2 Taxation and Royalties Framework in Healthcare
The private healthcare industry in Nepal has very few tax and subsidy incentives, and given the
difficult nature of business, this can drive up prices for end consumers making healthcare
services unaffordable
Nepal currently does not offer significant regulatory incentives for private sector to enter healthcare
market. Other developing countries often have specific incentives for private healthcare companies
such as tax breaks for a certain period of time, subsidised land, and relaxation on import duties. For
instance in India, the government provides free land for 99 years to private hospitals in underserved
areas, has relaxed import duties for several hospital projects, and does not tax revenues of hospitals
with more than 100 beds for the first 5 years of their operations. The regulatory regime in Nepal could
consider bringing in some strategic incentives that support the growth of private healthcare companies
while at the same time do not distort the market.
Private tertiary hospitals and pharmaceutical manufacturers follow the same tax structure, and
are not given any significant tax breaks
Private tertiary hospitals and pharmaceutical manufacturers follow a standard corporate tax structure as
described in Table 5, and pay a statutory corporate income tax of 25% in addition to other taxes and
duties.
Table 5: Taxation structure for healthcare business in Nepal
Element Statutory Tax Rate Comments
Corporate income tax 25% Percentage of taxable profit
Employer – paid social security 10% Percentage of gross salaries
Dolma Development Fund Page 40
Element Statutory Tax Rate Comments
contributions
Taxes on vehicles ~ US$ 260 Fixed rate
Municipal business tax ~ US$ 100 Fixed rate
Tax on interest 15% Percentage of interest income
Property tax Various rates Depends on land value
Capital gains tax 20% Percentage of capital gains
Stamp duty on financial contracts Various rates
Health Service Tax61
5% Percentage of taxable profit
Source: World Bank, Doing Business Report, 2013; and Inland Revenue Department, Nepal, 2014
4.3 Impact of Regulations on Enterprise Operations and Value The regulatory regime for healthcare in Nepal is progressive and follows several international best
practices to drive positive healthcare outcomes for the general population62
; however there are few
policies that also directly create a positive impact on enterprise value and operations.
Operations of private tertiary hospitals and pharmaceutical manufacturers are positively
impacted by - (a) regulation allowing mergers of private hospitals, and (b) a few subsidies and
incentives that result in cost savings for private companies
The government is encouraging consolidation in the healthcare space and has created guidelines
to enable merger of private hospitals as part of the “Directives on Establishment, Operation and
Upgrading of Health Institute 2013”. The intended beneficiaries of this regulation include medium-sized
tertiary hospitals that are seeking to upgrade and scale; and have complementary services. Secondary
hospitals that seek to diversify into tertiary care but lack access to finance and know-how can also
benefit from this scheme. While private sector hospitals can benefit from this regulation by increasing
their value and driving efficiency in operations; there may be need for specialised M&A advisory
services since the regulation is not clear on use of infrastructure like hospitals beds and human
resource restructuring.
A few subsidy schemes are currently applicable to private hospitals and pharmaceutical
manufacturers in Nepal. These subsidies may be leveraged to decrease operational expenses and
reap tax breaks from diversification of manufacturing capacities as shown in Table 6. Some promoters
of private healthcare companies interviewed during the course of this study indicated that the
implementation of these policies has been weak, and even when implemented they do not result in
significant decrease in operational expenditure or capital investments in setting up and scaling up a
private healthcare company.
Table 6: Subsidies and incentives available to private healthcare companies in Nepal
S.No Subsidy or Incentive
Applicability
Pharmaceutical manufacturers
Private tertiary hospitals
1 Private hospitals can claim import-duty relaxation (payment of only 1% of value of
61
Health service tax is relaxed for private healthcare companies that register for Value-Added Tax (VAT) 62
As described in Section 4
Dolma Development Fund Page 41
S.No Subsidy or Incentive
Applicability
Pharmaceutical manufacturers
Private tertiary hospitals
commodity) for importing specialised vehicles like ambulances and mortuary transportation
2 Private healthcare companies that register for VAT do not need to pay Health Service Tax of 5%
3 VAT is exempted for raw material and packaging material used by pharmaceutical industries
4
Pharmaceutical manufacturers that diversify through reinvestment in the same or any other industry, or expand installed capacity by 25% or more, modernise technology or develop ancillary industries, shall be entitled to a deduction of 40% of new additional fixed assets from their taxable income
5 As National Priority Industries, pharmaceutical manufacturers and tertiary hospitals can claim income tax relaxation of up to 2 years
6
National Health Insurance Policy 2013 allows for private sector hospitals to be empanelled as healthcare providers under this scheme, and services they provide to low income people will be fully or partially paid for out of the National Health Insurance Fund. This will allow private hospitals and facilities to also serve lower income segments.
7 Aama Suraksha Policy subsidises part or complete costs of healthcare provided for childbirth
Source: Nepal Financial Budget 2013-14; Supreme Court of Nepal – Industrial Enterprises Act; and Intellecap Analysis 2014
5. Foreign Investment Policy in Healthcare in Nepal
The government is supportive of foreign investments in healthcare sector, and allows 100% FDI
in all private healthcare companies
The government allows and encourages Foreign Direct Investments (FDI) with 100% ownership in all
areas of healthcare in Nepal. As a result of this positive environment, significant foreign investments
have been observed in the past 2-3 years, especially in private tertiary hospitals.
FDI in private healthcare companies has been growing at a CAGR of 45% since 2009 Over US$ 18.34 million in foreign investments have been channelled into healthcare from over 12
countries since 200963
. Aside from promoters’ own equity, this is the single largest source of risk capital
available to the private healthcare segment in Nepal today. FDI in this sector has been growing at a
CAGR of 45%, and top contributors have been India, Turkey and China64
. India has been the key
source of FDI since 2011 as shown in Figure 24.
63
Ministry of Industries, Industrial Statistics Report, Nepal, 2012-13 64
Ministry of Industries, Industrial Statistics Report, Nepal, 2012-13
Dolma Development Fund Page 42
Figure 24: Growth of FDI in healthcare in Nepal
.
Source: Ministry of Industries, Industrial Statistics Report, Nepal, 2012-13
Over 81% of FDI in healthcare sector has been channelled into hospitals
Cumulative capital flows in healthcare since 2009 indicate a strong bias towards hospitals in Nepal as
shown in Figure 25. The Department of Industries reported 16 foreign investments in Nepalese
hospitals during this time; of which 7 are traditional medicine hospitals (Chinese and Ayurvedic) and 1 is
a palliative care facility. 10 of 16 investments were structured as 100% holding by foreign investors65
.
While details of all hospitals like names and locations were not released in the reports, Chitwan Medical
College was specifically mentioned as a Nepalese hospital that has raised investment from an Indian
and a Nepalese individual for a 17.4% foreign equity stake.
US$ 2.9 million has also been channelled into 6 pharmaceutical companies, of which half produce
traditional or herbal medications and products; and another US$ 0.54 million has been invested in
diagnostic companies66
.
Figure 25: Distribution of healthcare FDI inflow across different sub-sectors
Source: Ministry of Industries, Industrial Statistics Report, Nepal, 2012-13
65
Ministry of Industries, Industrial Statistics Report, Nepal, 2012-13 66
Ministry of Industries, Industrial Statistics Report, Nepal, 2012-13
0.25
1.07 1.42
10.69
4.91
0
2
4
6
8
10
12
2009 2010 2011 2012 2013
India Turkey China Others Total FDI in healthcare
81%
16%
3%
Hospital Phamaceutical company Diagnostic company
Dolma Development Fund Page 43
JVs with foreign healthcare companies can help domestic healthcare companies not only access financial but also technical assistance, and hence scale faster Increased inflows of foreign investments can serve to catalyse growth of the healthcare sector and help
to provide state-of-the-art care in Nepal itself. This would bring down the incidence of people traveling
to foreign countries for treatment, who represent an annual market opportunity of US$ 15 to 20 million
in healthcare that is lost to foreign countries each year. This market can instead be captured by
domestic hospitals if they tie-up with foreign hospitals and provide the same standard of treatment in
Nepal.67
Aside from financial contribution to firms, foreign firms that form JVs with domestic companies
are beneficial in bringing in expertise in the form of technology and processes, management best-
practices. They also serve to add to credibility of Nepalese hospitals since many people who travel
abroad to countries like India and Thailand for care seek out these very same hospitals for treatment68
.
This strategy has been successfully implemented by leading private tertiary hospitals in Nepal as shown
in Table 3.
6. Investment Opportunities
Based on the firm-level competitiveness demonstrated by various healthcare sector business models,
and the market opportunity for their services in Nepal; investment opportunities in the sector can be
divided into viable, emerging and unviable as shown in Figure 26.
Firm-level competitiveness can be measured as a function of strength of the healthcare business model
– including margins, brand value, use of technology and modern approaches, access to markets and
financial health. Competitiveness is also a function of level of external competition that businesses in
the sub-sector face; with overcrowded markets being less competitive. On the other hand, the market
opportunity for each business has been estimated based on insights from practitioners interviewed
during the course of this study, and the distribution of out-of-pocket private expenditure on healthcare
as shown in Figure 20.
Figure 26: Comparison of private equity investment opportunities in healthcare in Nepal
Source: Intellecap analysis, 2014
67
15,000 people travel abroad for medical care from Nepal each year as per Nepal Tourism Statistics 2012 (published by Ministry of Culture, Tourism & Civil Aviation); assuming that they undergo surgery at a cost of US$ 1000 and spend another US$ 350 to 500 on in-patient care for a week. 68
See Table 3 for details
Dolma Development Fund Page 44
Based on the analysis in Figure 26, the investment opportunities for private equity investors in
healthcare in Nepal can broadly be categorised on the basis of currently viable, emerging, and non-
opportunities as shown in Figure 27. In addition to these, investors may also benefit from being
cognisant of high potential healthcare models that have been successful in other developing countries
of South Asia, but are not currently present in Nepal. Such models are bound to eventually make their
way into Nepal by organic and inorganic means; and when they do they would also be considered
emerging investment opportunities.
Figure 27: Categorisation of private equity investment opportunities in healthcare in Nepal
Source: Intellecap analysis, 2014
Currently viable investment opportunities exist in tertiary hospitals and pharmaceutical
manufacturers as shown in Figure 26; with investments in tertiary care emerging as most
attractive
These businesses demonstrate high level of organised and commercial-scale activity; high degree of
competitiveness; and the ability to take in large sums of private equity capital with preference for
minority stake investments as discussed in Section 3.2.
The different dimensions used to compare “attractiveness” of these businesses included current state of
consumer demand; and degree of “competitiveness” demonstrated by these firms. Competitiveness
was measured as a function of strength of the business model – including margins, brand value, use of
technology and modern approaches, access to markets and financial health. Competitiveness is also a
function of level of competition from foreign companies that businesses in each of these sub-sectors
face.
Based on this analysis, Tertiary healthcare is found to be more attractive as it has good level of
competitiveness and high consumer demand. With increasing out-of-pocket private expenditure, foreign
travel for medical treatment purposes and emergence of chronic NCDs requiring frequent care – these
hospitals are well set to provide an important service and continue their growth trajectory. Moreover
this market is far from saturated especially in regions outside Kathmandu as indicated in primary
research.
While the domestic pharmaceutical manufacturing industry is also attractive, it currently faces stiff
competition from imported drugs which can retail at lower prices than domestically-manufactured drugs.
Since the end consumer will prefer a cheaper and often better-known brand to a new and more
expensive brand; pharmaceutical manufacturers are focusing on taking steps to address this challenge.
Pharmaceutical companies interviewed during the course of this study reported that they were
increasing production capacities and diversifying range to bring in higher revenues and economies of
scale that allow them to compete effectively with foreign firms. In addition, domestic pharmaceutical
companies are also investing in brand building and quality assurance programs to grow customer trust;
and invest in building distributor networks for improved access to customers.
Emerging opportunities with future potential can be explored in medical consumables and tools
companies, chains of diagnostic centres, and chains of polyclinics and primary health clinics
Dolma Development Fund Page 45
Nepal imports over US$ 50 million worth of medical consumables and tools each year. In the absence
of a domestic manufacturing industry catering to this demand; hospitals and clinics are forced to import
supplies. However, given the abundance of raw material cotton linters used in manufacture of
bandages, and the relatively less advanced manufacturing infrastructure needed to manufacture many
medical consumables and tools, it is likely that this industry will gain traction over the next few years in
Nepal. With 3 oxygen cylinder manufacturing firms being set up in the past 2-3 years, early signs of this
traction can already be seen69
.
Similarly, chains of diagnostic clinics and chains of polyclinics or primary healthcare centres are also
emerging as attractive investment opportunities in Nepal. Unlike stand-alone centres, such chains can
leverage economies of scale to overcome the challenges of operating in a fragmented market; and
have enough asset base and revenue levels to be able to absorb significant private equity capital as
minority stakes.
Stand-alone diagnostics centres, stand-alone primary health clinics, and pharmaceutical
importers fall under “non-opportunities” for private equity investors due to inherent business
model weaknesses
These businesses operate in fragmented nature of markets and have little or no differentiation in
business models, as a result of which they compete based on prices and can have low margins. They
are also not suitable for private equity investments structured as minority stakes due to low fixed capital
investments.
High potential but currently absent opportunities exist in Emergency Healthcare Services (EHS)
and telemedicine
While these business models in EHS and telemedicine currently do not exist in Nepal, it is expected
they will emerge in the medium to long term due to high demand from the domestic market. Nepal has a
high incidence of morbidity due to accidents (road injuries are the 11th highest cause of DALYs; with
incidence increasing by nearly 20% since 199070
) and is also prone to natural disasters like
earthquakes and landslides. Frequent Injuries during adventure sports also build upon the case for
these services in the backdrop of Nepal being a popular adventure tourism destination.
As a result, there is a need for an EHS service which is dependable, easily accessible and affordable.
Further, aside from road-transport based EHS, only few tertiary hospitals like Vayodha provide
emergency airlifting services with helipad built in the hospital premises, however there could be need of
organised and specialised emergency services in near future. In the absence of government
intervention in this area; the country may turn to a PPP or private model for this service. Likewise, due
to tough terrain and lack of physical healthcare infrastructure outside larger cities and towns;
telemedicine delivered through PPP or private channels could create affordable and accessible
healthcare in rural and far-flung areas.
6.1 Currently Viable Investment Opportunities
Tertiary hospitals and pharmaceutical manufacturing are currently viable and attractive opportunities for
private equity investors in Nepal. A similar trend has been observed in the neighbouring country of
India, where healthcare delivery and pharmaceutical segments account for 60% of total private
healthcare sector revenues and make up more than 50% of private equity deals in healthcare71
.
69
Ministry of Industries, Industrial Statistics Report, Nepal, 2012-13 70
Institute for Health Metrics and Evaluation, Global Disease Burden Profile: Nepal, 2010 71
Bain and Company Inc., India Private Equity Report, 2013
Dolma Development Fund Page 46
6.1.1 Tertiary Hospitals
Tertiary hospitals in Nepal cater to growing demand for specialised healthcare
The market opportunity in tertiary care is estimated at US$ 55 to 65 million, and this market is projected
to be growing at 10 to 15% per annum72
as a result of the growing population and increasing incidence
of NCDs; as well as improving ability to pay for high quality healthcare.
Of the 300-350 private sector hospitals in Nepal, which include secondary and tertiary hospitals, it is
difficult to gauge no of tertiary hospitals in the absence of reliable data73
. However, industry
practitioners interviewed during the course of this study reported that there are over 15 tertiary hospitals
in the country and of these only 4-5 would be considered as major private players in this segment.
Some of the top tertiary hospitals by bed-size and turnover include Grande International, Norvic
Hospital, Vayodha Hospital, Om Hospital, and Baidya and Banskota Hospital. Most private tertiary
hospitals have an average of 50 beds; while the larger tertiary hospitals have over 100 beds. Aside from
pure-play private tertiary hospitals; Nepal also has some large teaching hospitals like Chitwan Medical
College which runs a recognised medical degree for batches of 140 MBBS students each year and also
has a 700-bedded tertiary hospital facility74
.
For pure-play hospitals, the average revenue ranges from US$ 150,000 to 200,000 and profit margins
from 20 to 30%. The key cost-drivers and revenue-drivers have been summarised in Figure 28.
Figure 28: Key revenue and cost drivers of tertiary hospitals in Nepal
Source: Intellecap analysis, 2014
The capital investment needed to set-up a 50-bedded hospital range from US$ 4 to 7 million; while the
cost of setting up a larger 200 to 300-bedded hospital range from US$ 15 to 20 million in Nepal. As
observed in most infrastructure-related projects in the country; land is expensive and is a key cost
centre along with building and equipment costs. Tertiary hospitals with sound business fundamentals
are expected to break-even in 5 to 7 years75
. While specific data on project cost structure and key
metrics for a tertiary hospital business model from Nepal was not readily available, data from an
emerging market like India shown in Figure 29 and Table 7 may be used as a broad indicator.
72
Intellecap analysis, 2014. See Section 3.3 for details. 73
Government and MoHP sources state that there 300 to 350 private hospitals in Nepal; but this figure includes secondary and tertiary hospitals 74
Nepal Industrial Statistics, 2012-2013 75
Intellecap analysis, 2014. Based upon primary data collected from Nepal in May 2014; see Annexure for list of interviewees.
Key Revenue Drivers
• In-patient hospital beds (general and intensive-care)
• Out-patient consultation fee
• Diagnostic lab
• Operation theatre
• Pharmacy
Key Cost
Drivers
• Salaries for doctors, nurses and other technical staff
• Building and equipment maintenance
• Taxes, royalties and license fee
Dolma Development Fund Page 47
Figure 29: Typical project cost-break up of a tertiary hospital in India
Source: Spark Capital Research, 2013. Note: Tier I cities are largest metropolitan cities in India including the capital Delhi and important commercial hubs like Mumbai and Bengaluru. Tier II cities include state capitals and regional hubs. Tier III cities are less than a million in population and just starting to show early signs of urbanisation. Tier II and III cities are better comparables for Nepal than Tier I cities.
Table 7: Typical tertiary hospital business metrics in India
Business Metric Typical Benchmarks from India
Number of beds 300
Project cost per bed ~US$ 135,000
Occupancy rate (bed days billed/bed days available) 70% to 80%
Average length of stay per patient 3.5 to 4.8 days
Average operating revenue per bed per day US$ 528
EBIDTA US$ 13.9 million
EBIDTA margin 30%
PAT margin 13%
Source: Spark Capital Research, 2013. Assumes a 300-bed tertiary hospital in a tier-I city (defined as one of the 6 largest
cities in India). Metrics are from year 6 of operations, assuming a steady-state has been reached. Exchange rate used
was US$ 1 = 59.18 Indian Rupee.
Tertiary hospitals are largely concentrated in Kathmandu; with hardly any outreach to rural and
far-flung areas
The four largest tertiary hospitals by bed size and turnover are located in Kathmandu, as are most of
the smaller tertiary hospitals. A few private tertiary hospitals have come up in Pokhara as well, but the
infrastructure outside these two cities is inadequate indicating an opportunity to extend existing tertiary
hospitals and build new healthcare centres in these areas.
Several large tertiary hospitals in Nepal are entering into partnerships with foreign hospitals for
technology and knowledge transfer
There has been a trend of tie-ups and partnerships with foreign hospitals as shown in Table 3. Such tie-
ups are creating access to management best-practices; know-how in new technology and practices;
and access to world-class equipment. At the moment, most of these tie-ups do not involve an
Dolma Development Fund Page 48
investment from the foreign hospital since promoters of private tertiary hospitals are still apprehensive
about the comparative benefits of foreign equity capital and fear losing control of their business to a
private investor. The top four hospitals Grande, Norvic, Vayodha, and Om are considered “trend-
setters” in the tertiary hospital segment; with several existing and new players watching their
partnerships with foreign hospitals including any potential JVs with interest76
. Once a few cases of
foreign hospital-Nepalese hospital JVs emerge and are documented in the public domain, the trend is
expected to see an uptick.
While most tertiary hospitals are multi-specialty in nature, it is expected that single-specialty
tertiary hospitals may begin to emerge in the medium to long term
At the current stage of the industry’s growth cycle, most of the existing and new hospital projects are
multi-specialty facilities offering a range of specialties like cardiology, emergency services and trauma
care, orthopaedics, nephrology, obstetrics and gynaecology (including infertility), and neurology.
However as the industry matures and the multi-specialty space becomes saturated over the medium to
long term; it is expected that single-specialty hospitals focused on eye care, dental care, cosmetic
surgery, oncology and cardiac care may begin to emerge77
.
The business models of tertiary hospitals show low degree of differentiation; indicating the need
to bring in more innovation in service design and delivery
Currently, the business models of most tertiary hospitals show little or no differentiation. This could be a
challenge as the segment grows and newer players enter the market. One of the key drivers behind this
trend is the fact that most tertiary hospitals are founded by groups of doctors, who play dual-roles as the
key medical and key management staff. This tends to limit availability of management bandwidth for
focus on business strategies and goals. Norvic and Vayodha are among the few private tertiary
hospitals with distinct senior leadership for management and medical services, a strategy that has been
a key driver of their growth.
In the medium to long term, tertiary hospitals will benefit from differentiating their business models and
building strong Unique Selling Propositions (USPs). From the growth of private healthcare industry in a
comparable market like India, some ways to differentiate include extending infrastructure to smaller
towns and cities through physical and mobile clinics (also called a hub-and-spoke model), and driving
vertical integration to bring diagnostics and pharmaceutical services in-house78
. Another key USP that
private tertiary hospitals can bring in is internationally recognised quality certification79
; which would go
a long way towards building trust among end consumers.
76
Intellecap analysis, 2014; derived from primary data collected in Nepal in May 2014. See annexure for list of interviewees. 77
Intellecap analysis, 2014; derived from primary data collected in Nepal in May 2014. See annexure for list of interviewees. 78
Intellecap analysis, 2014 79
For instance, Indian private hospitals are accredited by the National Accreditation Board for Hospitals & Healthcare Providers (NABH), which is a constituent board of Quality Council of India, set up to establish and operate accreditation programme for healthcare organisations
Dolma Development Fund Page 49
The key investment opportunities in tertiary hospitals include improving quality of current
facilities, vertical integration and expansion as summarised in Figure 30.
Figure 30: Private equity investment opportunities in tertiary healthcare
Source: Intellecap analysis, 2014
Equity investments to support expansion initiatives of existing tertiary healthcare players is an
especially lucrative opportunity in the next 1-2 years
Driven by lucrative margins and high demand, several existing tertiary healthcare players are
considering expansion by increasing capacity of their current facilities, as well as building new facilities
in locations other than Kathmandu city80
. Promoters of such tertiary hospitals can build upon past
experiences, leverage relationships with suppliers and other partners, and have existing brand
awareness. As a result these can be lucrative investment opportunities for private equity investors.
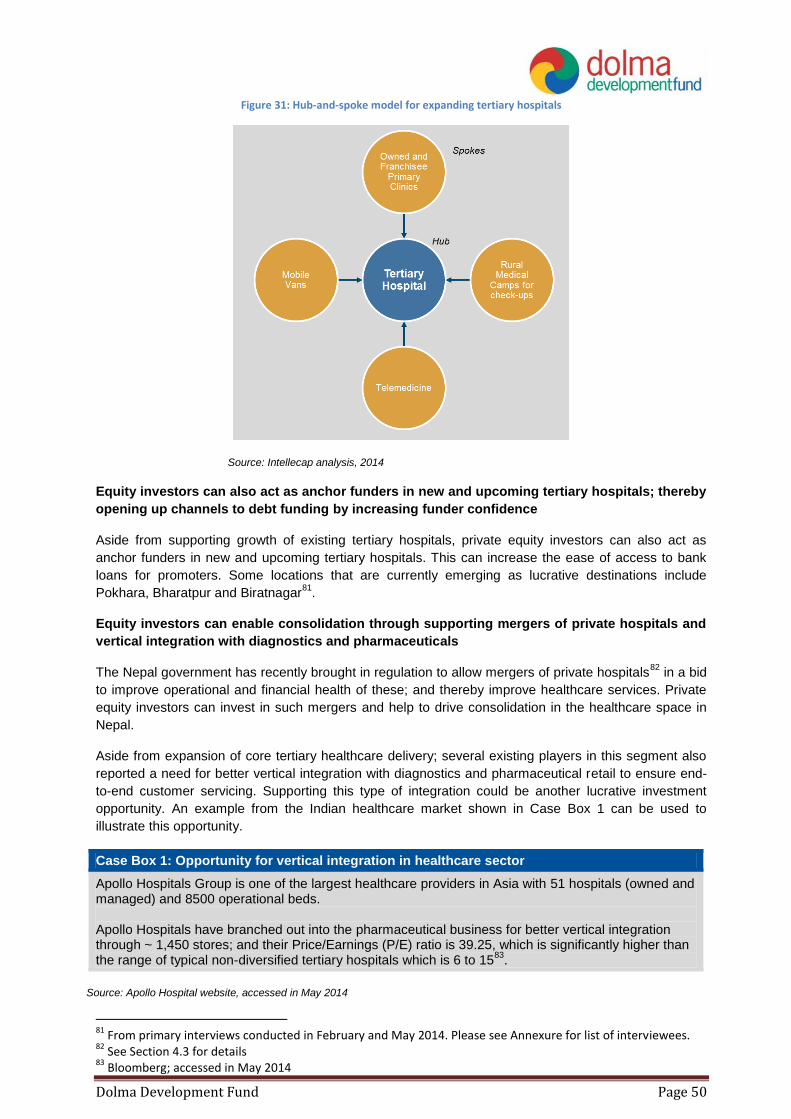
In addition to these, investments in increasing outreach of tertiary hospitals through hub-and-spoke
expansion models can also be evaluated. In such a model, the main tertiary hospital infrastructure acts
as the “hub”; and smaller asset-light primary clinics and mobile vans that can easily reach out to end
consumers in smaller towns and villages and in remote locations act as “spokes”. The “spokes” serve
the purpose of early diagnosis and less-intensive consultations, and refer patients needing more
advanced consultations, diagnosis, surgery or in-patient care to the “hub” as shown in Figure 31. This
model has been effectively deployed by private healthcare companies in India including single-specialty
tertiary hospitals (like Aravind Eye Care and L.V. Prasad Eye Hospital); as well as multi-specialty
hospitals (like Apollo Hospital).
80
From primary interviews conducted in February and May 2014. Please see Annexure for list of interviewees.
Dolma Development Fund Page 50
Figure 31: Hub-and-spoke model for expanding tertiary hospitals
Source: Intellecap analysis, 2014
Equity investors can also act as anchor funders in new and upcoming tertiary hospitals; thereby
opening up channels to debt funding by increasing funder confidence
Aside from supporting growth of existing tertiary hospitals, private equity investors can also act as
anchor funders in new and upcoming tertiary hospitals. This can increase the ease of access to bank
loans for promoters. Some locations that are currently emerging as lucrative destinations include
Pokhara, Bharatpur and Biratnagar81
.
Equity investors can enable consolidation through supporting mergers of private hospitals and
vertical integration with diagnostics and pharmaceuticals
The Nepal government has recently brought in regulation to allow mergers of private hospitals82
in a bid
to improve operational and financial health of these; and thereby improve healthcare services. Private
equity investors can invest in such mergers and help to drive consolidation in the healthcare space in
Nepal.
Aside from expansion of core tertiary healthcare delivery; several existing players in this segment also
reported a need for better vertical integration with diagnostics and pharmaceutical retail to ensure end-
to-end customer servicing. Supporting this type of integration could be another lucrative investment
opportunity. An example from the Indian healthcare market shown in Case Box 1 can be used to
illustrate this opportunity.
Case Box 1: Opportunity for vertical integration in healthcare sector
Apollo Hospitals Group is one of the largest healthcare providers in Asia with 51 hospitals (owned and managed) and 8500 operational beds. Apollo Hospitals have branched out into the pharmaceutical business for better vertical integration through ~ 1,450 stores; and their Price/Earnings (P/E) ratio is 39.25, which is significantly higher than the range of typical non-diversified tertiary hospitals which is 6 to 15
83.
Source: Apollo Hospital website, accessed in May 2014
81
From primary interviews conducted in February and May 2014. Please see Annexure for list of interviewees. 82
See Section 4.3 for details 83
Bloomberg; accessed in May 2014
Dolma Development Fund Page 51
Investments made in improving technology, processes and manpower for improved healthcare
outcomes can also be driven by private equity investors
Even though the tertiary healthcare segment has made strides in terms of usage of more advanced
technology, modern processes and skilled manpower – the segment still has a long way to go in
matching international standards. Such improvements would be especially useful in the smaller tertiary
hospitals; and will serve to improve the overall healthcare outcomes for consumers served by private
tertiary hospitals.
Investments in new technology can include machinery that provides more precise care to diseased
organs/areas and reduces collateral impact; machinery for super-specialised diagnosis, monitoring and
care; and machinery that decreases cost of healthcare delivery. Investments in processes can include
Standard Operating Procedures to decrease emergency response time, rate of hospital-acquired
(nosocomial84
) infections, and increase overall quality of service for end consumers. While many
hospitals focus on investments in training doctors, nurses and technical staff; investments in managerial
talent and building strong second line of leadership are also needed to make private tertiary hospitals
more sustainable in the long run.
Key success factors and challenges that investors in tertiary hospital segment in Nepal should
be cognisant of are summarised in Figure 32.
Figure 32: Key success factors and challenges in tertiary hospitals in Nepal
Source: Intellecap analysis, 2014
Some key success factors that investors can use to evaluate the attractiveness of tertiary
hospitals include:
Right location of the hospital is a very important success factor: The key factors that determine
location are (a) accessibility for a wide variety of end consumers, (b) does not face high degree
of competition from other hospitals, and (c) presence of supporting services such as diagnostics
and pharmacies in the vicinity. At the same time, promoters should display savviness in land
acquisition since the high cost of land in prime locations can impact overall business viability
Use of modern technology and processes; especially through tie-ups with foreign hospitals is
another critical success factor that investors can use to evaluate attractiveness of tertiary
hospitals
Since only the larger tertiary hospitals have in-house diagnostics and pharmaceutical wings, it
is also critical for hospitals that don’t have these in-house services to have tie-ups in place to
access such allied services
Managerial strength is another key success factor; especially in terms of senior management
skill set and strategies used to divide responsibilities between teams overseeing core medical
services and teams overseeing business operations of the hospital
84
An infection acquired during a hospital visit; commonly transmitted due to lack of staff and building hygiene protocols which results in transmission of infectious diseases – as defined by Centre of Disease Control and Prevention, U.S.A.
Key Success Factors
•Location
•Access to technology, know-how and expertise
•Managerial strength
•Quality assurance processes and certification
Key Challenges
•Delay in expansion initiatives
•Rising land prices
•Low availability of talent
• Inefficient management structures with overlap of technical and business responsibilities
Dolma Development Fund Page 52
Only a few hospitals have invested in infrastructure and processes for maintaining quality
standards; and this is a key factor in keeping hospital-acquired infections low, increasing
accuracy of care services, and building trust among end consumers
Some key risks and challenges that investors in tertiary hospitals in Nepal should be cognisant
of include:
Delays in expansion initiatives; especially those contingent upon land acquisition and building
construction
Rising land prices, especially in urban centres like Kathmandu and Pokhara which have a direct
impact on project viability
Low availability of talent, which causes difficulty in hiring and retaining technical staff like
doctors and nurses
Low distinction between hospital management and medical service delivery roles; leading to
limited bandwidth of senior leaders for focus on strategic initiatives
6.1.2 Pharmaceutical Manufacturers
Domestic pharmaceutical manufacturers play a key role in preventive and curative healthcare;
and are growing rapidly and decreasing Nepal‟s reliance on imported pharmaceuticals
The market opportunity in pharmaceuticals is estimated at US$ 115 to 130 million, and this market is
projected to be growing at 15 to 20% per annum85
. Similar to tertiary hospitals, this market is also driven
by growing population and increasing incidence of NCDs; as well as improving ability to pay for high
quality drugs.
There are 45 registered private pharmaceutical manufacturers in Nepal and together they hold 42% of
the total market share by value86
as shown in Figure 33. Another 4-5 manufacturers are expected to
launch operations in the short term. These manufacturers import APIs from India and other countries,
and follow formulation policies laid down by the DDA to manufacture pharmaceuticals locally. Top 10
manufacturers control over 60% to 70% of the market. The largest manufacturers by capacity and
turnover are Nepal Pharmaceuticals Laboratory, National Healthcare, Asian Pharmaceuticals, and
Lomus Pharmaceuticals87
.
85
Intellecap analysis, 2014. See Section 3.3 for details. 86
Nepal Pharmaceutical Profile; WHO and MoHP; 2011 87
From primary interviews conducted in February and May 2014. Please see Annexure for list of interviewees.
Dolma Development Fund Page 53
Figure 33: Pharmaceutical market share of imported drugs and domestically manufactured drugs purchased by end consumers in Nepal
Source: Association of Pharmaceutical Producers Nepal, 2012 and Intellecap analysis from
primary interviews conducted during the course of this study in February and May 2014. Does not
include donated drugs distributed free-of-cost by government and philanthropic organisations.
Domestic pharmaceutical manufacturers are growing rapidly and consequently decreasing Nepal’s
dependence on imported pharmaceuticals as shown in Figure 10. Import of processed drugs has fallen
by over 80% since 200988
. While sufficient data on the exact cost structure and margins of
pharmaceutical manufacturers in Nepal was not available, comparable examples of listed
pharmaceutical manufacturers from other developing countries like India, Bangladesh and Pakistan
shown in Table 8 may be used as broad indicators.
Table 8: Revenues and margins of listed pharmaceutical manufacturers in comparable countries
Company Revenue (US$ million)
EBIDTA (US$ million)
EBIDTA margin
India
Ipca Labs 518.10 118.30 23%
Torrent Pharma 591.40 135.40 23%
Dr. Reddys 2,128.20 475.50 22%
Bangladesh
Square Pharmaceuticals Ltd 258.50 77.60 30%
Beximco Pharma 116.60 33.90 29%
Pakistan
Ferozsons Laboratories 28.90 6.41 22%
Highnoon Laboratories 25.40 2.87 11%
Source: Capital IQ, Bloomberg and MoneyControl databases, accessed in March 2014
Pharmaceutical manufacturers currently produce both “over-the-counter” and prescriptions
drugs; and 80 to 90% of drugs retailed are branded drugs
Most manufacturers are operationally organised along two business verticals – manufacture of
prescription drugs and over-the-counter drugs. These include ingestible, injectable, topical, and aerosol-
based drugs. No pharmaceutical company has registered a patent in Nepal yet, due to the relatively
nascent stage of the industry89
.
88
Trade and Export Promotion Centre, Nepal, database accessed in February 2014 89
Nepal Pharmaceutical Profile; WHO and MoHP; 2011
55%
45%
Imported Drugs Domestically Manufactured Drugs
Dolma Development Fund Page 54
Two major types of drug testing are done in pharmaceutical manufacturing – in-vitro (lab-based) testing
which can often require advanced technology; and in-vivo (human) testing which requires access to a
pool of volunteers, stringent adherence to established practices, and remuneration of US$ 10,000 to
11,000 per volunteer90
per drug. More and more pharmaceutical manufacturers are shifting to in-vivo
testing in order to meet international standards, as well as build trust amongst the doctor community
who are primary determinants of end consumer choice in drugs.
While accurate financial information was not readily available; margins and revenue predictability are
higher for chronic prescription drugs. Such chronic drugs account for 40 to 50% of total production.
At the pharmaceutical-retail stage; over 80 to 90% of drugs sold are branded and the remainder are
generic drugs91
. This skew can be attributed to a bias towards branded drugs at the “prescription stage”
and lower awareness about generic drugs at the end consumer level. Doctors tend to prescribe
branded drugs to mitigate the risk of patient exposure to spurious drugs; though there are some
unconfirmed reports that this bias could also be due to incentives from branded drug manufacturers and
importers92
. Further, substitution of generic equivalents at the point of dispensing is not allowed in
public or private facilities in Nepal, and regulations dictate that doctors’ prescription be followed
completely to dispense drugs93
.
Shifting from branded drugs to generic drugs can bring down overall cost of healthcare in Nepal
Pharmaceutical expenditure accounts for 67% of the total healthcare expenditure in Nepal94
. This
component can be decreased by promoting production, prescription and retail of generic drugs in the
country. The U.S. Food and Drug Administration defines a generic drug as "a drug product that is
comparable to brand/reference listed drug product in dosage form, strength, route of administration,
quality and performance characteristics, and intended use". Such drugs are typically manufactured
once a branded drug patent expires. Since firms that manufacture generics do not take up the huge
expenditure involved in R&D, testing and release of a drug; they are able to produce and retail generic
drugs at cheaper prices than branded drugs. For instance, generic drugs in India tend to be 40 to 60%
cheaper than branded drugs95
.
The pharmaceutical manufacturing sector faces 3 critical challenges to long term growth and
sustainability as shown in Figure 34.
Figure 34: Challenges faced by pharmaceutical manufacturers in Nepal
Source: Intellecap analysis, 2014
90
From primary interviews conducted in February and May 2014. Please see Annexure for list of interviewees. 91
A prospective surveillance of drug prescribing and dispensing in a teaching hospital in Western Nepal, Ghimire et al., 2008 92
From primary interviews conducted in February and May 2014. Please see Annexure for list of interviewees.
93 Nepal Pharmaceutical Profile; WHO and MoHP; 2011
94 Nepal Pharmaceutical Profile; WHO and MoHP; 2011
95 Generic Drugs: Cost Effective Alternate To Branded Drugs, Dr. G Bakthavathsalam
Dolma Development Fund Page 55
The pharmaceutical sector is still dependent on imports for APIs which can often make drugs
manufactured in Nepal more expensive than imported drugs
Even though the domestic pharmaceutical manufacturing sector is growing and import-reliance on
processed drugs is decreasing; the sector is still import-reliant for inputs like APIs and packaging
material96
. The high import-reliance in APIs is especially a concern since this represents a significant
and growing cost centre. API import has grown at a CAGR of 408% over the past 3 years; growing to
nearly 29x its 2011 value in volume97
as shown in Figure 10.
Over a third of the domestic pharmaceutical industry is lagging behind in quality certification
As per DDA guidelines issued in 2004, all domestic pharmaceutical manufacturers are expected to be
registered under the WHO – Good Manufacturing Practices (GMP) framework, which certifies the
quality of the pharmaceutical product, the manufacturers’ infrastructure, and permits export of the
product. However, 25 to 30% of the domestic firms in Nepal have still not procured this licence owing to
the high cost of up to US$ 26,000 involved in procurement98
.
The industry also faces a growing threat from spurious drugs in the market
Fake or counterfeit drugs include preparations that have less than necessary or no APIs; or are expired
and are not suitable for human consumption. WHO estimates that over US$ 100 billion worth of
counterfeit medicines are sold globally each year; with 25% of the drugs sold in developing markets
falling under this category. These drugs are not a critical threat to patient health outcomes, but also
adversely impact the legitimate drug manufacturing industry in Nepal. While published data on the
incidence and impact of counterfeit drugs in Nepal was unavailable, industry practitioners estimate that
up to half of all drugs sold are sub-standard, expired or fake99
.
This challenge can be mitigated by collaboration of private sector companies with each other and public
sector. Case Box 2 has details of some private sector companies in developing countries that are
tackling this issue. Similar interventions can also be encouraged in Nepal by government and industry
networks like Nepal Pharmaceutical Association to counter spurious drugs.
Case Box 2: Private sector innovations to tackle spurious drugs in developing countries
PharmaSecure (www.pharmasecure.com) For-profit company operating in India and Nigeria; provides SMS-based drug authentication service PharmaSecure works with pharmaceutical companies to print unique, randomly generated codes on medicine packages. These identification codes serve two purposes: First, they allow manufacturers to print and place a security sticker on every medicine strip or package they produce. Each strip has a unique ID that allows manufacturers to track the drug from factory to user via a web-portal.
Second, patients can scratch-off text the identification code to a phone number also printed on the package and instantly verify that the medicine is genuine. In order to incentivise usage by patients and pharmaceutical companies, PharmaSecure also offers value-added mHealth services for user engagement that track and encourage optimal drug usage by end consumers.
Other companies that provide similar services in Asia and Africa include Sproxil (www.sproxil.com) and mpedigree (www.mpedigree.net).
96
Nepal Pharmaceutical Profile; WHO and MoHP; 2011 97
Trade and Export Promotion Centre, Nepal, database accessed in February 2014 98
From primary interviews conducted in February and May 2014. Please see Annexure for list of interviewees. 99
From primary interviews conducted in February and May 2014. Please see Annexure for list of interviewees.
Pharmaceutical manufacturers can use risk capital to improve production infrastructure and
capacities; and improve their distribution networks. These measures will serve to improve
revenues and profitability, and hence benefit private equity investors as well. The key
investment opportunities are summarised in Figure 35.
Figure 35: Private equity investment opportunities in pharmaceutical manufacturing in Nepal
Source: Intellecap analysis, 2014
Pharmaceutical manufacturers can also utilise private equity capital effectively in improving
production infrastructure and quality
Since one-third of pharmaceutical industries are still not WHO-GMP certified, there is a critical need for
investments in improving production infrastructure and quality. These improvements can be achieved
by specifically investing in better production machinery, heating and ventilation systems, water
treatment systems, and drug sampling and testing facilities. Along with infrastructure, the presence of
skilled personnel who can operate and maintain this infrastructure is also critical.
Finally, private equity capital can also be utilised in improving distribution networks to increase
outreach beyond hubs like Kathmandu
Over half of the operational expenses of pharmaceutical manufacturers stem from marketing due to
fragmented and inefficient distribution networks. Pharma-companies market drugs primarily through
Business-to-Business (B2B) model in Nepal; with distributors and traders, pharmacies, hospitals, and
philanthropic programs being the major purchasers. The current system places too much power in the
hands of distributors and traders who often demand high commissions. There is also a trend reported of
foreign pharmaceutical companies that export drugs to Nepal paying higher commissions to distributors
than Nepalese firms, skewing the market in favour of foreign drugs100
.
Hence, pharmaceutical manufacturers can benefit from investments in building stronger partnerships
directly with pharmacies and hospitals; as well as evaluating the costs and benefits of investments in
their own retail chains.
Key success factors and challenges that investors in pharmaceutical manufacturing segment in
Nepal should be cognisant of are summarised in Figure 32.
100
From primary interviews conducted in February and May 2014. Please see Annexure for list of interviewees.
Dolma Development Fund Page 57
Figure 36: Key success factors and challenges in pharmaceutical manufacturing in Nepal
Source: Intellecap analysis, 2014
Some key success factors that investors can use to evaluate the attractiveness of
pharmaceutical manufacturers include:
Strong relationships with API manufacturers in India and other countries to enable procurement
at competitive rates
Diversified portfolio of drugs with bias towards high value prescription drugs like antibiotics and
those targeted at NCDs with high prevalence in Nepal
High quality infrastructure and manufacturing processes that are either already WHO-GMP
certified or would easily meet the certification criteria
Good distribution network with strong on-ground sales team and diversified sales channels
A specific component of sales originating from direct sales to larger consumers like pharmacies
and hospitals; instead of over-reliance on distributors and traders
Brand recognition amongst doctors and end-consumers
Some key risks and challenges that investors in pharmaceutical manufacturers in Nepal should
be cognisant of include:
Threat of competition from foreign firms and domestic manufacturers in the low-cost generic
drugs segment
Completely import-reliant for APIs and import-reliant to a high degree for packaging materials
and machinery
Low focus on quality certification and processes may lead to negative outcomes
Presence of spurious drugs in the market which can often copy brand and design of established
companies and create a reputation risk for them
6.2 Emerging Investment Opportunities
6.2.1 Medical Consumables and Equipment
Medical consumables include healthcare-related supplies that are generally disposable in nature; such
as bandages, wound care products, dental fittings. The global demand for disposable medical supplies
is projected to reach US$ 200 billion by 2016101
.
Medical equipment is designed to aid in the diagnosis, monitoring or treatment of medical conditions.
Medical equipment encompasses a wide range of products like cardiovascular devices, dental
101
World disposable medical supplies report, 2012
Key Success Factors
•Partnerships with API manufacturers
•Diversified portfolio that includes high value drugs
•High quality infrastructure and manufacturing processes
•Good distribution network
•Direct sales to hospitals and pharmacies
•Brand recognition
Key Challenges
•Competition from foreign firms
•Completely import-reliant for APIs
•Low focus on quality assurance processes and certification
•Spurious drugs in the market
Dolma Development Fund Page 58
equipment, diagnostic devices, ophthalmic devices, orthopaedic devices, respiratory devices and
surgical equipment. The global trade in such tools is expected to reach US$ 228 Billion by 2015102
.
Businesses involved in medical consumables and equipment typically operate through 3 business
models – (a) manufacturing firms, (b) assembly and packaging-focused firms that import raw materials
and components and assemble these, and (c) firms that import or procure locally and sell to hospitals,
diagnostic centres, and pharmacies etc. A typical value chain in medical consumables and equipment is
shown in Figure 37, and such value chains in emerging economies like India are organised around
specific diseases. For e.g. manufacturers, assembly-firms, and distributors/dealers for cardiac-care
specialise and deal only in cardiac-care related consumables and equipment103
.
Figure 37: Typical value chain in medical consumables and equipment segment
Source: Intellecap analysis, 2014
Growth in medical consumables and equipment is correlated with growth in the private
healthcare market
Medical supplies and devices are critical to the effective functioning of healthcare facilities, and form a
significant part of set-up costs as well as on-going operational expenses. It is estimated that medical
equipment account for approximately 40% of the cost for setting up a tertiary hospital in a developing
country like India; and medical supplies and devices can contribute up to one-fourth of the average cost
of treating each hospitalised patient.104
As hospitals, clinics and diagnostic centres grow; a
corresponding growth in demand for medical consumables and equipment can be expected. For
instance in India, growth of 15% CAGR in private healthcare segment105
since 2012 has seen
corresponding growth of in 20.8% CAGR in medical consumables and equipment in the same period106
.
Nepal is import-reliant to meet demand for Medical Consumables and Tools
Healthcare facilities in Nepal procure almost all their medical consumables from other countries, with
India, China and USA being the largest exporters of medical consumables and equipment from other
countries. In 2013 over US$ 54.6 million worth of medical consumables and equipment were imported,
and this import has been growing at a CAGR of 17.6% since 2010 as shown in Figure 38.
102
Lucintel, Global Medical Device Industry 2012-2017: Trend, Profit, and Forecast Analysis 103
Intellecap analysis, 2014 104
Rising Cost of Inpatient Care Linked to Medical Devices and Supplies, Centre for advancing health, 2012 105
PwC India, 2014 106
BMI Espicom and KPMG Excellence in Diagnostic Care; and Intellecap analysis, 2014
Dolma Development Fund Page 59
Figure 38: Import of medical consumables and equipment in Nepal
Source: Trade and export promotion centre database, Nepal, accessed in March 2014
Nepal is import-reliant for medical consumables and equipment since local manufacturing
capacities are nascent; but some medical consumables can be manufactured locally with
access to right capital and technical assistance
The manufacturing sector in Nepal is quite nascent and contributed only 7% to the GDP of Nepal on
value add basis from 2009-2013, compared to manufacturing sector contributions of 14% in India and
18% in Bangladesh in the same period. There are several drivers of Nepal’s underperforming
manufacturing industry, including – (a) lack of supporting infrastructure such as roads and power, (b)
lack of technology and know-how, and (c) lack of capital availability (given that manufacturing is a
capital-intensive industry). Due to these challenges faced the manufacturing sector; most industries
such as agriculture, automobiles, and electronics are heavily import-reliant for basic as well as
advanced machinery and equipment.
Similarly, the healthcare sector in Nepal is also import-reliant for medical consumables and equipment.
However, while it may be unviable for more technologically advanced medical consumables and
equipment to be manufactured in Nepal; there is an opportunity to manufacture some common medical
consumables, medical gases, and equipment require less advanced manufacturing capacities and
technical know-how. Domestic manufacturing seems feasible and is likely to emerge as an investment
opportunity in the medium term as shown in Figure 39.
Figure 39: Private sector opportunities in medical consumables and equipment
Source: Intellecap analysis, 2014
Some early traction can be seen amongst companies such as Himal Oxygen, Surya Shakti Oxygen,
and Shree Maharaj that are producing oxygen cylinders and Everest Med which produces disposable
3.63 5.66 6.12 6.33
29.92
37.70
45.96 48.32
2010 2011 2012 2013
US$ Million
Import of medical consumables Import of medical equipment
Dolma Development Fund Page 60
syringes in Nepal. Private equity capital can play a catalytic role in helping to set up and scale more
such manufacturing plants dedicated to medical consumables and tools.
Another significant medical consumable that Nepal could scale domestic processing in is medical grade
bandages and wound dressing. The country is already a significant manufacturer and exporter of cotton
linters pulp which is the input material for manufacturing medical grade bandages and dressing
material. Nepal exported 106,449 kgs of the pulp, worth US$ 203,487 in 2010107
. To add further value to
cotton-linters pulp needs semi-skilled labour and lower amount of capital when compared to
manufacturing other medical consumables. Hence, this segment could become a viable investment
opportunity with access to risk capital and business support. A few examples of large scale private
sector firms operating in the medical consumables and equipment segment in India have been shown in
Case Box 3.
Case Box 3: Indian private sector firms operating in the medical consumables and equipment segment
Sutures India Pvt. Ltd. Surgical sutures manufacturer (www.suturesin.com)
Manufactures absorbable and non-absorbable sutures, surgical tape, surgical mesh, bone wax, skin
stapler, surgical gloves and Foley catheter. Manufacturing facilities and processes confirm to ISO
9001/2008, ISO 13485/2012 standards, Schedule-M (GMP) and GLP standards. Sutures India sells in
the domestic market and exports products to over 91 countries. Company distributes its products
through 200 sales personal, 3 depots, 17 Consignee agents, 2 distributors and over 1500 stockists.
Tiger Surgical Disposable Pvt. Ltd. Disposable syringe manufacturer (www.tigersurgical.com) Manufactures disposable syringes in varying sizes in a 60,000 square feet manufacturing facility using
machinery imported from Germany. Has a total capacity of 100 million syringes annually, and
distributes products to domestic as well as international markets. The firm has stringent quality control
processes (ISO 9001, G.M.P) in place that cover the entire life cycle of the products – from raw to
packaged state.
nsp Hospitech India Pvt. Ltd Medical gas pipeline management (nsphospitech.com)
Installs and manages medical gas pipeline systems in hospitals. The firm has done 500 installations thus far, and is ISO 9001 and CE certified. The company has also tied up with a U.S.A.-based firm Steris Corporation for diversification into medical equipment and surgical furniture; and is capitalising on existing relationships with hospitals to market these.
Source: company websites and literature
Private equity investment opportunities in medical consumables and tools segment include set-up of international-grade manufacturing plants, building market linkages and facilitating access to debt
Manufacturing companies in Nepal do not have easy access to capital. These companies could benefit
from attracting private equity investments followed by debt funding. Improving their capital base can
help the manufacturing units improve working capital, build capacity to leverage economies of scale,
maintain international quality standards, conduct due diligence of manufacturing facilities and
107
Trade and Export Promotion Centre Nepal database, accessed in February 2014
warehouses to match the quality of products from multinational companies, Companies would also
benefit from establishing market linkages with leading hospitals in Nepal such as Norvik Hospital and
Grande International for greater revenue predictability.
As economies of scale come in domestic companies may be able to price their products lower than
foreign players as they would save on import duties and transportation costs. However, in the long term
domestic companies need to bring in USPs other than price to remain competitive since many
multinational companies have deep pockets and may be prepared to price products low and sustain
losses for a certain time period to maintain market share.
6.2.2 Chains of Diagnostic Centres
Diagnostic centres conduct medical tests to establish the presence of disease. Diagnostic services can
broadly be classified under 3 categories – (a) in-vitro diagnostics (IVD), (b) in-vivo diagnostics and (c)
medical imaging. IVD entails to testing organic samples such as blood and tissue. In-vivo diagnostics
refers to the testing samples of organs; and medical imaging includes tests such as x-rays,
computerised axial tomography (CAT), mammograms and magnetic resonance imaging (MRI).
The diagnostic segment is critical to healthcare because up to 70% of all medical decisions are made
based on diagnostic test results108
of some form. Given that Nepal is seeing a growth in incidence of
NCDs as shown in Figure 4; the country is expected to also see a corresponding rise in demand for
periodic diagnostic checks for NCDs like blood tests and electrocardiogram.
The diagnostic sector in Nepal is highly fragmented
The diagnostics industry in Nepal is highly fragmented and concentrated largely around Kathmandu and
some of the smaller towns and cities like Pokhara, Bharatpur and Biratnagar. These diagnostics centres
are operated by the government as well as the private sector. Most diagnostic centres in Nepal focus
on IVD testing, while there is a market gap on the in-vivo testing and medical imaging side.
On the private-sector side, Nepal has various local stand-alone diagnostic centres operating under the
unorganised sector and providing basic diagnostic services out of one or two facilities. There are also
some companies that only collect samples and do not conduct the tests themselves, but transfer
samples to India for processing. This latter model results in higher lag-time of results, and due to limited
cold chain infrastructure the samples are often spoilt.
Besides the stand alone players, significant part of the diagnosis is also conducted by in-house
diagnostic centres of private hospitals. Such centres are better equipped with technology and trained
staff to conduct advanced tests.
Nepal has been facing challenges of inaccurate medical lab test results
As most diagnostic centres operate at a very small scale, they do not have the resources to invest
technologically advanced diagnostic equipment. This challenge is further compounded by the lack of
skilled human resources to collect and process samples for accurate diagnosis. As a result it has been
observed that the number of patients visiting hospitals with conflicting diagnosis based on inaccurate
diagnostic test results have increased in the last few years109
.
On the regulatory-side, the National Public Health Laboratory (NPHL) has laid down policies and
guidelines for the diagnostics industry. However due to lack of stringent monitoring and evaluation; the
108
KPMG and CII, Excellence in Diagnostic Care 109
Centre for Investigative Journalism, The Killing Clinics of Nepal-Government Mum on Illegal Operations , 2012
Dolma Development Fund Page 62
degree of compliance is fairly low. As per a study, 84% of the pathology labs in and around Kathmandu
Valley do not meet core governmental standards110
.
Facilitative FDI policy has witnessed entry of foreign diagnostic companies; this trend could
help to drive consolidation and higher quality services
The government is supportive of foreign investments in the diagnostics market, and allows 100% FDI in
domestic firms. Encouraged by this, some stand-alone diagnostic centres in Nepal have attracted
individual and institutional foreign investments in the last three years. For instance, companies such as
Dr. Pathlabs from India have entered into agreements with existing stand-alone diagnostic centres to
act as their collection centres in Nepal. SRL Diagnostics has also entered the market through a JV with
NE Group as shown in Case Box 4.
Case Box 4: Examining a JV between Indian and Nepalese diagnostics company
Super Religare Laboratories (SRL), one of India’s leading diagnostic networks has entered into a JV with Life Care Sciences Ltd., a subsidiary company of the NE Group in 2010. SRL has a 50% stake in the JV and has invested US$ 0.5 million. The Life Care Sciences Lab is located in Maharajgunj, Kathmandu and has 12 collections centres
across the country in cities such as Pokhara, Biratnagar, Nepalganj, Bhaiwara, Bharatpur, Dhangadi,
Dharan and Janakpur.
SRL has started providing 150 tests in Nepal and aims at increasing them to 300. They have global
accreditations; the lab in Kathmandu is equipped with the latest technology and has a team of 40
doctors and technicians.
Buoyed by access to good technology and skilled personnel; as well as in-country test processing
infrastructure; this JV is now aiming at capturing 40% of the market share. As a Corporate Social
Responsibility (CSR) gesture, the lab also provides discounts low income consumers referred by
government hospitals.
Source: NE Group website
While stand-alone diagnostic clinics are not suitable for private equity investments; chains of
such clinics are an emerging investment opportunity
FDI inflows into diagnostic clinics bring not only much needed financial capital, but also access to
technology, processed, skilled talent and improved brand equity. In order to truly catalyse the
emergence of high quality, professional and growing diagnostic segment; these foreign diagnostic
companies can consider building domestic processing capacities and establishing chains of private
diagnostic clinics in Nepal.
As more such JVs and partnerships emerge; intuitional private equity funds can help in financing the
capital pool of newly formed JVs and drive consolidation. Access to risk capital can also help these
diagnostics chains invest in building backward linkages with primary clinics and forward linkages with
tertiary hospitals for end-to-end patient care.
110
Nepal Association for Medical Laboratory Science (NAMLS) from August 2008 to January 2009 on the Status of Private Clinical Laboratory Medicine Service
Dolma Development Fund Page 63
6.2.3 Chains of Polyclinics and Primary Health Clinics
Primary health care (PHC) consists of first-contact assessment of a patient and the provision of
continuing consultative care for various health related issues. The scope of primary care includes
prevention, diagnosis, treatment and management of health problem is the essential health care based
on practical, scientifically sound and socially acceptable methods and technology, made universally
accessible to individuals and families in the community. The two main elements of PHC are high quality
essential services and ease of access.
Government PHC infrastructure is inadequate in Nepal, indicating an opportunity for private
primary healthcare facilities
In 2009 there were 202 primary healthcare centres in Nepal; and the ratio of primary health centres to
the population on Nepal was approximately 1:141402111
. It is estimated that it can take 2 to 3 hours to
reach a primary health centre from some of the rural and far flung villages in Nepal, whereas reaching a
hospital could take close to 24 hours112
. Various not-for-profit organisations are trying to provide basic
healthcare services to the remote areas in Nepal, but since their models are inherently unsustainable
such services cannot be provided at scale and hence are not able to completely bridge the demand-
supply gap.
Figure 40: Number of government run primary healthcare centres
Source: Central Bureau of statistics, Nepal
This need gap has created an opportunity for high quality, accessible and affordable private primary
healthcare clinics. While private clinics have mushroomed across hubs like Kathmandu and Pokhara,
most are stand-alone clinics. They often rely on skills and brand value of a single doctor; supported by
1-2 nursing and administrative staff. They have neither the resources nor in some cases the inclination
to scale and grow. As a result, the entire stand-alone private clinics segment is fragmented with high
degree of informality and is not suitable for private equity investors.
However, a recent trend has been observed where high quality, professionally managed chains of
primary care polyclinics are coming up. These provide both general and specialist examinations and
treatments on an outpatient-basis. While accurate data on the number of such clinics was not available,
one of the more popular ones is Advanced Polyclinic with operations in Kathmandu and Pokhara. It
provides general and specialised consultative services, diagnostic services, and comprehensive health
check-up plans that combine both diagnostics and consultation at attractive prices113
.
The demand for polyclinics such as Advanced Polyclinic is expected to increase with the growing
incidence of “lifestyle” diseases such as blood pressure, diabetes and heart disease as shown in Figure
4. These diseases require periodic tests and consultations; and patients prefer to have easily
accessible facilities close to their homes for such care. For instance, Nepal had 674,120 cases of
diabetes in 2013 and the average healthcare expenditure due to diabetes per person was US$ 39114
.
Polyclinics and private healthcare centre chains are expected to emerge as a viable option for
private equity investment in the medium term
Stand-alone primary clinics and polyclinics often do not have the financial resources and technical
know-how to scale up their business models. However, such clinics can be consolidated with domestic
JVs and foreign player-led JVs to create financially viable and professionally managed chains of clinics.
In addition to consolidation of existing clinics into chains, and establishment of new PHC chains;
another emerging opportunity could be diversification of existing tertiary hospitals into PHC chains to
improve their outreach. Case Box 5 shows a comparable example from India.
Case Box 5: Example of primary healthcare clinics chain in India
Apollo Healthcare has launched primary healthcare oriented “Apollo Clinics” through company-owned and franchisee facilities. These facilities provide patients care in their neighbourhood and are often more easily accessible than Apollo’s tertiary hospitals; and also refer patients needing residential or surgical care to the hospitals. There are close to 100 Apollo primary clinics in India till date; and they create forward linkages for 43 secondary and tertiary hospitals run by the Apollo Group
115.
Source: Apollo Group website, accessed in May 2014
6.3 Currently “Missing” but High Potential Business Models
Since Nepal is a frontier market that has just started witnessing traction in private sector intervention
and business innovation in healthcare; private equity investors should be cognisant of the dynamic
manner in which the healthcare market could evolve.
As the domestic economy grows and commercial ties with other emerging nations like India strengthen,
it is natural that successful healthcare models may transfer from these emerging economies to Nepal.
Some early proof of this trend is already visible in the knowledge transfer partnerships set up between
Indian and Thai private hospitals and Nepalese hospitals116
.
Based on this future potential and an analysis of critical need gaps in the healthcare market in Nepal, it
is likely that business models based on telemedicine and emergency medical services may make an
entry in the next few years.
6.3.1 Telemedicine
114
World Health Organization, 2013 115
Apollo Group website, accessed in May 2014 116
See Table 3 for details
Dolma Development Fund Page 65
Telemedicine entails the use of telecommunication and information technologies to provide clinical
health care at distant locations which may have limited physical infrastructure for healthcare. The core
idea of this approach is to minimise the need for physical proximity to trained doctors for basic
consultative care. Given Nepal’s limited healthcare facility footprint and the huge capital investments
needed in physically expanding this footprint; telemedicine could potentially come up as of the solutions
to bridge the demand-supply gap in healthcare.
The global telemedicine industry was estimated to be at US$ 14.2 Billion in 2012, and is estimated to be
growing at a CAGR of 18.5%117
. Primary growth drivers for this industry are the ability to provide health
care service to remote location without incurring an expenditure on physical infrastructure and the
increasing penetration and usage of mobile phones, laptops and internet. Using techniques such as
telemedicine help healthcare institutions to reach rural locations, save on operational costs and most
importantly ensure efficient delivery of healthcare services.
Physical Accessibility, affordability and poor infrastructure are the biggest challenges faced by
Nepal healthcare sector; makes a case for telemedicine based healthcare solutions
Nepal as a country has mountainous and hilly terrain with poor road and transport infrastructure. Road
density of Nepal (km of road per 100 sq. km of land area) was reported at 14 in 2008 compared to 125
for India in the same period118
. As a result people in remote locations often find it difficult to access
healthcare facilities which are generally situated away from remote habitat clusters. Despite the
increasing demand for health services from such regions, it is not feasible for stand-alone PHCs to
service this segment due to smaller populations and high operational costs. Further, since the supply of
doctors and nursing staff in Nepal is low, it is difficult and expensive to hire and retain staff even if such
PHCs are built.
There is a demand for inexpensive primary healthcare provision in rural areas of Nepal which
provides an opportunity for telemedicine-based healthcare sectors to emerge
There is an opportunity for telemedicine in Nepal, and it is encouraging to see early adoption by
government and non-profit programs primarily for rural care. As these programs scale and demonstrate
efficacy, for-profit businesses can be expected to also move into this segment.
The Government of Nepal launched its telemedicine project in 2011 under the SAARC telemedicine
network project to boost health care in rural areas. The program has received financial and technical
assistance from India. As of 2013 Government of Nepal had implemented the rural-telemedicine
program in 30 rural-district hospitals119
.
On the private-sector side, the Nepal Research and Educational Network (NREN) is actively involved in
promoting telemedicine. A non-profit group focused on ICT-led development initiatives in the region;
NREN started working in the telemedicine segment in partnership with Kathmandu Model Hospital
(KMH). An early pilot in 2006 was eventually scaled up into telemedicine connectivity in 10 rural
healthcare centres. Driven by the early success, NREN tied up with the Trans-Eurasia Information
Network (TEIN3) for access to high capacity internet connectivity and grew its telemedicine outreach to
6 hospitals in Nepal and leading medical universities and hospitals from US, Japan, Korea and
Australia. Most of the current work is focused on improving patient care and promotion of evidence-
based medical care in Nepal120
.
Aside from the government and non-profit interventions, a few software and IT development firms like
HiTech Pioneer have run small-scale pilots to test the efficacy of telemedicine using low-cost, low-
bandwidth computers with video streaming; bringing medical advice from doctors in Kathmandu to
patients in remote regions of the Far West.
117
Global Telemedicine Market Outlook to 2018, 2014 118 World Bank data 119
MoHP, 2014 120
NREN website, accessed in May 2014
Dolma Development Fund Page 66
Telemedicine models that emerge in Nepal will need to take into account the limited
telecommunications network coverage and infrequency in access to power
Telemedicine services can be delivered through two major approaches – (a) real time consultations
involving video conferencing which necessitate access to internet and power; and (b) non-real time
consultations that rely on a combination of canned responses to frequent queries and email/SMS-based
interactions with some time-lag. The former approach to telemedicine is more popular in developed
countries where the underlying infrastructure needs are more readily addressed; while the latter is more
suited for developing countries like Nepal.
Hence, in the short to medium term, telemedicine models that emerge in Nepal are more likely to be
based on the non-real time consultation model.
With increasing mobile penetration, technology adoption levels in Nepal, telemedicine has the
potential of becoming an attractive segment in the future
Mobile penetration was estimated to be at over 60% in Nepal in 2013121
. With increasing technology
adoption and improving telecom-power infrastructure; it seems likely that private tertiary hospitals and
clinics will explore introduction of telemedicine in the near future. This could potentially help them
expand their footprint with comparatively lower set up costs. Besides the cost advantage, patients
treated using telemedicine infrastructure that need further care can also be converted into hospital
patients through referrals.
Likely players to enter this market include – (a) Tertiary hospitals working on B2B and B2C
model, and (b) independent service providers working on B2B model
A similar trend has been seen in India where several tertiary care hospitals have invested in
telemedicine infrastructure, including Apollo Telemedicine Enterprise, Narayana Hrudayalaya, Asia
Heart foundation, Escorts Heart Institute, and Aravind Eye Care. It is estimated that the market potential
for telemedicine in India could extend to 40 million consultations per year in India alone122
.
Case Box 6 shows examples of Apollo Healthcare’s foray into telemedicine in two models – (a) to
strengthen its own infrastructure, and (b) to act as a turnkey service provider.
Case Box 6: Example of telemedicine initiatives in India
Apollo Healthcare Model 1: Rural healthcare facilities and mobile vans powered by telemedicine (http://www.apollohospitals.com/initiatives-reach.php and http://www.apollohospitals.com/initiatives-disha.php) Apollo Healthcare operates two initiatives powered by telemedicine technology – Reach Hospitals and DISHA. Reach Hospitals are located in peri-urban and rural areas, and have telemedicine infrastructure that allows doctors in urban cities to consult rural patients. Reach centres are also equipped with pharmacies and insurance services. The Distance Healthcare Advancement Project (DISHA) is also a novel telemedicine-based initiative run by Apollo in partnership with Philips, Indian Space Research Organisation, and Dhan Foundation. DISHA comprises of a fleet of mobile vans with an ultrasound machine, an X-ray, a defibrillator and an ECG machine along with dedicated doctors and other para-medical staff from Apollo Hospitals. Each van is also linked with Apollo tertiary care centres via telemedicine. Model 2: Turnkey telemedicine services (http://www.apollotelehealth.com/) Apollo Tele Health, a unit of Apollo Healthcare also provides turnkey telemedicine services, largely to governments in the form of PPP structures. These telemedicine services consist of teleconsultations, telediagnostics, teleopthamology, wellness and preventive care, chronic disease care, and
Case Box 6: Example of telemedicine initiatives in India
management consultancy. Some recent projects include building 30 telemedicine units for AfroIndia Medical services’ in East and West Africa; and a Memorandum of Understanding with Common Services Centres (CSC) Scheme (CSC) of the Department of Electronics and Information Technology, Ministry of Communication and Information Technology, India for providing telemedicine through 100,000 CSCs.
Source: Apollo corporate website
For instance, since telemedicine can be a significant profit-driver for hospitals and clinics, independent
service providers structured as a B2B telemedicine offering for hospitals are also likely to emerge.
Tertiary hospitals could benefit from sub-contracting design, installation and maintenance of
telemedicine facilities to these B2B providers; and focusing their own efforts on core areas concerning
patient care.
6.3.2 Emergency Medical Services
Emergency Medical Services (EMS) are a type of emergency service dedicated to providing out-of-
hospital acute medical care and specialised transportation of patients with illnesses and injuries which
prevent the patient from transporting themselves to a hospital. High incidence of heart attacks, strokes,
accidents, and natural disasters are driving the demand for this industry in Nepal; while on the other
hand the supply-side is inadequate123
.
Nepal has weak EMS support when compared with developing countries like India
Currently Nepal has no centralised hotlines for the people to reach out in case of an emergency. On the
other hand, even though India also has an underdeveloped healthcare sector; EMS hotlines have been
launched and have gained popularity due to their quick turnaround time. These include numbers such
as 108 - which is a state-driven service; and 1298 - which is a private service.
Further, Nepal also does not have adequate number of ambulances and trained paramedical staff. It is
estimated that of critically ill patients arriving to emergency rooms of hospitals in Nepal; only 10% arrive
by ambulance124
. As a result most patients are brought to hospitals in personal vehicles and taxis, and
receive no en-route medical care. This can lead to worsening of their health condition and may even
result in loss of life in extreme cases.
Inadequate number of hospitals and high risk of natural disasters in Nepal make it essential to
have a robust EMS in the country
EMS is an essential part of the overall healthcare system as it can save lives by providing immediate
care. In addition to responding to cases individual health emergencies; a well-organised EMS can go a
long way in decreasing the aftermath of large scale accidents, natural disasters and epidemics.
Currently the ratio of paramedics in Nepal is 0.7 per 1 million people. There are only 21 trained
paramedics125
in the entire country. The Nepal Red Cross Society has 168 ambulances but none of
them have trained paramedics and only 35% of the ambulance drivers have had first aid training.
123
UN Office for the Coordination of Humanitarian Affairs, Nepal: Ambulance service “inadequate”, 2012 124
Nepal ambulance services website 125
Nepal ambulance services website; accessed in May 2014
Dolma Development Fund Page 68
With the high risk of natural disasters such as earthquakes and landslides, threat of political unrest and
violence, and rising incidence of cardiac issues; the country can benefit from strengthening the EMS
infrastructure through public and private interventions. Further, since the number of specialised tertiary
hospitals is limited and concentrated in hubs like Kathmandu and Pokhara, high quality EMS care is
essential for patients from rural areas that are being transported to hospitals.
Public private partnerships and private equity investments can drive the growth of this segment
The government can build the emergency medical services through the public private partnership (PPP)
model, which involves outsourcing EMS operations to a private firm. The PPP model is running
successfully in India and helping the Indian government to reach out to the patients within the globally
known “golden one hour” and the “platinum 10 minutes” time frame as explained in Case Box 7.
Case Box 7: Examining the PPP model being followed by the “108 service” in India
108 is a free telephone number for EMS care in India, which is operational across 17 states and union territories. The number provides integrated fire, police and medical care facilities and is run as a PPP between state governments and private EMS companies. Some of the private organisations that work in partnership with state government to deliver 108 services include GVK-EMRI (not-for-profit) and Ziqitza Healthcare (for-profit social enterprise).
The 108 services works on the paradigm of “Sense – Reach – Care” and are maintained by a trained team and technologically updated equipment and software with GPS tracking systems. Their services are provided for free and subsidised by government and advertising revenues. In some cases, a per user fee is also charged based on the nature of the PPP agreement.
Source: National Rural Health Mission, Government of India
Aside from PPP-models; another example of a private company providing in ambulance services in
India is “Dial 1298” promoted by Zitqitza Healthcare Limited (ZHL). ZHL is an Indian company that
provides ambulance services either through the PPP-model (where these ambulances operate under
the 108 brand); or through its own private offering under the “Dial 1298” brand. ZHL raised US$ 1.5
million in private equity investment from Acumen Fund in 2007, and is operational across Mumbai,
Bihar, Punjab, Rajasthan and Kerala.
As the awareness around need for EMS in Nepal grows, both PPP and private EMS models are likely to
emerge, and the latter could be a potential investment opportunity for private equity players.
6.4 Non-Opportunities
Stand-alone diagnostics centres, stand-alone primary health clinics, and pharmaceutical
importers are not attractive for equity investors
Dolma Development Fund Page 69
These businesses operate in fragmented nature of markets and have little or no differentiation in
business models, as a result of which they compete based on prices and can have low margins. Stand-
alone diagnostic centres and primary clinics are predominantly small-scale operations and hence are
unable to absorb large amounts of equity capital structured as minority stakes. On the other hand, while
pharmaceutical importers may control 60% of market share today126
; their ability to compete in the
market has been and will continue to diminish with growth of pharmaceutical manufacturing firms.
7. Exit Opportunities for Investors in Healthcare
The flow of private equity investments into healthcare in Nepal is a comparatively new phenomenon.
The few investments made so far have largely involved domestic promoter equity or FDI capital as
shown in Section 5.
This creates a challenge in predicting exit trends as there is a lack of historical data as well as financial
industry infrastructure to facilitate exits
7.1 Spectrum of Exit Routes
A key role that private equity firms are expected to play in the healthcare sector Nepal is to help
businesses invest in technology, processes and manpower to streamline and standardise their work,
and thereby scale effectively. These are also expected to help drive greater focus on incorporating
quality assurance processes and certifications.
With these investments; private tertiary hospitals and pharmaceutical manufacturers businesses are
likely to grow faster, increasing their revenues and profitability and thereby increasing firm value. This
in-turn results in making such businesses attractive to other investors – ranging from investment funds
to larger healthcare businesses - that can buy-out stake of first investor at a higher valuation. It is also
possible that enough value is created for the promoter or the management team to buy-out investors’
stake. A broad overview of the various possibilities in exits are discussed here, followed by a hypothesis
on which are likely to be popular exit routes in Nepal.
Generally speaking, the process of an equity investor selling stake to another investor at a higher
valuation is termed an “exit”, and the spectrum of possible exit opportunities includes – (a) Management
/ Promoter buyout, (b) Secondary Sale, (c) Trade Sale, (d) Initial Public Offering (IPO)127
.
Management / Promoter buyout: Management / Promoter buyout involves the repurchase of
the private equity investors’ shares by the company and/or its management. The management
buyout method is popular in several sectors in Nepal where profit margins and liquidity are on
the higher side. In such situations, promoters may utilise the cash earnings for buying back the
stake of PE / VC investor.
Secondary Sale: Secondary sale is the purchase of the private equity investors’ or others’
shareholdings by another investment institution. Private equity investment activity in Nepal is
still an emerging phenomenon; however development financial intuitions such as IFC have
been active in making risk capital investments in Nepal in recent past. Secondary sale would be
an attractive method to exit in Nepal once the investment eco-system develops and matures.
Trade Sale: A trade sale involves selling the company’s shares to another company (structured
as a merger or an acquisition) usually in the same industry sector when the acquirer needs the
126
From primary interviews conducted during the course of this study in February 2014 127
Intellecap primary research
Dolma Development Fund Page 70
company to supplement its business areas128
. The numbers of publicly available Merger and
Acquisition (M&A) transactions in Nepal are on the lower side129
, but the activity is picking up in
recent years after the political stability in the country. Many companies in Nepal have started to
realise the benefits of economies of scale and scope, increased revenue and market share,
cost reduction through consolidated operations. The trade sales therefore in general offer better
opportunities for private equity funds for exits in Nepal, especially in private hospitals segment
since a recent government guideline130
encouraging mergers and consolidations among private
hospitals to improve their facilities.
IPO: IPO is used to publicly share the equity offering that is followed by the listing of shares on
stock exchange. The capital markets in Nepal are in nascent stage and are dominated by banks
and financial institutions where presence of real sector on the capital markets is very low
(excluding the hydropower sector)131
. IPO route in general may not be the best possible way for
exit of healthcare private equity investors in Nepal.
7.2 Likely Exit Routes for Healthcare Firms in Nepal
Private equity firms investing in the healthcare segment in Nepal may need to stay invested for 6
to 8 years before finding a lucrative exit
Both tertiary hospitals and pharmaceutical manufacturers in Nepal generally take 5-6 years to
breakeven and are expected to have higher trends in profitability thereafter132
. Private equity investors
should be cognisant of the projected break-even in specific opportunities to estimate lucrative entry and
exit times. A successful exit will depend on the entry points of investments; which is the construction
and/or expansion stage for both the aforementioned business models. The requirement of capital is
highest at this stage and investments can be made at lucrative valuations. Based on insights from
industry practitioners and Intellecap analysis, the capital value chain for possible exit options for private
equity investors in tertiary hospitals and pharmaceutical manufacturers is shown in Figure 41.
Figure 41: Broad exit timelines for investments in tertiary hospitals and pharmaceutical manufacturers
128
A trade sale is similar to ‘strategic’ sale 129
Excluding Banking, Financial Services and Insurance sector 130
The government is encouraging consolidation in the healthcare space and has created guidelines to enable merger of private hospitals as part of the “Directives on Establishment, Operation and Upgrading of Health Institute 2013” 131
Refer Annexure 11.4.1 for detailed discussion in capital markets in Nepal 132
From primary interviews conducted during the course of this study in May 2014
Dolma Development Fund Page 71
Source: From primary interviews conducted during the course of this study in May 2014, and Intellecap analysis, 2014
In order to manage risk of investing at an early stage in healthcare venture, investors can use the non-
financial valuation metrics discussed in Section 10.3 to identify high potential opportunities. Additionally,
investors may find it less risky to enter at construction stage in more well-established ventures; and just
before or in early stage operations of green-field ventures.
Promoter buy-back likely to be most popular approach for equity exits in tertiary hospitals and
pharmaceutical manufacturers in Nepal
Re-purchase of private investor’s shared by promoter(s) is likely to be the more prevalent approach for
exits in Nepal; especially in tertiary hospitals which are mostly promoted by established business
groups or High Networth doctors. The tertiary hospital business model enjoys high margins and has a
high market opportunity as well. While promoter ability to buy-back will be one driver; the other will
probably be the prevailing promoter sentiment where existing promoters want to ultimately retain
complete control of the firm. There seems to be a high degree of apprehension about loss of control
that could result from diluting management stake133
.
The pharmaceutical manufacturing segment is also likely to see greater incidence of promoter or
management-led buyout of private equity investor stakes; driven by promoter(s) ability to purchase
stake, as well as the lack of a significant secondary sale market that restricts exit options.
Trade sale may be observed in smaller tertiary hospitals
Acquisition by a larger hospital or merger of two complementary smaller hospitals businesses is
somewhat likely as well. This is expected to be driven by the expansion drive that most tertiary hospitals
seem to displaying to capture greater market share in underserved regions outside Kathmandu.
Additionally, facilitative regulation put in place by MoHP will also act as a facilitator134
.
In addition to domestic mergers, acquisitions and JVs with foreign hospitals are also likely to pick up as
a trend driven by the success of the Medanta-Norvic, Fortis-Vayodha, and Samitej-Grande partnerships
described in Table 3. Currently these are structured as tie-ups are for gaining technical and
management expertise but in in future the possibility of capital investment driven partnerships cannot be
denied.
Secondary-sale in the healthcare sector has low likelihood in the next 4-5 years
Secondary-sale requires the establishment of a value-chain of equity investors who have differing but
complementary investment sizes, risk appetites and preferred stages of investment. Since the practice
of equity investing in Nepal is very nascent, this value-chain will take time to emerge. Most investors are
likely to prefer growth-stage investments with lower risk and shorter return timeframes and their
investing activity is more likely to be competitive than complementary as was observed in the Indian
context 7-8 years back.
Exit through IPO is highly unlikely for healthcare companies in the near future
There are no listed healthcare companies in Nepal135
, and low inclination to list their companies was
seen amongst promoters of the larger hospital and pharmaceutical manufacturing management teams
interviewed during the course of this study. Hence, public listing is not likely to be a viable strategy for
majority of the equity exits in the healthcare sector in Nepal.
133
From primary interviews conducted by Intellecap during the course of this study in May 2014 134
MoHP Nepal, Directives on Establishment, Operation and Upgrading of Health Institute 2013 135
Nepal Stock Exchange Limited database, accessed in March 2014
Dolma Development Fund Page 72
7.2.1 Exit Trends Observed in Healthcare Firms in India
The capital markets in India are much more developed compared to Nepal136
and the private equity
investing activity is at a more advanced level. The most popular exit route for both venture capital and
private equity investments in India is through public market sales, including IPOs. Out of the 115 equity
exits reported in India 2012, more than 50% were through public market sales, including IPOs137
. The
trends in exits in India have been shown in Figure 42 below.
Figure 42: Distribution of private equity exits in India
Source: IVCA; India Private Equity Report 2013, Bain and Company
Public market sale and secondary sale are popular modes of exits from healthcare companies in
India
A total of 243 private equity investments cumulatively worth US$ 3.95 billion have been reported in the
healthcare sector in India between 2009 and 2014138
; and 60 exits have been reported thus far139
.
Public market sale and secondary sale have been the prevalent forms of exit; which can be attributed to
the presence of a mature investment value chain. The distribution of exits across different healthcare
segments is shown in Figure 43.
136
Refer Annexure 9.4.3 for details 137
IVCA; India Private Equity Report 2013, Bain and Company 138
Until May 2014 139
Venture Intelligence Database; does not include exit from Vetnex Animal Health
Dolma Development Fund Page 73
Figure 43: Distribution of healthcare exits across different sub-sectors in India (2009-2014)
Source: Venture Intelligence India database
Return multiples across hospital exits in India typically range from 1.24x to 4.31x; and
pharmaceutical companies range from 1.26x to 3x140
Specific details of 11 exits observed in healthcare companies in the hospital and pharmaceutical
segments in India are shown in Table 9.
Table 9: Selected healthcare exits observed in India
Company Acquirer Seller
Deal Size
(US$
million)
Exit
Status
Exit
Procedure
Return
Multiple
Sub-Sector: Tertiary Hospitals
Apollo Hospitals NA Apax Partners
180 Partial Public Market Sale
2.8x
Apollo Hospitals NA Apax Partners
23.3 Partial Public Market Sale
3.11x
HealthCare Global Temasek Holdings
Evolvence India Life Sciences Fund
10.95 Complete Secondary Sale
2.14x
Medanta Medicity Carlyle Avenue Capital
155.9 Complete Secondary Sale
4.31x
Medica Synergie
Quadria Capital, DEG, Swedfund
ICICI Venture
64.32 Complete Secondary Sale
NA
Sterling Hospitals Promoters Actis NA Complete Buyback NA
Vikram Hospital & Heart Care
Multiples PE ICICI Venture
15.06 Complete Secondary Sale
1.24x
Sub-Sector: Pharmaceuticals
140
Venture Intelligence India database, accessed in April 2014
47%
32%
5%
5%
5% 3%
3%
Pharmaceuticals and Biotech Hospitals Diagnostics
Medical Devices CRO Wellness
Eye Care Clinics
Dolma Development Fund Page 74
Company Acquirer Seller
Deal Size
(US$
million)
Exit
Status
Exit
Procedure
Return
Multiple
Emcure Pharmaceuticals
BC Investments IV Limited (unit of Bain Capital)
Blackstone 112.55 Complete Secondary Sale
3x
Gland Pharma KKR
Evolvence India Life Sciences Fund
NA Complete Secondary Sale
NA
Granules India Promoters Ridgeback Capital
1.96 Partial Buyback 1.26x
Natco Pharma Nil Kotak PE 2.8 Partial Public Market Sale
1.98x
Source: Venture Intelligence India database, accessed in April 2014
7.3 Challenges in Exit
The key challenges to private equity exits in Nepal fall under three broad categories as shown in Table
10; i.e. systemic, equity investor-related and healthcare sector promoter-related challenges.
Table 10: Challenges in exits in Nepal
Systemic Challenges
Nascent industry, so higher risk and longer return horizons are possible
Little or no regulatory oversight for private exit markets
Lack of investor-entrepreneur connection platforms and investment intermediaries
Over-reliance on foreign equity
Currency devaluation risk
Lack of exit platforms designed for secondary-sale
Lack of ecosystem enablers like incubators, angel networks, business plan competitions
and grand challenges
Equity Investor-Related Challenges
Less experience of managing portfolio companies in economies like Nepal
Difficulty in building deal-flow
Lack of risk assessment frameworks customised for Nepal
Healthcare Promoter-Related Challenges
Dolma Development Fund Page 75
Lack of awareness about the comparative benefits of debt and equity
Apprehensions around working with external boards and fear of losing control of
company141
Source: Intellecap analysis, 2014
In addition to these, some regulatory hurdles that could be challenges for healthcare investors are:
Promoter lock-in period of 3 years: This is a key challenge for exits of private equity companies in
Nepal. The existing provision and law states that “the shares subscribed by the shareholders in the
groups other than public (group of promoter and other) of the body corporate which is eligible for going
public, shall not be qualified for sale unless a three years period after the allotment of such shares is
complete”142
. The three years lock in period for private equity investors is on the higher side in the
SAARC when compared to one year in India143
and Sri Lanka144
and no lock in period in
Bangladesh145
.
The repatriation of capital is a challenge for foreign equity investors in Nepal: at present the
repatriation of capital to a foreign country (except India) requires approval from the different
departments in the NRB and department of industries and is often discretionary146
. Given the
uncertainty in the policies and regulations of future governments due to political instability, this
discretion could be major hurdle for foreign investors in exits.
7.4 Enablers Needed for Exit
The government and its aid partners, the regulatory regime, and private sector can work in a
complementary fashion to build enablers needed for exit as shown in Figure 44. When these actors
begin to harmonise their functions, an “ecosystem” for equity investments begins to emerge as has
been observed in the case of Silicon Valley; and more recently in India and parts of East and South
Africa.
141
Especially in tertiary care hospitals which are largely family-run and can have a traditional approach to doing
business (as per observations from primary interviews conducted during the course of this study in February and May 2014 142
SEBON Annual report 2011-12 143
SEBI annual report 2012-13 144
CSE directive 2012 145
SECBD website, 2013 146
Intellecap primary research
Dolma Development Fund Page 76
Figure 44: Typical ecosystem for private equity investments in emerging economies
Source: Intellecap analysis, 2014
Government and aid partners can create more impact by playing a facilitative rather than direct
role
Government and aid partners could potentially create most impact by helping to decrease risk of
investments; acting as anchor investors in funds; and bring in facilitative regulation like tax breaks and
other incentives for healthcare companies.
The creation of „Guarantee funds‟ by public sector institutions can help to channel more debt
and equity capital into healthcare companies
Creation of guarantee fund by Public sector institutions, both for debt and equity products could provide
commercial banks and private equity funds with partial coverage of risk exposure against investment
made in healthcare companies. This would ensure that the capital supply to such companies is not
affected in the long term and this would facilitate further investments in the sector.
Building an ecosystem for the secondary markets to facilitate private equity investment exits
through open offer would create more exit opportunities
More awareness about the nuances of equity investing would be beneficial for both entrepreneurs and
investors. Industry networks, forums and conferences, incubators and investment intermediaries have a
key role to play in building this awareness and creating a better ecosystem for equity investments.
Historically given the low trading volumes in secondary markets in Nepal, an enabling environment for
promoting secondary market transactions should be created147
. The key drivers that would facilitate the
trading volumes in the secondary markets in Nepal are a) introduction of reliable online trading system
making trading affordable and b) settlement of transactions to be shortened to a few days from the
present duration that could last for few weeks.
Regulatory regime can play a key role in putting in place regulatory structures to allow exit
platforms to emerge
Recognising equity investments as a separate asset class creates more formal structures and higher
degree of organisation in the private equity market, which helps investors to navigate the processes of
incorporation, licensing and approvals. This recognition can also pave the way for special concessions
to private equity investors as well as create the foundation for public and private exit platforms to
emerge.
147
Refer Annexure 9.4.3
Dolma Development Fund Page 77
Private sector actors like incubators, angel networks, and investment intermediaries can help to
reduce duplication of efforts in deal sourcing and early stage capacity building; and highlight
best case practices for the industry
Private sector actors like incubators, industry networks and forums like conferences and workshops are
efficient aggregators of high potential businesses. By playing this role, they can decrease duplication of
effort in pipeline discovery across different private equity funds and also ease the process of fundraising
for entrepreneurs by helping them navigate through different choices. This trend has been observed in
India, where industry networks like TiE, FICCI and NASSCOM; private and public incubators; and
forums like TIECON and Sankalp Forum have played a key role in helping the venture capital and
private equity spaces grow.
8. Access to Capital for Healthcare Businesses
8.1 Debt and Equity Funding in this sector Healthcare companies in Nepal have moderate access to debt but low access to institutional
equity
Larger tertiary hospitals and pharmaceutical manufacturers interviewed during the course of this study
reported that access to debt is easier in healthcare than in other sectors; with a few firms even
qualifying for low-interest rate loans at 8 to 9%. While tertiary hospitals have traditionally had easier
access to low-interest debt, this is a comparatively new phenomenon for pharmaceutical manufacturing
firm that until recently were accessing debt at up to 17% interest. With the recent liquidity in the market,
interest rates for pharmaceutical companies have come down to 7 to 10% this year148
.
However, access to institutional equity is low in the country due to the less developed state of capital
markets149
.
Difficult to estimate quantum of debt funding, but the larger healthcare companies seem to have
easier access to debt funding and at better interest rates
In case of smaller healthcare firms, access to debt is difficult due collateralisation requirements, high
interest rates, and capping of loan terms 8 to 10 years. Data with further granularity is not available, and
hence it is difficult to accurately estimate flow of debt funding.
Overall, the supply of debt to businesses in Nepal appears to be inadequate since only 10% businesses
report that they are well-served by the banking infrastructure, and only 1% have a commercial bank as
source of financing150
. Some common challenges associated with access to debt funding include:
Requirement of high collateralisation: Banks tend to lend only to businesses in more
established sub-sectors and often require up to 100% collateralisation.
Long lead times in loan approvals: Since many banks lack the risk assessment and due
diligence frameworks needed to evaluate healthcare companies for loans, the process of
procuring a loan can take from 3 months to over a year with significant time investment from
senior management151
.
148
From primary interviews conducted during the course of this study in February and May 2014 149
See Section 11.4 for details 150
IFC Enterprise Finance Gap Database, accessed in March 2014 151
From primary interviews conducted during the course of this study
Dolma Development Fund Page 78
Equity funding in healthcare companies primarily consists of FDI and promoter capital; very
little organised private equity investing activity exists
Domestic promoter equity has been channelled by well-established business groups or pooled-together
capital from High Networth doctors. Norvic International Hospital (promoted by Chaudhary Group) and
Grande International Hospital (promoted by CE Group) are examples of the former; while Vayodha
Hospital and Smile Dental Care are examples of the latter. Over US$ 18.21 million has also come in
through FDI route from institutional as well as individual investors152
.
Healthcare companies face several challenges in accessing institutional equity capital which include:
Low supply of organised equity funding which means that promoters with existing
relationships/networks built with financiers are more likely to be evaluated for investments
Low awareness about the pros and cons of raising external equity which leads many
healthcare promoters to be apprehensive about losing control of their company to an external
investor
Very little activity in “investment intermediation” from incubators, angel networks,
investment advisors and others who typically link investors and entrepreneurs in more mature
markets
Lack of clarity in valuations and nature of investment agreement
Lack of exit platforms
8.2 Grants and Resources There are several international financial and non- financial assistances available to businesses which
Nepal can explore to bring in measurable operational efficiency and success within a company. Some
of the relevant grants and resources along with their criteria have been listed below:
1. Austrian Development Co-operation – Business Partnerships
In cooperation with the Oesterreichische Entwicklungsbank (OeEB) the Austrian Development Agency
(ADA) promotes Business Partnerships.
Activities that can be undertaken with the support of ADA:
Improvement in initial training and vocational training
Know-how transfer
Use of renewable energies or increase in energy efficiency
Improvement in water supply and waste water treatment
Improvement in waste disposal and/or recycling
Promotion of rural development and responsible management of natural resources
Increase in production, competitiveness and quality
Consolidation of supply chains
Improvement in social standards and working conditions
Improvement of the health of workers and their families, fostering gender equality
These measures can be supported as part of a business partnership with a non-repayable grant.
Funding amounts to up to 50% of direct project costs (not exceeding EUR 200,000), which must total at
least EUR 100,000. The term of a Business Partnership is limited to three years. The programme is
open for applications all year round.
Criteria
ADA is interested in innovative and sustainable projects. To be eligible for funding, a project must meet
the following conditions:
152
See Section 5 for details
Dolma Development Fund Page 79
Applicant is a European company in partnership with a company from a developing country.
Generation of local added value, turnover and profits.
Long-term commitment in developing country.
Benefits for local population beyond the applicant’s core business.
Compliance with national laws and internationally recognised environmental and social
standards.
The project includes flanking measures that contribute both to improving the local social,
ecological or economic environment and the success of the company.
Eligible costs
The application includes a budget according to ADA format. The following costs can be included:
Time spending of project partners.
Salaries of staff hired for the project.
Local and international travelling and accommodation costs.
Capital goods investments (only the annual depreciation costs are covered for the duration of
the project).
Costs of training, advisors, certificates, marketing, studies etc.
2. German Development Co-operation - DeveloPPP
The develoPPP.de programme provides up to 50% grant (maximum of Euro 200,000) to selected
projects proposed by a European company or a company in a developing country in which European
companies or nationals own at least a 25% share. The programme is funded by the German
government and administered by its agencies DEG, GIZ and Sequa. These agencies hold ideas
competitions four times a year for the develoPPP.de programme with the following closing dates: 31
March, 30 June, 30 September and 31 December.
Criteria
To qualify for develoPPP.de grant funding under the ideas competition, a project needs to have the
following features:
The applicant is a company registered in Europe or a company registered in a developing
country with at least 25% European ownership.
The applicant is at least 3 years active, has at least 10 employees and a turnover exceeding
Euro 1 million.
The applicant has a long-term entrepreneurial commitment in the target country and
demonstrates a commercial interest in the project.
The project should be completed within 3 years from contract signing.
Activities
DeveloPPP will co-finance exclusively projects that prepare or accompany long-term private sector
commitments, like:
Design and introduction of new products, technologies and services relevant to development;
demonstration or pilot projects.
Improvement of range of courses offered at training institutes.
Dolma Development Fund Page 80
Improvement of energy and water supply.
Improvement of healthcare.
Job creation.
Improvement of labour and social standards.
Measures to boost environmental and climate protection.
Supply chain management.
Economically and socially responsible value chain management.
Eligible costs
The application includes a budget according to DeveloPPP format. The following costs are eligible:
Time spending of project partners.
Salaries of staff hired for the project.
Local and international travelling and accommodation costs.
Capital goods investments (only the annual depreciation costs are covered for the duration of
the project).
Costs of training, advisors, certificates, marketing, studies etc.
3. German Development Co-operation – Up-scaling
With the special programme “Up-Scaling”, DEG finances pioneer investments of small and medium
enterprises (SME) in developing and emerging countries that intend to scale up innovative business
models. The programme addresses companies whose financing needs lie somewhere between micro
financing and the traditional financing by commercial banks.
Target group
SMEs that are registered in the developing country- This may also be local subsidiaries of German or
European companies. The applicant company has to provide the resources in terms of finance and
manpower as well as the relevant know-how to implement the project and needs to be able to present
at least one annual financial statement.
Funding
DEG finances a maximum of 50% of the total investment volume (max. EUR 500,000) under the
condition that there are private sponsors who contribute a substantial share of equity (at least 25%).
The DEG share must be repaid in the event of success of the project (depending on pre-defined
financial criteria such as cash flow, revenue or profit).
Conditions of co-financing
The project is based on an innovative business approach.
A pilot phase has already been successfully completed with proof of concept as regards to
technology and business model at local level.
The project must generate profit (proof by means of business plan and financial projections).
The project shows high growth potential owing to the size of the market and the target group.
The project may generally be planned in all developing or emerging-market countries, with
individual limitations owing to political or other risks. Projects in Africa and in LDCs (least
developed countries) will be considered preferentially.
Interested companies may deliver their proposals for the co-financing to DEG at any time.
Dolma Development Fund Page 81
4. Dutch Development Co-operation – Food security and private sector development
programme (public-private partnership)
The programme aims to stimulate public/private partnerships of Dutch and local partners within the
sphere of food security and private sector development in developing countries. There is one tender
round in 2014, closing on 1 December 2014.
Target group
Grants are available to public institutions, businesses, NGOs and knowledge institutions, within a
cooperative partnership which encompasses at least one business. The public component in the
partnership will, in every case, comprise the Dutch Ministry of Foreign Affairs. Participation by an NGO
is mandatory. Preferably, other public institutions will also form part of the cooperative partnership.
Sub-themes
For food security:
Improved local/regional availability of affordable and qualitative good food.
Efficient markets and sustainable chain improvement in local/regional markets.
Not eligible: projects exclusively aimed at non-food crops
For sustainable entrepreneurship:
Inclusive business proposals with demonstrable impact on low income groups
Improvement of female entrepreneurship
Not eligible: proposals aimed at the financial sector (excluding insurance)
Grant
Maximum 50% of budget with project budget of minimum EURO 2 million. Minimum 25% of project
budget must be financed by private enterprise.
5. Norwegian Development Co-operation – Application-Based Support for Private Sector
Actors
Activities
The programme is primarily aimed at businesses / commercial companies seeking funding for:
Feasibility studies (maximum 50% of budget with maximum grant of EURO 60,565). Norad
primarily covers the costs made in the development country.
Preliminary studies may include market, technology, legislation, etc.
Training related to establishment (maximum 50% of project budget with maximum grant of EURO
60,565). Support can be given to training of local employees for a limited time in connection with
establishment, in cases of major expansions or restructuring.
Pilot production/demonstration in connection with private investment projects / business
establishment (maximum 50% of total costs with maximum of EURO 121,000). In the starting phase
Dolma Development Fund Page 82
of production in a developing country, there may be doubt on whether the chosen technology is
appropriate to the local conditions.
The purpose of the programme is to reduce the risks present before an investment decision is made
and to secure the sustainability and feasibility of the investment project.
For companies seeking funding it is important to note the following:
Some sectors are prioritised (renewable energy, climate and environment-related technology,
agriculture, forestry, marine and maritime sector).
Requirements of at least EURO 1.2 million in turnover for the last year.
The applicant should normally have, or plan for, an ownership of at least 25% in the
established/ planned company.
The applicant must show a high development effect to be probable.
Sales and representation offices will not be supported.
Applications can be submitted continuously.
Dolma Development Fund Page 83
6. Swedish Development Co-operation – Innovation Against Poverty (IAP)
Applicants can be based in any country, but their inclusive business must be in a low-income country
(OECD/DAC list). The programme functions as a risk sharing mechanism for sustainable business
ventures (commercial companies or market oriented organisations) which have a strong potential to
reduce poverty. Companies can be active in all sectors where innovation leads to poverty reduction,
from agriculture and infrastructure to health and education.
Grants: Innovations Against Poverty has two parallel application processes:
Small grants (maximum 50% of project costs with maximum of EURO 20,000) for the purpose of
exploring an innovation or a new market. The grant can be used for travel and pre-feasibility
studies; stakeholder needs assessments, and networking with local organisations. This programme
focuses on smaller organisations which have a wealth of good ideas with great potential, but need
the support of their business strategy and resources to penetrate new markets.
Large grants (maximum 50% of project costs, in the range of EURO 20,000 – EURO 200,000) for
the purpose of undertaking a development project aimed at a product, service, system, business
model or a concept ready to be put to market test, or adaptation of existing products to be
affordable and accessible by the poor. IAP also seeks to work with larger companies, to help
support the development of “inclusive business” models for these markets, which expands
opportunities for the poor and disadvantaged in developing countries. Such business models can
engage the poor as employees, suppliers, distributors and consumers.
Key criteria: development effects, commercial viability, innovation, cost sharing and additionality.
The process is of a competitive nature, where grants are awarded to the best business plans which
meet the criteria of the programme. The programme works with 1-2 tender rounds per year. No tender
round has been announced at present.
7. USAID
There are several programmes under USAID that are applicable for Nepal such as:
Powering Agriculture
Development Innovation Ventures
Partnering for Impact
Partnering to Accelerate Entrepreneurship
Partnering for Innovation
9. Typical Capital Structure for Healthcare Businesses
Typical emerging market tertiary hospitals and pharmaceutical companies have debt-heavy
capital structures during initial years of operations, with debt component steadily decreasing as
the business grows
Tertiary hospitals and pharmaceutical manufacturing companies typically need access to debt for
purchase of land and machinery, and facility construction in their initial stages. This debt is usually long
term, and is paid back within a 5 to 10 year window depending on financial health of the business.
During this period, the debt:equity ratio is typically 70:30 in emerging market economies like India153
.
153
Venture Intelligence and Intellecap analysis, 2014
Dolma Development Fund Page 84
As the business grows and matures and long-term debt is paid off; the overall debt component
decreases. However, businesses will continue to need short term debt from time to time for operational
expenditure like machinery purchase and upkeep, building maintenance, and staff salaries. As a result,
the steady-state debt:equity ratio can range from 60:40 to 50:50154
.
Capital structures of tertiary hospitals in Nepal show a high degree of variance from this
emerging market trend; while those of pharmaceutical companies align with it
From primary interviews conducted during the course of this study, promoters of larger tertiary hospitals
and pharmaceutical companies stated that they have moderate to easy access to debt at attractive
interest rates. However, while promoters of pharmaceutical companies have accessed this debt,
promoters of tertiary hospitals seem to prefer equity raised through promoters or the “friends and family
mode” to debt. The typical capital structures used in both these business models have been shown in
Table 11.
Small to medium-sized hospitals also seemed to prefer equity, but this was primarily because either
they lacked access to debt or could not procure it at attractive interest rates. No clear trend or
preference was seen among small and medium-sized pharmaceutical players due to limited data.
Table 11: Typical capital structure of healthcare companies in Nepal
Capital Structure in Nepal
Debt Equity
Tertiary Hospitals155
30 to 50% 50 to 70%
Pharmaceutical Manufacturers 60% 40%
Source: Pprimary interviews conducted during the course of this study in May 2014
While there is not enough market data at the moment to authoritatively analyse the drivers behind this
trend, insights from industry practitioners seem to provide a few hypotheses. These can be analysed
further once more market and financial data becomes available in Nepal; but are only suggested as
broad possibilities in this report due to lack of sufficient data.
One of the key hypotheses proposed for this trend was that most tertiary hospitals are set up by
corporate groups with existing and well established construction and manufacturing businesses, and
promoters have preferred to channel profits from these existing operations into setting up healthcare
businesses. It was suggested that due to low know-how around capital structuring and business
valuation, it is possible that promoters do not fully understand the real cost of equity which is much
higher than debt. Another hypothesis proposed was that procuring long term debt from a bank usually
requires businesses to have a high degree of transparency and accountability which many tertiary
hospitals may not already have in their organisational structures. For such businesses, debt
procurement might seem like an unnecessary hassle when equity is easily available.
Healthcare company promoters who prefer institutional equity often do so for strategic reasons
like accessing better technology, improving brand value and enhancing management capacities
As described above, among the larger healthcare players – tertiary hospitals seem to prefer equity-
heavy structures and pharmaceutical companies tend to prefer debt-heavy structures. Not surprisingly,
even amongst promoters who prefer equity seemed to do so for the “non-financial” value-add it created;
and sought access to technology and enhanced brand value and management capacities as key
contributions expected from an equity investor as shown in Figure 45.
154
Venture Intelligence and Intellecap analysis, 2014 155
Ranges have been used instead of median value due to the small size of the sample set
Dolma Development Fund Page 85
Figure 45: Typical healthcare business promoter preferences in capital structures
Source: Primary interviews conducted during the course of this study in May 2014
10. Valuation Trends in Healthcare Businesses
Enterprise valuation in Nepal can often be challenging because – (a) there is limited historical
data; (b) there is a lack of adequate industry benchmarks, and (c) the use of comparable data
from SAARC countries is only partially adequate.
There is little public information available on past equity investments into healthcare companies in
Nepal. The lack of data is primarily due to infancy of the investment value chain and support
infrastructure such as research and ratings. Further, sparse research coverage of capital markets in
Nepal has resulted in limited availability of historical data and limited access to updated industry
benchmarks.
However, the investment landscape is witnessing brisk activity, with 2-3 institutional investment funds
setup over the last three years. The status of investment landscape presents an opportunity for early
entrants into the venture capital space in Nepal to make investments at lucrative valuations.
In the absence of adequate industry benchmarks relevant proxy, comparable data and hurdle
rate methods may be used to guide valuation
Since adequate industry benchmarks from Nepal are not easy to access; valuation data from
comparable countries like India, Sri Lanka, Bangladesh and Pakistan may be used as broad guides by
investors. These countries are comparable because like Nepal, they have poorly developed public
healthcare infrastructure and disproportionately high spend private out-of-pocket expenditure on
healthcare. Additionally, these countries are also witnessing a rise in incidence of NCDs leading to a
double disease burden much like Nepal. At the same time, countries like India have much higher
market capitalisation and better investment value chains, and have several publically listed and traded
healthcare companies. Hence, even though some comparable valuation ratios can be used from these
countries, they can at best be broad guides since the regulatory regimes, banking infrastructure, market
capitalisation and other macro-economic indicators vary widely from country to country.
In absence of consistent data on valuation ratios in the sector, hurdle rate can also serve a good
indicator of minimum returns expected from investments in the healthcare sector. The two benchmark
Dolma Development Fund Page 86
rates considered for the analysis include (a) Cost of Equity and (b) Weighted Average Cost of Capital
(WACC) for a given financing mix of equity and debt.
10.1 Comparable Valuations in India and SAARC Countries
Valuation multiples from comparable countries like India, Bangladesh, Sri Lanka and Pakistan may be
used as broad indicators by investors evaluating opportunities in healthcare companies as shown in
Table 12. Data from comparable countries has been used due to inadequacy of public data on valuation
trends in Nepal. Countries like India, Bangladesh, Sri Lanka, Indonesia and Pakistan are found to
comparable because – (b) the public health infrastructure is adequate in these countries as in Nepal; (b)
out-of-pocket private expenditure is high; and (c) patterns of disease burdens show similarities with rise
of NCDs observed across all these countries.
Table 12: Median of valuation multiples of some listed healthcare companies from SAARC countries
Sub-Sector ROE % EV/ EBIDTA
EV/Sales PBV
Tertiary hospitals 19.3% 7.1x 1.5x 1.9x
Pharmaceutical manufacturers
20.5% 9.7x 2.2x 3.1x
Source: Data for valuation multiples is based on financial statements of publically traded
companies in India, Bangladesh, Sri Lanka, and Pakistan. The specific value represented
here is the median of multiples of several companies – the details can be accessed in Section
11.5.3 in the Annexure. Information on financial statements was accessed from Capital IQ,
Bloomberg and MoneyControl databases in March 2014.
Note: Due to limited size of sample set, this should only be taken as a broad guide to
valuation multiple ranges. Specific valuation multiples may differ significantly from company to
company.
10.2 Estimating Hurdle Rate for Healthcare Businesses in Nepal
Hurdle rate is proposed as an indicator of minimum expected return from investments in tertiary
hospitals and pharmaceutical manufacturers
In absence of consistent data on valuation ratios in the sector, hurdle rate can serve a good indicator of
minimum expected return from investments in the sector. The two benchmark rates considered for the
analysis include (a) Cost of Equity and (b) Weighted Average Cost of Capital (WACC) for a given
financing mix of equity and debt. Finance literature offers multiple methods of calculating the hurdle
rates; the current report uses the Damodaran Model (refer to annexure). As Nepal’s investment value
chain is in early stages of its development, investors may seek premium for illiquidity and size of the
investments.
Cost of Equity in tertiary hospitals is 17 to 19%; and in pharmaceutical companies is 32% to 37%
Based on the data from the healthcare sector in Nepal and comparable proxies, the Cost of Equity for
investments in tertiary hospitals is estimated to vary from 17% to 19%; and Weighted Average Cost of
Capital is estimated to be 14% to 16%. The Cost of Equity in pharmaceutical manufacturing is 32 to
37%; and the Weighted Average Cost of Capital is 16 to 19%. The key assumptions for the estimations
are listed in Table 13 and ranges for Cost of Equity are presented in Table 14.
Dolma Development Fund Page 87
Table 13: Key assumptions taken to calculate WACC in healthcare companies in Nepal
Parameter Assumptions
Market value of Debt (D)
The capital structure in the healthcare segment varies across tertiary hospitals and pharmaceutical manufacturers, and the data for debt component presented in Table 11 has been used.
Market Value of Equity (E)
The capital structure in the healthcare segment varies across tertiary hospitals and pharmaceutical manufacturers, and the data for equity component presented in Table 11 has been used.
Tax rate Corporate tax rate of 25% has been taken156
Cost of debt in Nepal
The data from major banks in Nepal such as SBI Nepal and Bank of Kathmandu has been utilised to obtain the cost of debt. The range of cost of debt has been taken at 9% to 13% for tertiary hospitals; and at 7 to 10% for pharmaceutical manufacturers as per information gathered during primary interviews conducted in the course of this study
Risk Free Rate
Taken at 9% based on the bond rates reported by Nepal Rastra Bank
Beta estimation
Beta for tertiary hospitals in frontier markets has been estimated to be 0.48; and beta for pharmaceutical manufacturers has been estimated to be 0.83 based on data analysed from comparable geographies
The beta has been levered using Debt equity ratio for healthcare companies in Nepal as shown in Table 11. The levered beta for tertiary hospitals is in the range of 0.64 to 0.73; while that of pharmaceutical manufacturers is 2.28
Market Risk Premium (Rm)
The market risk premium ranges from 13.66% to 16.25%157
Table 14: Cost of Equity across healthcare companies
Tertiary Hospital
Pharmaceutical Manufacturer
Cost of Equity (min) 17% 32%
Cost of Equity (max) 21% 37%
Source: Intellecap analysis, 2014
Two clear trends in cost of equity stand out – (a) Pharmaceutical manufacturers trade at a higher
premium due to business model challenges like high import-reliance for raw materials and high
competition from imported drugs; and (b) Tertiary hospitals trade at a lower premium due to lesser
degree of business model and systemic challenges coupled with high unmet demand for their services
and low competition
Cost of Equity and leverage are considered together to estimate the Weighted Average Cost of
Capital (WACC)158
using the formulae shown in Table 15.
156
Inland Revenue Department, Nepal statistics 157
See calculations in annexure
Dolma Development Fund Page 88
Table 15: Estimated hurdle rate for healthcare companies in Nepal
Tertiary Hospitals
Pharmaceutical Manufacturers
D/E 0.42 to 0.66 1.5
Beta Unlevered (min) 0.48 0.83
Beta Unlevered (max) 0.48 0.83
Beta Levered (min) 0.64 1.76
Beta Levered (max) 0.73 1.76
Total Equity Risk Premium 13 to 16% 13 to 16%
Risk Free Rate (min) 9% 9%
Risk Free Rate (max) 9% 9%
Cost of Equity (min) 17% 32%
Cost of Equity (max) 21% 37%
Cost of Debt (min) 9% 7%
Cost of Debt (max) 13% 10%
Tax Rate 25% 25%
Weighted Average Cost of Capital (min)
14% 16%
Weighted Average Cost of Capital (max)
16% 19%
Source: Intellecap analysis, 2014
10.3 Non-Financial Metrics used in Valuation
The most important non-financial metrics for valuation of healthcare companies are strength of
management and technical teams, robustness of operational model, brand recognition and B2B
market linkages for access to technology and expertise
Valuation of healthcare firms especially in frontier markets must take into account both quantitative and
qualitative indicators of firm value. These include “healthcare firm-level” criteria and “macro-economic
and market-level” criteria.
A small group of early stage equity investors from India were asked to evaluate the relative importance
of these valuation drivers to understand investor sentiment on this issue. Not surprisingly, investors
rated strength of management and technical teams, robustness of operational model, brand recognition
158
See Section 7.2 for details on calculation of hurdle rate
Dolma Development Fund Page 89
and use of modern technology and approaches as the most critical aspects of a healthcare business
and favourable metrics against these were likely to drive up valuation. More “systemic issues” like
regulation issues, exit opportunities, and inflation were not considered very critical and investors were
likely to make more concessions here unless there was a direct impact on revenues and profitability.
Table 16 shows a “high”, “moderate”, and “low” sorting of these criteria.
Table 16: Investor sentiment on non-financial valuation drivers in healthcare firms
Valuation Drivers Investor Sentiment on Relative Importance
High Moderate Low
Firm-Level Drivers: Internal
Management and technical team
(Governance and capacities)
Strength of operational model – margins,
scalability
USP
Brand recognition
Technology, know-how and quality
assurance processes
Market linkages with domestic and
international firms for access to technology,
expertise
Collateral and securities
SME-Level Drivers: External
Regulation – sector-level policies, legal
structures, taxation
Exit opportunities – like secondary sale,
promoter buy back and IPO
Macro-Economic and Market-Level Drivers
Political stability
FDI policies
Inflation
Source: Primary interviews and Intellecap analysis; 2014.
Note: A rating of “high” indicates that investors do not compromise on these drivers, of “moderate” indicates that they somet imes
compromise if all other critical drivers seem favourable, and “low” indicates that investors compromise almost always because they
expect these drivers to improve in the short-to-mid-term.
1. Management and technical teams
Quality and experience of the management and technical teams is the most critical aspect for private
equity investors since they are mostly betting on the team’s ability to turn a business plan into a
profitable venture. This is especially true in Nepal where the larger supporting environment for
businesses is missing; and the ingenuity, networks and skills of founding team members are called
upon to bridge this gap. Presence of a strong management and separate technical team with diverse
skillsets and clearly established roles and responsibilities will help to drive up valuation.
Dolma Development Fund Page 90
Governance and accountability practices of the management team are critical as well; especially in
cases where hospitals are run by groups of promoter-doctors who divide their time between medical
care and day-to-day management. Good governance practices like maintaining audited financials, good
book-keeping, and presence of a few external and well-reputed individuals on the Board of Director or
Advisors help to drive up valuation.
2. Strength of operational model
The strength of operating level cash flows help to determine financial state of a healthcare company,
and investors analyse these to estimate the predictability of revenue. Key metrics to measure
operational efficiency for tertiary hospitals have been presented in Table 7 and include metrics such as
number of beds and bed occupancy rates. Key metrics for pharmaceutical manufacturers include
healthy cash flows and optimal account receivable days.
Such healthy metrics indicate predictability in revenue; such that it sufficiently covers operational costs
and services debt. An operationally efficient business that shows healthy metrics as in Table 7 is likely
to have a higher valuation.
3. Unique Selling Proposition (USP) The key customer segments for investible healthcare companies include out-patients and in-patients
that are walk-ins on referrals; and the key customer segment for pharmaceutical manufacturers
includes traders, distributors, retailers and hospitals. A well-defined USP is needed in both businesses
since customers make health-outcome related choices carefully based on trust, word-of-mouth and past
track record. While tertiary hospitals face a lower degree of competition, this is especially true for
pharmaceutical manufacturers which often compete with foreign drugs in the market that can be
perceived as higher quality. A well-defined USP such as affordable prices or tie-up with a reputed
foreign firm for best in class products/services can help to drive up valuations.
4. Brand Recognition
Brand building in the healthcare market is complex because end consumers often make purchase
decisions based on influence of either a third-party like a doctor or driven by more nebulous influences
like word-of-mouth. Hence, both tertiary hospitals and pharmaceutical manufacturers that invest in
multi-pronged brand building efforts are more likely to have higher valuations. Tertiary hospitals
especially must be careful to avoid basing brand-building exercises entirely on individual doctors since
this strategy is not sustainable in the long term.
5. Technology, know-how and quality assurance processes
The use of modern technology, know-how and quality assurance processes (like ISO 9001 certification
for instance) are critical to attracting consumers as well as building a recognised and trusted brand in
the market. Unlike other sectors, operational errors resulting from poor technology and ill-trained staff
have high repercussions in the healthcare sector, and even a single incident resulting from these can
render a business unviable. Hence, tertiary hospitals and pharmaceutical manufacturers that invest in
these areas are likely to have higher valuations since private equity investors are able to have greater
confidence in their ability to deliver consistent high-quality services.
6. Market linkages with domestic and international firms for access to technology and expertise
Since use of modern technologies and processes is critical for long term growth of healthcare
businesses, B2B linkages that enable dependable and attractively-priced access to these are also likely
to drive up valuations. This is especially important when it comes to technology since most equipment is
imported from foreign companies, and predictability in maintenance and supply of spare parts is a pre-
requisite. Additionally, these foreign companies must also be willing to train domestic staff in handling
and care of machinery.
Dolma Development Fund Page 91
Aside from technology, tertiary hospitals can also benefit from linkages with foreign hospitals for access
to know-how and expertise. Not only do these increase quality of service delivery, but the brand value
of the domestic hospital increases as a result of tie-ups as shown in Table 3.
Finally, tertiary hospitals and domestic pharmaceutical manufacturers will also benefit from establishing
strong buyer-supplier partnerships; and also from working with health-IT firms for access to software
technology like Hospital Management System (HMS) that automates and standardises day-to-day
managerial functions.
7. Collateral and securities
The availability of collateral and securities with a healthcare company helps to gauge financial health,
and also services to mitigate risks for an equity investor. Securities like debt funding and owner’s equity
can contribute to driving up a firm’s valuation; while collateral in addition to this direct influence is also a
signal to the equity investor that the healthcare firm can raise debt financing to grow. This is especially
critical for tertiary hospitals that are almost entirely financed by equity and can bring in greater debt
component for better valuation.
8. Regulation – sector-level policies, legal structures, taxation Facilitative government policies like encouraging FDI and ease of doing business increase healthcare
valuation, while inhibitory policies decrease valuation. Section 4.3 explains the current impact of
different government regulations on enterprise value and operations. The current regulatory regime is
likely to either drive up valuations or have minimal impact; but negative impact does not seem likely.
9. Exit opportunities – like secondary sale, promoter buy back and IPO
Clarity on potential exit opportunities is important as well. The secondary sale value-chain in Nepal is
underdeveloped159
so the only two strong possibilities that investors have are promoter buy-back and
trade sales. Thus far, no track-record of secondary exits or public listing is available, and early entrants
in the private equity field in Nepal may have to plan for longer investment time-period than in more
mature markets. This could drive down valuations due to higher risk perceptions.
10. Political stability Confidence in the macroeconomic environment and political stability drives up firm valuations as it gives
financiers confidence that the business environment for their portfolio will remain reasonably conducive,
and at the same time their investment will be protected. Since Nepal has only regained political stability
over the past 6-7 years, investors are likely to attach greater risk premium to opportunities they evaluate
as shown in Table 15.
13. FDI policies
Long-term regulatory stability around FDI policies is likely to drive investments at greater valuation since
investors can be confident that they will have the freedom to exit a business when it is most lucrative for
them to do so. The recent decision by NRB to disallow FDI in commercial banking could potentially
drive investors to attaching a higher risk premium. However, on the flipside the government and
regulator have stated their intention to support greater FDI inflows, and in a March 2014 address, NRB
Governor indicated that domestic banks and financial institutions are able to provide supplementary
capital to foreign investors. Approaches like this would give more confidence to investors and drive up
valuations.
14. Inflation
159
See Section 7 for details
Dolma Development Fund Page 92
Nepal reported an inflation rate of 9.72% in January 2014, and both the current rate of inflation as well
as historic trends compare unfavourably to other SAARC countries as shown in Figure 46. This degree
of inflation could potentially decrease value of earnings for investors and in turn reduce the P/E ratio. In
order to build a cushion against this, investor may consider addition risk premium and this may in turn
drive down valuations.
Figure 46: Comparison of inflation rate (%) in Nepal with selected SAARC countries
Source: World Bank Development Indicators database, accessed in March 2014
11. Annexure
11.1 Demand and Supply Assessment Methodology
In the hospital sub segment the demand was calculated on the basis of number of hospital beds
per 1000 people. This metric was further compared with countries like India, Bangladesh, Sri
Lanka and Pakistan to analyse the need gap. The primary source of data for the analysis was
health indicators published by World Bank, WHO, IFC.
For sub segments such as pharmaceuticals and diagnostic centres the primary sources of
information were industry reports and primary interviews.
Supply of services and drugs were estimated based on information from government data,
industry reports and indicators published by World Bank and WHO.
11.2 Calculation of Hurdle Rate
Cost of Equity and leverage are considered together to estimate the Weighted Average Cost of
Capital (WACC) using the formulae shown in Figure 47 and Figure 48.
Figure 47: Formula for calculating WACC
Where -
D: Market value of Debt, E: Market Value of Equity, Tax rate: corporate tax rate in Nepal,
0
5
10
15
2009 2010 2011 2012
Nepal India Bangladesh Sri Lanka
Dolma Development Fund Page 93
Kd: Cost of debt in Nepal, Ke: Cost of equity calculated by the formula:
Table 17 shows the inputs used to arrive at the market opportunity for private healthcare industry in
Nepal.
Table 17: Inputs used to calculate market opportunity in healthcare sector
Sub-sector Inputs to market sizing160
Estimated market size
Pharmaceuticals
48% of out-of-pocket private expenditure on healthcare
in Nepal constitutes of spending on medicines and other
pharmaceutical products161
US$ 115 to 130 million
Delivery of tertiary care
10% of total private out-of-pocket private expenditure at household level is spent on tertiary hospitals
162
US$ 55 to 65 million
11.4 Investment Markets in Nepal and Impact on SME Valuation
11.4.1 Overview of Capital/Investment Market in Nepal
Role of capital in economic growth for any country is universally accepted and the fluctuations in the
index of capital market could be seen as the barometer of economic performance. The capital markets
in Nepal are sustained by the shares of banks, financial institutions and insurance companies that
contribute to over 75% of the market capitalisation163
. There is minimum presence of real sector in the
capital market in Nepal but off-late there is an increasing presence of hydropower companies on the
stock exchange.
The Nepal stock market or NEPSE since its establishment in 1992-93 has seen the number of
companies listed in 1994 at 66 to 230 companies in 2013164
. Despite the increase in the number of
listed companies, it is estimated that only 10% of the companies registered on Office of the Company
Register are listed on NEPSE165
. This in turn could indicate that firms in Nepal tend to avoid stock
market as an alternative source of long-term capital166
.
Primary capital market in Nepal is quite diversified and securities such as Debentures, Ordinary Share
and Right Share are used for training the market place. Out of the total approvals for public issues in
2013 as shown in Table 18; 30 companies got approvals for initial public offering (IPO) of NRs. 3113.49
million a substantial increase of over 130% on the amount when compared with the previous year.
Political stability and institutional support was considered as the key reason for the spurt of activity in
the primary capital markets in Nepal.
160
Only private sector spending has been taken into account for market sizing 161
Government of Nepal, Ministry of Finance, Nepal National Health Accounts, 2003/04 to 2005/06 162
Government of Nepal, Ministry of Finance, Nepal National Health Accounts, 2003/04 to 2005/06 163
Nepal stock exchange website 164
Nepal stock exchange website 165
Department of industry, Industrial statistics 2012-13 166
Stock Market Development and Economic Growth report, Dr. Udaya Raj Regmi, 2012
Dolma Development Fund Page 95
Table 18: Primary approval issued by SEBON for the FY 2012/13
Source: NEPSE Annual report 2012-13
The general investors in Nepal are still are attracted only toward primary shares. The fact that initial
public offering (IPO) is listed many times more than that invited by the companies making IPO in the
primary markets but the transactions in the secondary market is very low. This in turn shows the lack of
awareness about capital market and trading in general in Nepal.
Trading in secondary markets in Nepal is a major challenge due to high trading and transaction costs,
long duration of settlements and lack of reliability in the transactions.
11.4.2 Nepal Investment Market Valuation and Key Drivers
The three key parameters to measure the capital market development for Nepal have been discussed
briefly below. They are a) Market Capitalisation Ratio (MCR), b) Total Value Traded Ratio (TVTR) and
c) Turnover Ratio (TR)
In terms of Market Capitalisation Ratio (MCR), Nepal ranks the third best in the SAARC region after
India and Sri Lanka. However the MCR in Nepal is very low in comparison to the world average and
India as shown in Figure 49. A lower MCR in Nepal indicates that the stock market is yet to show its
impact on the economic activities of the country.
Figure 49: Market Capitalisation Ratio (MCR) for SAARC countries
Data Source: World Bank Development Indicators database, accessed in March 2014
76% 68%
29% 22% 19%
15%
World Avg India Sri Lanka Nepal Pakistan Bangladesh
Market capitalisation of listed companies as % of GDP
S. No Types of
Securities FY 2012-13 FY 2011-12
No of
Issues
NRs In
Million
No of
Issues
NRs In
Million
1 Debenture 7 3550 3 1200
2 Ordinary Share 30 3114 15 1298
3 Right Share 5 3939 7 452
Total 42 10602 25 2950
Dolma Development Fund Page 96
Total Value Traded Ratio, as a market liquidity indicator, shows that Nepal has one of the lowest values
of shares traded in the world when compared to its GDP as shown in Figure 50. This indicates the
illiquidity in secondary markets in Nepal and that trading is very costly and difficult. One of the key
reasons for increased cost of trading is the reliance on legacy based data systems for trading and
absence of an online platform for trading.
Figure 50: Total Value Traded Ratio (as % of GDP) in SAARC countries
Data Source: World Bank Development Indicators database, accessed in March 2014
The next measure of stock market development Turnover Ratio shows that Nepal has one of the lowest
total values of shares traded to the average market capitalisation as shown in Figure 51. This indicates
that trading and transaction costs are high in Nepal and buying and selling of shares in secondary
markets is very difficult. Of all the three parameters, there are ample opportunities for Nepal to develop
its capital markets fast by increasing turnover ratio even though market capitalisation is very low.
Figure 51: Turnover Ratio in SAARC countries
Data Source: World Bank Development Indicators database, accessed in March 2014
A comparison with the present stock market development indicators in Nepal with the Indian stock
markets just after the liberalisation era in 1991-92 shows some similarity in the two stock markets. India
has come a long way on secondary capital markets in the last two decades as shown in Figure 52.
Nepal could witness the same pace of growth given the requisite institutional framework and investor
friendly eco-system is put in place. Allowing foreign institutional investors to trade in secondary markets
in Nepal could put the country on fast track development in capital markets.
70%
33.5%
10.8% 5.3% 2.8% 0.3%
World Avg India Bangladesh Pakistan Sri Lanka Nepal
Total value of stocks traded as % of GDP, 2012
100%
61.2% 54.6%
31.3%
9.2% 1.2%
World Avg Bangladesh India Pakistan Sri Lanka Nepal
Turnover ratio (%) of stocks traded in 2012
Dolma Development Fund Page 97
Figure 52: Comparison of capital market development in Nepal with India
Data Source: World Bank Development Indicators database, accessed in March 2014
The key drivers that would facilitate the trading volumes in the secondary markets in Nepal are - a)
introduction of reliable online trading system making trading affordable b) settlement of transactions to
be shortened to a few days from the present duration that could last for few weeks and c) with higher
GNIs per capita and increasing literacy levels emergence of a social class that is aware of the benefits
of wealth creation through the secondary markets d) an expected long-term political stability would
boost the confidence of investors to invest in the capital markets.
11.5 Miscellaneous
11.5.1 Legal Structures for Businesses in Nepal
Table 19: Legal Structures available to Businesses in Nepal
Structure Description Implications for financing
Sole Proprietorship
Only 1 shareholder allowed, registered with the Department of Cottage and Small-Scale Industry
Cannot issue shares or debentures and hence cannot take in equity investments
Private Limited (Pvt. Ltd.)
1 to 50 shareholders can register a Pvt. Ltd. company with the Office of the Company Registrar under the Companies Act. A company that intends to trade also needs to register with the Department of Commerce.
Can issue different types of shares and debentures with limited liability to shareholder; and hence is an appropriate structure for equity investments
Public Limited (Ltd.)
At the time of incorporation 7 shareholders can register a Ltd. company, but the actual number of shareholders should exceed 51. Also registered with the Office of the Company Registrar under the Companies Act. A company that intends to trade also needs to register with the Department of Commerce.
Can issue different types of shares and debentures with limited liability to shareholder; and hence is an appropriate structure for equity investments, and can also raise capital from public markets.
Cooperative Minimum of 25 members can register a Can issue shares and debentures and
22% 22%
68%
7.10% 0.3%
33.50% 36.70%
1.2%
54.60%
India in 1992 (liberlization era) Nepal in 2012 India in 2012
Market capitalization of listed companies (% of GDP)Stocks traded, total value (% of GDP)Stocks traded, turnover ratio (%)
Dolma Development Fund Page 98
Structure Description Implications for financing
Cooperative under the Cooperative Act. net profits are distributed to members after retaining 25%; however dividend cannot exceed 15% of the paid up capital per share. This is a less appropriate legal structure for equity investors expecting a market rate of return.
11.5.2 Glossary of Terms
11.5.3 Comparable Valuation Multiples from SAARC Countries
Table 20: Long list of comparable valuation multiples from SAARC countries
Sub-Sector: Tertiary Hospitals
Company ROE % EV/EBIDTA EV/Sales PBV
India
Indraprastha Medical Corporation 16.16% 0.51 3.96 1.76
Disability Adjusted Life Years
Measure of overall disease burden, expressed as the number of years lost due to ill-health, disability or early death
Double burden of disease
This is when a defined geographic area needs to deal with old communicable disease issues as well as modern non-communicable diseases
Invasive diagnostics Involves puncture of skin or tissue; or insertion of an instrument or foreign material into the body to collect organic sample for analysis. Typically requires laboratory and trained staff
Non-invasive diagnostics
No puncture or penetration of body is involved; instead data like pulse rate, imagery is used to diagnose health conditions
Primary healthcare Essential health care based on practical, scientifically sound, and socially acceptable method and technology which is universally accessible to all in the community at an affordable cost
Secondary healthcare Consultative clinical and preventative healthcare facilities having in patient care provisions along with general surgery, consultations, diagnostics services
Tertiary healthcare
Specialised care is provided usually on referral from primary or secondary medical care personnel. Tertiary health facilities can be single or multi-specialty with inpatient provisions and include services like super specialty consultations, treatments using advance healthcare amenities
Years of life lost Estimate of the average years a person would have lived if he or she had not died prematurely
Dolma Development Fund Page 99
Kovai Medical Centre and Hospital 77.05% 2.11 0.51 -
Fortis Malar Hospitals 138.10% 3.42 0.40 -
Dr. Agarwals Eye Care 24.76% 3.40 0.42 1.86
Lotus Eye Care Hospital 0.33% 2.61 0.41 0.33
Regency Hospitals 16.16% 0.51 3.96 1.76
KMC Speciality Hospitals 77.05% 2.11 0.51 -
Bangladesh
Samorita Hospital - - - 1.17
Sri Lanka
Asiri Hospital holdings 19.34% 9.79 3.21 2.18
Lanka hospital corporation 15.77% 13.41 2.33 2.29
Nawaloka Hospitals 9.89% 7.66 1.59 1.10
Indonesia
PT Siloam International Hospitals - 40.75 4.85 -
Pakistan
Shifa International Hospitals Limited 21.09% 7.56 1.38 2.89
Sub-Sector: Pharmaceutical Manufacturers
Company ROE % EV/EBIDTA EV/Sales PBV
India
Ipca Labs - 12.44 2.84 -
Torrent Pharma 28.45% 9.70 2.22 5.41
Dr. Reddys 26.75% 15.94 3.56 5.58
Bangladesh
Square Pharmaceuticals Ltd 23.55% 15.44 4.63 3.84
Beximco Pharma 7.94% 7.34 2.14 0.85
Reneta Pharma - - - -
Activefine Chemicals (API) - - - 4.65
Beacon Pharma - - - 1.10
Pakistan
Ferozsons Laboratories 16.78% 7.10 1.58 1.64
Highnoon Laboratories 17.40% 7.47 0.84 2.39
Source: Data for valuation multiples is based on financial statements of publically traded companies in India, Bangladesh, Sri
Lanka, and Pakistan. Information on financial statements was accessed from Capital IQ, Bloomberg and MoneyControl databases
in March 2014.
Note: Due to limited size of sample set, this should only be taken as a broad guide to valuation multiple ranges. Specific valuation
multiples may differ significantly from company to company.
Dolma Development Fund Page 100
11.6 References and Field Research Data
The organisations interviewed during the course of this study have been listed in Table 21.
Table 21: List of primary interviews
Organisation Sector
Healthcare associations
Nepal Medical association Healthcare
Private Sector Organisations
Rhododendron Biotech Pvt. Ltd Pharmaceuticals
Quest Pharma Pharmaceuticals
Vayodha Hospital Hospital
Advanced Polyclinic Polyclinic chain
Annapurna Hospital Hospital
Grande International hospital Hospital
Norvik Hospital Hospital
Health at Home Hospital
Sidhi Poly Path Lab Diagnostic centre
MIDas Technologies Healthcare IT services provider
The references used in this study are as follows:
1. Annual Report, Department of Health Services, Government of Nepal; 2012
2. World Bank Development Indicators; accessed in March 2014
3. Nepal Pharmaceutical Country Profile; MoHP; 2011
4. World Bank Development Indicators; accessed in March 2014
5. Nepal Living Standards Survey, Volume 2; Central Bureau of Statistics; 2011
6. Trade and Export Promotion Centre Nepal database, accessed in March 2014
7. Annual Report 2011-12, Department of Health Services, Government of Nepal
8. Nepal’s Export-Import Database; accessed in March 2014
9. GapsCo website
10. Export-Import Database Nepal; accessed in March 2014
11. National Society for Earthquake Technology-Nepal website, accessed in May 2014
12. United Nations Office for the Coordination of Humanitarian Affairs, Preparing for an Earthquake
in Kathmandu Valley, 2013
13. Ministry of Industries, Industrial Statistics Report, Nepal, 2012-13
14. Institute for Health Metrics and Evaluation, Global Disease Burden Profile: Nepal, 2010
15. Bain and Company Inc., India Private Equity Report, 2013
16. World disposable medical supplies report, 2012
Dolma Development Fund Page 101
The survey questionnaires used in this study are as follows:
Section A. Understanding landscape of healthcare industry
1. Please mention the approximate distribution of patients across the following facilities:
Facilities % patients who prefer government facilities
% patients who prefer private (for-profit) facilities
% patients who prefer NGO facilities
Primary healthcare
Secondary healthcare
Tertiary healthcare
Diagnostic industry
2. Rate the following industries in Nepal as “high”, “medium”, “low” for each of the following parameters
Sub-Sectors
Rank for Growth Potential (High/ medium/low)
Rank for profit margins (High/ medium/low)
Rank for organised activity (High/ medium/low)
Rank for competition (High/ medium/low)
Primary healthcare
Secondary healthcare
Tertiary healthcare
Diagnostic industry
Pharmaceutical industry
3. Please select the approximate range of profit margins for various sub sectors as per different
sizes and specialisations:
Range of profit margin Less than 5%
5 to 10% 10 to 15% 15% to 20% More than 20%
Primary clinics ☐ ☐ ☐ ☐ ☐
Chain of primary clinics ☐ ☐ ☐ ☐ ☐
Secondary hospitals ☐ ☐ ☐ ☐ ☐
Tertiary hospitals with single speciality
☐ ☐ ☐ ☐ ☐
Tertiary hospitals with multi specialities
☐ ☐ ☐ ☐ ☐
Diagnostic centres ☐ ☐ ☐ ☐ ☐
Pharmaceutical companies
☐ ☐ ☐ ☐ ☐
4. Please mention the approximate annual turnover, capacity, and utilisation of capacity for the
various sub sectors in Nepal
Sub-Sectors ~Annual turnover
Capacity- description
Capacity % utilisation of capacity
Primary healthcare # of patients
that can be treated in a day
Secondary healthcare # of hospital
beds
Dolma Development Fund Page 102
Tertiary healthcare # of hospital
beds
Diagnostic industry # of patients
that can be tested in a day
Pharmaceutical industry Production
capacity
5. How is the overall policy and regulatory environment? In what ways does it support growth of
businesses and in what ways does it negatively impact growth. Please select any of the following
that apply.
Impact of regulation/policy Applies to healthcare businesses in Nepal (select all that apply)
a) High upfront setup costs due to licences ☐
b) Difficulty in acquiring land ☐
c) Competition with government subsidised healthcare ☐
d) Building rules and regulations ☐
Any others? – Please explain
Section B. Understanding barriers to growth of private hospitals in Nepal
6. Rate the following challenges as “high”, “medium” or “low” based on the degree to which they act as
barriers to growth (with “high” ranking indicating a critical growth barrier and “low” a less important
growth barrier).
Challenges High Medium Low
Access to Finance ☐ ☐ ☐
Access to markets ☐ ☐ ☐
Access to technology ☐ ☐ ☐
Access to skilled doctors/trained paramedic staff
☐ ☐ ☐
Taxation ☐ ☐ ☐
Regulation ☐ ☐ ☐
Infrastructure: road, electricity, transport ☐ ☐ ☐
Corruption ☐ ☐ ☐
Any other challenges you would like to mention?
Section C. Understanding access and use of capital
7. Which type of capital do healthcare companies prefer and why? Please rate “high”, “medium”, and
“low” (with “high” ranking indicating most preferred and “low” least preferred).
Capital Type High Medium Low
Debt (bank loans, NBFC loans, venture debt) ☐ ☐ ☐
Domestic Equity (raising money from local investors by selling a stake in your company)
☐ ☐ ☐
Foreign Equity (raising money from international investors by selling a stake in
☐ ☐ ☐
Dolma Development Fund Page 103
your company)
Why?
(Please explain your preference for debt/ domestic equity/ foreign equity briefly)
8. Which of the following do you see as the most important contribution by an equity investor? Please
rate “high”, “medium”, and “low” (with “high” ranking indicating most important and “low” least
important).
Contribution by equity investor High Medium Low
Access to new technology, new approaches to healthcare
☐ ☐ ☐
Management expertise ☐ ☐ ☐
Add financial value only ☐ ☐ ☐
Help to unlock capital for you by divesting or diluting company
☐ ☐ ☐
Help in accessing international growth opportunities
☐ ☐ ☐
9. Which of these following financing needs do hospitals prefer to use debt for and which do they
prefer to use equity for? Please tick in the appropriate column
Financing need Prefer debt Prefer equity No Preference