34
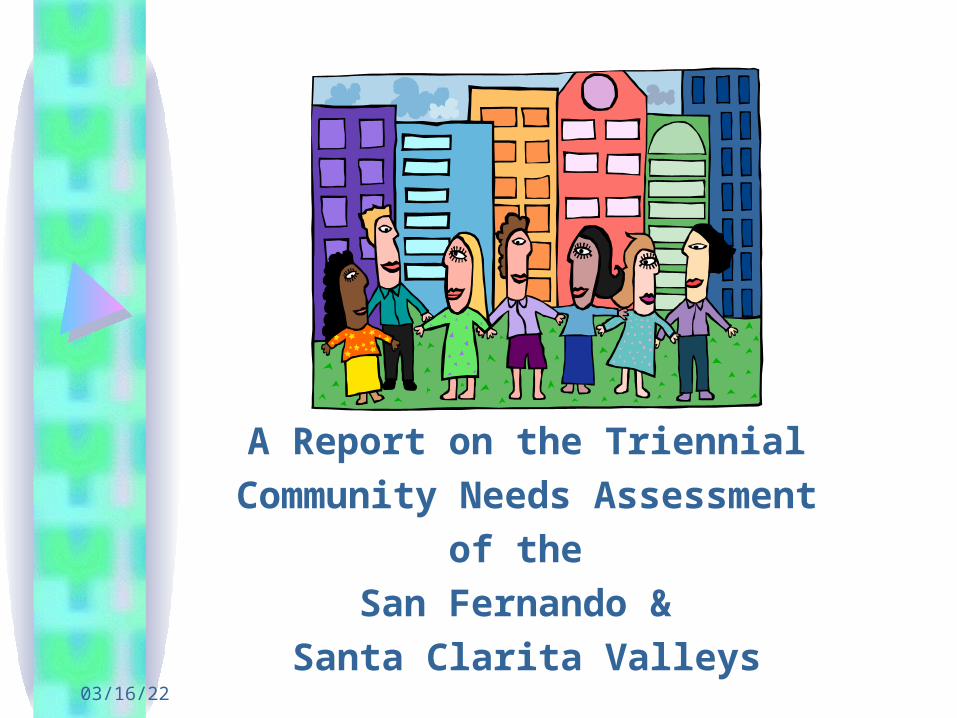
03/16/22 A Report on the Triennial Community Needs Assessment of the San Fernando & Santa Clarita Valleys
| Date post: | 31-Dec-2015 |
| Category: |
Documents |
| Upload: | quynn-petersen |
| View: | 37 times |
| Download: | 0 times |
04/19/23
A Report on the Triennial
Community Needs Assessment
of the
San Fernando &
Santa Clarita Valleys
04/19/23
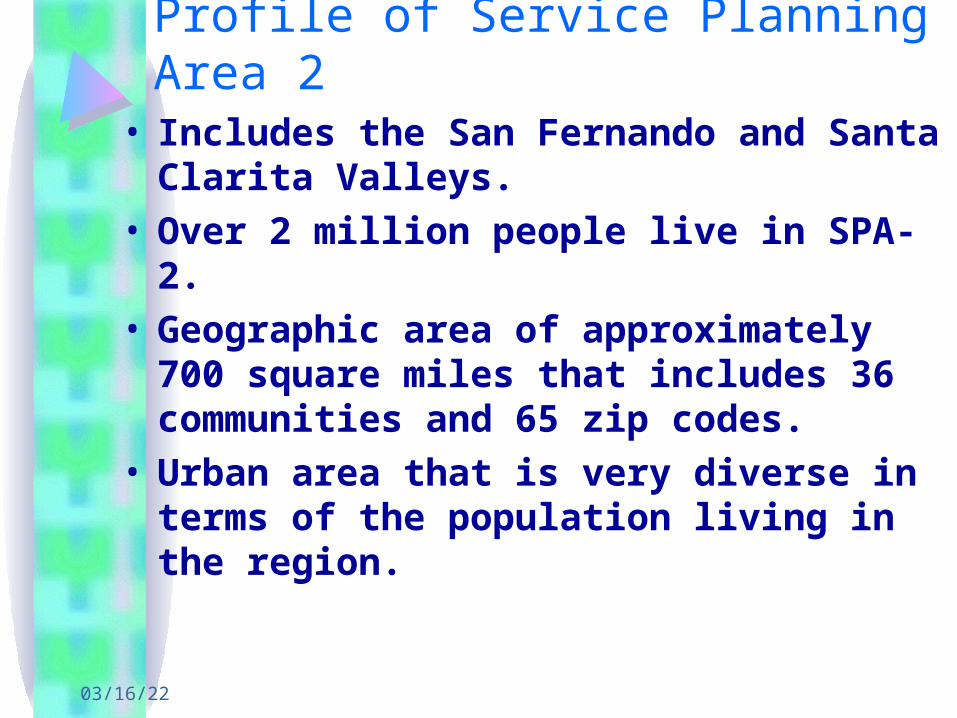
Profile of Service Planning Area 2• Includes the San Fernando and Santa Clarita
Valleys.• Over 2 million people live in SPA-2.• Geographic area of approximately 700
square miles that includes 36 communities and 65 zip codes.
• Urban area that is very diverse in terms of the population living in the region.
04/19/23

04/19/23
Overview of the Community Needs Assessment
• Third collaborative assessment.• Included over 60 organizations participating:
– Not-for-profit and public hospitals– Community based organizations– Schools– Clinics– Governmental agencies– Social service organizations
• Funding to support the project provided by Kaiser Permanente, Partnership for the Public’s Health and CHW-Northridge Hospital Medical Center, Roscoe Campus

04/19/23
Overview of the CNA• Applied planning model called MAPPs
(Mobilizing for Action through Planning and Partnerships) developed by the CDC and NACCHO to guide the assessment process.
• Incorporated both primary and secondary data sources.
• Data collected around 5 key target groups:– Children (0-17 years)
– Adults (18-64 years)
– Seniors (65+ years)
– Low Income and Uninsured
– Special Needs Populations

04/19/23
Asset Mapping Project• As part of the community needs
assessment, community assets and resources were identified in SPA-2 serving the targeted population groups.
• There were 118 programs that responded to the asset mapping survey.
• The programs and services were mapped and compared to the target population served by these programs to try and identify potential gaps in SPA-2.

04/19/23
0 5 10
miles
SPA 4Metro
SPA 2San Fernando
SPA 5West
SPA 8South Bay
SPA 6South
SPA 7East
SPA 3San Gabriel
SPA 1Antelope Valley
109
1044
88
6
14
113130
68
48
1
7
9
11
13
16
19
23
27
30
31
32
33
34
35
39
43
45
54
55
57
62
78
81
82
83
86
89
91
92
102
112
126
127
131
Los Angeles CountyLow-Income Population Under 200% of Federal Poverty Level
Agencies Serving Low Income Population
SPA 8Catalina Island
LAC DHS Office of Planning August 9, 2004
= Agency
Population Under 200% FPLper census tract.
0 to 500
LEGEND
500 to 1,000
1,000 to 1,500
1,500 to 2,000
Service Planning Area Boundaries
2,000 to greater
Source: Population Estimation and Projection System, 2002 LAC Urban Research Division (Poverty Estimates for 2002 based on census 2000). Agency Zip Codes provided by Valley Care Community Consortium; Agencies are mapped to the Zip Code Centroid.

04/19/23
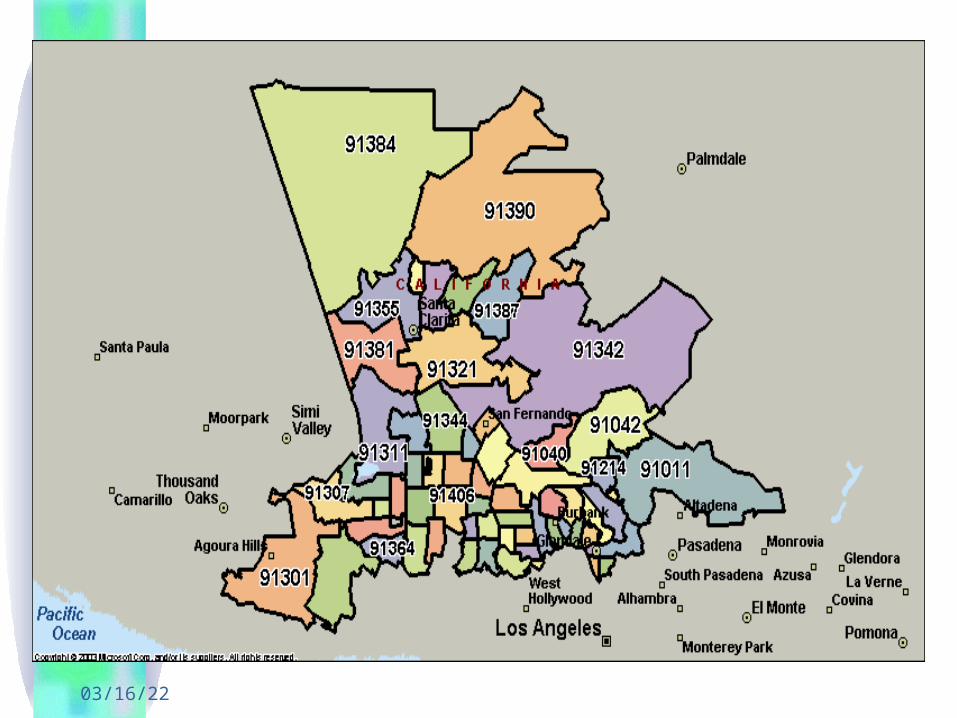
Demographic Overview of SPA-2• Size
– The San Fernando Valley has over 1.8 million people living in the region while the Santa Clarita Valley has over 217,000 people living in geographic area.
– Some of the largest population centers in the SFV include:
• Glendale• Van Nuys• North Hollywood
– In the SCV, the largest population centers include:• Canyon Country• Valencia
04/19/23
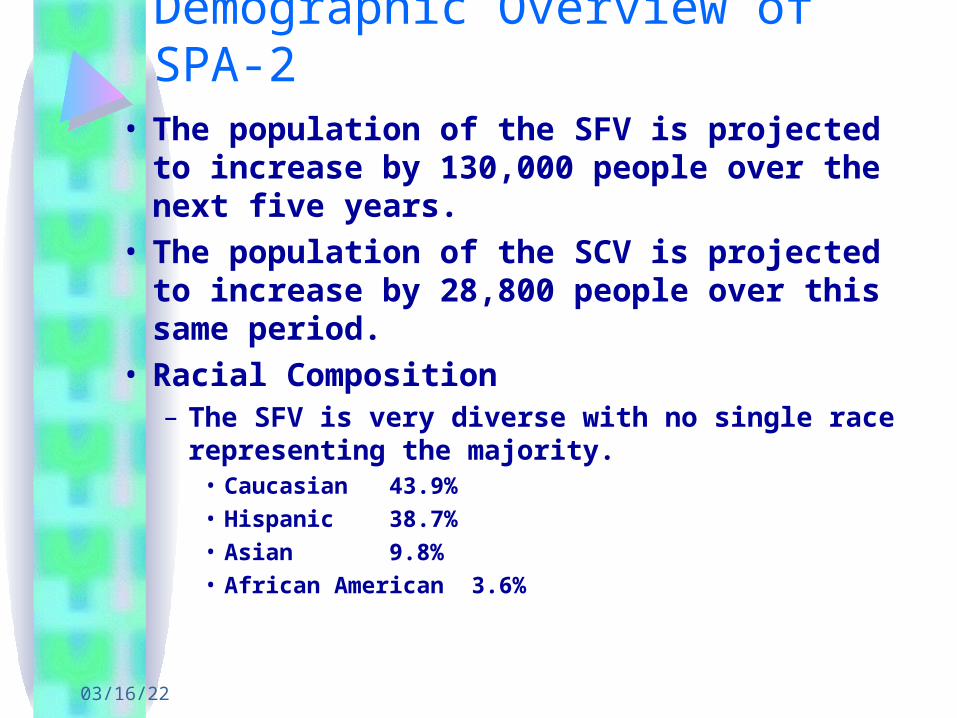
Demographic Overview of SPA-2• The population of the SFV is projected to
increase by 130,000 people over the next five years.
• The population of the SCV is projected to increase by 28,800 people over this same period.
• Racial Composition– The SFV is very diverse with no single race
representing the majority.• Caucasian 43.9%• Hispanic 38.7%• Asian 9.8%• African American 3.6%

04/19/23
Demographic Overview of SPA-2– The SCV is more homogeneous in terms of
racial composition of the population:• Caucasians 66.0%• Hispanics 21.6%• Asians 5.9%• African Americans 3.3%
• Income Levels– The SFV has a higher proportion of low income
households compared to the SCV.• Approximately 17.5% of the households in the SFV
report annual incomes below $25,000.• In the SCV 8.7% of the households report annual
incomes below $25,000.
04/19/23
Demographic Overview of SPA-2• Population by Age
– Children 0-19 years represent 28.6% of the SFV population and 32.2% of the SCV population.
– Seniors (65+) comprise over 10% of the total population of the SFV and 6.2% of the total population of the SCV.
• Educational Attainment– In the SFV approximately 23.9% of the residents 25+
have not finished high school.– In the SCV approximately 13.7% of the residents 25+
have not finished high school.– In the SFV 26.0% of residents 25+ and 25.1% of the SCV
residents 25+ have a bachelors or graduate degree.
04/19/23
Demographic Overview of SPA-2• Home Ownership
– In some communities in the SFV less than 1/3 of the residents own their home.
• Valley Village 26.3%• North Hollywood 29.1%• Glendale 30.2%• Van Nuys 31.1%
– Home ownership in the SCV is higher compared to the SFV. The community with the lowest percentage of home ownership in the SCV:
• Newhall 54.3%
04/19/23
Demographic Overview of SPA-2• Foreign Born Residents
– In the SFV, some communities have over 50% of the population that is foreign born.
• Glendale 56.6%• Panorama City 55.1%
– The SCV has fewer residents who are foreign born as a percentage of the total population. The community with the highest percentage of foreign born residents:
• Newhall 27.7%
04/19/23
Primary Data Collection• Undergraduate and graduate students from
California State University, Northridge conducted in person and phone interviews.
• Interviews were conducted with community stakeholders serving the targeted population groups:– Children– Adults– Seniors– Poor and Uninsured– Special Needs Populations

04/19/23
Primary Data Collection• Total of 79 interviews were completed.• Some of the key information collected from these
interviews included:– The greatest barriers to accessing services include
lack of funding and financial support, transportation, and lack of knowledge or awareness that the services exist.
– Referrals, networking, and outreach are the most common ways that organizations collaborate and work together in SPA-2.
– There needs to be improvement in cultural competency among organizations in SPA-2.
– Language, literacy and cultural issues have an impact on accessing services.

04/19/23
Primary Data Collection• Some of the key needs and issues identified
from the interviews included:– Access to primary and specialty medical services.
– Access to affordable health insurance.
– Affordable mental health services.
– Improvement in public transportation services.
– Better knowledge and awareness regarding programs and services available in SPA-2.
– Childhood obesity.
– Affordable dental care.
– Lack of funding to expand capacity of programs.
– Personal development & counseling programs.

04/19/23
Children• Children comprise 28.6% of the population of
the SFV and 32.3% of the population of the SCV.
• Approximately 27,000 children in SPA-2 have no regular source of medical care.
• There are an estimated 44,000 children in SPA-2 who don’t have health insurance.
• The main reasons why children were hospitalized in SPA-2 include:– Neonate with significant problems– Psychoses– Bronchitis and asthma

04/19/23
Children• Main conditions for children being treated
in hospital emergency departments:– Acute Upper Respiratory Infection
– Otitis Media
– Noninfectious Gastroenteritis
• Approximately 45,000 children in SPA-2 have asthma.
• 10% of the infants born in SPA-2 were to mothers receiving late or no prenatal care.
• 18% of children in grades 5, 7 and 9 living in SPA-2 are considered overweight.

04/19/23
Children• Some of the priority needs and issues identified
from the interviews included:– Affordable health services for children.– Affordable dental services.– Programs to help combat childhood obesity.– Programs focused on personal growth and
development for adolescents.– Mental health services, especially programs serving
adolescents.– Facilities providing youth services were seen as
insufficient in SPA-2.– More prevention & wellness programs for children.– Increase parental involvement is needed.
04/19/23
Adults (18-64 years)• Adults comprise 60.8% of the population of the
SFV and 61.6% of the population of the SCV.• Approximately 24.5% of the adults in SPA-2 are
uninsured.• Within this group, approximately 18.7% report
that they have no regular source of medical care.
• An estimated 315,000 adults did not obtain dental care in the past year in SPA-2 because they could not afford it.
• 92,000 adults are diagnosed with diabetes in SPA-2.

04/19/23
Adults (18-64 years)• 37% of adults are overweight in SPA-2.
• 18.4% of the adults in SPA-2 rate their health to be fair to poor.
• Psychoses is the number three diagnosis (based on volume) why adults patients 18 to 44 years get admitted to the hospital in SPA-2 and the number one diagnosis in the SFV and number two diagnosis in the SCV for adults 45 to 64 years.
• Approximately 10% of adults have been diagnosed with depression in SPA-2.
• 15.1% of adults in SPA-2 smoke cigarettes.

04/19/23
Adults (18 to 64 years)• Top conditions treated in the emergency
department for adults 18 to 44 years:– Abdominal Pain– Respiratory/Other Chest Pain– Sprain of Neck
• Top conditions treated in the emergency department for adults 45 to 64 years:– Respiratory/Other Chest Pain– Abdominal Pain, Unspecified Site– Migraine/Headache

04/19/23
Adults (18-64 years)• Some of the priority needs and issues
identified from the interviews included:– Affordable primary and specialty medical services.– Affordable health insurance.– Improved employment opportunities.– Preventive care and wellness programs.– Better education on the programs and services
available in the community.– More health education and disease management
programs for conditions such as diabetes.– More involvement in health care decisions
including better understanding of options.

04/19/23
Seniors (65+)• Seniors comprise 10.6% of the population of
the SFV and 6.2% of the population of the SCV.• Approximately 6.5% of persons living below
the poverty level in the SFV and 5.9% of persons below the poverty level in the SCV are seniors.
• The main diagnoses why seniors were being hospitalized in SPA-2 include:– Heart failure and shock– Simple pneumonia and pleurisy– Chronic obstructive pulmonary disease
04/19/23
Seniors (65+)• Top conditions treated in the emergency
department for seniors in SPA-2:– Pneumonia, Organism– Chest Pain/Respiratory Symptoms– Urinary Tract Infection
• Approximately 73% of seniors 65+ were vaccinated for influenza in SPA-2.
• There are approximately 31,345 cases of Alzheimer’s disease and related dementia in the SFV and 1,751 cases in the SCV.

04/19/23
Seniors 65+• Some of the priority needs and issues for
seniors identified from the interviews included:– Access to affordable and reliable public
transportation services.– Lack of financial resources and limited incomes
hinders seniors’ ability to access needed services.– There is insufficient capacity with existing senior
programs in SPA-2 which is due in large part to limited funding for these programs.
– Affordable prescriptions/medications for seniors.– Expanded programs and services of all types.

04/19/23
Poor and Uninsured• Approximately 14.6% of the population in the
SFV and 6.1% of the population in the SCV live below the poverty level.– Van Nuys, North Hollywood and Glendale have the
largest numbers of people living below the poverty level in the SFV, while Canyon Country and Newhall have the largest numbers of people living below the poverty level in the SCV.
• There are an estimated 288,000 adults (18-64) who do not have health insurance in SPA-2.
• The number of children in SPA-2 without health insurance is estimated to be 44,000.
04/19/23
Poor and Uninsured• Approximately 15.5% of the population in the
SFV receive some type of public assistance while 4.7% of the population in the SCV are receiving public assistance.
• In the SFV over 322,000 children, adults and seniors receive Medi-Cal benefits while in SCV over 16,800 people receive Medi-Cal benefits.– There was a decrease in total Medi-Cal enrollment
from Oct. 2003 to Jan. 2004 of approximately 23% for the SFV.
• Persons without health insurance had the highest percentage of those having difficulty getting medical care.
04/19/23
Poor and Uninsured• Some of the priority needs and issues for the poor
and uninsured identified from the interviews included:– Affordable health insurance.– Expanded primary and specialty medical care for the
uninsured.– Reliable and affordable public transportation.– There is limited capacity in programs serving the poor
due to funding constraints.– Housing assistance programs.– Expanded community and social services for the low
income population.– Better communication and coordination between
programs serving the poor.
04/19/23
Special Needs Populations• Approximately 18.2% of adults in SPA-2 have a
disability.• The highest rates of asthma hospitalization
occurred in Sylmar, Pacoima, Reseda, Van Nuys, and Panorama City.
• Psychoses remains one of the top reasons why children and adults (18 - 64 years) are hospitalized in both the SFV and SCV.
• There are 34 mental health institutions in SPA-2. The majority of patients (41.9%) treated at these facilities were diagnosed with major depression.
04/19/23
Special Needs Populations• Some of the priority needs and issues for the
special needs populations identified from the interviews included:– Expanded mental health services, especially for those
who are low income.– Specialized medical services.– Improved community and social services for special
needs populations.– Better communication and coordination with
programs serving this population.– Expanded support groups for special needs
populations.– Programs serving special needs populations are at
capacity due to financial and funding constraints.

04/19/23
Common Themes and Major Issues• Access to primary medical services continues to
be a need identified across population groups.• Affordable health insurance continues to be a
priority need in SPA-2.• Many programs identified that they were operating
at capacity and funding was the main issue that limited how many clients they could serve.
• Hospital emergency departments continue to treat a large number of patients and remain one of the main sources of accessing medical care for the uninsured.
04/19/23
Common Themes and Major Issues– Hospital E.D. diversion hours in SPA-2 have increased
from 12,395 hours in 1997 to 46,963 hours in 2003.
• Mental health continues to be a priority need in SPA-2 that is included in the top ten inpatient DRGs (psychoses) for all age groups except seniors.
• Chronic diseases (e.g. asthma, bronchitis, diabetes) account for many of the acute care inpatient admissions in SPA-2 across age groups.
• Pneumonia remains one of the top ten reasons for hospital admissions for children, seniors and middle aged adults.

04/19/23
Common Themes and Major Issues• There needs to be better coordination,
communication, and education regarding resources and programs in the community.
• Communities that represent significant numbers of under-served and vulnerable populations in the SFV include:
Glendale North Hollywood
Pacoima Panorama City
Van Nuys
• Communities that represent a larger proportion of under-served populations in the SCV include:
Newhall Canyon Country


