50
A Review of ACI 301 Section 4, Concrete Mixtures Bill Goodloe Technical Services Manager CEMEX

A Review of ACI 301 Section 4, Concrete Mixtures Bill Goodloe Technical Services Manager CEMEX

General Scope Submittals Quality Control Products Materials Performance and design requirements Cementitious content Slump Size of Coarse Aggregate Air content Temperature Resistance to ASR Durability Sulfate resistance Freeze-thaw resistance Low permiability Corrosion protection of reinforcement Strength and w/cm Steel fiber-reinforced concrete Proportioning Standard Deviation Required average strength Documentation of average compressive strength Field records Trial mixtures
ACI 301 Section 4 Covers Concrete Mixtures and Provides Guidance for the Following:

Section 4.1.2 Submittals
• Mixture proportions • Mixture strength data used for required average strength • Concrete materials
• Cementitious materials – manufacturer, types, shipping locations, mill certificates • Aggregate – manufacturer, quarry locations, statements of compliance • Admixtures – names, types, data sheets, certificates • Water –source, if non-potable documentation on effects on strength and set time
• Field test records • Trial mixture records • Durability – document mixtures meet requirements • Resistance to ASR – document mixtures meet requirements • Mixture proportioning adjustments – document if changes requested • Concrete for floors – Table 4.1.2.9 minimum cementitious content • Calcium chloride –request to use • Volumetric batching – must request to use • Limits on discharge – request if will exceed mixer revolution limits

Section 4.1.3 Quality Control
ACI 301 provides very broad guidelines for Quality Control
• Maintain records documenting each material used • Ensure that production and delivery conforms to measuring, batching,
mixing, and delivery specifications • Ensure concrete has the specified characteristics in freshly mixed state
at delivery

4.1.4 Material Storage and Handling
• Cementitious materials • Keep dry and free from contaminants
• Aggregates • Store and handle to keep separate and avoid segregation, and allow
for drainage. • Water and ice
• Protect from contamination • Admixtures
• Protect against contamination, evaporation, or damage. Provide agitation for suspensions or unstable solutions. Protect from freezing.

Section 4.2 Products • Section 4.2.1Materials
• Cementitious content • Portland - ASTM C150, • Blended hydraulic cement - ASTM C595 (excludes Type IS >70%) • Hydraulic cement - ASTM C1157 (performance cement) • Pozzolans - ASTM C618 • Silica fume - ASTM C989 • Use same cementitious materials in production as in field records or
trial batches • Aggregates
• Conform to ASTM C33 • Admixtures
• Air-entraining - ASTM C260 • Water reducers - ASTM C494 • Flowing concrete - ASTM C1017 • Calcium chloride - ASTM D98

Section 4.2.2 Performance and Design Requirements
• Cementitious content • Adequate to satisfy strength, w/cm, durability, and finishability. Floors
comply with Table 4.1.2.9
• Slump
• Select slump at point of delivery, not to exceed 9 inches, or flow of 30 inches. Concrete shall not show signs visible signs of segregation
• Size of Coarse Aggregate • Unless otherwise specified, nominal size shall not exceed ¾ of minimum
reinforcement spacing.
1" 520
3/4" 540
3/8" 610
TABLE 4.2.2.1 — Minimum cementitious material content requirement for floors
Nominal maximum size of aggregate, in.
Minimum cementitious material content
1-1/2" 470

Section 4.2.2 Performance and Design Requirements • Air content
• Shall be entrained for Exposure Class F1, F2, F3. • Concrete for hard troweled slabs shall not exceed 3.0% total air.
• Temperature • Minimum – If 3 day average less than 40 degrees, concrete 40 to 55
degrees depending on concrete dimensions. • Maximum – Unless otherwise specified, 95 degrees.
• Resistance to ASR – 3 methods (Unless exposure class C0)
• Test aggregates in accordance with ASTM C1293, one year test • Test aggregates with cementitious material in accordance with ASTM
C1567, maximum expansion of 0.1% at 16 days. • Limits based on total alkali

4.2.2.7 Durability
ACI 301 references exposure classes for the following: Exposure Class F - Freeze and thawing Exposure Class S - Sulfate exposure Exposure Class W - Concrete exposed to water requiring low permiability Exposure Class C - Corrosion protection of reinforcement
The exposure classes are described in ACI 318

Exposure Class F – Freezing and thawing ExposureCategoryF(Freezingandthawingexposure)issubdividedintofourexposureclasses:
ExposureClass Concreteexposurecharacteris2cs
F0 Notexposedtocyclesoffreezingandthawing.
F1
Exposedtocyclesoffreezingandthawingandthatwillhave limitedexposuretowater.Limitedexposuretowater impliessomecontactwithwaterandwaterabsorpBon;however, it isnotanBcipatedthattheconcretewillabsorbsufficientwatertobecomesaturated. The licensed design professional should review the exposure condiBons carefully to support the decision that theconcrete isnotanBcipatedtobecomesaturatedbefore freezing.Eventhoughconcrete in thisexposureclass isnotexpectedtobecomesaturated,aminimumentrainedair contentof3.5 to6percent is required to reduce thepotenBal fordamage in caseporBonsoftheconcretememberbecomesaturated.
F2 Exposedtocyclesoffreezingandthawingandthatwillhavefrequentexposuretowater.FrequentexposuretowaterimpliesthatsomeporBonsoftheconcretewillabsorbsufficientwatersuchthatoverBmetheywillhavethepotenBaltobesaturatedbeforefreezing.IfthereisdoubtaboutwhethertoassignExposureClassesF1orF2toamember,themoreconservaBvechoice,F2,shouldbeselected.ExposureClassesF1andF2arecondiBonswhereexposuretodeicingchemicalsisnotanBcipated.
F3 ExposedtocyclesoffreezingandthawingwiththesamedegreeofexposuretowaterasExposureClassF2.AddiBonally,concreteinExposureClassF3isanBcipatedtobeexposedtodeicingchemicals.DeicingchemicalscanincreasewaterabsorpBonandretenBon(Spraggetal.2011),whichwouldenabletheconcretetobecomesaturatedmorereadily.

Exposure Class F – Freezing and thawing
TABLE 4.2.2.7.b — For Exposure Category F: freezing and thawing exposure
F3 0.45 TABLE 4.2.2.7.b.1
NA
F2 0.45 4500 TABLE 4.2.2.7.b.1 NA
4500 TABLE 4.2.2.7.b.2
F0 NA NA NA NA
F1 0.45 4500 TABLE 4.2.2.7.b.1
Exposure class Maximum w/cm Minimum f' c , psi Air Content Additional requirements
4.5
Exposure Class F2 and F3
3/8"
5.06.0
Air Content
1" 6.0
5.51-1/2" 4.5
Air Content
Exposure Class F1
6.0
5.5
TABLE 4.2.2.1.b.1 — Total air content for concrete exposed to cycles of freezing and thawing
3/4"
7.5
1/2"
Nominal maximum size of aggregate, in.
7.0

Exposure Class S – Sulfate exposure
ExposureCategoryS(sulfateexposure)issubdividedintofourexposureclasses:
ExposureClass Concreteexposurecharacteris2cs
S0 CondiBonswherethewater-solublesulfateconcentraBonincontactwithconcreteislowandinjurioussulfateaTackisnotaconcern.
S1 Structuralconcretemembersindirectcontactwithsolublesulfatesinsoilorwater.SeawaterexposureisclassifiedasExposureClassS1. The severityofexposure increases fromExposureClassS1 toS3basedon themorecriBcal valueofmeasuredwater-solublesulfateconcentraBoninsoilortheconcentraBonofdissolvedsulfateinwater.
S2
S3
NA
S1 4000
NA
NA
No calcium chloride admixtures
No calcium chloride admixtures
0.45
0.45
Additional Requirements
4500
Maximum w/cm
NA
0.50
Exposure class Minimum f' c , psi
TABLE 4.2.2.7.a — For Exposure Category S: sulfate exposure
S3
S0
S2 4500
V + pozzolan or slag cement
ASTM C595
NA
IP(MS), IS(<70)(MS)
IP(HS), IS(<70)(HS)
IP(HS)+ pozzolan or slag cement, or IS(<70)(HS)+ pozzolan or slag cement
ASTM C1157
NA
MS
HS
HS + pozzolan or slag cement
Required cementitious materials* - types
ASTM C150
NA
II
V
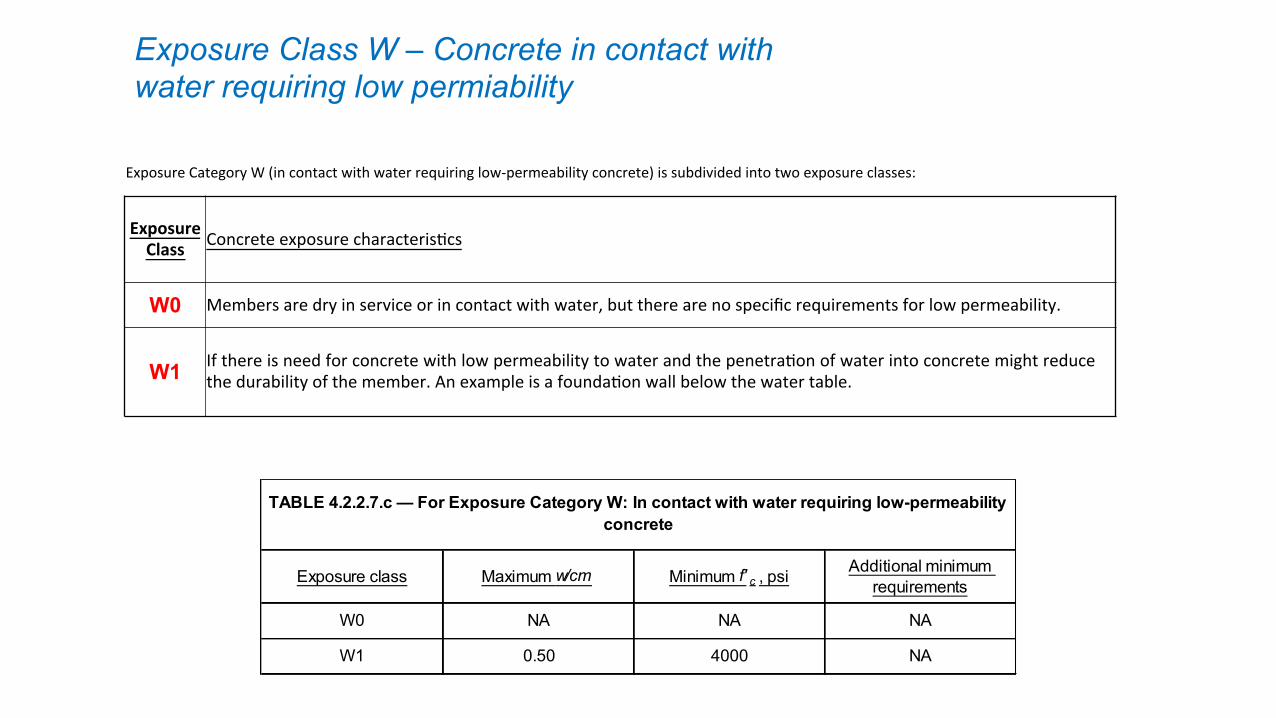
Exposure Class W – Concrete in contact with water requiring low permiability
ExposureCategoryW(incontactwithwaterrequiringlow-permeabilityconcrete)issubdividedintotwoexposureclasses:
ExposureClass ConcreteexposurecharacterisBcs
W0 Membersaredryinserviceorincontactwithwater,buttherearenospecificrequirementsforlowpermeability.
W1 IfthereisneedforconcretewithlowpermeabilitytowaterandthepenetraBonofwaterintoconcretemightreducethedurabilityofthemember.AnexampleisafoundaBonwallbelowthewatertable.
W1 0.50 4000 NA
W0 NA NA NA
Exposure class Maximum w/cm Minimum f' c , psi Additional minimum requirements
TABLE 4.2.2.7.c — For Exposure Category W: In contact with water requiring low-permeability concrete

Exposure Class C – Corrosion protection of reinforcement
ExposureCategoryC(condiBonsrequiringcorrosionprotecBonofreinforcement)issubdividedintothreeexposureclasses:
ExposureClass ConcreteexposurecharacterisBcs
C0 ExposurecondiBonsdonotrequireaddiBonalprotecBonagainsttheiniBaBonofcorrosionofreinforcement.
C1 Non-prestressed and prestressed concrete members, depending on the degree of exposure to external sources ofmoisture and chlorides in service. Examples of exposures to external sources of chlorides include concrete in directcontactwithdeicingchemicals,salt,saltwater,brackishwater,seawater,orsprayfromthesesources.
C2
0.15C2 0.40 5000
C0 NA NA 1.00
C1 NA NA 0.30
TABLE 4.2.2.7.d — For Exposure Category C: Conditions requiring corrosion protection of reinforcement
Exposure class Maximum w/cm Minimum f' c , psi
Maximum water-soluble chloride ion (Cl-) content in
concrete by weight of cement

ACI 301 Section 4.2.3 – Proportioning
Definitions
• f’c – Design compressive strength • f’cr – Required average compressive strength (f’c + overdesign) • Ss – Standard deviation

ACI 301 Section 4.2.3 – Proportioning
There are two paths for mixture designs:
1) Field data is available
2) No field data, run trial mixtures

ACI 301 Section 4.2.3 – Proportioning
Field Data Method
1. Step one for the field data method is determining a standard deviation

ACI 301 Section 4.2.3.2 – Standard Deviation Standard deviation - a quantity calculated to indicate the extent of deviation for a group as a whole.
Field testing data may be used to determine a standard deviation (Ss). The standard deviation is for the producing plant, not the mixture.

ACI 301 Section 4.2.3.2 – Standard Deviation
Ss Data Requirements
a) Data no more than 24 months old b) Data spans no less than 45 day c) Mixture design used for data must be of same class
of concrete and within 1000 psi of proposed mixtures

ACI 301 Section 4.2.3.2 – Standard Deviation
A Ss may be determined by using 30 or more consecutive test records. As few as 15 may be used, however, there is a k-factor applied which increases the standard deviation.
Table 4.2.3.3.a.1 - k-factor for increasing sample standard deviation for number of tests considered
Total number of tests considered
k-factor for increasing sample standard deviation
15 1.16
20 1.08
25 1.03
30 or more 1.00
Example: Field test data with 18 records has standard deviation of 500. K-factor 1.16 is used. 500 x 1.16 = 580 psi is adjusted Ss

ACI 301 Section 4.2.3.2 – Standard Deviation
The Ss may also be determined using two groups of consecutive test records that total at least 30 compressive strength tests. Neither of the two sets of records may have less than 10 test records. No k-factor applied if the total of two records is 30 or more.

ACI 301 Section 4.2.3.2 – Standard Deviation
How is a Sc calculated? For a single set of records For two sets of records
EXCEL has build in functions for determining standard deviations

Example Standard Deviation Spreadsheet
Producer : XXX Ready Mix Design Strength : 4000 psi
Mix Design # : 2045
Report Date : 9/20/2018
TEST # DATE CONTRACTORPROJECT SET # SLUMP %AIR 7 DAY 28 DAY 28 DAY 28 DAY (avg)1 01/05/18 ABC Inc. XZY Building 1001 4.0 4.0 3680 4600 4675 46382 01/06/18 ABC Inc. XZY Building 1002 4.5 5.0 3560 4450 4520 44853 01/07/18 ABC Inc. XZY Building 1003 4.0 4.0 3490 4365 4430 43984 01/08/18 ABC Inc. XZY Building 1004 5.0 5.0 3320 4150 4215 41835 01/09/18 ABC Inc. XZY Building 1005 5.0 6.0 3290 4850 5280 50656 01/10/18 ABC Inc. XZY Building 1006 4.0 4.0 3550 4440 4510 44757 01/11/18 ABC Inc. XZY Building 1007 5.0 5.0 3780 4725 4800 47638 01/12/18 ABC Inc. XZY Building 1008 4.0 4.0 3190 3990 4050 40209 01/13/18 ABC Inc. XZY Building 1009 4.0 5.0 3690 4615 4685 4650
10 01/14/18 ABC Inc. XZY Building 1010 4.5 5.5 3540 4425 4495 446011 01/15/18 ABC Inc. XZY Building 1011 4.8 4.5 3350 4190 4255 422212 01/16/18 ABC Inc. XZY Building 1012 3.5 4.3 3325 4155 4225 419013 01/17/18 ABC Inc. XZY Building 1013 5.0 4.3 3750 4690 4765 472814 01/18/18 ABC Inc. XZY Building 1014 4.0 5.4 3190 3750 3590 367015 01/25/18 ABC Inc. XZY Building 1015 6.0 3.9 3450 4315 4380 434816 01/26/18 ABC Inc. XZY Building 1016 4.5 4.0 2980 3725 3785 375517 01/27/18 ABC Inc. XZY Building 1017 5.0 5.5 3780 5380 5420 540018 01/28/18 ABC Inc. XZY Building 1018 5.0 5.0 3520 4400 4470 443519 02/07/08 ABC Inc. XZY Building 1019 4.0 4.0 3450 4315 4380 434820 02/08/08 ABC Inc. XZY Building 1020 4.0 5.0 3290 4115 4180 414821 02/09/08 ABC Inc. XZY Building 1021 5.0 6.0 3245 4055 4120 408822 02/10/08 ABC Inc. XZY Building 1022 5.5 4.5 3650 4900 4950 492523 02/18/18 ABC Inc. XZY Building 1023 4.6 5.5 3420 4275 4345 431024 02/19/18 ABC Inc. XZY Building 1024 4.8 4.4 3940 4925 5005 496525 02/20/18 ABC Inc. XZY Building 1025 4.0 5.0 3720 4650 4725 468826 02/21/18 ABC Inc. XZY Building 1026 4.0 4.0 3240 4050 4115 408227 03/02/18 ABC Inc. XZY Building 1027 5.0 5.0 3350 4188 4255 422128 03/03/18 ABC Inc. XZY Building 1028 5.0 4.0 3240 4190 4115 415229 03/04/18 ABC Inc. XZY Building 1029 4.0 4.8 3120 3600 3650 362530 03/05/18 ABC Inc. XZY Building 1030 3.5 6.0 3325 4144 4225 4185
AVERAGES 4.5 4.8 3448 4387STANDARD DEVIATION 0.6 0.7 229 404
Concrete Statistical Analysis Report
30 records, spanning 60 day period. Ss = 404 psi

Table 3.2-Standards of quality control
Class of Standard deviation for different control standards (psi)operation Excellent Very Good Good Fair PoorGeneral
construction testing
Laboratorytrial batches
Overall variation
Below 400
Below 200
400-500 500-600 600-700 Above 700
200-250 250-300
300-350 Above 350
What is a Good Standard Deviation? ACI 214

ACI 301 Section 4.2.3 – Proportioning
Field Data Method
• Step two for the field data method is determining the required average strength for the proposed mixture

ACI 301 Section 4.2.3.3 – Required Average Strength
If there were no field data records available, thus no standard deviation, then the required average strength would be as follows:
Table 4.2.3.3.b - Required average compressive strength f' cr
f' c , psi f' cr , psi
Over 5000 1.1f' c + 700
Less than 3000 f' c + 10003000 to 5000 f' c + 1200

ACI 301 Section 4.2.3.3 – Required Average Strength When field records are available and a standard deviation has been calculated, the required average strength is calculated as follows:
Equation
(4-3)
(4-4)
(4-3)
(4-5)
f' cr , psiUse the larger of:
f' cr = f' c + 1.34ks s
f' cr = f' c + 2.33ks s -500
f' cr = f' c + 1.34ks s
f' cr = 0.90f' c + 2.33ks s
Table 4.2.3.3.a - Required average compressive strength f' cr , when data are not available to establish a sample standard deviation, psi
f' c , psi
5000 or less
Over 5000

ACI 301 Section 4.2.3 – Proportioning
Field Data Method
• Step three for the field data method is documenting the average compressive strength of the proposed mixture

ACI 301 Section 4.2.3.4 - Documentation of Average Compressive Strength Field strength data for the proposed mixture must: • Consist of at least 10 consecutive strength tests • Span a period of not less than 45 days • Must be equal to or greater than the required average strength.

ACI 301 Section 4.2.3.4 - Documentation of Average Compressive Strength If the proposed mixture is the same mixture used to determine the Ss, then that data may be used to document average compressive strength. Or, it may be different, as long as it is of the same class and within 1000 psi in strength.

Example 1 for Field Data Method
• Design Strength Required - 4500 psi
• Plant has 35 records of a 4000 psi mixture design, which is used to determine a standard deviation
• Plant has 12 records of the 4500 psi mixture design which is proposed for use, which uses same materials as the 4000 psi mixture design.

Example 1 for Field Data Method
• Standard deviation from the 35 tests records for the 4000 psi mixtures is calculated and it is 560 psi.
• The average strength of the 12 test records for the 4500 psi mixture is calculated and it is 5425 psi at 28 days.
• The required average strength is calculated Table 4.2.3.3(a)1 as follows:
• Fcr = 4500 + 1.34(560) = 5250 psi • Fcr = 4500 + 2.33(560) - 500 = 5305 psi • Use the larger, 5305 psi = required average strength
• The average strength 5424 psi > required avg. strength 5305 psi, mixture qualifies.

Example 2 for Field Data Method
• Design Strength Required - 3500 psi
• Plant does not have Ss calculated
• Plant has 14 records of the 3500 psi mixture design which is proposed for use.

Example 2 for Field Data Method
• The average strength of the 14 test records for the 3500 psi mixture is calculated and it is 4850 psi at 28 days.
• The required average strength is calculated Table 4.2.3.3.b as follows:
• Fcr = 3500 + 1200 = 4700psi
• The average strength 4850 psi > required avg. strength 4700 psi, mixture qualifies.

Summary for Field Data Method
1. Collect field test records 2. Determine standard deviation 3. Determined required average strength 4. Document average compressive strength of proposed mixture
design a. May be the mixture design whose data was used for standard
deviation b. May be a different mixture design, document with 10 or more
consecutive test records (must be same class of concrete within +/- 1000 psi)

Strength psi Design Strength psi Required Average Strength psi
Summary for Field Data Method

ACI 301 Section 4.2.3 – Proportioning
Trial Mixture Method
1. Step one for the trial mixture method is to use materials and material
combinations complying with applicable ACI 301 sections
2. Step two, determine required average strength based on Ss and Table 4.2.3.3a if field test records are available.
3. If no field test records, use Table 4.2.3.3b for default required average strength

ACI 301 Section 4.2.3 – Proportioning
Trial Mixture Method
3. Step three
Make at least three trial mixtures for each class of concrete with a range of proportions that will establish the w/cm and relative proportions and will encompass the required average strength.
In other words, develop a three-point curve

ACI 301 Section 4.2.3 – Proportioning
Three Point Curve Example
Set up mixtures with a low, mid, and high cementitious content. Target same slump and air. *Constant % fly ash content *Constant stone content
*other methods may be used
Low Mid HighPoint Point Point
Cement 360 480 600Fly ash 90 120 150Stone 1850 1850 1850Sand 1333 1180 1027Water 267 275 283
W/Cm 0.59 0.46 0.38Slump 5.00 5.00 5.00Air 5.00 5.00 5.00
Total Cem. 450 600 750% Fly ash 20 20 2028-day psi 3680 5860 6750
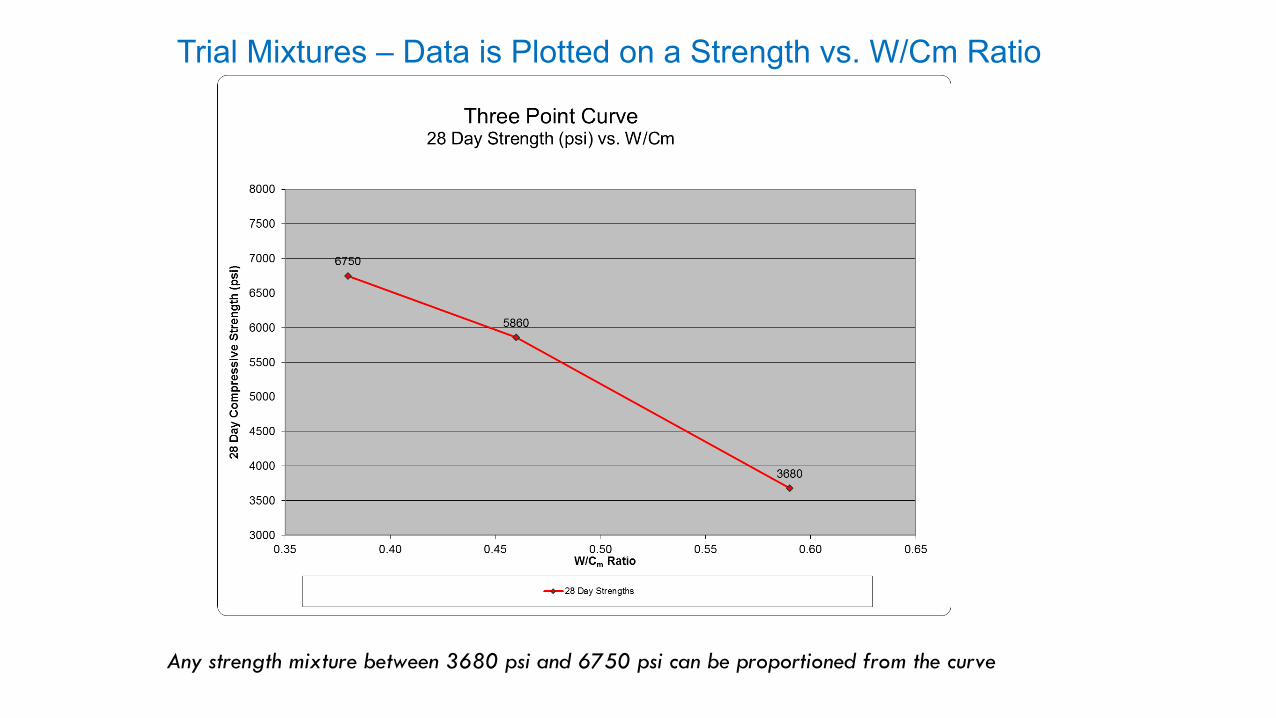
Trial Mixtures – Data is Plotted on a Strength vs. W/Cm Ratio
Any strength mixture between 3680 psi and 6750 psi can be proportioned from the curve

Trial Mixtures – Data is Plotted on a Strength vs. W/Cm Ratio
Example 1: • A mixture with a design strength of 4000 psi at 28 days is required.
• Assume no field data so the over design based on Table 4.2.3.3b will be 1200 psi.
• Required average strength needed is 4000 + 1200 = 5200 psi at 28 days.

Trial Mixtures – Data is Plotted for a 4000 psi design strength with required average strength of 5200 psi

Trial Mixtures – Data is Plotted for a 4000 psi design strength with required average strength of 5200 psi
New mixture is proportioned from curve • W/Cm ratio for 5200 psi is 0.52 • Calculated total cementitious is 545 lbs/cy • 20% fly ash replacement
• cement is 436 lbs. • fly ash 109 lb.
• Calculate water (454 lbs. x 0.52) • Stone is constant • Sand is calculated to yield 27.0 cu.ft./yd
New 4000 psi mixture design
Cement 436Fly ash 109Stone 1850Sand 1239Water 271W/Cm 0.50

Trial Mixtures – Data is Plotted on a Strength vs. W/Cm Ratio
Example 2: • The same design strength of 4000 psi at 28 days is required.
• Field data of 30 records of similar materials within 1000 psi is available.
• Ss of 475 psi has been determined.
• Based on Table 4.2.3.3a the over design will be 637 psi.
• Required average strength needed is 4000 + 637 = 4637 psi at 28 days.

Trial Mixtures – Data is Plotted on a Strength vs. W/Cm Ratio
Example 2:
Cement 414Fly ash 104Stone 1850Sand 1265Water 270W/Cm 0.52
New 4000 psi mixture design
This mixture requires 28 less lbs.' of cementitious material, based on Ss

Summary for Trial Mixture Method
1. Run trial mixtures that encompass range of strengths and W/Cm needed
2. Determined 28 day compressive strengths
3. Determined required average strength a) Field records and Ss available, use Table 4.3.3.2.a b) No field records, use Table 4.3.3.2.b
4. Proportion proposed mixtures from the curve.

Questions ???


