A Review of developments in
The Global & Indian Steel Industry
Monthly edition
Issue No. 45
December 2019 (Covering November 2019)
Compiled on behalf of Indian Steel Association,
By Mr. Anup Kashyap,
Deputy Manager-Technical
Strictly for Internal circulation
About the Report
❑ The Indian Steel Association introduced a monthly report titled ‘A REVIEW
OF DEVELOPMENTS IN GLOBAL & INDIAN STEEL INDUSTRY’, from August
2016.
❑ The report provides general background information reviewing the status
of the developments in the global and Indian steel industry, pertaining to
raw material, production & consumption, trade, shipping, pricing &
forecasts, country reportage, policy developments, economic parameters
etc.
❑ The consistent format of the report provides an insight into the relevant
aspects of steel scenario globally and domestically .
❑ The information has been sourced from independent third party databases,
knowledge sources and news reports, and the authenticity of the same has
not been independently verified by ISA.
❑ The report is issued in the last week of each month to the members of
Indian Steel Association , various ministries / departments / institutions.
Contents of the Report
SI.
No
Title Page
Number
1. Global Economic Development 4-6
2. Global Steel Development 7-14
3. Domestic Steel Development 15-19
4. Indian Economic Development 20-23
5. About ISA 24-30
Source: Global Forecasting Service, The Economic Intelligence Unit 5
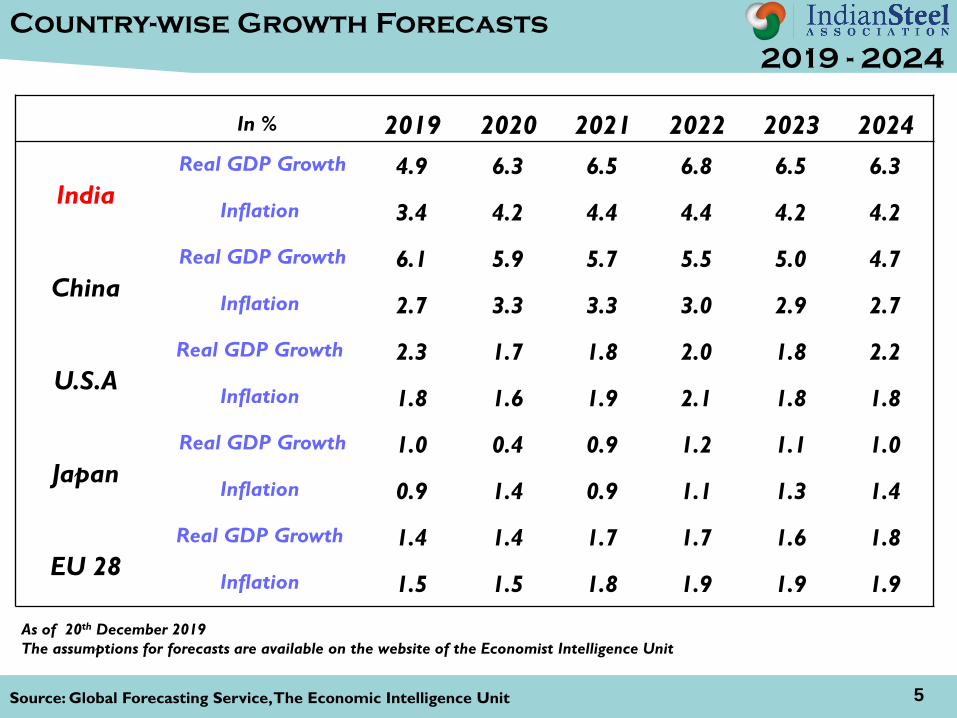
In % 2019 2020 2021 2022 2023 2024
India
Real GDP Growth 4.9 6.3 6.5 6.8 6.5 6.3
Inflation 3.4 4.2 4.4 4.4 4.2 4.2
China
Real GDP Growth 6.1 5.9 5.7 5.5 5.0 4.7
Inflation 2.7 3.3 3.3 3.0 2.9 2.7
U.S.A
Real GDP Growth 2.3 1.7 1.8 2.0 1.8 2.2
Inflation 1.8 1.6 1.9 2.1 1.8 1.8
Japan
Real GDP Growth 1.0 0.4 0.9 1.2 1.1 1.0
Inflation 0.9 1.4 0.9 1.1 1.3 1.4
EU 28
Real GDP Growth 1.4 1.4 1.7 1.7 1.6 1.8
Inflation 1.5 1.5 1.8 1.9 1.9 1.9
As of 20th December 2019
The assumptions for forecasts are available on the website of the Economist Intelligence Unit
Country-wise Growth Forecasts
2019 - 2024
Source: Global Forecasting service 6
Global Economic Scenario
DECEMBER 2019
▪ The year 2019 was a difficult one for the global economy, as geopolitical uncertainty and a
slowing Chinese economy combined to trigger a global manufacturing downturn.
▪ The Economist Intelligence Unit expects global growth to be marginally faster in 2020.
However, continued political instability-internationally and in many countries-will limit any
pick-up in business confidence and investment, and the balance of risks to the outlook
remains tilted to the downside.
▪ Global growth is forecast to be 2.4% in 2020- modestly higher than the 2.3% growth that
what is currently expected for 2019, but still close to decade lows.
▪ Economic growth in the developed world to slow marginally in 2020, to 1.5%, driven by a
moderation in US growth.
▪ Asia will record a stable growth rate of 4% in 2020, making it the world fastest-growing
region for the sixth consecutive year, with stronger growth in South and South-East Asia
making up for a continued slowdown in China.
▪ In the rest of the emerging world, it is expected a modest recovery from a torrid 2019,
including in Latin America, the Middle East and Sub-Saharan Africa.
Source: World Steel Association 8
Global Steel Scenario
November 2019
➢ World crude steel production for the 64 countries reporting to the World Steel Association
(world steel) was 147.8 million tonnes (Mt) in November 2019, a 1.0% decrease compared to
November 2018.
➢ China’s crude steel production for November 2019 was 80.3 Mt, an increase of 4.0% compared
to November 2018.
➢ India produced 8.9 Mt of crude steel in November 2019, down 2.8% on November 2018.
➢ Japan produced 7.7 Mt of crude steel in November 2019, down 10.6% on November 2018.
➢ South Korea’s crude steel production was 5.9 Mt in November 2019, a decrease of 0.5% on
November 2018.
➢ The US produced 7.2 Mt of crude steel in November 2019, a decrease of 2.2% compared to
November 2018.
➢ In the EU, Italy produced 2.0 Mt of crude steel in November 2019, down by 9.8% on November
2018. France produced 1.1 Mt of crude steel in November 2019, an 18.2% decrease compared to
November 2018. Spain produced 1.1 Mt of crude steel in November 2019, down by 10.9% on
November 2018.
Source: World Steel Association
➢ Total Crude steel production from January to November - 2019 was 1684 MT.
➢ The region wise crude steel production is provided in chart below.
RegionJan –Nov. 2019 in
(MT)
Jan- Nov. 2018 in
(MT)
% Change
EU-28 148.451 154.895 -4.2
CIS 91.958 92.374 -0.5
N. America 110.115 110.753 -0.6
S. America 38.062 41.526 -8.3
Africa 12.487 13.383 -6.7
Middle East 33.733 32.552 +3.6
Asia 1209.584 1151.280 +5.1
Oceania 5.654 5.833 -3.1
World 1684.194 1640.234 2.7
Region wise Crude Steel Production
Nov. 2019
➢ Year onYear this reflects an increase of crude steel production over Jan-November 2018 of 2.7%.
9
Source: Chinese iron and Steel Association 10
➢ China’s crude steel output in 2020 is expected to ease from a record high this year to
981 million tonnes.
➢ In the first 10 months of the year, China has churned out 829.22 million tonnes of crude
steel, up 7.4% from a year earlier.
➢ Meanwhile, demand is seen rising 7.3% to 886 million tonnes in 2019, but was expected to
drop from that level by 0.6% in 2020.
➢ Demand for steel in the construction industry is expected to rise 11.2% this year to 478
million tonnes, but is seen slipping 0.6% in 2020.
China’s Crude Steel Outlook
Nov. 2019
Sector 2019 % Change (y-o-y) 2020 % Change (y-o-y)
Construction 478 11.2 475 -0.6
Machinery 142 1.4 142 0
Automobile 50 -7.4 48.2 -3.6
Energy 34 3.0 34.5 1.5
Shipbuilding 11.3 3.7 10 -11.5
Home Appliance 13.5 8.0 14 3.7
Container 4.9 -29.0 9.0 2.0
Measured in Million tons
Source: SMM China report on Stainless Steel 11
China’s Stainless Steel Scenario
Nov. 2019
➢ China’s production of stainless steel is expected to rise 5% in 2020, slowing from an 11%
increase amid concentrated release of production capacity this year.
➢ China’s stainless steel prices took a roller-coaster ride in 2019, boosted by soared prices of
raw material nickel after Indonesia brought forward a ban on ore exports by two years.
➢ The price range of spot 304 cold-rolled stainless steel, for instance, climbed to 14,000-
16,000 yuan/mt in the second half of this year, from 14,000-15,000 yuan/mt in the first half
of the year. Near-term prices will move in line with costs, SMM expects.
➢ The share of stainless steel scrap
used as raw materials will likely
exceed 20% with the
standardisation of the recycling
system in China.
➢ On the downstream front,
petrochemical and equipment
sectors will remain the key driving
force behind stainless steel
consumption.
Source: US CUSTOM DATA_OCTOBER 2019 12
Quantity in metric tons
➢ United State’s finished flat steel imports fell by 7.4 % M-o-M in Oct’19 against Sep’19
registered an import volume of 985,751 metric ton
➢ Country’s Sem finished steel import has observed a fall by 4.9 % M-o-M.
➢ Imports of ferrous scrap by US moved down by 22% M-o-M in Oct’19.
➢ On the other hand Iron ore imports volumes have sharply rose to 444,952 metric ton in
Oct ‘19 against Nov’ 19 by 50.8% M-o-M.
➢ Finish long steel imports
volume rose to 229,836
metric tons up by 3.2%
M-o-M.
➢ The figure shows the US
steel industry scenario for
the month of October 2019.
Trend of USA Steel Industry
Source: Steel Mint 13
Trend of South Korean Steel Industry
➢ Coal- South Korean coal imports gain by 13.44 MT M-o-M in Oct’ 19 than the 11.45 Mt in
sept’19.Also on yearly basis import up by 13.22 % against 11.87 MT I Oct’18.
➢ Iron Ore- Iron Ore import by country on monthly basis is registered at 7.21 MT in
Oct’19,higher by 40.27 % as against 5.14 Mt in Sept’19.
➢ Semi Finished-The country’s semi finished (Billet /Pig Iron 0 import is registered at 0.21
MT in Oct’19,rally by 75% as against 0.12 MT in Sept’19 and on Yearly premises import
remain stable at 0.21 MT in Oct’18.
➢ Finish Flat- On monthly
basis the country’s flat steel
import is recorded at 0.77
MT in Oct’19 marginal up by
4% against 0.74 Mt in sep’19.
➢ Graphite Electrode- On
M-o-M South Korea graphite
electrode import registered
at 3805 Metric ton in Oct’19.
Source: JPC MIS Report-NOVEMBER 2019 16
Indian Steel Scenario
Items
Indian Steel Scene (Million Tons)
April-Nov.
18-19 (Prov.)
April-Nov.
17-18 (Final)
% Change
(Prov.)
Crude Steel
Production72.90 72.51 0.5
Hot Metal Production48.283 48.519 -0.5
Pig Iron Production4.001 4.179 -4.3
Total Finished Steel ( Alloy + Non Alloy)
Production 67.66 66.25 2.1
Import 5.077 5.361 -5.3
Export 5.753 4.308 33.5
Consumption 66.517 64.176 3.65
Source: Steel Mint 17
▪ Imported scrap trades to India again remained weak for yet another month, with
shredded scrap trades remaining particularly silent, while HMS scrap from different
origins observing few trades, while in general buyers preferred local scrap as the
cheaper alternative.
▪ Offers for Shredded scrap stood more or less stable, marginally rising by around USD 5-
6/MT over the course of Nov’19, to around USD 285/MT CFR levels by end of the
month, with slow demand from
buyers resisting a sharp hike.
▪ No Bulk bookings were
reported at the Kandla port in
Nov’19 amid limited inquiries
from buyers on high prices.
▪ Imported scrap offers to India
range bound; trades remain
limited
Indian Scrap Import
Source:Steel Mint 18
▪ Odisha-India’s largest iron or producing state recorded total iron ore dispatches at 8.37
MT in Nov. 19,up by 34% on monthly basis as against 6.23 MT in Oct’19.
▪ Indian iron ore exports in Nov’19 witnessed at 2.29 MT up by 32% as against Oct’19
exports at 1.74 Mt. The export surge is attributed to global market supply crises and
falling iron ore inventory at major Chinese ports
Indian Iron ore Status
Source: Steel Mint 19
Domestic Steel Prices
➢ Current trade reference prices for HRC stands at INR 36,000-37,000 per ton (ex-
Mumbai),INR 36,000-37,500 per ton (ex-Delhi) and INR 37,000-38,000 per ton (ex-
Chennai).Prices mentioned above are basic and extra GST @ 18 % will be applicable.
➢ CRC (0.9 mm, IS 513) prices on a weekly premises assessed at INR 41,500-42,000 per ton
(ex-Mumbai),INR 41,000-42,000 per ton (ex-Delhi) and INR 41,000-42,000 per ton(ex-
Chennai).Prices mentioned above are basic and extra GST @18 % is applicable.
Source: OECD Economic Outlook highlights-India Focus 22
▪ Economic growth is projected to recover to just under 6½ per cent in FY 2021 as election-
related uncertainties fade and monetary and fiscal policies have become accommodative.
▪ The new income-support scheme for farmers and a good monsoon are supporting private
consumption.
▪ The cut in corporate income tax will support corporate investment. Inflation and the current
account deficit will remain moderate given the relatively large spare capacity in the economy and
low oil prices. Job creation remains a challenge.
▪ With inflation below target, some room for further accommodation in monetary policy remains.
The large cuts in policy rates since the start of 2019 have not yet been fully reflected in lower
lending rates, reflecting still high non-performing loans and public sector borrowing needs.
▪ Further reforms to improve financial sector soundness and the ease of doing business are needed
to revive corporate investment. Re-building fiscal space will be key to finance better infrastructure
and public services.
▪ Tax reforms are needed to broaden the property and personal income tax base. Borrowings from
public enterprises and banks also need to be restrained
Indian Economy Challenges & Solutions
2019
Source: Reserve Bank of India
CurrencyDate
20th Dec 2019
I USD 71.15
1 EUR 79.10
1 GBP 92.61
100 YEN 65.09
Base Rate : 8.95-9.40 %
Savings Deposit Rate : 3.25-3.50 %
MCLR (Overnight) : 7.65-8.00 %
Term Deposit Rate > 1 year : 6.20-6.40 %
Policy Repo Rate : 5.15 %
Reverse Repo Rate : 4.90 %
Marginal Standing Facility Rate : 5.40 %
Bank Rate : 5.40 %
CRR : 4%
SLR : 18.50 %
Reference Rates
Lending/ Deposit Rates
Reserve RatiosPolicy Rates
Rates at Reserve Bank of India
2019
23
About ISA
➢ The Indian Steel Association (ISA) is the voice of the Indian Steel Industry, in
both domestic and global forums. It is at the forefront of all deliberations
pertaining to matters of public & regulatory policy, raw materials, international
trade, logistics, environmental concerns, technology and other aspects of steel-
making. The Indian Steel Industry looks at ISA to further its critical agenda of
sustained growth, both in steel production and in generating domestic demand.
➢ ISA was formed in 2014 and has 15 members – eight full members and seven
affiliates. The list of full members includes –Steel Authority of India (SAIL) and
Rashtriya Ispat Nigam Ltd (RINL) – while heavyweights from the private sector
include JSW Steel Ltd, Tata Steel Ltd, Jindal Steel and Power Ltd, Essar Steel
India Ltd, Bhushan Power and Steel Ltd and Tata Steel BSL Ltd. ISA, an affiliate
member of World Steel Association (WSA), regularly collaborates with WSA on
the organisation of events, as well as taking part in other key meetings with
global partners.
25
Our Seven Full Members are:
• Tata Steel Ltd
• Steel Authority of India Ltd.
• JSW Steel Ltd.
• Rashtriya Ispat Nigam Ltd.
• Essar Steel Ltd.
• Jindal Steel & Power Ltd.
• Tata Steel BSL Ltd.
Our ten Affiliate Members are
Monnet Ispat & Energy Ltd., INSDAG
(Institute for Steel Development and
Growth), KISMA (Karnataka Iron and
Steel Manufacturer’s Association),
Arjas Steel, Jindal Stainless, Electro
steel Steels ,Shyam steel ,
Shyam Metalics ,Tata Steel Long
Products Limited and Orissa Metalliks
Pvt. Ltd
Members of Indian Steel Association
26(Orissa Metalliks Pvt. Ltd.)
Vision and Objectives of ISA
➢Vision of ISA-
To work towards transforming the Indian Steel Industry as a
global leader acclaimed for its Quality, Productivity and
Competitiveness, with a focus on health, safety and
environment, along with a growing thrust on innovation through
R&D, adopting an inclusive and collective approach.
➢ Objectives of ISA-
▪ Promoting steel by raising awareness about the numerous
advantages of good quality steel
▪ Collaborating with international steel organizations to
tackle issues of mutual interest.
▪Working with the government on matters affecting the
steel industry.
27
Important Ministries/Department/Organization
Ministry of Steel
Name of the person Designation Contact Details
Shri Binoy Kumar Secretary [email protected]
Shri Saraswati Prasad Special Secretary & Financial Adviser [email protected]
Smt. Rasika Chaube Additional Secretary [email protected]
Smt. Ruchika Chaudhry Govil Joint Secretary [email protected]
Shri Puneet kansal Joint Secretary [email protected]
Ministry of Mines
Name of the person Designation Contact Details
Shri Anil Gopishankar Mukim Secretary [email protected]
Dr. K. Rajeswara Rao Additional secretary [email protected]
Ministry of Commerce
Name of the person Designation Contact Details
Shri Anup Wadhawan Secretary [email protected]
Shri Shudhanshu Pandey Additional Secretary [email protected]
Shri Alok Vardhan Chaturvedi DGFT [email protected]
Dr. K.C.Rout Additional Secretary-DGFT [email protected]
Ministry of Environment, Forest and Climate Change
Name of the person Designation Contact Details
Shri C K Mishra Secretary [email protected]
Control Pollution Central Board
Name of the person Designation Contact Details
Shri S.P. Singh Parihar Chairman [email protected]
Dr. Prashant Gargava Member Secretary [email protected]
Ministry of FinanceName of the person Designation Contact Details
Shri Rajiv Kumar Joint Secretary [email protected]
28
Contact Us for data related issues
Address:207-208, 2nd Floor
Kailash Building
New Delhi -110-001
India
Tel: +011 4266 8811
Fax: +011 4266 8805
E-mail: [email protected]
Website: http://indsteel.org/29
THANK YOU
DISCLAIMER
The material in this presentation has been prepared by Indian Steel Association (ISA) and is a general background information reviewing the
status of the developments in the global and Indian steel industry as at the date of this presentation. This presentation is strictly for internal use
of all the member companies of ISA, whose names have been stated in the presentation.
Information is given in summary form and does not purport to be complete or all inclusive. The information has been sourced from independent
third party databases, knowledge sources and news reports, and the authenticity of the same has not been independently verified by ISA.
Additionally, any third party forecasts on financial or economic parameters, projections or estimates should not be construed as an investment
advice or a recommendation to any ISA member. Recipients of this presentation from member companies of the ISA should each make their own
evaluation of the contents and adequacy of the information contained in the presentation.
ISA does not undertake any obligation to publicly release any changes to any revisions, modifications or forward looking statements in the
subsequent editions of this bi-monthly presentation. Unless otherwise specified, all information is for the period November 2019 or prior.
30