GEOCHEMISTRY AND PETROGENESIS OF THE OCEANIC ISLAND AND SUBDUCTION-RELATED ASSEMBLAGES FROM THE PALAEOTETYHAN KARAKAYA SUBDUCTION/ACCRETION COMPLEX, CENTRAL AND NW TURKEY A THESIS SUBMITTED TO THE GRADUATE SCHOOL OF NATURAL AND APPLIED SCIENCES OF MIDDLE EAST TECHNICAL UNIVERSITY BY KAAN SAYIT IN PARTIAL FULFILLMENT OF THE REQUIREMENTS FOR THE DEGREE OF DOCTOR OF PHILOSOPHY IN GEOLOGICAL ENGINEERING JUNE 2010
Transcript
GEOCHEMISTRY AND PETROGENESIS OF THE OCEANIC ISLAND AND SUBDUCTION-RELATED ASSEMBLAGES FROM THE
PALAEOTETYHAN KARAKAYA SUBDUCTION/ACCRETION COMPLEX, CENTRAL AND NW TURKEY
A THESIS SUBMITTED TO THE GRADUATE SCHOOL OF NATURAL AND APPLIED SCIENCES
OF MIDDLE EAST TECHNICAL UNIVERSITY
BY
KAAN SAYIT
IN PARTIAL FULFILLMENT OF THE REQUIREMENTS FOR
THE DEGREE OF DOCTOR OF PHILOSOPHY IN
GEOLOGICAL ENGINEERING
JUNE 2010
Approval of the thesis:
GEOCHEMISTRY AND PETROGENESIS OF THE OCEANIC ISLAND AND SUBDUCTION-RELATED ASSEMBLAGES FROM THE
PALAEOTETYHAN KARAKAYA SUBDUCTION/ACCRETION COMPLEX, CENTRAL AND NW TURKEY
submitted by KAAN SAYIT in partial fulfillment of the requirements for the degree of Doctor of Philosophy in Geological Engineering Department, Middle East Technical University by, Prof. Dr. Canan Özgen ____________________ Dean, Graduate School of Natural and Applied Sciences Prof. Dr. M. Zeki Çamur ____________________ Head of Department, Geological Engineering Prof. Dr. M. Cemal Göncüoğlu Supervisor, Geological Engineering Dept., METU ____________________ Examining Committee Members: Prof. Dr. Kadir Dirik ____________________ Geological Engineering Dept., HU Prof. Dr. M. Cemal Göncüoğlu ____________________ Geological Engineering Dept., METU Assoc. Prof. Dr. Gültekin Topuz ____________________ Avrasya Institute of Geosciences, İTU Assoc. Prof. Dr. Ercan Aldanmaz ____________________ Geological Engineering Dept., KU Assist. Prof. Dr. Fatma Toksoy-Köksal ____________________ Geological Engineering Dept., METU
Date: 23/06/2010
iii
I hereby declare that all information in this document has been obtained and presented in accordance with academic rules and ethical conduct. I also declare that, as required by these rules and conduct, I have fully cited and referenced all material and results that are not original to this work.
Name, Last name : Kaan SAYIT
Signature :
iv
ABSTRACT
GEOCHEMISTRY AND PETROGENESIS OF THE OCEANIC ISLAND AND SUBDUCTION-RELATED ASSEMBLAGES
FROM THE PALAEOTETHYHAN KARAKAYA SUBDUCTION/ACCRETION COMPLEX, CENTRAL AND NW
TURKEY
Sayıt, Kaan
Ph.D., Department of Geological Engineering
Supervisor: Prof. Dr. M. Cemal Göncüoğlu
June 2010, 191 pages
The Nilüfer Unit of the Karakaya Complex at the pre-Liassic basement of the
Sakarya Composite Terrane is composed mainly of metabasaltic lithologies with
limestones, and minor cherts and mudstones. These metabasic assemblages show
OIB- and E-MORB-type geochemical signatures with variable enrichment in the
most incompatible elements relative to N-MORB. The Eymir Unit consists of
variably deformed metaclastics, and constitutes the matrix in which the Nilüfer-
type blocks are embedded. In the Ankara region, the Eymir Unit is intruded by
metadiabase dikes that display intra-oceanic SSZ-type signatures with a marked
negative Nb anomaly combined with a slightly depleted HFSE budget relative to
N-MORB.
The wide range in trace element ratios displayed by the Nilüfer metabasic rocks
can be explained by melt-mixing processes that has taken place within the spinel-
garnet transition zone. Pb-Nd-Hf radiogenic isotope systematics reveal that the
Nilüfer samples has been derived from enriched mantle sources, and a multi-
component source mixing is required to explain their genesis. The Eymir
v
metadiabases, however, require contribution from a sediment component that
mixes with a depleted mantle source.
The geochemical data when combined with the geological and petrographical
observations suggest that the Nilüfer metabasic rocks represent ancient oceanic
islands that were created by a heterogeneous mantle plume rising beneath the
Palaeotethyan oceanic lithosphere. During the latest Triassic, these oceanic
islands were incorporated into a subduction/accretion prism, where they mixed
with the continental-derived assemblages of diverse origin, creating the Karakaya
Complex. The intrusion of the SSZ-type metadiabases postdates the formation
A. INFORMATION REGARDING THE STUDY AREAS ……..… 178
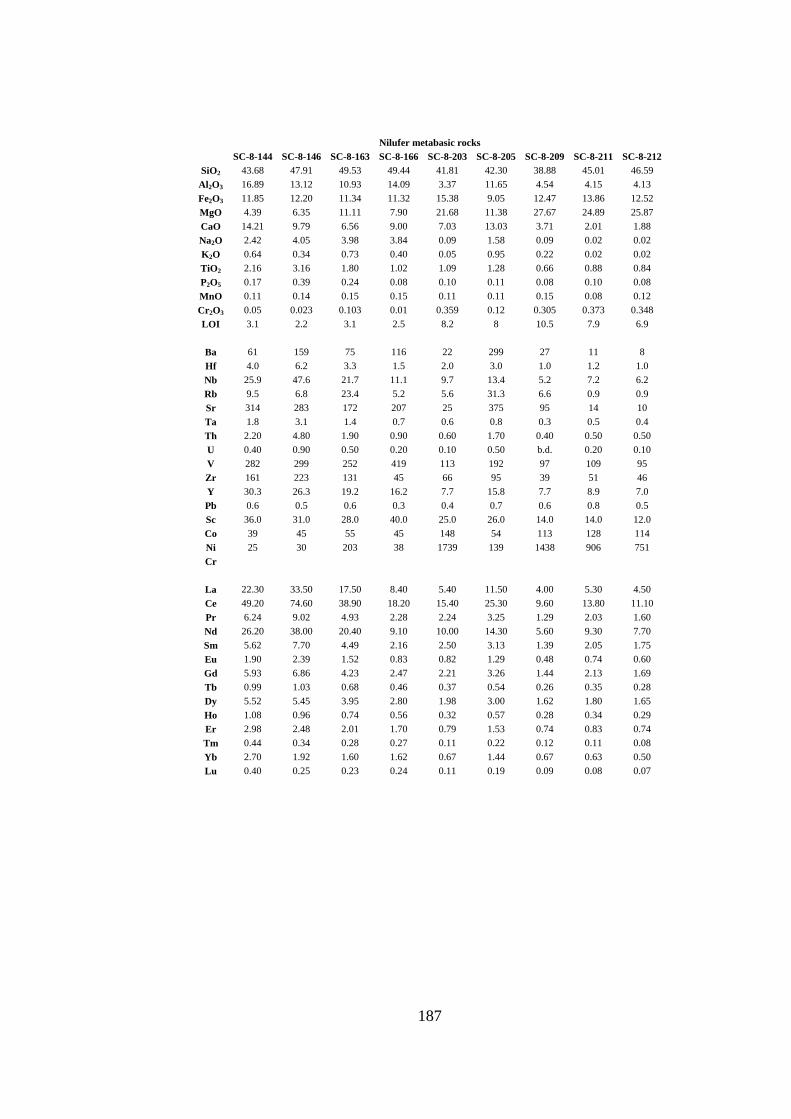
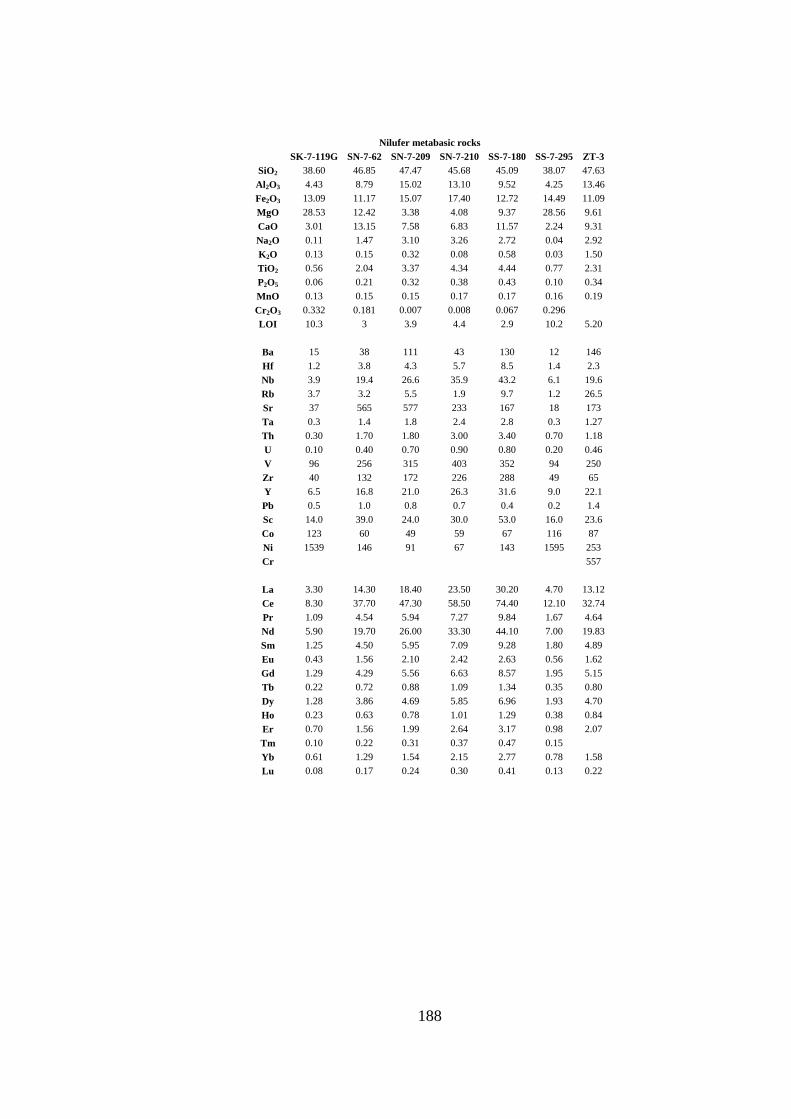
B. GEOCHEMICAL DATA ……………………………………..… 181
xiii
CURRICULUM VITAE ………………………………………………….. 190
1
CHAPTER 1
INTRODUCTION
1.1. Purpose and Scope
Understanding the geology of the northern margin of Turkey is of crucial
importance in revealing the Tethyan events, since it bears the traces of several
continental and oceanic pieces that assembled during the closure of Palaeozoic
and Mesozoic oceanic realms (e.g. Şengör and Yılmaz, 1981; Okay et al., 1996;
Göncüoğlu et al., 1997, 2000). From these, the Late Palaeozoic-Early Mesozoic
“Tethys” had been defined differently by different authors. Şengör et al. (1984)’s
‘‘Palaeo-Tethys’’ was a wide ocean that closed prior to Early Jurassic time and is
sutured in N Turkey. It was consumed by southward subduction to give rise to a
marginal basin (Karakaya Rift Basin in the present study). For Stampfli et al.
(2001), ‘‘Paleo-Tethys’’ is also a wide ocean that was subducted by latest
Triassic time with its sutured remains now located in the Gondwanan Tauride-
Anatolide Platform (e.g. Robertson, 2002). A number of Permo-Triassic back-arc
type marginal basins (e.g. Meliata, Vardar and Karakaya basins) along the
Eurasian southern margin were considered as related to the Paleo-Tethys
(Stampfli, 2000). Ustaömer and Robertson (1994) used the name “Paleotethys”
for the same entity, regardless of its exact location. It was consumed by
northward subduction (Robertson et al., 2004), as it is proposed for the Permo-
Triassic basins in the Caucasus (Adamia et al., 1995) giving way to a pre-Jurassic
subduction complex (Karakaya Complex) with accreted seamounts, oceanic crust
and pieces of a continental crust (Pickett and Robertson, 2004).
2
The geodynamic reconstruction of Palaeotethys is highly debated, as there is no
consensus on the location of the oceanic suture zone and polarity of subduction,
nor critically on the type of magmatism (see Okay and Göncüoğlu, 2004). It is
commonly accepted that the Early Mesozoic Cimmeride Orogeny was product of
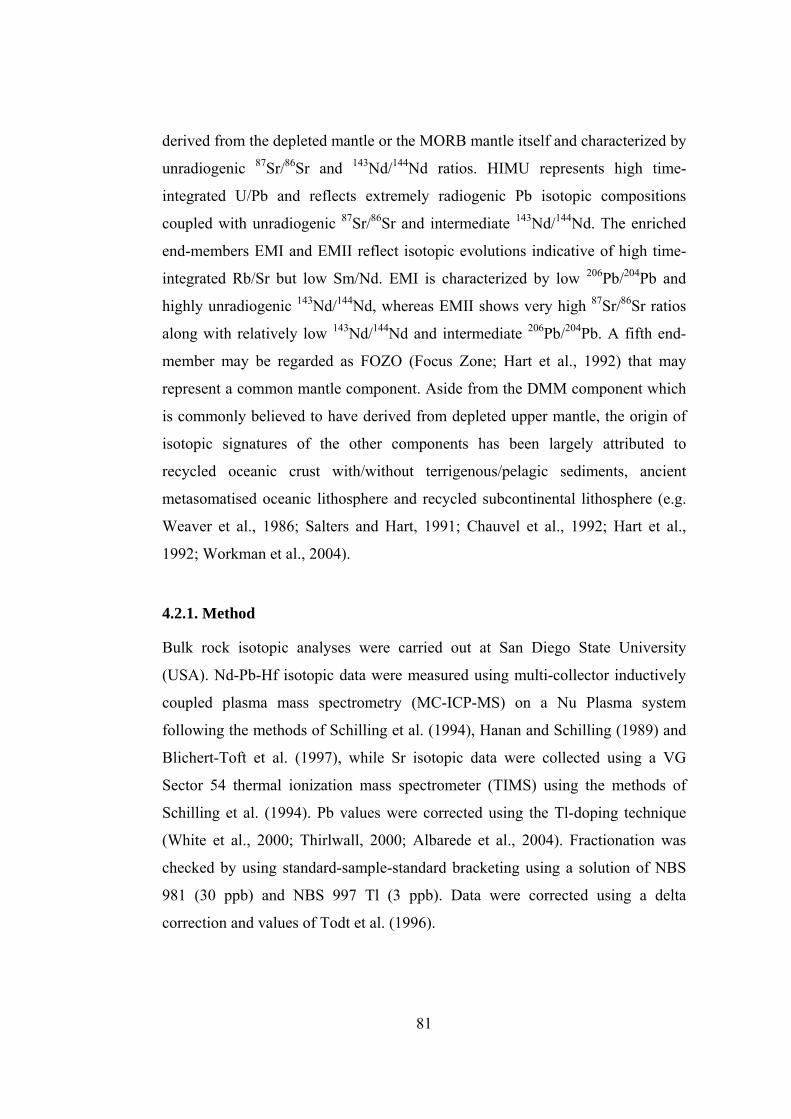
the closure of this Palaeozoic ocean, followed by the accretion of several oceanic
and continental crustal fragments (Tekeli, 1981; Şengör et al., 1984).
The relicts of this subduction/accretion complex cover a substantial portion of
northern Turkey as an east-west trending belt. This tectonic unit, known as the
Karakaya Complex, constitutes a part of the pre-Liassic basement of the Sakarya
Zone (Okay, 1989), or of the Sakarya Composite Terrane (Göncüoğlu et al.,
1997) (Figure 1.1). The Karakaya Complex, however, has been greatly debated
over many years (e.g. Bingöl et al., 1973; Akyürek et al., 1984; Koçyiğit, 1987;
Okay et al., 1991; Altıner and Koçyiğit, 1993; Ustaömer and Robertson, 1994,
1999; Pickett and Robertson, 1996, 2004; Göncüoğlu et al., 2000; Genç, 2004;
Sayıt and Göncüoglu, 2009a). Central to this debate is the degree to which
similarities among disparate units have been recognized, and have consequently
been interpreted as portions of a single large accretionary complex.
The term “mélange” owes his origin to Greenly (1919) when he was first used
this term to characterize the chaotic rock bodies in Anglesey, Wales. Since then,
lots of studies have been carried out regarding the definition and origin of
mélanges, but the debate is still going on (for a detailed review and historical
evolution of this concept, see Raymond, 1984 and Şengör, 2003). Although, no
consensus has been reached on the exact definition of the term “mélange”, it has
become clear that there are two major processes responsible for formation of
mélanges; fragmentation and mixing (e.g. Hsü, 1968; Closs, 1984; Raymond
1984). These processes, triggered by tectonic and/or sedimentary events, form a
variety of mélange types. A common feature observed in these chaotic rock
bodies is the presence of block-in-matrix structure characterized by variable sized
blocks or fragments embedded in a finer-grained matrix (e.g. Raymond, 1984).
3
Figure 1.1. Distribution of the Karakaya Complex in northern Turkey (based on the terrane map of Göncüoglu et al., 1997) and location of the study areas. (A) Ankara region; (B) Central Sakarya Region; (C) Bursa region.
Subduction/accretion complexes are the tectonic environments where mélanges
are frequently observed to develop (e.g. Raymond, 1984; Cloos, 1984). A
common feature of these complexes is the ubiquitous presence of high
pressure/low temperature (HP/LT) mineral assemblages which develop owing to
cold burial of subducting oceanic slab with associated sediments (Coleman and
Lanphere, 1971; Saha et al., 2005). Geochemical signatures of the individual
magmatic suites found within ancient complexes can provide substantial insight
into the origin of subduction/accretion complex worldwide. Individual magmatic
suites thought to have formed in different tectonic settings could actually
represent the products of the same magmatic event regardless of their
metamorphic grade, if these suites have similar geochemical signatures and ages
of formation.
This study aims to reconstruct the ancient pieces making up the Karakaya
Complex in the light of new data from central and NW Anatolia. Taking also into
account the available geochemical and paleontological information on the
metabasic rocks thought to represent the relicts of Cimmeride Orogeny, this study
4
tries to provide an insight into the geodynamics of the Palaeotethyan region
during Permo-Triassic time.
1.2. Study Area
This study covers a number of areas which are mainly located in the central part
of Karakaya Complex and to a lesser extent in the western part (Table 1.1 and
Figure 1.2). The detailed information regarding the study areas can be found in
the Appendix A.
Table 1.1. Study areas that lie along the three main regions between Central and NW Anatolia.
Doğanoluk, Eymir (Gölbaşı), Karataş and Hacılar (Çubuk)
Central Sakarya Region
Karaçobanpınarı, Alpagut, Laçin, Karahisarkozlu and Emremsultan
NW Anatolia (Bursa) Sipali, Bahçecik, Subaşı and Doğancı
1.3. Methods of Study
This study was performed in two stages: a) field studies, b) laboratory studies.
Most of the fieldwork was carried out during the summers of 2005, 2006 and
2007. Approximately 400 hand specimens were collected from these locations
and geological maps on 1:25000 scale topographic maps were prepared for some
localities lying in the central part.
5
Figure 1.2. Location map of the study areas. (A) Ankara region; (B) Central Sakarya Region; (C) Bursa region.
Laboratory work included two steps; a) thin-section preparation, b) geochemical
analyses. Regarding the first step of laboratory work, more than 250 thin-sections
were prepared for petrographical examination under polarizer microscope in
order to understand mineral assemblages and micro-textures, and to make
comparison between the studied samples to reveal possible relationships or
distinctions.
For petrographic examinations, Nikon, Olympus and Swift microscopes were
used and photomicrographs were acquired by Nikon camera in the Department of
Geosciences of the Pennsylvania State University (USA).
Geochemical analysis consisted of two parts, namely whole-rock geochemistry
and isotope analyses. For the whole-rock geochemistry, 35 relatively less altered
samples were analyzed for major and trace elements (including rare earth
elements (REE)) in the labs of Duke University (USA) by direct current plasma
spectroscopy (DCP) and inductively-coupled plasma mass spectroscopy (ICP-
MS), whereas 6 samples were analyzed in the ACME labs (Canada) by
inductively coupled plasma atomic-emission spectrometry (ICP-AES) and ICP-
6
MS. For the isotope chemistry, 16 samples were analyzed for Sr, Nd, Pb and Hf
isotopes by multi-collector (MS) ICP-MS in the labs of San Diego State
University (USA).
1.4. A Review of the Karakaya Complex and the Nilüfer-type Metabasic Assemblages in Central and NW Anatolia
1.4.1. The Karakaya Complex: Definition and Problems
The Karakaya Complex was originally defined by Bingöl et al. (1973) as the
“Karakaya Formation”. This term includes very low-grade metamorphosed rock
assemblages of pre-Liassic age outcropping in Northwestern Anatolia. They
interpret these assemblages to have formed in a continental rift setting, where
Permo-Carboniferous limestone blocks were incorporated into the basin from rift
shoulders owing to the extensional regime during Early Triassic. Later studies
identified similar pre-Liassic assemblages in some other parts, and extended the
limits of the Karakaya complex to the northeastern Turkey (Tekeli, 1981; Okay,
1989; Koçyiğit, 1991a).
In contrast to the continental rift idea of Bingöl et al. (1973), Tekeli (1981)
regarded the Karakaya Complex as a Carboniferous-Triassic subduction/accretion
prism which he termed the “North Anatolian Belt”. He used the mélange
character of the various lithologies found in this belt, and the presence of high-
pressure metamorphism to infer an accretionary prism origin. There is today no
consensus as to whether the Karakaya Complex developed in a rift or a
subduction-accretion complex (e.g. Altıner and Koçyiğit, 1993; Genç and
Yılmaz, 1995; Pickett and Robertson, 1996; Göncüoğlu et al., 2000; Okay, 2000;
Sayıt and Göncüoglu, 2009a) (Figures 1.3 and 1.4).
Several studies regard the Karakaya Complex as an “ophiolitic mélange”
consisting of ophiolites, blueschist facies rocks as well as limestone blocks settled
in an intensely sheared matrix (Şengör et al., 1980; Şengör and Yılmaz, 1981).
Tekeli (1981) also added the entire Neotethys pieces (a part of his “North
7
Anatolian Mélange”) into the definition of the Karakaya Complex, which were
later excluded (e.g. Göncüoğlu et al, 1997, Okay and Tüysüz, 1999). Actually,
ophiolitic rock assemblages are rarely found within the Karakaya Complex. One
of these areas, the Küre region, includes an ophiolitic suite assumed to have been
generated in a supra-subduction zone (SSZ) environment (Ustaömer and
Robertson, 1994; Kozur et al., 2000). Besides, there are assemblages similar to
the Küre ophiolites in NW Anatolia and the Tokat region. It is not clear whether
they are a part of the Karakaya Complex, though they are generally assumed to
be of pre-Liassic age (Koçyiğit and Tokay, 1985; Genç, 1987; Rojay and
Göncüoğlu, 1997).
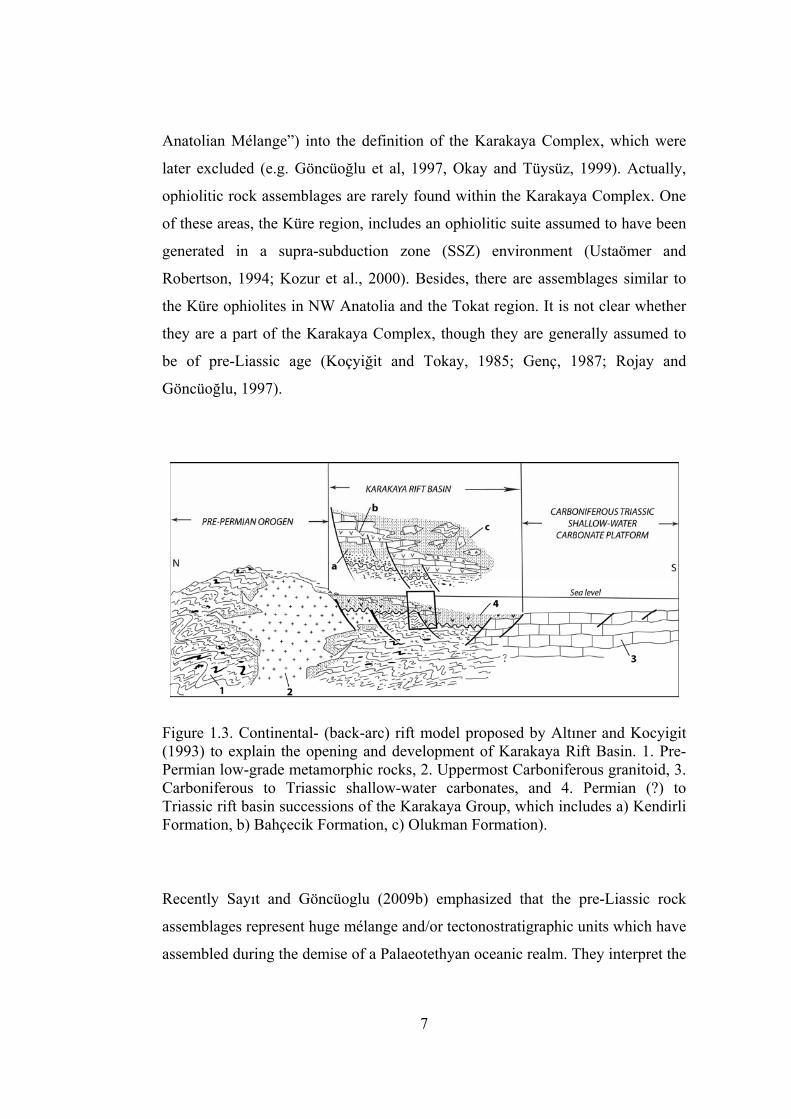
Figure 1.3. Continental- (back-arc) rift model proposed by Altıner and Kocyigit (1993) to explain the opening and development of Karakaya Rift Basin. 1. Pre-Permian low-grade metamorphic rocks, 2. Uppermost Carboniferous granitoid, 3. Carboniferous to Triassic shallow-water carbonates, and 4. Permian (?) to Triassic rift basin successions of the Karakaya Group, which includes a) Kendirli Formation, b) Bahçecik Formation, c) Olukman Formation).
Recently Sayıt and Göncüoglu (2009b) emphasized that the pre-Liassic rock
assemblages represent huge mélange and/or tectonostratigraphic units which have
assembled during the demise of a Palaeotethyan oceanic realm. They interpret the
8
Karakaya Complex as composed of a number of mélange units produced both by
sedimentary and tectonic processes. These mélange units include blocks of both
native and exotic origin whose dimensions range from dm-scale fragments to
masses of several km scale. Some mélange units are megablocks within other
mélange units.
Figure 1.4. Subduction/accretion model put forward by Okay (2000), which explains the geodynamic evolution of the Karakaya Complex by a Middle Triassic-aged oceanic plateau that later have been incorporated into the Laurasian active continental margin.
This study mainly focuses on one particular mélange unit that is characterized by
oceanic island basalt (OIB)- and enriched mid-ocean ridge basalt (E-MORB)-
type metabasic rocks and discusses its tectonomagmatic origin on the basis of
both geological and petrological features. The tectonic setting regarding these
metamorphic rocks and how they have been incorporated into the Karakaya
complex is a subject of controversy. Some studies suggest that they have
developed in a continental-rift setting that failed to pass into ocean-floor
spreading stage (e.g. Bingöl et al., 1973, Akyürek et al., 1984; Koçyiğit, 1987;
9
Altıner and Koçyiğit, 1993; Genç and Yılmaz, 1995; Kozur et al., 2000) or
advanced into the mature oceanic stage (Şengör and Yılmaz, 1981; Şengör et al.,
1984; Stampfli and Borel, 2002; Moix et al., 2008), while others argue that they
are relicts of a seamount and/or oceanic island (Çapan and Floyd, 1985; Pickett
and Robertson, 1996, 2004; Yalınız and Göncüoğlu, 2002), an oceanic plateau
(Okay, 2000), a large igneous province (Genç, 2004) or mantle plume-related
seamounts and/or oceanic islands associated with a spreading ridge (Figure 1.5;
Sayıt and Göncüoglu, 2009a), based on trace element (except Okay, 2000) as
well as REE geochemistry (Sayıt and Göncüoglu, 2009a). A third hypothesis is
that these rock assemblages represent an intra-oceanic (ensimatic) forearc/intraarc
sequence owing to their large distribution within the complex and the alkaline
character of mafic rocks (Okay et al., 1996).
Figure 1.5. Petrological reconstruction by Sayıt and Göncüoğlu (2009a), which relates the Late-Middle alkaline-dominated magmatism to seamounts/oceanic islands fed by a mantle plume that is associated with the Palaeotethyan spreading ridge.
10
As seen from these diverse interpretations, therefore, resolving this question is of
particular importance in order to reveal tectonomagmatic evolution of the
Karakaya Complex as well as Palaeotethyan events. In the light of the new
geochemical data as well as the geological and petrographical observations
performed in this study, the Nilüfer Unit originally defined by Okay et al. (1991)
has been redefined and reevaluated. To avoid repetition, the concepts and
discussion related to the coverage and extent of the redefined Nilüfer Unit are
presented in detail in Chapter 2.
11
CHAPTER 2
REDEFINITION OF THE NİLÜFER UNIT AND REGIONAL AND
LOCAL GEOLOGICAL FEATURES
2.1. The Redefined Nilüfer Unit: Its Coverage and Extent within the Karakaya Complex on the Basis of Regional and Local Constraints
During the regional geological mapping in NW and N Anatolia, several authors
(for a review see Okay and Göncüoğlu, 2004) have identified a number of
mappable tectono-stratigraphic units within the Karakaya Complex. Of these
units, the clastic-dominated units with metabasalt and limestones olistoliths (Çal,
Hodul and Orhanlar units of Okay et al., 1991) were considered as the Upper
Karakaya Complex (e.g. Okay and Göncüoğlu, 2004). The Nilüfer Unit, on the
other hand, was defined as a separate tectonic unit (the Lower Karakaya
Complex) characterized by a strongly deformed low-grade metamorphic
assemblage consisting mainly of metabasite, phyllite and marble. The detailed
fieldwork in NW Anatolia reported in this study, including the preliminary results
(Sayıt and Göncüoğlu 2009a,b; Sayıt et al., 2008, 2009) are based on
geochemistry and paleontological ages. By this, it is shown that these basic
volcanic rocks and associated sediments are not restricted only to the Nilüfer Unit
of Okay et al (1991), but may be found in all previously defined units (Çal Unit,
Hodul Unit, etc.) of the Karakaya Complex as blocks or tectonic slices (Sayıt and
Göncüoğlu, 2009a,b). Therefore, in this study, these rock assemblages were
assembled and redefined by considering their age, lithology and geochemical
characteristics rather than their structural setting and metamorphic grade.
12
The redefined Nilüfer Unit is characterized primarily by metabasaltic
massive/pillow lava flows and pillow breccias, interbedded with volcaniclastics,
mafic tuffs, variably recrystallized neritic and pelagic limestones, and minor
brick-red cherts and mudstones (e.g. Sayıt and Göncüoğlu, 2009a). The Nilüfer-
type rock assemblages are prevalent throughout N, NW and Central Anatolia
(Akyürek et al., 1984; Göncüoğlu et al., 1987; Koçyiğit et al., 1991; Okay et al.,
1991; Sayıt and Göncüoğlu, 2009a). The most characteristic feature of this unit is
the occurrence of alkaline basalts with associated carbonate and/or cherty rocks.
In the Biga Peninsula, the newly defined Nilüfer Unit together with the pre-
Karakaya units (the Kalabak Formation, the Çamlık metagranodiorite and the
Kazdağ Group) constitute the pre-Liassic basement of Sakarya Composite
Terrane (Göncüoğlu et al., 1997). The redefined Nilüfer Unit characterizing a
Karakaya Unit in the region is found to be tectonically related to the pre-
Karakaya Unit mentioned above (Bingöl et al., 1973; Okay et al., 1991) (Figure
2.1). The Kalabak Formation includes low-grade metaclastics and intruded by
Devonian Çamlık metagranodiorite. Late Triassic clastics of the Eymir Unit (the
Hodul Unit of Okay et al., 1991) lie unconformably over the Kalabak Formation
(Okay et al., 1991).
The Kazdağ Group consisting mainly of gneiss, migmatite, amphibolite and
marble (Bingöl et al., 1973) characterize the oldest rock assemblage in the Biga
Peninsula. A Moscovian age (308±16 Ma) acquired from the gneisses from this
unit is interpreted to represent the age of high grade metamorphism and
migmatization in the Kazdağ range (Okay et al., 1996). The Kazdağ Group
tectonically underlies the two Karakaya-related assemblages in the east, namely
the newly defined Nilüfer Unit and the Eymir Unit (Okay et al., 1991).
In the Biga Peninsula, two major tectonostratigraphic units represent the
Karakaya Complex; the redefined Nilüfer Unit and the Eymir-type clastics (the
Orhanlar Greywacke and partly Hodul Unit). The Nilüfer Unit is largely found as
variably deformed metabasic rocks interbedded with recrystallized limestone and
13
Figure 2.1. Distribution of the tectono-stratigraphic units included in the Karakaya Complex and the other units in NW Anatolia (after Okay et al., 1996). Note that this map is based on the original definition of Nilüfer Unit and given here with no changes.
14
phyllite (Okay et al., 1991). Although these metabasics appear to have been
metamorphosed under greenschist facies conditions, high pressure equivalents,
such as blueschists and eclogites, can also be encountered (Okay and Monie,
1997). In NW Anatolia, the redefined Nilüfer Unit comprises the originally
defined Nilüfer Unit of Okay et al. (1991) and Çal Unit (Okay et al., 1991), the
Bahçecik Formation (Koçyiğit et al., 1991) and a part of the Ortaoba Unit
(Pickett and Robertson, 1996). The Karakaya Formation of Bingöl et al., (1973)
is partially included in the unit, since the arkosic sandstones and greywackes
which commonly crop out in NW and Central Anatolia are excluded from the
definition given by this study. The Çavdartepe Formation (Akyürek and Soysal,
1983), the İznik Metamorphics (Göncüoğlu et al., 1987), and the Yenişehir
Metamorphics (Genç and Yılmaz, 1995) are also partly included within the
definition of the newly defined Nilüfer Unit.
The age of Nilüfer Unit is regarded as Early Triassic on the basis of conodont
fauna found in the marbles alternating with metabasites in the south of Bursa
(Kozur et al., 2000), while an Early-Middle Triassic age has been ascribed on the
basis of conodont-bearing metabasalts by Genç (1987). Kaya and Mostler (1992)
have assigned a Middle Triassic age to the unit based on the conodonts in the
limestones interbedded with the metabasaltic rocks found in the north of
Bergama. In the Edremit region, a Middle-Late Triassic age has been reported by
Sayıt and Göncüoğlu (2009a) based on a conodont-bearing chert band associated
with metabasalts, which places an upper age limit on these metabasaltic
assemblages. Thus, in NW Anatolia, the redefined Nilüfer Unit appears to span
an age-range from Early to Late Triassic.
In Central Sakarya, the Tepeköy Metamorphics of Göncüoğlu et al. (2000) lying
within the lower slice of the Central Sakarya Basement are similar to the
redefined Nilüfer Unit, although they include terrigenous material and metafelsic
tuffs that are conspicuously absent elsewhere (Okay et al., 1996; Pickett and
Robertson, 1996; Sayıt and Göncüoğlu, 2009a). However, this study reveals that
the metabasaltic portion of the Tepeköy Metamorphics has the same geochemical
15
signatures with the newly defined Nilüfer Unit and these basic rocks are found as
blocks within the clastic material.
In Ankara region (Central Anatolia) (Figure 2.2), the redefined Nilüfer Unit
constitutes the oldest rock assemblages together with the Eymir Unit (defined by
this study; see following paragraphs for a detailed discussion regarding this unit),
and it is represented by variably-sized metabasic blocks associated with
limestones, set in a low-grade metaclastic matrix represented by the Eymir Unit
(Koçyiğit, 1987; Sayıt and Göncüoğlu, 2009a). In this region, the redefined
Nilüfer Unit includes the Ortaköy Formation (Akyürek et al., 1984) and the
Bahçecik Formation (Altıner and Koçyiğit, 1993; Sayıt and Göncüoğlu, 2009a).
The Eymir Complex (Koçyigit, 1992) or the Emir Formation (Akyürek et al.,
1984) from the same region cannot be evaluated entirely within the context of the
Nilüfer-type metamorphics, though some studies regard it as a part of the Nilüfer
Unit (Okay, 2000, Genç, 2004). In contrast to the metabasalt-dominant sequences
seen in the Nilüfer Unit, the Eymir Complex consists largely of metaclastics
(slates, phyllites, metasandstones, metaconglomerates) including minor
volcaniclastics, all of which are intruded by metadiabase dikes (Sayıt and
Göncüoğlu, 2009a). The Eymir Complex also includes rare variably-sized mafic
and ultramafic blocks, some of which appear to have experienced elevated
pressure conditions (Sayıt and Göncüoğlu, 2009a). These metaigneous blocks
with/without high pressure signatures bear enriched geochemical signatures akin
to OIB and E-MORB (Sayıt et al., 2008), therefore a small portion of the Eymir
Complex is included in the new definition.
The age of the redefined Nilüfer Unit is constrained by paleontological findings.
The paleontological ages are essentially consistent with the ones acquired from
NW Anatolia. A Middle Triassic age has been obtained from the neritic
limestones of the unit in the Ankara region (Akyürek et al., 1984). A tighter
constraint has been provided from the Hasanoğlan (Ankara) region by Altıner and
Koçyiğit (1993) which suggest a Late Anisian (Middle Triassic) age for the
shallow-water limestones intercalated with pillow basalts. Another precise
16
constraint from foraminiferal fauna found in the neritic limestones of the İmrahor
(Ankara) region (Sayıt and Göncüoğlu, 2009a) ascribes the age of unit to Middle
Anisian (Middle Triassic). Taken together, these paleontological data imply a
Middle-Late Triassic interval for the age of the redefined Nilüfer Unit.
Figure 2.2. Distribution of the major tectonostratigraphic units in the Ankara region (after Koçyiğit, 1991b). Note that no change has been made on the map regarding the redefined units.
The other unit, redefined in this study, is the clastic rock assemblages
outcropping all along the complex. These clastic lithologies have been previously
defined under various names in different areas (e.g. Okay and Göncüoğlu et al.,
2004). They are found to be variably deformed and metamorphosed just like the
metabasic rocks characterizing the redefined Nilüfer Unit (e.g. Sayıt and
17
Göncüoğlu, 2009a). Some previous studies regard these clastics primarily
associated with the metabasaltic lithologies that have been defined here under the
context of the new Nilüfer Unit (Bingöl et al., 1973; Akyürek et al., 1984;
Koçyiğit, 1987; Altıner and Koçyiğit, 1993; Genç and Yılmaz, 1995; Pickett and
Robertson, 1996), whereas some others have treated them separately (e.g. Okay,
2000; Sayıt and Göncüoğlu, 2009a). This study provides a good distinction
between the metabasaltic lithologies and clastics, suggesting they are not
primarily associated, but incorporated during the closure of the Palaeotethys. In
this study, the clastic lithologies are collectively defined as the “Eymir Unit”.
In the Ankara region, the Eymir Unit partially comprises the Eymir Complex
(Koçyiğit, 1992) or the Emir Formation (Akyürek et al., 1984), the Elmadağ
Formation (Akyürek et al., 1984), the Elmadağ Blocky Series (Erol, 1956), the
Limestone Blocky Mélange (Norman, 1973), and the Kulm Flysch Formation
(Erk, 1977). The Eymir Unit differs from these previously defined units in that it
does not include any metabasic rocks with E-MORB and OIB-type signatures
(the Nilüfer Unit as defined here). It consists largely of metasandstones
alternating with slates and phyllites. In the areas where the degree of
metamorphism is very low or non-evident shales and coarser-grained clastics
with no observable deformation are encountered instead. Some parts of the Eymir
Unit reflect olistostromal character, containing blocks of different origins. These
assemblages correspond, in NW Turkey, to the Dışkaya Formation (Kaya et al.,
1986; Kaya, 1991) and the Orhanlar Greywacke (Okay et al. 1991). Although
there are some other rock assemblages that also comprise arkosic sandtones, they
actually differ from the Dışkaya Formation in the presence of metabasalt-chert
alternations (the Hodul Unit of Okay et al., 1991, the Ortaoba Unit of Pickett and
Robertson, 1996, the Kendirli Formation of Koçyiğit et al., 1991, and the
Elmadağ Formation of Akyürek et al., 1984). However, as stated before, in these
units the metabasalt-chert alternations are included in the redefined Nilüfer Unit.
The arkosic parts as well as greywackes, on the other hand, comprise the
lithologies of Eymir Unit as defined in this study. In NW Anatolia, Sayıt and
18
Göncüoğlu (2009a) also separated the arkosic sandstones from the Ortaoba Unit
and evaluated the metabasalt-chert sequences as oceanic-derived lithologies.
The age of the Eymir Unit comes from the relatively less metamorphosed parts of
the unit. The “Halobia shales” occurring as blocks within the olistromal parts of
the unit indicate a Norian (Late Triassic) age (Kaya et al., 1986). Similar Halobia
macrofauna that constrains the age of these clastics to Late Triassic has also been
reported by some other studies (Okay et al., 1991; Wiedmann et al., 1992; Leven
and Okay, 1996; Okay and Altıner, 2004). In constrast to these studies whose age
findings are based on the halobia macrofauna, Okay and Altıner (2004) have
suggested the same age (Late Triassic) on the basis of the neritic limestones that
they believe to be primarily associated with the clastics. In the Ankara region, a
similar age has also been obtained for the Eymir unit. Özgül (1993) assigned a
Carnian-Rhaetian age (Late Triassic) on the basis of the fossil fauna in the
limestones of the unit. However, Akyürek et al. (1984) have suggested a wider
interval, assigning an Early-Late Triassic age. In this study, a Carnian-Norian age
(Late Triassic) is suggested based on the radiolarian fauna found in the red chert
band within clastics of the Eymir Unit (see the following section for the details).
This finding seems very consistent with the previous works stated above which
suggest a Late Triassic age for the Eymir Unit. Although it does reflect the age of
unit, the finding of Carboniferous radiolarian chert block emplaced within the
greywackes of the unit in NW Anatolia was also essential, since it is indicative of
occurrence of a deep basin during Palaeozoic time (Okay and Mostler, 1994).
The paraautochthonous Ankara Group (Koçyiğit, 1987) unconformably overlies
the pre-Liassic Nilüfer and Eymir Units. It consists of a thick, discontinuous
sedimentary succession that is ascribed to late Hettengian-Campanian. The
Hasanoğlan Formation (Akyürek et al., 1982) forms the bottom of this sequence,
including poorly-sorted fluvial conglomerates that are followed by trangressive
marine sequence. The Hasanoğlan Formation shows a lateral transition to the
volcanic rocks-limestone alternation of the Günalan Formation (Akyürek et al.,
19
1996). The Hasanoğlan Formation is gradually replaced by the pelagic limestones
of Akbayır Formation (Akyürek et al., 1982).
The Jura-Cretaceous Anatolian Complex (Koçyiğit and Lünel, 1987) is
tectonically related with pre-Liassic Karakaya Units and the Ankara Group. The
Anatolian Complex is tectonically overlain by the Karakaya Units, whereas it lies
tectonically over the Ankara Group. The Anatolian Complex comprises three
sub-units (Akyürek et al., 1996), namely Jurassic-Early Berrasian Eldivan
Ophiolitic Complex (Akyürek et al., 1979b), the Early Cretaceous Dereköy
Ophiolitic Mélange (Ünalan et al., 1976; Batman, 1977) and the Dereköy
Ophiolitic Mélange associated with Late Cretaceous sedimentary units.
A thick flyschoidal sequence characterize Late Cretaceous-Early Tertiary interval
in the Ankara region, which conformably overlies the ophiolitic mélange lying at
the bottom. This sequence is unconformably overlain by younger volcano-
sedimentary units.
2.2. Local Geological Features
This study mainly includes three study areas; a) Ankara region (Central
Anatolia), b) Central Sakarya region, c) Bursa region (NW Anatolia). Among
these study areas, the fieldwork was performed only in the Ankara and Bursa
regions. It must be noted that since there are numerous localities studied in the
Ankara region, the areas sharing similar geological features will be evaluated
together in the following sections. Regarding the Central Sakarya region, the
studied samples were collected by Dr. M.C. Göncüoğlu during the fieldwork he
carried out in 1987-1988, and a detailed geological description of this region was
given in the MTA report by Göncüoğlu et al. (1996). Thus, the geological
features concerning this region were briefly summarized on the basis of this
report.
20
2.2.1 Ankara Region (Central Anatolia)
2.2.1.1. Zerdalitepe, Bayındır, Ortaköy, Gökçeyurt, and Hacılar (Gölbaşı)
These study areas are represented by the Nilüfer Unit and Eymir Unit (Figures
2.3 to 2.5), and the dominancy of one unit over the other appears to be variable
from one place to another. The Nilüfer Unit outcropping in these areas is mainly
characterized by metabasaltic lava flows (both pillowed and massive) and
metavolcaniclastics (e.g. hyaloclastic breccias, hyaloclastites), which alternates
with limestone, mudstone, and minor cherts. It is important to note that the
relationship between these rocks appears to be primary, thus suggesting their
synchronous nature (Figures 2.6 and 2.7). This is especially well evidenced that
both basalt and limestone can be observed as clasts within each other, i.e.
limestone clasts can be sometimes observed within the basalts, or basalt may be
found as clasts within the limestone. These metabasaltic successions are observed
as variably-sized blocks embedded in a clastic matrix of terrigenous origin that is
variably deformed and metamorphosed (the Eymir Unit).
Apart from the metabasalts and associated metavolcaniclastics which comprise a
significant portion of the unit, there also occur minor metagabbroic rocks in the
studied region. These intrusive rocks are observed either as blocks (with sizes
generally not exceeding one meter) or primarily related bodies (with a cross-cut
relationship) within metabasaltic sequences. One such place is the Gökdere
Valley lying to the northwest of İmrahor village. In this locality, the
metagabbroic blocks are found within the Nilüfer-type metavolcaniclastics. The
metagabbos here are hardly differentiated from the metavolcaniclastics owing to
intense shearing, and appear as highly broken and jointed bodies. Indeed, some
volcaniclastic parts are observed to have been foliated, indicating the intensity of
deformation.
Another locality, namely, the Ortaköy also comprises such metagabbroic
occurrences. To the west of the area, approximately 1 km away from the Ortaköy
village, the Nilüfer-type assemblages including mainly volcaniclastics and
21
silicified tuffs are observed to have been intruded by a metadiabase body.
Although the contact relationship between the metadiabase dike and the
surroundings is not so clear due to intense deformation within the unit, the
margins of the metadiabase are found to be observed finer-grained as compared
to its inner parts. Therefore, this clearly indicates the cross-cutting relationship of
Figure 2.3. Geological map of the Ankara region including an area between Bayındır and Hacılar (modified from the 1/100000 scale MTA geological map compiled by Akyürek et al., 1997, and Sayıt and Göncüoğlu, 2009a). Locations of the geochemically analyzed samples are shown on the figure.
22
Figure 2.4. Geological map of the Zerdalitepe and Bayındır region (partially based on the 1/100000 scale MTA geological map compiled by Akyürek et al., 1997). Locations of the geochemically analyzed samples are shown on the figure.
Figure 2.5. Geological map of the Ankara region including an area between Bayındır and Hasanoğlan (modified from the 1/100000 scale MTA geological map compiled by Dönmez et al., 2008). Locations of the geochemically analyzed samples are shown on the figure.
23
the metadiabase body. This metadiabase itself also appear to be sheared, and such
parts can be differentiated by the presence of distinct foliation. This megascopic
observation is also confirmed by microscopic examination such that even the less
deformed parts that have relatively massive appearance display ductile
deformation as indicated by elongated clinopyroxene phenocrysts found in a
foliated matrix composed of mainly of actinolites. The metadiabase body is
observed to have sheared contacts with the Eymir metaclastics.
Figure 2.6. Synchronous nature of basaltic lava flow and limestone within the Nilüfer Unit (Hacılar, Gölbaşı).
Another similar occurrence is found to the south of İmrahor along the Ankara
peripheral highway. Here, the Nilüfer-type assemblages are observed as a
relatively small block which is cross-cut by a metadiabase body which is of OIB-
type geochemical character. It is noteworthy, however, that these metagabbroic
bodies (either blocks or intruding bodies) are the products of the same
magmatism that has generated the metabasalts (i.e. E-MORB- and OIB-type
24
magmatism). The other type, namely, the Eymir metadiabases are considerably
different, both in terms of mineralogical assemblage and geochemistry and
should not be confused with each other.
Figure 2.7. The primary relationship between pelagic limestones and metabasalts within the Nilüfer Unit (Zerdalitepe).
The metabasalts studied in this area are represented by both pillowed and massive
lava flows, though an exact characterization is generally difficult in many cases,
owing to the deformation they have undergone. The pillowed basalts can be
especially well observed in the parts dominated by pillow breccias in Ortaköy
area. These pillowed lava fragments are seen as variably-sized ellipsoidal bodies
(sometimes exceeding 50 cm) which are set in a basaltic matrix. They generally
appear highly amygdaloidal, indicating formation in relatively shallow levels.
There also occur hyaloclastites composed of abundant glass fragments (glass
shards) now entirely turned into secondary minerals, such as chlorite and
smectite? The influence of low-grade metamorphism on the metabasalts studied
25
in the area is evidenced by their greenish colors. Rarely, also observed are high-
MgO varieties of these metabasalts, and they can be differentiated in the field by
the presence of abundant large pseudomorphosed olivine phenocrysts (see
Chapter 3). The gabbroic rocks in the study area range from fine-grained diabasic
varieties to coarser medium-grained ones. The high-MgO metagabbros, like the
extrusive counterparts, are characterized by various olivine phenocrysts now
replaced entirely by secondary mineral phases. These rocks are also observed as
greenish colored, indicative of low grade alteration/metamorphism.
The volcanoclastic lithologies that represent the products of basaltic volcanic
activity, such as pillow breccias, hyaloclastites, are widespread in the study area.
In the places where the deformation has not been so effective, it is possible to
observe these clastic assemblages as regular layered bodies on top of each other.
The clast-size ranges in a wide spectrum, so resulting in varieties that range from
tuff to breccias. In the coarse-grained lithologies, the presence of numerous lava
fragments of variable size can be observed very well, which are embedded in a
weakly foliated matrix composed dominantly of chlorite and calcite. Carbonate
rock fragments (i.e. limestone, dolostone) also occur within these clastic
lithologies. In Ortaköy and Bayındır, the volcaniclastics are seen primarily with
limestones, where the latter can be found as lens-shaped bodies within basaltic
matrix of pillow breccias, or sometimes thick limestone bodies are observed
alternating with mafic tuffs (Figure 2.8). In these localities, namely Ortaköy and
Bayındır, these tuffaceous rocks are found to be silicified, probably indicating the
deposition of silica in the quiescence of magmatism. These silicified assemblages
can be seen as well-bedded bodies within the basaltic-volcaniclastic succession
(Figure 2.9). In Ortaköy and Gökçeyurt, these tufficeous rocks are found to have
been affected by high pressure metamorphism, and can be easily identified by
their bluish colors. These metatuffs bearing Na-amphibole are observed as
primary related with limestone (Figure 2.10).
26
Figure 2.8. Primary relationship observed between mafic tuff and limestone within the Nilüfer Unit (Bayındır).
Figure 2.9. Silicified tuff layers interbedded with volcaniclastics within the Nilüfer Unit (Ortaköy).
27
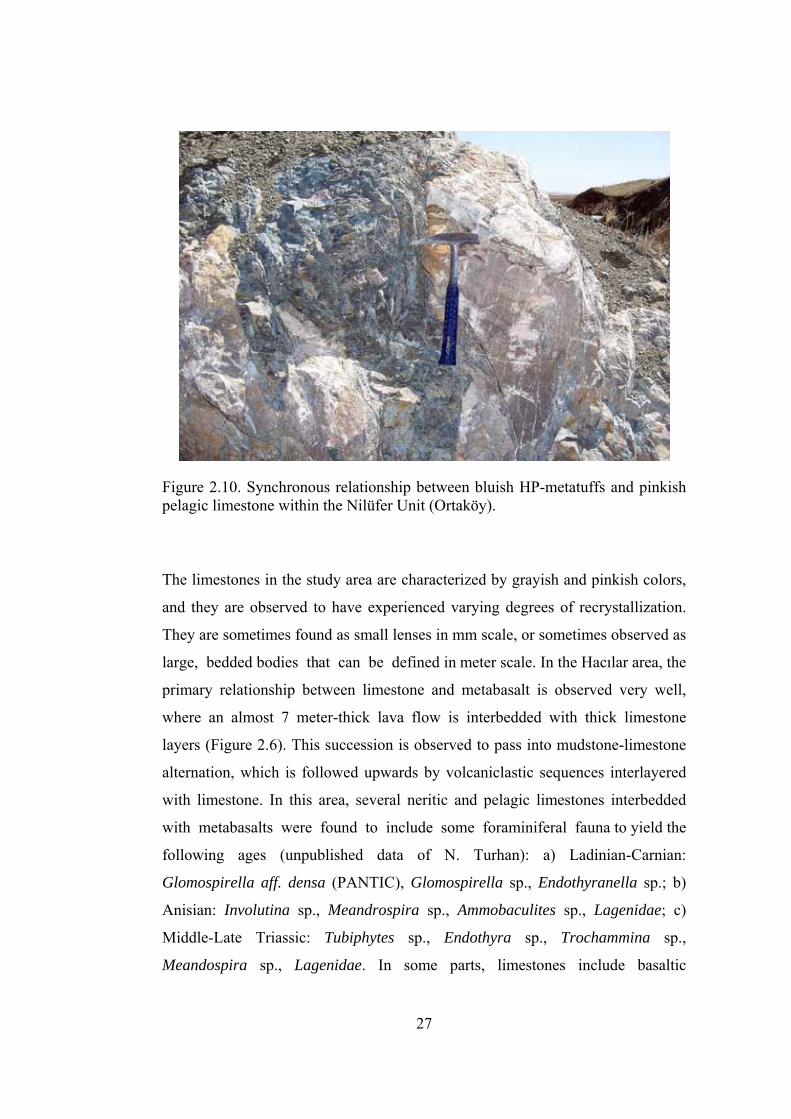
Figure 2.10. Synchronous relationship between bluish HP-metatuffs and pinkish pelagic limestone within the Nilüfer Unit (Ortaköy).
The limestones in the study area are characterized by grayish and pinkish colors,
and they are observed to have experienced varying degrees of recrystallization.
They are sometimes found as small lenses in mm scale, or sometimes observed as
large, bedded bodies that can be defined in meter scale. In the Hacılar area, the
primary relationship between limestone and metabasalt is observed very well,
where an almost 7 meter-thick lava flow is interbedded with thick limestone
layers (Figure 2.6). This succession is observed to pass into mudstone-limestone
alternation, which is followed upwards by volcaniclastic sequences interlayered
with limestone. In this area, several neritic and pelagic limestones interbedded
with metabasalts were found to include some foraminiferal fauna to yield the
following ages (unpublished data of N. Turhan): a) Ladinian-Carnian:
Glomospirella aff. densa (PANTIC), Glomospirella sp., Endothyranella sp.; b)
Anisian: Involutina sp., Meandrospira sp., Ammobaculites sp., Lagenidae; c)
Meandospira sp., Lagenidae. In some parts, limestones include basaltic
28
fragments, suggesting that the basaltic pieces should have been integrated into
limestone while it was still unconsolidated (Figure 2.11). Or, in a similar manner,
the basalt can include limestone fragments in it (Figure 2.12).
Figure 2.11. Basaltic fragments within limestone, indicating that they have been incorporated into limestone while it was not entirely consolidated (Bayındır).
Mudstones are represented by reddish colors, and generally observed as thin-
bedded bodies within limestone or basaltic assemblages (Figure 2.13). In the
study area, there also occur, to a lesser extent, cherts found to alternate with
basaltic lithologies or the metaclastics that forms the matrix on which the basaltic
assemblages are embedded. In the Ortaköy area, within the Eymir Unit, a pinkish
chert band interbedded with mudstones and metaclastics has been found to be of
Carnian age (Late Triassic; det. by Dr. U.K. Tekin) on the basis of the following
1997), Canoptum inornatum TEKIN, 1999, Canoptum levis TEKIN, 1999, ?
29
Corum sp., Annulotriassocampe sp. cf. A. baldii KOZUR, 1994,
Annulotriassocampe sp. cf. A. sulovensis (KOZUR & MOCK, 1981). The
importance of this finding is given in Chapter 5.
Figure 2.12. Limestone fragments observed inside altered basalt within the Nilüfer Unit (Hacılar, Gölbaşı).
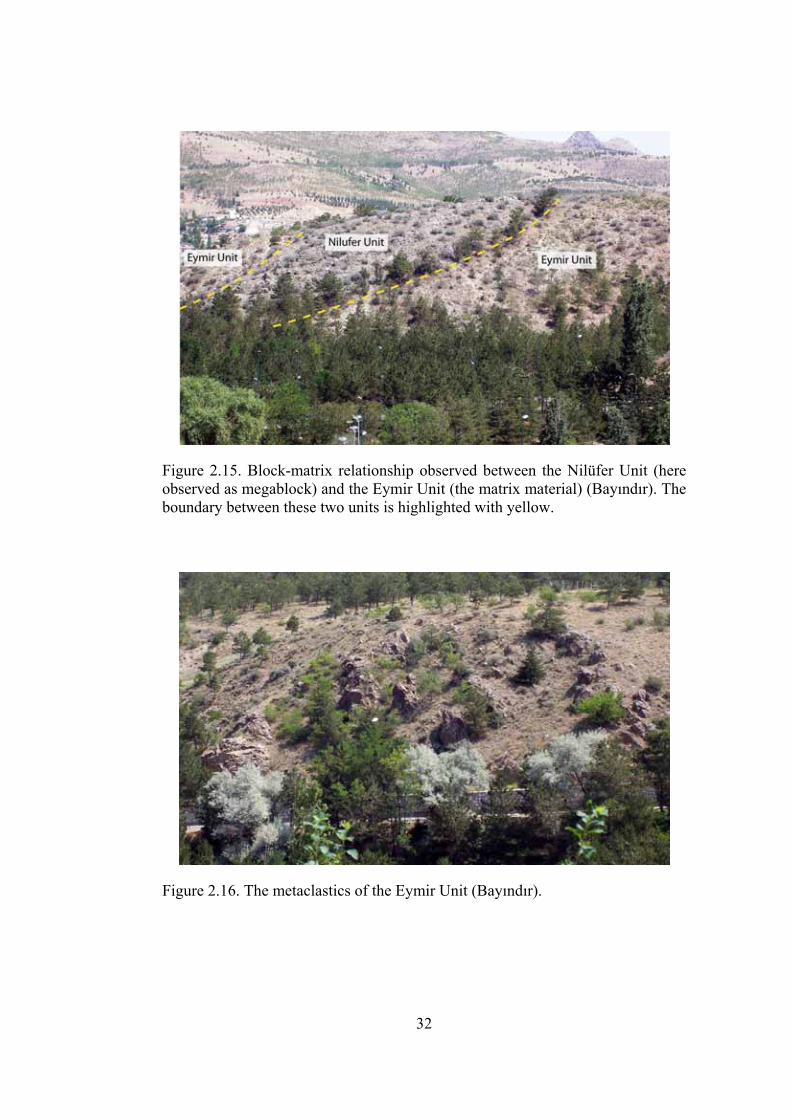
Apart from the metabasaltic assemblages (including also limestone, mudstone
and chert) which represent the Nilüfer Unit, there also occur metaclastic
assemblages, namely the Eymir Unit, which forms the matrix material in which
the Nilüfer Unit is embedded (Figures 2.15). Thus, the Nilüfer Unit is found to be
as variable-sized blocks within the Eymir Unit. It is important to note that the
clastic lithologies within the Nilüfer Unit (i.e. volcaniclastics, hyaloclastic
breccias) are all ocean-derived, however, the Eymir Unit comprises clastics of
terrigenous origin.
30
Figure 2.13. Alternation of reddish thin-bedded mudstone with limestone, observed within the Nilüfer Unit (Bayındır).
The clastic lithologies of the Eymir Unit (Figure 2.16) are characterized largely
by brownish and grayish colors, and include slates, phyllites, metagreywackes
and metaconglomerates. The intensity of deformation and metamorphism on
these rocks is highly variable; sometimes these clastic rocks display no
observable foliation and deformation, but sometimes they are found to be
intensely deformed and have well-developed schistosity planes. The influence of
deformation can also be observed in macro-scale, where the primary bedding
planes are no longer observable, instead they are seen folded and sheared. A
weak foliation development can also be observed on metaconglomerates,
resulting in elongated clasts. Metasandstones in the study area are represented by
greywackes and arkosic varieties, and in some places mica-rich sandstones are
also identified with their shiny appearances. On the basis of the clasts making up
the Eymir metaclastics are considered, it can be suggested that the clasts have
been derived from a number of sources. This polygenetic nature is especially well
observed on the conglomeratic varieties.
31
Figure 2.14. Scanning electron micrographs of early to middle Carnian (Late Triassic) Spumellaria (Radiolaria) from the Karakaya Complex near city of Ankara. Scale = number of microns for each figure. 1. Triassocrucella sp., sample no. 08-Orta-1, scale bar = 250µm, 2-3. Paronaella claviformis (KOZUR & MOSTLER,1978), both samples are from sample no. 08-Orta-1, scale bar for both figures= 225µm, 4. Paratriassoastrum sp., sample no. 08-Orta-1, scale bar = 170µm, 5-8. Canoptum cucurbita (SUGIYAMA, 1997), all samples are from sample no. 08-Orta-1, scale bar for all figures= 100µm, 9. Canoptum inornatum TEKIN, 1999, sample no. 08-Orta-1, scale bar = 100µm, 10. Canoptum levis TEKIN, 1999, sample no. 08-Orta-2, scale bar = 80µm, 11. ? Corum sp., sample no. 08-Orta-1, scale bar = 110µm, 12-13. Annulotriassocampe sp. cf. A. baldii KOZUR, 1994 Group, 12. Sample no. 08-Orta-1, 13. Sample no. 08-Orta-2, scale bar for both figures = 130µm, 14-16. Annulotriassocampe sp. cf. A. sulovensis (KOZUR & MOCK, 1981), 14. Sample no. 08-Orta-1, 15-16. Sample no. 08-Orta-2, scale bar for all figures = 120µm.
32
Figure 2.15. Block-matrix relationship observed between the Nilüfer Unit (here observed as megablock) and the Eymir Unit (the matrix material) (Bayındır). The boundary between these two units is highlighted with yellow.
Figure 2.16. The metaclastics of the Eymir Unit (Bayındır).
33
2.2.1.2. İmrahor
A part of this area was previously studied in general terms by Sayıt (2005) and
Sayıt and Göncüoğlu (2009a). Here the metabasic rocks in the southern sector of
this area will be described detail.
The metabasic rocks are characterized by purplish, bluish and greenish colors,
and they are observed as variable-sized blocks within the metaclastics of the
Eymir Unit (Figure 2.17). The block-contact boundaries of these lithologies are
sometimes identified as sheared probably owing to a later tectonic event after
their mixing. The metabasaltic rocks display varying degrees of schistosity, and
on the basis of their original protoliths, they have been interpreted to represent
largely mafic tuffs and volcaniclastics (Figure 2.18).
Figure 2.17. The HP/LT metabasic rocks of the Nilüfer Unit (blue-purple) in contact with the metaclastics of the Eymir Unit (brownish) (İmrahor).
34
Figure 2.18. Coarse-grained mafic metavolcaniclastics within the Nilüfer Unit (İmrahor). Note the elongation of basalt fragments and foliation in the matrix, which defines the schistosity. The matrix is largely composed of chlorite and calcite.
The basalt clasts within the coarse-grained volcaniclastics are observed to have
gas vesicles some of which have been filled by secondary minerals, showing
amydaloidal appearance. The original layering between coarse-grained
volcaniclastics (e.g. hyaloclastic breccias) and fine-grained ones (e.g. metatuffs)
can be still recognized in spite of deformation and metamorphism (Figure 2.19).
Both varieties, however, appear to have been strongly overprinted by high
pressure metamorphism as indicated by the presence of numerous Na-amphibole
crystals.
In some cases, the intense carbonate influx that has probably developed at the
same time with these mafic volcanic products formed is reflected by the presence
of numerous calcite crystals. This process is sometimes so intense that some of
these metamorphic rocks appear to contain calcite constituting more than 50% of
the entire mineral assemblage. These carbonate-rich rocks are observed to have
been experienced intense ductile deformation; however, the presence of
35
amygdaloidal basalt clasts can be still identified in spite of the deformation. The
greenish portions seen in these carbonate-rich metamorphic rocks probably
represent the basaltic matrix material in which the basaltic fragments are
embedded or the tuffaceous levels interlayered with the basalt flows. In some
parts of the area, it is also possible to observe greenish metabasalts without any
high pressure imprint. These metamorphic rocks, however, are found to have
been severely altered by carbonate minerals. They show amygdale-like structures,
probably indicating that their protoliths have formed in shallow levels in a
submarine environment. Sometimes, it is observed that the metabasaltic
assemblages are embedded in well-bedded silicified tuff layers.
Figure 2.19. Primary layering between coarse- (at the top) and fine-grained (at the bottom) mafic metavolcaniclastics within the Nilüfer Unit (İmrahor).
The metaclastics representing the Eymir Unit in the İmrahor area are found to be
very similar to those in the other study areas. The deformation in the area is
observed to have been very intense in some places so that crenulation cleavage
36
can also be identified in addition to the primary foliation planes (Figure 2.20).
These metaclastics are cross-cut by numerous metadiabase dikes. These dikes, in
most places, appear to have been intensely altered by surface weathering, and
they generally appear in reddish brown colors. Indeed, they can be easily
misinterpreted as metasandstones if a close-up examination is not performed.
Figure 2.20. Intensely deformed phyllitic metamorphics of the Eymir Unit. Note the development of crenulation cleavage (İmrahor).
Of these localities, some parts of Hasanoğlan that were previously examined by
Sayıt (2005) and Sayıt and Göncüoğlu (2009a) were restudied, and the studies
were extended towards the north in the extent of this study (Figure 2.21).
In the southeastern parts of Hasaoğlan, the relationship reflected by metabasalts
(generally pillowed) and limestones is very similar to what is observed in the
Ortaköy, Hacılar, Bayındır, Zerdalitepe and Gökçeyurt areas. The basalts are
37
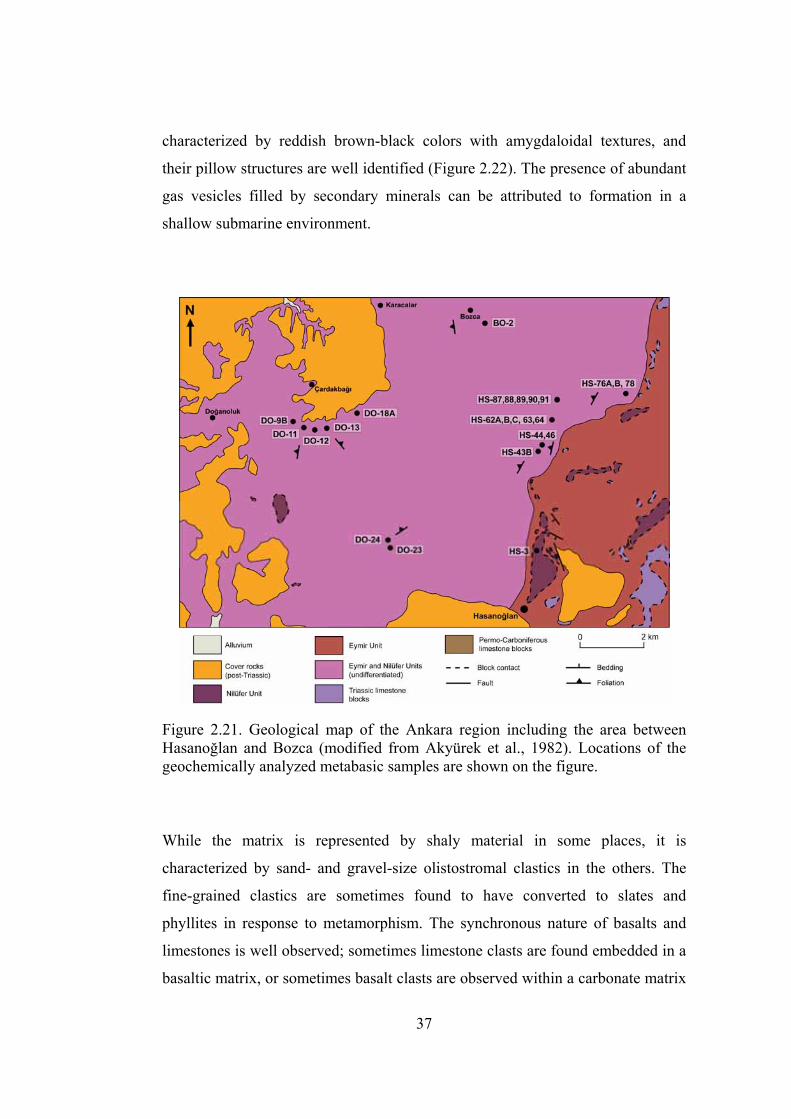
characterized by reddish brown-black colors with amygdaloidal textures, and
their pillow structures are well identified (Figure 2.22). The presence of abundant
gas vesicles filled by secondary minerals can be attributed to formation in a
shallow submarine environment.
Figure 2.21. Geological map of the Ankara region including the area between Hasanoğlan and Bozca (modified from Akyürek et al., 1982). Locations of the geochemically analyzed metabasic samples are shown on the figure.
While the matrix is represented by shaly material in some places, it is
characterized by sand- and gravel-size olistostromal clastics in the others. The
fine-grained clastics are sometimes found to have converted to slates and
phyllites in response to metamorphism. The synchronous nature of basalts and
limestones is well observed; sometimes limestone clasts are found embedded in a
basaltic matrix, or sometimes basalt clasts are observed within a carbonate matrix
38
(Figures 2.23 and 2.24). In some cases, the metabasaltic assemblages display an
olistostromal appearance with variable-sized limestone and greenish metabasalt
fragments (mostly amgydaloidal) set in aphanitic metabasaltic matrix. In some
parts, limestones appear to alternate with thin cherty layers, probably related to
silica saturation caused by synchronous basaltic volcanism (Figure 2.25). In this
area, there also occur, to a lesser extent, volcaniclastics and silicified tuffs that
represent products of the same basaltic system.
Figure 2.22. Pillow basalts in the Nilüfer Unit (Hasanoğlan).
In the northern and northwestern sectors of the area, the intensity of deformation
and shearing are observed to increase as indicated by the development schistosity
planes and folding in variety of rock types. These parts actually appear very
similar to what is observed in İmrahor. The presence of metabasaltic rocks is very
apparent with their bluish and greenish colors. These metabasic lithologies
display well-developed schistosity and varying degrees of crenulation cleavage.
39
Figure 2.23. The synchronous relationship observed between basalt and limestone within the Nilüfer Unit (Hasanoğlan).
Figure 2.24. The same phenomena observed as in Fig 2.23. However, in this case, basalt clasts are found within a carbonate matrix (Hasanoğlan). Note that the basalt fragments display vesicular and amygdaloidal textures.
40
Sometimes, the tufficious members are found to have distinct banding with
alternation of bluish and white layers. The bluish layers include Na-amphibole
together with mostly chlorite, while the white layers are composed largely of
calcite. Thus, this type of metamorphics probably represents an alternation of tuff
and carbonate. In these sectors of the study area, silicified metatuffs are
characterized by light greenish-white colors, and found to be entirely
recrystallized. This can be understood by well-developed idiomorphic quartz
crystals within these rocks. The influence of metamorphism on the thin muddy
portions interbedded with these silicified layers, however, is revealed by the
development of white mica (phengitic?) and chlorite. Sometimes, the tuffaceous
rocks are found to have experienced intense ductile deformation as indicated by
formation of crenulation cleavages.
Figure 2.25. Limestone with chert laminations within the Nilüfer Unit (Hasanoğlan).
41
In these parts of the study area, it is also possible to observe the metabasalts,
though they are not so widespread. These metabasalts are light-greenish in color,
and in the places where the effect of regional metamorphism has been more
dominant, foliation planes are observed to have developed on these rocks,
resulting in typical “greenschist” appearance. In some parts, however, cataclastic
deformation appears to be more dominant, and no foliation is found to have
developed on the basaltic rocks in these areas, instead there occur brecciated
textures and fractured/crushed phenocrysts.
Apart from these rock types, there also occur also high-MgO metagabbros and
metabasalts which have undergone low-grade metamorphism. They are
characterized in the field by light/dark greenish colors, and their big phenocrysts
in can be easily recognized by naked eye. The metabasalts, picritic in
composition according to petrographic investigation, are sometimes found to
have been experienced some degree of deformation as revealed by elongated
pseudomorphed olivine phenocrysts and foliated matrix, which together defines
the schistosity. The metagabbros, on the other hand, are rather found to have been
affected by brittle deformation. In these parts of the study area, there also occur
carbonate rocks, however they are observed entirely recrystallized, thus no fossil
evidence could have been obtained.
Towards the northwestern parts, namely Doğanoluk, Kavaklı and Bozca, the
metaclastic rocks dominate, and metabasaltic rocks representing the Nilüfer Unit
diminish. In these parts, metaclastics are largely represented by grayish and
greenish colors, and they appear to have been experienced multiple deformation.
The first two deformation phases are observed to be ductile, whereas the last
phase appears to have been brittle. In some parts, metavolcaniclastics can be
observed within the Eymir Unit as greenish, foliated rocks. Instead of the
metabasaltic assemblages of the Nilüfer Unit, in these sectors of the study, there
appear metadiabase bodies which mostly cross-cut the metaclastic lithologies of
the Eymir Unit (Figure 2.26).
42
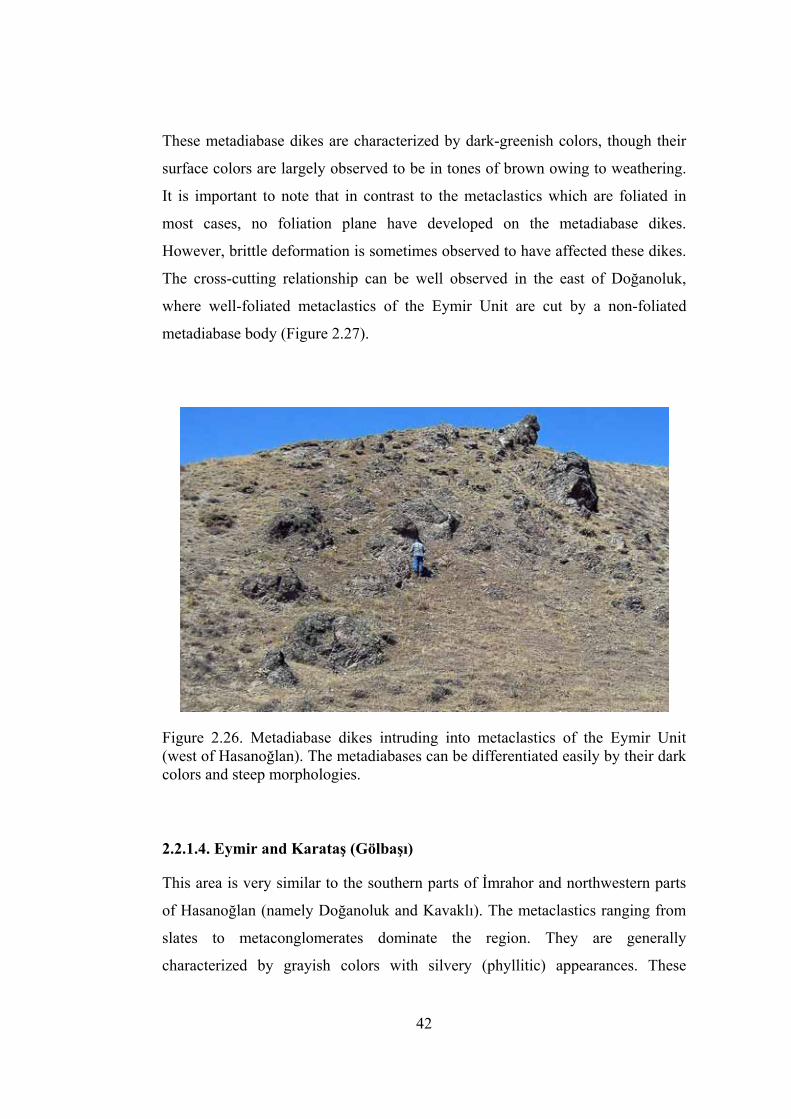
These metadiabase dikes are characterized by dark-greenish colors, though their
surface colors are largely observed to be in tones of brown owing to weathering.
It is important to note that in contrast to the metaclastics which are foliated in
most cases, no foliation plane have developed on the metadiabase dikes.
However, brittle deformation is sometimes observed to have affected these dikes.
The cross-cutting relationship can be well observed in the east of Doğanoluk,
where well-foliated metaclastics of the Eymir Unit are cut by a non-foliated
metadiabase body (Figure 2.27).
Figure 2.26. Metadiabase dikes intruding into metaclastics of the Eymir Unit (west of Hasanoğlan). The metadiabases can be differentiated easily by their dark colors and steep morphologies.
2.2.1.4. Eymir and Karataş (Gölbaşı)
This area is very similar to the southern parts of İmrahor and northwestern parts
of Hasanoğlan (namely Doğanoluk and Kavaklı). The metaclastics ranging from
slates to metaconglomerates dominate the region. They are generally
characterized by grayish colors with silvery (phyllitic) appearances. These
43
variably metamorphosed and deformed metaclastic successions are intruded by
metadiabase dikes. The cross-cutting relationship is well observed in several
locations (Figure 2.28). The Hacılar (Çubuk) area shares very similar
characteristics to these study areas, so it will not be repeated here. The geological
map of this region, however, is given in Figure 2.29.
Figure 2.27. The cross-cutting relationship observed between metadiabase (dark brownish) and metaclastics (light grayish) of the Eymir Unit. Note the well-developed foliation shown by metaclastics, whereas no foliation is observed on the metadiabase dike (Doğanoluk). The contact is roughly indicated by yellow dashed lines.
2.2.2. Central Sakarya Region
The low-grade metamorphic rocks that are observed as a tectonic slice between
the Söğüt Metamorphics and the Dağküplü Complex (Göncüoğlu et al., 1996)
represent the newly defined Nilüfer Unit in the Central Sakarya area (Figure
2.30). The geological characteristics of the Nilüfer Unit in this region appear very
similar to what is observed in Ankara and Bursa; the metabasaltic assemblages
are found as blocks within metaclastics of terrigenous origin that form the matrix
material.
44
Figure 2.28. The cross-cutting relationship between metadiabase (to the left) and phyllite (to the right) (Lake Eymir). Note that no foliation is observed on the metadiabase dike, while the phyllite is clearly foliated and displays folding in response to ductile deformation.
Figure 2.29. Geological map of the Hacılar (Çubuk) region (modified from Akyürek et al., 1979a). Location of the geochemically analyzed sample is shown on the figure.
45
Figure 2.30. Geological map of the Central Sakarya region (modified from Göncüoğlu et al., 1996). Locations of the geochemically analyzed samples are shown on the figure.
46
The metabasic rocks in the study area are represented by metabasalts,
metagabbros, and metatuffs. The metabasalts are observed primarily associated
with metavolcaniclastics, limestones and cherts. Compared to the other rock types
in the study area, the development of foliation on the metabasalts are found to be
more apparent. In some parts of the area, there also occur picritic varieties of
metabasalts. These highly magnesian metabasaltic rocks are observed as lenses
within the metabasalts or olistostromal parts. The metagabbros are characterized
by dark greenish colors, and distinguished by the presence of relatively large
hornblende and albite crystals. Sometimes, a weak foliation can be observed to
develop on these intrusive bodies.
2.2.3. İnegöl-Nilüfer (Bursa)
In the Bursa region (Figures 2.31 and 2.32), similar to what is observed in
Ankara, the rock lithologies are found to be variably deformed and sheared.
Owing to this change in the intensity of deformation, in some areas there occur
mafic schists with well-developed schistosity planes, while in the others massive
and pillowed lava flows with no observable foliation planes. However, even in
such areas where no foliation has been developed, several shear zones within
these basaltic successions were observed. The metabasalts are again primarily
related with the limestones, suggesting their synchronous nature (Figure 2.33).
The limestones in the area are observed in the gray and pinkish colors, and
generally thin bedded. They are sometimes found as small lenses within basalts.
In some parts of the area, there also occur some ultramafic bodies, however, they
are entirely serpentinized. Locally, there are mafic schists that bear Na-
amphibole, thus indicating the influence of high pressure metamorphism.
47
Figure 2.31. Geological map of the Bursa region including the area between İnegöl and Yenişehir (modified from Genç, 1987). Location of the geochemically analyzed sample is shown on the figure.
48
Figure 2.32. Geological map of the Bursa region including the area around the Nilüfer River and the Doğancı Dam (modified from the İstanbul sheet of 1/500000 scale MTA geological maps compiled by Türkecan and Yurtsever, 2002). The location of geochemically analyzed sample is shown on the figure.
Figure 2.33. The synchronous relationship between metabasaltic rocks and limestone within the Nilüfer Unit (Nilüfer Valley). Note that the whole succession is deformed.
49
CHAPTER 3
PETROGRAPHY
3.1. Introduction
This chapter concerns the petrographical features of samples collected from
various localities assumed to represent the Nilüfer-type metabasic rocks and the
Eymir metadiabases. For this purpose, more than 250 thin-sections were prepared
and examined under the microscope. All rock samples have been metamorphosed
to some degree as indicated by various secondary assemblages. All samples have
also been variably sheared and deformed. For the sake of simplicity, the
metabasalts and metagabbros of the Nilüfer Unit were treated separately from
mafic schists and metavolcaniclastics of the same unit and they were divided into
two groups on the basis of their dominant phenocryst phase as “augite-phyric”
and “olivine-phyric”. These sub-types may also show distinct textural
relationships in response to their degree of cooling rate and/or extent of
deformation.
Overall, augite-phyric samples consist of titaniferous augite; also include
kaersutitic amphibole in some cases. The Eymir metadiabase samples, on the
other hand, comprise diopsidic augite, thus contrast with the previous groups. The
compositional differences between sub-types are also reflected by their modal
mineralogy, especially olivine content (on the basis of pseudomorphs after
olivine).
50
3.2. Metabasalts
3.2.1. Augite-phyric Metabasalts
Most of these metabasalts are generally aphanitic, though some of them are
medium- to coarse-grained, reflecting microphaneritic texture (Figure 3.1a).
Some of the aphanitic varieties are characterized by distinctly thin, elongated
crystals; somewhat like spinifex texture (Figure 3.1b). Some of the phenocrysts
are large, visible to naked eye, and they are embedded in a fine-grained
groundmass (Figures 3.2 and 3.3a). In some cases, groundmass plagioclase tends
to be relatively larger (Figure 3.3b).
a ba b
Figure 3.1. a) Typical view of a coarse-grained (diabasic) augite-phyric metabasalt. Ti-augite is apparent with its distinctive pinkish colors. Light-colored parts are mostly represented by plagioclase laths. There is a pseudomorph after olivine (green colored part, oriented from center to the lower left), now represented by serpentine and chlorite. Epidote is distinguished by yellowish colors (Sample OR-116, PPL); b) Spinifex-like texture displayed by augite-phyric metabasalts. Pinkish-brown grains are Ti-augite. Note the considerably long, acicular plagioclase crystal just above the center. Yellowish grains are epidote. Pale green parts are mostly composed of chlorite and minor amont of serpentine (Sample OR-33, PPL) (Ti-aug: Ti-augite).
Most of these metabasalts are characterized by porphyritic texture; although there
are samples with aphyric appearance as well. Some of the augite-phyric
metabasalts are composed of variably-sized phenocrysts and microcrysts,
51
resulting in seriate textures. Some samples contain considerable amount of
degassing structures filled with various secondary minerals displaying
amygdaloidal texture (Figures 3.4a,b). However, in some cases the secondary
mineral-filled features are phenocrysts and/or crystal aggregates which have
undergone intense alteration and present definite crystallographic shapes with
subhedral appearance (Figure 3.4c). Rarely, some samples appear to have
experienced some degree of brittle and/or ductile deformation (Figure 3.5a).
a b
c d
a b
c d
Figure 3.2. a and b) Glomeroporphyritic aggregate of Ti-augite embedded in a fine-grained groundmass. Note multiple twinning displayed by three of the crystals (b) (Sample OR-28, XPL); c) Large Ti-augite grain associated with several plagioclase crystals; together they display a sub-ophitic relationship. Note the size difference between grains (Sample OR-29, XPL); d) Ti-augite grain characterized by combined sector and concentric zoning (Sample OR-29, XPL) (Ti-aug: Ti-augite, plag: plagioclase).
52
a ba b
Figure 3.3. a) Serpentine pseudomorphs after olivine. Note that the pseudomorph at the left hand side has been largely resorbed by groundmass. Minerals with higher interference colors in the groundmass are Ti-augite. (Sample GK-1, XPL); b) Augite-phyric metabasalt with relatively larger groundmass plagioclase. The interstices between plagioclase crystals are occupied by Ti-augite, which is distinguished by higher interference colors (Sample OR-41, XPL) (serp-ol: serpentinized olivine; Ti-aug: Ti-augite).
Primary minerals in these basalts are Ti-augite and to a lesser extent plagioclase.
No olivine has survived; it is present mostly as serpentine pseudomorphs and to a
lesser extent epidote, chlorite and calcite (Figure 3.3a). Ti-augite appears to be
very fresh compared to plagioclase and olivine, and is characterized by brownish,
pinkish-brown crystals with generally subhedral outlines and showing poorly-
developed cleavage traces (Figures 3.2a-d). In fact, they appear to be rather
fractured (Figures 3.1a and 3.2). In the parts where these metabasalts have
experienced brittle deformation, variably-sized fragmented Ti-augite crystals are
set in a very-fine grained dark matrix (Figure 3.5a). The parts that reflect ductile
deformation, on the other hand, are characterized by Ti-augite associated with
dynamically recrystallized albite. Ti-augite can be found both as phenocrysts and
microcrysts. Ti-augite crystals sometimes form glomeroporphyritic clusters with
other Ti-augite and/or plagioclase and/or serpentinized olivine (Figures 3.2a,b).
Sub-ophitic texture is displayed by large Ti-augite grains together with several
plagioclase laths (Figure 3.2c). Poikilitic Ti-augite crystals, though very rare, are
also found. In addition, Ti-augite microcrysts occupy the interstices between
53
a b
c
a b
cc
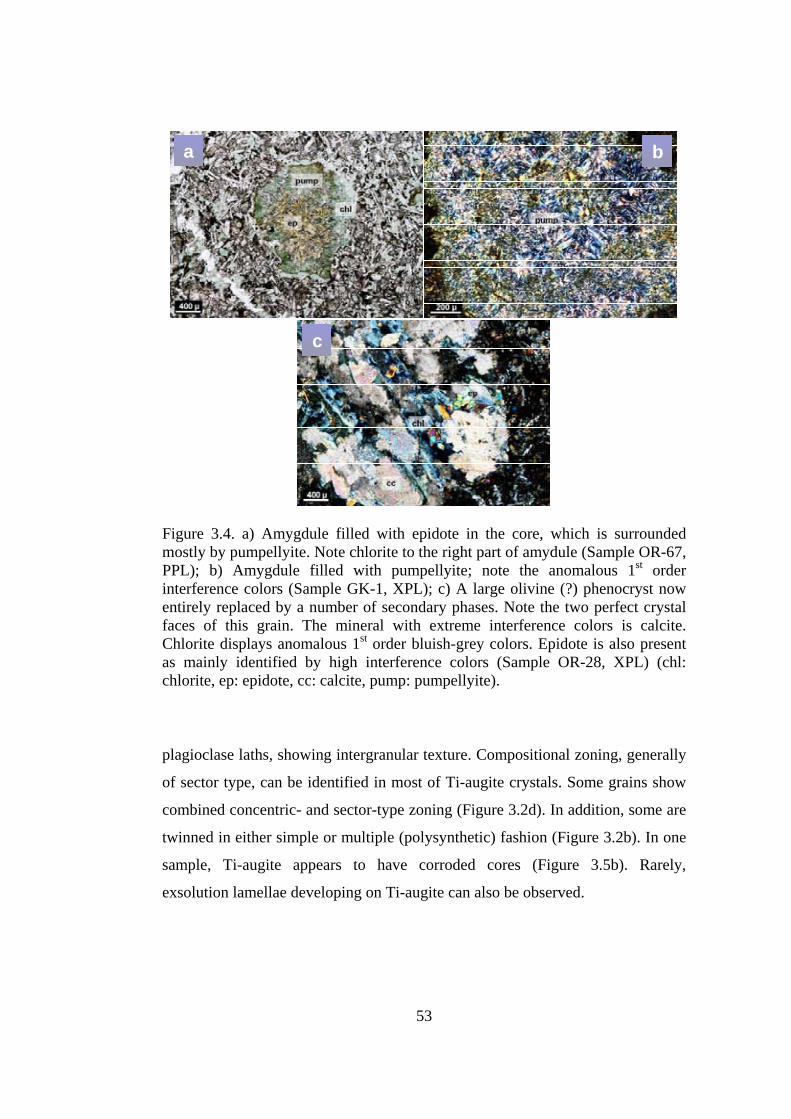
Figure 3.4. a) Amygdule filled with epidote in the core, which is surrounded mostly by pumpellyite. Note chlorite to the right part of amydule (Sample OR-67, PPL); b) Amygdule filled with pumpellyite; note the anomalous 1st order interference colors (Sample GK-1, XPL); c) A large olivine (?) phenocryst now entirely replaced by a number of secondary phases. Note the two perfect crystal faces of this grain. The mineral with extreme interference colors is calcite. Chlorite displays anomalous 1st order bluish-grey colors. Epidote is also present as mainly identified by high interference colors (Sample OR-28, XPL) (chl: chlorite, ep: epidote, cc: calcite, pump: pumpellyite).
plagioclase laths, showing intergranular texture. Compositional zoning, generally
of sector type, can be identified in most of Ti-augite crystals. Some grains show
combined concentric- and sector-type zoning (Figure 3.2d). In addition, some are
twinned in either simple or multiple (polysynthetic) fashion (Figure 3.2b). In one
sample, Ti-augite appears to have corroded cores (Figure 3.5b). Rarely,
exsolution lamellae developing on Ti-augite can also be observed.
54
c
a b
cc
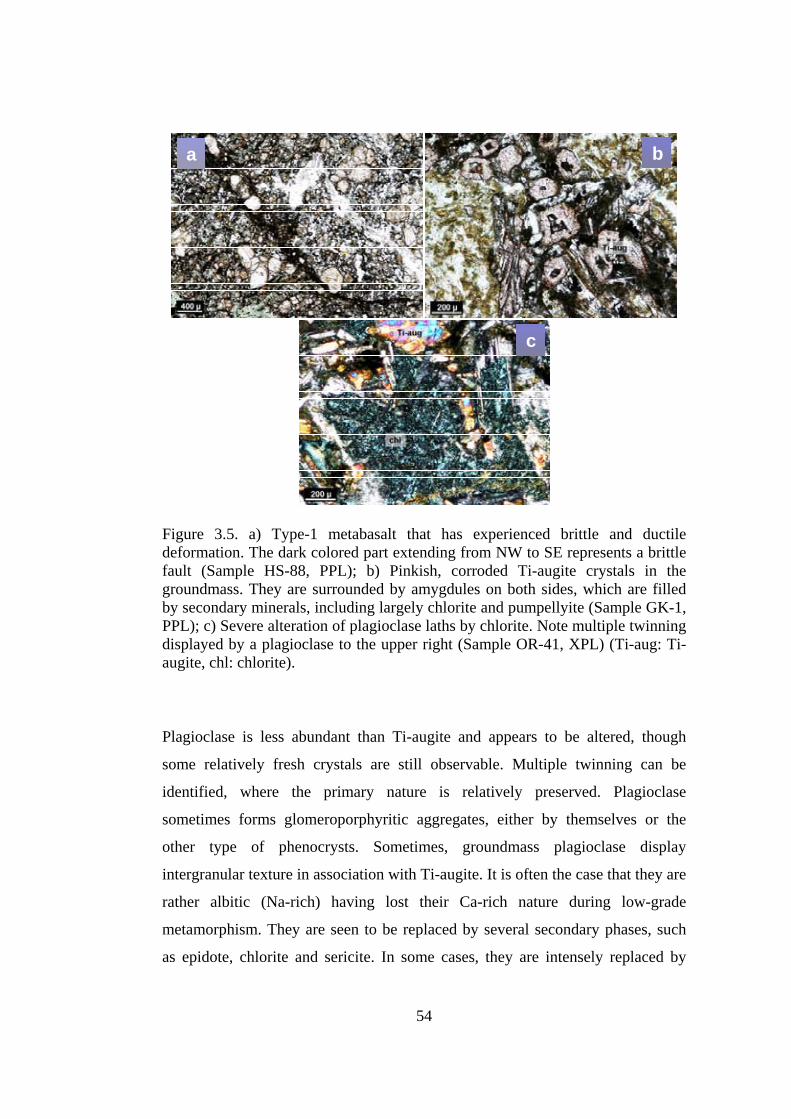
a ba bb
Figure 3.5. a) Type-1 metabasalt that has experienced brittle and ductile deformation. The dark colored part extending from NW to SE represents a brittle fault (Sample HS-88, PPL); b) Pinkish, corroded Ti-augite crystals in the groundmass. They are surrounded by amygdules on both sides, which are filled by secondary minerals, including largely chlorite and pumpellyite (Sample GK-1, PPL); c) Severe alteration of plagioclase laths by chlorite. Note multiple twinning displayed by a plagioclase to the upper right (Sample OR-41, XPL) (Ti-aug: Ti-augite, chl: chlorite).
Plagioclase is less abundant than Ti-augite and appears to be altered, though
some relatively fresh crystals are still observable. Multiple twinning can be
identified, where the primary nature is relatively preserved. Plagioclase
sometimes forms glomeroporphyritic aggregates, either by themselves or the
other type of phenocrysts. Sometimes, groundmass plagioclase display
intergranular texture in association with Ti-augite. It is often the case that they are
rather albitic (Na-rich) having lost their Ca-rich nature during low-grade
metamorphism. They are seen to be replaced by several secondary phases, such
as epidote, chlorite and sericite. In some cases, they are intensely replaced by
55
chlorite such that only the outer parts have survived (Figure 3.5c), and sometimes
total replacement of plagioclase by sericite can be observed. Calcite also replaces
plagioclase; however it is much less common than the others.
3.2.2. Olivine-phyric (High-Mg) Metabasalts
These metabasalts are mostly aphanitic and porphyritic, with large serpentinized
phenocrysts sometimes exceeding 1 cm. More rarely, microphaneritic samples
have also been found, and these coarse-grained basalts show equigranular texture.
The Mg-rich nature of these basalts is evident from abundant pseudomorphs after
olivine (Figure 3.6). They sometimes display elongated serpentinized olivine and
sheared Ti-augite phenocrysts owing to intense strain rate.
a ba b
Figure 3.6. a) Serpentine pseudomorph after olivine showing mesh-texture, surrounded by numerous Ti-augite and opaque phases (Sample HS-62B, XPL); b) Large pseudomorph after olivine embedded in a fine-grained matrix. Note the euhedral shape of pseudomorph. Calcite is identified by its extremely high interference colors and it is associated with minor serpentine (1st order bluish grey). Chlorite displays its typical 1st order anomalous brown color (Sample OR-43, PPL) (chl: chlorite, cc: calcite).
The primary mineral phases recognized in these high magnesian metabasalts are
Ti-augite and kaersutite. Ti-augite is found in brown, pinkish-brown generally
subhedral crystals with fractured appearance and barely visible cleavage (Figure
56
3.7). It is present as both phenocryst and microcryst phases. Ti-augite has been
totally destroyed by severe alteration in some cases. Sector zoning can
occasionally be observed. Rarely, kaersutite is found replacing large Ti-augite
phenocrysts (Fig. 3.7d).
a b
c d
a b
cc dd
Figure 3.7. a) Olivine-phyric metabasalt with relatively large groundmass Ti-augite. Note that lots of Ti-augite grains dominate the sample both as phenocryst and microcryst (Sample OR-48, PPL); b) Subhedral Ti-augite grain which has been affected by alteration (Sample ZT-3, PPL); c) Another example depicting effects of low-grade metamorphism on the olivine-phyric metabasalts. Note needle-like actinolite crystals emerging from Ti-augite (Sample ZT-3, PPL); d) Kaersutite developing on a Ti-augite phenocryst (Sample HS-62A, PPL) (Ti-aug: Ti-augite, act: actinolite, chl: chlorite, kae: kaersutite).
No original plagioclase appears to have survived following low-grade
metamorphism. Olivine appears to have been an important constituent of the oli-
phyric metabasalts as indicated by numerous pseudomorphs some of which have
57
euhedral outlines (Figure 3.6). Some olivine crystals are completely serpentinized
with well-developed mesh-texture; others appear to have been subsequently
altered by chlorite and actinolite as well as calcite (Figure 3.6).
Some of the oli-phyric metabasalts seem to have experienced some degree of
ductile deformation, as evidenced by a number of elongated pseudomorphs after
olivine, which are aligned in a sub-parallel manner. It is also possible to observe
microfaults transecting some of the Ti-augite phenocrysts.
3.3. Metagabbros
3.3.1. Augite-Phyric Metagabbros
The augite-phyric metagabbros are variably-sized, ranging from fine- to coarse-
grained, and they are characterized by porphyritic texture, where Ti-augite
crystals and pseudomorphs after olivine are set in a matrix mostly composed of
Ti-augite and plagioclase. The finer-grained varieties have somewhat larger
plagioclase crystals, but smaller Ti-augite. These metagabbros appear to have
variably influenced by ductile deformation. Sometimes, relict igneous textures
appear to be preserved and there is no signature of brittle or ductile deformation.
Primary mineral assemblage consists mainly of Ti-rich augite and to a lesser
extent plagioclase and kaersutite. Ti-augite appears to be most abundant primary
phase. In some of the samples, no relict plagioclase has survived. Ti-augite is
seen as brown to pinkish-brown crystals with generally subhedral outlines. Poor-
to well-developed cleavage is recognizable in some cases (Figures 3.8a). Both
simple and multiple twinning can be seen (Figures 3.8a,b). In addition, sector-
and concentric-type zoning are frequently observed on Ti-augite (Figure 3.8c). It
is possible to see the effects of shearing on Ti-augite in some samples, where they
display undulatory extinction, sub-grain development and boudin-like structures
(Figures 3.9a,b). Sub-parallel fracture development related to ductile deformation
is also recognized (Figure 3.9a). Furthermore, small-scale faulting appears to
58
have affected some of Ti-augite crystals, as indicated by the displacement of their
twin-lamellae (Figures 3.8a,b). Ti-augite is sometimes associated with
plagioclase in a sub-ophitic manner (Figure 3.10a).
a b
c
a b
c
a b
c
Figure 3.8. a) Ti-augite crystal displaced by a small-scale fault. The grain is characterized by moderately-developed cleavages and simple twinning. Note also that the fault does not affect the other Ti-augite grain (Sample HS-90, XPL); b) Another example depicting the affect of shearing on the augite-phyric metagabbros. Note also multiple twinning on the Ti-augite crystal (Sample HS-90, XPL); c) Concentric zoning displayed by a euhedral Ti-augite. Note the anomalous interference colors of the crystal (Sample HS-90, XPL) (Ti-aug: Ti-augite).
Plagioclase is rarely identified as a primary phase in these metagabbros. Unlike
Ti-augite, it appears to have suffered pervasive alteration. Thus, it is not unusual
to see albitic plagioclase in these metagabbros. They generally appear to have
undergone dynamic recrystallization due to deformation, becoming recrystallized
59
albite. Simple and multiple twinning are sometimes observable. Although vary
rare, pericline twinning is also recognized. However, in the samples that have
experienced relatively less deformation, plagioclase seems rather preserved. In
some cases, plagioclase is replaced by prehnite and sericite.
a b
c d
a b
c d
Figure 3.9. a) Augite-phyric metagabbro including abundant Ti-augite crystals as a primary phase. Note the effect of shearing and sub-parallel fractures developed on Ti-augite at the center. No plagioclase has survived in this sample (Sample OR-98, PPL); b) Ti-augite crystal which has experienced some degree of strain, which leads to undolatory extinction and sub-grain development. Note also the presence of moderately developed cleavages (Sample OR-98, XPL); c) Acicular kaersutite crystals growing after Ti-augite (Sample IM-23, PPL); d) Development of late-stage primary kaersutite after Ti-augite, which is in turn replaced by metamorphic Na-amphibole in response to elevated pressures (Sample IM-24, PPL) (Ti-aug: Ti-augite, kae: kaersutite; Na-amp: Na-amphibole).
Kaersutite is the other primary mineral characterizing these metagabbros, though
it is absent in some of them. They are largely observed replacing Ti-augite and
60
rarely as individual crystals (Figure 3.9d). Development of kaersutite is mostly
identified at the rims of Ti-augite.
3.3.2. Oli-phyric (High-Mg) Metagabbros
These coarse-grained metagabbros are characterized by porphyritic texture; large
Ti-rich augite crystals are observed to be embedded in intensely metamorphosed
matrix. Ductile deformation appears to have been predominant on these
metagabbros leading to schistosity on groundmass. All olivine have been totally
replaced by serpentine minerals, thus represented by pseudomorphs.
Primary mineral assemblage characterizing these metagabbros, very similar to the
previous types, mainly consists of Ti-rich augite and kaersutitic amphibole.
Plagioclase appears to have lost its original identity and now it is present as of
albitic composition. Ti-rich augite is found in brown crystals with mostly
subhedral appearance. Poor- to well-developed cleavage can generally be
observed (Figure 3.11a,b). Owing to deformation, Ti-augite grains are observed
to have been re-aligned and become sub-parallel relative to foliation. Microfaults
can also be recognizable as reflected by the displaced clinopyroxene phenocrysts
(Figure 3.11a).
Kaersutite is the other primary mineral characterizing these metagabbros. It is
largely observed as individual crystals in the matrix, otherwise seen replacing Ti-
augite (Figures 3.11b-c). Some of kaersutite grains display nearly euhedral crystal
faces with two-directional basal cleavages intersecting at an angle of 124°-56°
(Figure 3.12d).
3.3.3. Eymir Metadiabases
The Eymir metadiabases are considerably different relative to the rest, since they
do not include a Ti-rich clinopyroxene phase as well as having a more evolved
composition with the occurrence of hornblende. These metagabbros can generally
61
be regarded as fine-grained gabbros with a few medium-grained members. They
display equigranular texture.
a b
c d
a b
c d
Figure 3.11. a) Large Ti-rich clinopyroxene displaced by a microfault. Note the alignment of the clinopyroxene grain compared to foliated groundmass (Sample HS-89, PPL); b) Kaersutite development on a fractured Ti-augite phenocryst (Sample HS-87, PPL); c) Numerous prismatic kaersutite grains developed on the groundmass of a olivine-phyric metagabbro (Sample HS-87, PPL); d) Kaersutite crystal with well-developed basal cleavages. The grain is partly corroded by groundmass which have replaced by actinolite (Sample HS-89, PPL) (Ti-aug: Ti-augite, kae: kaersutite, act: actinolite).
Hornblende and plagioclase together with/without a Ti-poor clinopyroxene phase
make up the major primary assemblage of the SSZ-type metagabbros.
Interestingly, these microgabbros sometimes consist of minor amount of quartz,
which has probably crystallized at the last stages of their magmatic evolution. As
mentioned above, these metagabbros do not comprise any Ti-rich augite as
62
clinopyroxene phase, instead they include diopsidic augite. It must be noted,
however, that some samples do not include any clinopyroxene at all. Thus, the
presence of clinopyroxene is not so common in the SSZ-type gabbros, being
restricted to more primitive samples. Where it is present, diopsidic augite is
represented by rather colorless to pale brown crystals. Since they have been
replaced by primary hornblende, no crystal face appears to have survived against
this magmatic replacement (Figures 3.12a,b), thus clinopyroxene is characterized
by anhedral crystals. Cleavage traces are hardly recognizable; only a poorly-
developed cleavage can be identified if present.
Hornblende, together with plagioclase, is the most common primary phase
observed in these microgabbros. Hornblende is found as greenish to more rarely
brownish crystals with generally subhedral outlines. It is also not unusual to see
euhedral crystals of hornblende. Two-directional cleavages are often recognizable
(Figure 3.12a). They are mostly found as individual crystals, otherwise associated
with diopsidic augite. It is sometimes the case that their strong body colors mask
the interference colors so that they somewhat look like chlorite.
Plagioclase constitutes the other important primary phase of the SSZ-type
metagabbros. It is generally unaltered when compared with those found in the
other types. Thus, it is generally possible to recognize multiple-twinned crystals,
though simple- and combined-twinned crystals are also found. They rarely
display a symplectic relationship with quartz, producing graphic-like structures.
3.4. Secondary Mineral Assemblages of the Metabasalts and Metagabbros
Based on secondary mineral assemblage, it can be inferred that the metabasalts
and metagabbros have been largely metamorphosed under greenschist facies
conditions, comprising typical greenschist paragenesis with actinolite+chlorite+
epidote+albite. Few of them, though, reflect sub-greenschist conditions.
63
a ba b
Figure 3.12. a) Replacement of diopsidic augite by hornblende. Note two-directional cleavage displayed by hornblende. Quartz seems very fresh compared to part just above it, where the cloudy appearance is due to alteration of plagioclase (Sample BO-2, PPL); b) Another example illustrating the replacement of diopsidic augite by hornblende. In this case, however, metamorphic amphibole (actinolite) overgrows hornblende. The mineral characterized by high relief just below the center is sphene (Sample DO-13, PPL) (cpx: diopsidic augite, hb: hornblende, ep: epidote, qz: quartz, act: actinolite).
Actinolite is seen variably replacing Ti-augite grains; overgrowing as needle-like
crystals (Figures 3.7b,c, 3.12b, 3.13a). In some cases, actinolite is observed to
have developed in the matrix probably after plagioclase together with Ti-augite
Actinolite is sometimes associated with chlorite and these two secondary
minerals together form pseudomorphs after large olivine crystals (Figure 3.13b).
Actinolite also variably replaces hornblende. There are also some phenocrysts
that have been entirely replaced by actinolitic amphibole, which may have been
originally Ti-augite crystals.
Chlorite is generally seen next to serpentine and/or actinolite, and can be
observed, replacing Ti-augite to varying degrees. It is possible to observe chlorite
pseudomorphs after entire replacement of Ti-augite grains. Chlorite is also seen
as a secondary mineral replacing hornblende. Epidote generally contributes to
alteration of plagioclase grains, benefiting from their Ca content. It is largely
found as yellowish anhedral, and more rarely brownish crystals. In some cases, it
is observed as fan-shaped crystals, displaying radial extinction. It is quite
64
common to see epidote together with abundant sericite when replacing
plagioclase.
a ba bb
Figure 3.13. a) Replacement of Ti-augite by needle-like actinolite crystals in response to low-grade metamorphism; b) Large olivine phenocryst totally replaced by actinolite and chlorite. Note the lower interference colors of actinolite needles replacing the olivine compared to those in the groundmass; c) A thick vein filled by epidote. Note undolatory extinction on epidote grains indicating influence of deformation (OR-51, XPL). (Ti-aug: Ti-augite, act: actinolite, chl: chlorite).
Green biotite, though very rare, can also be observed. This green mica is strongly
pleochroic, ranging in tones of brownish green. It appears to have grown locally
rather than pervasively. Some of these metabasalts appear to have been severely
altered as indicated by abundant veins of varying thicknesses and vesicles filled
by several minerals. Calcite is the most abundant vein/vesicle-filling mineral in
these basalts, however, quartz veins are also observed in association with calcite,
pumpellyite and epidote. Pumpellyite is also of considerable importance in terms
of vesicle-filling minerals in some of the samples (Figures 3.4a,b). It can also be
noticed in some parts associated with minor prehnite, probably using Ca that left
the structure of calcic plagioclase during albitization. In some places, pumpellyite
can be seen as green, fibrous, radiating crystals. Prehnite is sometimes present as
fibrous crystals like the former; otherwise it shows leaf-shaped appearance.
Calcite is not as common as in the previous type, and largely observed as vein-
65
filling mineral. This mineral together with epidote constitutes additional
secondary minerals found in the amygdules. Calcite is also seen to have replaced
olivine.
Na-amphibole is rarely found, indicating elevated pressure conditions. Therefore
some samples appear to be relatively transitional to HP-greenschist facies field. It
is seen that Na-amphibole development usually takes place as result of
replacement of kaersutite (Figure 3.9d). It is mostly the case that the three
minerals, namely Ti-augite, kaersutite and Na-amphibole display a close
relationship with each other.
3.5. Mafic Schists
3.5.1. Type-1 Mafic Schists
This type of metamorphics represents mafic schists, which have been probably
derived from a basaltic protolith as indicated by substantial content of kaersutite
relicts. In some samples, however, no relict kaersutite is observed; they appear to
have been entirely replaced by secondary sphene and Fe-Ti oxides. The
schistosity is defined by lepidoblastic white mica in addition to relatively
elongated recrystallized albite and chlorite.
Kaersutite is observed as brown prismatic and/or tabular crystals which have
most likely developed after Ti-augite (Figures 3.14a,b). Poor- to moderately-
developed cleavage can be observed. Actinolitic amphibole together with chlorite
appears to have developed on kaersutite. Apart from kaersutite and actinolite,
there is also a third type of amphibole present in the sample, namely Na-
amphibole. This bluish metamorphic mineral seems to replace kaersutite (Figure
3.14b). Therefore, the Type-1 mafic schists bear the evidence of elevated pressure
during its metamorphic evolution.
White mica occurs next to recrystallized albite. In some parts, the replacement
relationship can be observed such that white mica is present as patches inside
66
a b
c d
a b
c d
Figure 3.14. a) Relict kaersutite crystal replaced by secondary mineral phases. Note that actinolite also exists in this view, however, not labeled due to its similar body color with chlorite (Sample NIL-1, PPL); b) Development of sodic amphibole after kaersutite (Sample NIL-1, PPL); c) Development of stilpnomelane in the Type-1 mafic schists. Note euhedral apatite crystal to the upper right of view (Sample NIL-2, PPL); d) Albite porphyroblast undergone dynamic recrystallization, giving way to numerous smaller albite crystals. Note also the development of stilpnomelane (Sample NIL-2, XPL) (Na-amp: sodic amphibole, kae: kaersutite, chl: chlorite, sph; sphene ab: albite, stp: stilpnomelane, ap: apatite, wmica: white mica).
albite. Otherwise, they occur in distinct clusters representing pressure shadows in
association with albite. The pale yellowish color can be noticed, suggesting its
phengitic composition. Albite is an important constituent of this rock, occurring
as recrystallized crystals probably after porphyroblastic albite. Multiple
(polysynthetic) twinning is remarkable in some of the crystals. The effect of
dynamic recrystallization is evidenced by sub-grain development, undolatory
extinction, and sutured boundaries between recrystallized crystals. Albite
porphyroblasts are frequently observed in association with smaller recrystallized
67
counterparts (Figure 3.14d). Sometimes relatively large apatite crystals can be
observed in these schists, some of which display basal sections with typical
hexagonal outlines (Figure 3.14c). In some samples, stilpnomelane is also present
(Figure 3.14c,d).
3.5.2. Type-2 Mafic Schists
Compared to the Type-1, schistosity is more remarkable in Type-2 mafic schists.
Some parts of these metamorphics are characterized by continuous cleavage
(schistosity). The other portions, however, display disjunctive cleavage, where
cleavage domains are composed of nematoblastic actinolite together with
porphyroblastic albite, while the microlithons consist largely of
zoisite/clinozoisite crystals with lesser actinolite. No relict mineral is found in
these mafic schists.
These metamorphics are characterized by a mineral assemblage of actinolite,
zoisite/clinozosite, albite, chlorite, white mica and calcite. It appears that the
dominant mineral is actinolitic amphibole. They are observed as light green
acicular minerals, and form sub-horizontal arrangements defining the schistosity
(Figure 3.15a-c). In some cases, bluish-green actinolite crystals also occur
(Figure 3.15a). The epidote group minerals are frequently observed, following
actinolite. They are differentiated by their higher relief and brownish
appearances. Epidote is recognized anhedral most of the time, though subhedral
crystals also occur. Anamolous blue (berlin-blue) colors suggest that it is
represented by zoisite/clinozoisite rather than pistacite (Figure 3.15c).
Albite is generally observed as porphyroblasts in close relationship with epidote
and actinolite (Figure 3.15b-c). Twinning planes of albite are observable in some
of the porphyroblasts and they sometimes display undolatory extinction and
distinct crystal domains, probably in response to deformation which gives way to
dislocations through the crystal and/or recrystallization. The albite porphyroblasts
68
seems synkinematic due to deformation of internal foliation (Di) and external
foliation (De) at the same time (Figure 3.15b).
White mica is observed as colorless, flaky minerals with high interference colors
(Figure 3.15d). Their cleavage planes are visible and they are generally aligned
parallel, sub-parallel to each other forming lepidoblastic texture. Calcite is
observed in some portions of the samples. Sphene is also recognized frequently in
these mafic schists.
a b
c d
a b
c d
Figure 3.15. a) Development of bluish acicular actinolitic amphibole (Sample BU-7, PPL); b) Synkinematic albite porphyroblast as suggested by the simultaneous deformation of both Si and Se (Sample BU-8, XPL); c) Zoisite/Clinozoisite group epidote in association with actinolite and porphyroblastic albite. Note that albite displays imprints of recrystallization as indicated by distinct domains (Sample BU-8, XPL); d) Lepidoblastic white mica displaying high order interference colors (Sample BU-8, XPL) (act: actinolite, chl: chlorite, ep: epidote group, zoi/clizoi: zoisite/clinozoisite, ab: albite).
69
3.5.3. Type-3 Mafic Schists
In these metamorphics, foliation planes are well-developed, which are mainly
characterized by nematoblastic actinolite crystals. It must be noted that these
schists are variably deformed and crenulation cleavage is a typical feature for
these metamorphics.
Some of these schists contain relict Ti-augite with kaersutite. Ti-augite is
characterized by light brown crystals with poor- to well-developed cleavages.
However, fracture planes are also observed. Sometimes, bluish green actinolite
appears to develop fractures of Ti-augite (Figure 3.16a). It is also seen that Ti-
augite is rimmed by actinolite in some parts (Figure 3.16b). Kaersutite, the other
relict mineral in these metamorphics, is observed only where Ti-augite is present.
This Ti-rich amphibole appears to have overgrown after Ti-augite. Actinolite is
also seen to replace kaersutite.
a ba b
Figure 3.16. a) Large relict Ti-augite grain in the Type-3 mafic schists. Note that two fragments of Ti-augite were originally representing the same, single grain. Actinolitic amphibole develops on fractures and/or fragmented parts. (Sample HS-43A, PPL); b) Actinolitic rim overgrowing Ti-augite. Note the grain-size difference between rimming actinolite and those defining foliation (Sample HS-43A, PPL) (Ti-aug: Ti-augite, act: actinolite, kae: kaersutite, chl: chlorite, wmica: white mica).
70
Actinolite is the most abundant metamorphic mineral characterizing these mafic
schists. They sometimes appear bluish green (Figure 3.16), otherwise typical pale
green color is observed. Although it occurs mostly as tiny, needle like crystals,
relatively larger acicular and prismatic crystals also recognized. This
metamorphic amphibole reflects a close relationship with white mica; together
they define foliation planes. White mica seems to be rather phengitic owing to
their pale green colors.
3.5.4. Type-4 Mafic Schist
This type of mafic schists are distinct in terms of the development of lots of Na-
amphibole needles (Figure 3.17). The sub-parallel arrangement of the
metamorphic amphibole also defines schistosity. The protolith of these mafic
schists was probably basalt and they most likely represent basalt clasts within
metahyaloclastic breccias or the breccia itself.
Figure 3.17. Nematoblastic Na-amphibole (blue minerals) characterizing the Type-4 mafic schists. Minerals with very high relief are sphene (Sample IM-9B, PPL).
71
Type-4 mafic schists comprise no relict minerals. As mentioned above, these
metamorphics contain lots of tiny Na-amphibole needles which are arranged
mostly in a sub-parallel manner (Figure 3.17). They are strongly pleochroic in
tones of deep blue and purple (lavender blue). Another abundant mineral is albite
which is observed as small recrystallized minerals. Calcite is found in substantial
amounts; it has probably replaced former relicts and/or filled gas vesicles in the
original rock owing to severe carbonatization.
3.6. Metavolcaniclastics
The clastic nature of these samples is apparent as evidenced by many crystal and
rock fragments. However, they are also metamorphic like the others. It must be
noted that metamorphism seems to have no effect on the texture of these rocks,
while the mineralogy has been affected.
The mineral fragments are represented by brownish Ti-augite, which can be seen
as well-preserved fresh crystals. The rock fragments, on the other hand, comprise
various basalt fragments most of which are intensely oxidized. The clasts are
binded by a carbonate-dominated matrix. Relatively less oxidized fragments
reveals the presence of several metabasalts with different relict igneous textures.
Development of sodic amphibole on Ti-augite can be observed (Figure 3.18),
suggesting elevated pressure conditions.
3.7. Metamorphism of the Mafic Schists and Volcaniclastics
Metamorphic mineral assemblages observed in mafic schists and volcaniclastics
indicate that these rocks have experienced HP-greenschist facies conditions as
indicated by the occurrence of Na-amphibole, actinolite, albite, chlorite and
epidote.
72
a ba b
Figure 3.18. a) Development of needle-like Na-amphibole crystals on Ti-augite. The fragment on the lower left is oxidized basalt clast (Sample KD-16, PPL, 20X; Na-amp, Ti-aug: Ti-augite); b) Another picture depicting the replacement of Ti-augite by Na-amphibole (Sample GK-6, PPL, 20X; Na-amp, Ti-aug: Ti-augite).
73
CHAPTER 4
GEOCHEMISTRY
4.1. Major and Trace Element Geochemistry
In order to examine major and trace element characteristics of the newly defined
Nilüfer Unit and the Eymir metadiabases, 89 representative samples were
selected for analysis after detailed petrographic examination (see Appendix C).
The samples represent metabasalts (including metapicrites), metagabbros
(including metadiabases), mafic schists and metavolcaniclastics. All major oxide
values measured in the ACME labs were recalculated on a volatile-free basis for
the graphical purposes and elemental comparisons.
4.1.1. Method
The studied rock samples were initially cut into slabs, removing altered parts and
veins. Slabs were reduced to chips by a jaw crusher, and selected fresh chips were
powdered using a tungsten carbide disc mill.
Of the 89 analyses, 35 analyses were performed at Duke University (North
Carolina, USA), while the remaining 54 analyses were carried out at ACME
Analytical Labs. (Vancouver, Canada). In the Duke labs, major element and high
abundance trace element concentrations were determined by direct current
plasma spectroscopy (DCP) based on techniques modified after Klein et al.
(1991). The analyses of solutions were performed using a Fisons SpecterSpan 7
DCP equipped with a multi-element cassette. Si, Al, Ca, Fe, Mg, Na and Ti were
analyzed in a 1:4750 dilution, whereas 1:250 dilution were applied for Zn, Co,
74
Cu, Ni, V, Sc, Cr, Zr, Y and P. Abundances of Ba, Sr, Mn and K were analyzed
in both solutions. The standards used in the procedure were NBS-688, AII92-29-
1 and K1919. Analysis for each sample was run twice. Low-abundance trace
element concentrations were determined by inductively-coupled plasma mass
spectroscopy (ICP-MS) using a VG-Elemental PlasmaQuad3 applying modified
techniques of Cheatham et al. (1993). The standards used were BHVO-1, BIR-1,
DNC, and W2-1. Each sample was analyzed twice within a run.
In the ACME labs, the major elements as well as Ba and Sc were determined by
inductively coupled plasma atomic-emission spectrometry (ICP-AES) with
LiBO2 fusion. Trace elements (including REE) were determined by ICP-MS after
acid decomposition with 5% HNO3.
4.1.2. Effect of Post-Magmatic Processes
The studied samples bear imprints of low-grade alteration/metamorphism as
indicated by loss on ignition (LOI) values between 1.3 and 13.7 weight (wt.) %.
The metadiabase dikes from the Eymir Unit display somewhat lower LOI values
(1.3-3.4 wt %). The negative correlation observed between SiO2 and LOI
suggests that some SiO2 has been mobilized during post-magmatic processes
(Figure 4.1). Large-ion lithophile elements (LILE) are assumed to be mobile
during post-magmatic alteration processes (e.g. Wood et al., 1976; Pearce, 1975),
whereas rare earth elements (REE) and high-field strength elements (HFSE) are
relatively immobile during such secondary events (e.g. Pearce and Cann, 1973;
Pearce and Norry, 1979). The plots of mobile incompatible elements (e.g. Rb, Ba
and Sr) against an immobile incompatible element (like Zr) yield scattered results
(not shown), reflecting mobilization of these elements, whereas HFSE and REE
reflect well-defined trends against Zr, indicating they have remained relatively
immobile. Parallel/sub-parallel patterns observed in REE and HFSE indicate that
the original immobile trace element systematics have not been significantly
modified. Therefore, petrogenetic interpretation will be mainly based on
75
immobile elements which are not significantly modified by secondary processes
(e.g. Floyd and Winchester, 1978).
4.1.3. Major and Compatible Element Variations
Some samples have compositions characterized by Mg numbers (Mg#) between
65-84 (Mg# calculated as 100 x atomic Mg2+/(Mg2+ + Fe2+); assuming that
al., 1978; Hart and Davis, 1978), whereas the others are of lower Mg# (30-65),
characterizing more evolved magmas.
Figure 4.1. Variation of SiO2 against LOI, displaying loss of SiO2 in the studied samples
Samples with high Mg# are also coupled with high Ni (avg = 642 ppm) and Cr
(avg = 1266 ppm) concentrations. In contrast, more evolved compositions
represented by lower Mg# have lower Ni (avg = 96 ppm) and Cr (avg = 238 ppm)
values. MgO (wt %) contents of the studied samples range in a significantly wide
interval between 3.9 and 32.1, spanning both evolved and primitive compositions.
76
This is also indicated by extensively varying Mg numbers. Similarly, SiO2 also
appear to change in a highly varying interval (42.8-56.0 wt %). Fe2O3 contents
are observed to vary between 8.4 and 18.3 wt. %. CaO compositions of the
samples are highly variable, changing between 2.0 and 19.7 wt %. This
remarkable range in CaO can be attributed to the post-magmatic processes to
some extent, which result in mobilization of this element. Na2O contents, like the
other ones, show a substantial variability between 0.02 and 6.47 wt %. Although
this may have partially resulted from mobilization of Na2O, this element is
known to be more stable than CaO during post-magmatic events (e.g. Pearce,
1975), thus the effect of some magmatic processes (e.g. fractional crystallization)
cannot be excluded (see the discussion part). TiO2 contents also display a large
range between 0.6 and 4.6 wt %. The stable behavior of this element as also
reflected by Figure 4.2, however, reflects the work of magmatic processes rather
than post-magmatic events. Another immobile element, P2O5, spans a
compositional spectrum between 0.06-0.64 wt %.
4.1.4. Incompatible Trace Element Variations
When the samples are plotted on the multi-element variation diagrams, it appears
that they can be divided mainly into three distinct groups. The first of these
(Group 1) shows variable enrichment in most incompatible elements relative to
normal MORB (N-MORB), resulting in “humped” patterns (Fig 4.2)
characteristic of OIB-type magmas from intra-plate settings (e.g. Weaver, 1987;
Sun and McDonough, 1989; Furman et al., 2004). The second type of samples
(Group 2) is relatively depleted compared to Group 1, but still enriched relative to
N-MORB, thus they are more comparable to E-MORB rather than typical OIB
(e.g. Sun and McDonough, 1989) (Fig. 4.2).
77
Figure 4.2. Multi-element and REE variation patterns of the studied samples. Normalization values for N-MORB and C1-Chondrite from Pearce et al. (1983) and Sun and McDonough (1989), respectively.
The last group (Group 3) is characterized by variable enrichment in Th associated
with negative Ta-Nb anomalies, followed by slightly depleted HFSE patterns
relative to N-MORB (Figure 4.2). Among these groups, Group 1 and Group 2
suites characterize the Nilüfer Unit, whereas Group 3 samples are representative
78
of the Eymir Unit. OIB-like Group 1 samples are quite enriched in LREE
19.4), while E-MORB-like Group 2 samples show moderate enrichment in LREE
([Ce/Sm]N = 1.06-2.11) together with a slight depletion in HREE ([Ce/Yb]N =
1.6-3.3) (Figure 4.2). The SSZ-like Group 3 samples show relatively
unfractionated REE patterns ([Ce/Yb]N = 0.96-1.33) which contrast with variably
fractionated nature of Groups 1 and 2.
A detailed examination reveals that the Group 1 suite can be further subdivided
into two subgroups on the basis of Zr-Nb systematics; one subgroup having
noticeably higher Nb at a given Zr. Thus, this relationship reveals two different
subgroups with different Zr/Nb ratios, probably reflecting some processes
inherited from source region and/or during partial melting events (Figure 4.4). In
the remainder of this work, I refer to the one with lower Zr/Nb as “subgroup-1”,
and the other as “subgroup-2” (see the discussion section and Figure 4.12 for the
details).
When plotted on a classification diagram based on immobile elements
(Winchester and Floyd, 1977), the studied samples range from variably tholeiitic
to alkaline (Figure 4.3); the latter being dominant over the former compositional
series. Group 2 and Group 3 samples are mainly characterized by sub-alkaline
(tholeiitic) composition, whereas Group 1 appears to have dominantly alkaline
signatures. It must be noted that although both Group 2 and 3 are of tholeiitic
composition, the latter have distinctly lower Nb/Y values relative to the former.
In addition, some Group 3 samples reflect more evolved compositions, plotting
on the andesitic-basalt field.
Group 1 suite shows the highest Nb concentrations (avg = 35.0) between the
studied groups, together with largely varying Zr abundances (37.4-287.7) (Figure
4.4), while Group 2 samples are observed to have lower Nb concentrations (avg =
7.2). Group 3 samples show the lowest Nb concentrations (avg = 1.7). However,
both Group 2 and Group 3 suites show somewhat similar and limited variation in
79
Zr (ZrSSZ = 49.7-78.3; ZrE-MORB = 38.0-85.3). Group 1 samples are characterized
by high TiO2 values (wt.%) varying in a large interval (0.63-4.59) (Fig. 4.4).
Group 2 and Group 3 suites display much lower and overlapping TiO2 contents
(Group 2 TiO2 = 1.05-1.56; Group 3 TiO2 = 0.68-1.67).
Figure 4.3. Chemical classification of the studied samples based on relatively immobile elements under conditions of low-grade alteration/metamorphism (after Winchester and Floyd, 1977).
In terms of Y/Nb ratios, Group 1 samples display the lowest values (0.4-2.1),
while this ratio tends to be a bit higher for Group 2 (1.5-4.4). Group 3 suite has
Y/Nb ratios (13.4-17.6) significantly higher than these two groups. It must be
noted that Group 1 suite and to a lesser extent Group 2 display a large range in
Ce/Sm ratio at a given MgO ([Ce/Sm]OIB = 4.2-13.4, [Ce/Sm]E-MORB = 4.2-8.4),
while this ratio tends to change in a limited interval in the case of Group 3
samples ([Ce/Sm]SSZ = 1.2-1.6).
80
Figure 4.4. Variations of Nb and TiO2 against Zr for the studied sample groups. Note the highly variable concentrations observed in Group 1 relative to the other suites.
4.2. Isotope Geochemistry
For the assessment of Sr, Nd, Pb and Hf radiogenic isotope characteristics of the
newly defined Nilüfer Unit and the Eymir metadiabases, 16 samples were
selected on the basis of trace element geochemistry. Among these, 9 samples are
representative of Group 1 (OIB-type), 4 samples characterize Group 2 (E-
MORB-type), and the remaining 3 samples represent Group 3 (SSZ-type group)
suite. Isotopic compositions of all the studied samples suites were calculated back
to 240 Ma that represents Middle Anisian time.
As indicated by numerous isotopic studies performed on oceanic basalts as well
as mantle xenoliths, it has long been recognized that the mantle is heterogeneous
both on small scales and very large scales (e.g. Dupre and Allegre, 1983; Hart,
1984; Zindler and Hart, 1986). The differences in isotopic characteristics of
oceanic basalts define several distinct arrays or trends which extend towards the
“end-member” mantle components. The isotopic space as inferred from oceanic
basalts can be defined by at least four end-member components (Zindler and
Hart, 1986); DMM (depleted MORB mantle), HIMU (high μ) and two enriched
mantle reservoirs (EMI and EMII). Of these, DMM is represented by MORB
81
derived from the depleted mantle or the MORB mantle itself and characterized by
unradiogenic 87Sr/86Sr and 143Nd/144Nd ratios. HIMU represents high time-
integrated U/Pb and reflects extremely radiogenic Pb isotopic compositions
coupled with unradiogenic 87Sr/86Sr and intermediate 143Nd/144Nd. The enriched
end-members EMI and EMII reflect isotopic evolutions indicative of high time-
integrated Rb/Sr but low Sm/Nd. EMI is characterized by low 206Pb/204Pb and
highly unradiogenic 143Nd/144Nd, whereas EMII shows very high 87Sr/86Sr ratios
along with relatively low 143Nd/144Nd and intermediate 206Pb/204Pb. A fifth end-
member may be regarded as FOZO (Focus Zone; Hart et al., 1992) that may
represent a common mantle component. Aside from the DMM component which
is commonly believed to have derived from depleted upper mantle, the origin of
isotopic signatures of the other components has been largely attributed to
recycled oceanic crust with/without terrigenous/pelagic sediments, ancient
metasomatised oceanic lithosphere and recycled subcontinental lithosphere (e.g.
Weaver et al., 1986; Salters and Hart, 1991; Chauvel et al., 1992; Hart et al.,
1992; Workman et al., 2004).
4.2.1. Method
Bulk rock isotopic analyses were carried out at San Diego State University
(USA). Nd-Pb-Hf isotopic data were measured using multi-collector inductively
coupled plasma mass spectrometry (MC-ICP-MS) on a Nu Plasma system
following the methods of Schilling et al. (1994), Hanan and Schilling (1989) and
Blichert-Toft et al. (1997), while Sr isotopic data were collected using a VG
Sector 54 thermal ionization mass spectrometer (TIMS) using the methods of
Schilling et al. (1994). Pb values were corrected using the Tl-doping technique
(White et al., 2000; Thirlwall, 2000; Albarede et al., 2004). Fractionation was
checked by using standard-sample-standard bracketing using a solution of NBS
981 (30 ppb) and NBS 997 Tl (3 ppb). Data were corrected using a delta
correction and values of Todt et al. (1996).
82
4.2.2. Sr-Nd-Pb-Hf Isotope Variations
All the studied groups display an extensive range in 87Sr/86Sr ratios, probably
related to post-magmatic processes, such as hydrothermal alteration/
metamorphism (Figure 4.5). Since seawater is characterized by a particularly high 87Sr/86Sr ratio (0.70916; e.g. Faure, 2001) compared to oceanic mantle, basalts
that have experienced hydrothermal alteration may display elevated Sr isotopic
compositions. Some of the OIB-type samples and especially SSZ-type samples
are also markedly higher than age-corrected Bulk Silicate Earth (BSE). The OIB-
type samples reflect the widest 87Sr/86Sr range among the sample groups, varying
from 0.703832 to 0.705852. The E-MORB-type suite, however, appears to have
more consistent 87Sr/86Sr ratios between 0.703954 and 0.704930. The SSZ-type
samples reflect particularly high values compared with the OIB- and E-MORB-
type suite, ranging from 0.705639 to 0.707177.
Owing to the highly variable values that may be indicative of significant seawater
alteration and metamorphism, Sr isotope ratios will not be considered further for
the evaluation of isotopic characterization and source features of the investigated
samples. However, although post-magmatic processes appear to have largely
influenced the Sr isotopic compositions of the studied samples, there is also a
possibility that the radiogenic Sr isotope signatures, to some extent, may have
been inherited from an EM-II component, since it is known to have highly
radiogenic 87Sr/86Sr ratios coupled with relatively unradiogenic 143Nd/144Nd (e.g.
Hart et al., 1988).
In contrast to the wide range of 87Sr/86Sr ratios, 143Nd/144Nd values seem much
more coherent, indicating the stable behaviour of Nd during post-magmatic
processes (Figure 4.5). The relative immobility of Nd during post-magmatic
processes makes it a reliable indicator to trace ancient mantle source
characteristics (e.g. Staudigel et al., 1995; Pearce et al., 1999). All the studied
samples are characterized by Nd isotopic compositions higher than that of BSE.
83
Figure 4.5. Age-corrected 87Sr/86Sr vs 143Nd/144Nd variation diagram of the studied samples. Blue lines indicates the composition of BSE. BSE was corrected, assuming 143Sm/144Nd = 0.1967; 87Rb/86Sr = 0.031 and a present day isotopic composition of 0.7047 for Sr, and 0.512638 for Nd (Jacobsen and Wasserburg, 1984).
The OIB-type samples display the largest variation among the studied groups,
with time-corrected Nd isotopic compositions between 0.512378 and 0.512570
(Figure 4.5). When examined in detail, it appears that the OIB-type samples
actually comprise two groups on the basis of Nd isotope compositions. The first
of these groups (“less radiogenic OIB-type”) is characterized by lower Nd
isotopic ratios between 0.512378 and 0.512398. The other group (“more
radiogenic OIB-type”) has higher 143Nd/144Nd ratios that range from 0.512523 to
0.512570. Therefore, although the OIB-type suite spans a large in terms of Nd
isotopic ratios in overall, the subgroups are observed to change within a limited
interval. The E-MORB-type suite has limited Nd compositions compared with
the OIB-type, ranging between 0.512563 and 0.512658. The SSZ-type samples
show the smallest variation in 143Nd/144Nd ratios with values between 0.512568-
0.512608.
84
The OIB-type suite has the most heterogeneous Pb isotopic compositions
Hf isotope systematics shows behavior similar to that of Nd, so the combination
of these two systems is powerful for tracking mantle sources and processes (e.g.
Patchett and Tatsumoto, 1980; Patchett, 1983; Salters and White, 1998). A
particular advantage of the Lu-Hf and Sm-Nd isotope systems is the relatively
immobile behavior of parent and daughter elements during post-magmatic
processes (e.g. low-grade metamorphism) therefore making Hf-Nd isotope
system a reliable indicator in most cases (e.g. Pearce et al., 2007).
The OIB-type samples have initial 176Hf/177Hf ratios reflecting a marked
heterogeneity, between 0.282698 and 0.282836 (Figure 4.7). The E-MORB-type
suite shows 176Hf/177Hf ratios between 0.282820-0.282891. The SSZ-type suite
once again appears to be very homogeneous, with Hf compositions between
0.282943-0.282958. All the studied samples are plotted above the BSE,
indicating their time-integrated depletion.
4.3. Discussion of the Results Inferred from Major and Trace Element Geochemistry
4.3.1. Fractional Crystallization
Compared with Group 1 and Group 2 suites that have relatively high Mg# (avg =
65), Group 3 samples are characterized by lower Mg# (avg = 48). This is also
confirmed by the very low Ni values of the latter, varying between 2.1 to 49.4
85
ppm. Such evolved compositions suggest extensive olivine + clinopyroxene ±
spinel fractionation before ponding in high-level magma reservoirs. On the other
hand, the presence of numerous pseudomorphs after olivine phenocrysts suggests
that significantly high Mg numbers observed in some samples may have resulted
from olivine accumulation, and therefore they may not represent primary magma
compositions.
Figure 4.6. Variation of the studied samples in age-corrected Pb isotopic space. Data sources and correction procedure are the same as in Figure 4.4.
86
Figure 4.7. Age-corrected 143Nd/144Nd vs 176Hf/177Hf variation diagram of the studied samples. Blue lines indicates the composition of BSE. BSE was corrected, assuming 143Sm/144Nd = 0.1967; 176Lu/177Hf = 0.0332, and a present day isotopic composition of 0.512638 for Nd, and 0.282772 for Hf (Jacobsen and Wasserburg, 1984; Blichert-Toft and Albarede, 1997).
Most of the major elements as well as some trace elements show well-defined
trends against MgO, suggesting that fractional crystallization and/or crystal
accumulation have played an important role during differentiation (Figures 4.8 to
4.11). The Group 2 suite, however, has MgO contents that vary over only a very
narrow interval (8.1-9.1 wt.%, excluding the sample BU-8), thus making very
difficult to infer about their fractionation histories. Thus, they were excluded
from the discussion regarding fractional crystallization.
When an incompatible element is plotted against a compatible element at log-
scale, the differences in compositions resulting from fractional crystallization or
accumulation can be identified (e.g. Rhodes, 1995; Norman and Garcia, 1999). A
log-log plots of MgO-Al2O3 and MgO-Na2O for the Group 1 samples show that
the compositions with approximately <15% MgO tend to follow a different trend
than their more magnesian (picritic) counterparts (Figure 4.8). MgO contents of
the more magnesian samples may be attributed to olivine accumulation, whereas
87
the lower MgO compositions may reflect control by fractionation process. The
inflection point between fractionation and olivine accumulation processes may
roughly imply a parental magma composition, namely ~15 % MgO, ~11 %
Al2O3, ~2% Na2O, and ~450 ppm Ni.
Figure 4.8. Variation of selected major elements (wt.%) against MgO (wt.%) within Group 1 suite.
The decrease in Ni concentration with decreasing MgO indicates that olivine
fractionation was important in creating the observed trends for Group 1 and
Group 3 suites (Figures 4.9 and 4.11). Note that some Group 1 samples tend to
have higher Ni abundances at a given MgO, which may suggest influence of
olivine accumulation on these samples. Similarly, for the Group 3 suite, Ni
88
Figure 4.9. Variation of selected trace elements (ppm) against MgO (wt.%) within Group 1 suite.
appears to stop its sharp decrease and get down to very low concentration
levels at about 4.5-5% MgO (wt.%), suggesting that olivine has been removed
89
and/or a new mineral phase(s) has been added to the fractionating assemblage at
that interval (Figure 4.9).
In both suites, Cr abundances decrease with decreasing MgO, supporting olivine
fractionation in addition to clinopyroxene and/or Cr-spinel (Figures 4.9 and 4.11).
Co also shows a linear correlation with decreasing MgO, consistent with the
overall crystallization of these mineral phases. Among Group 1 samples, Sc
contents decrease with decreasing MgO after falling down to about 8.5 wt.%, as
expected for removal of clinopyroxene, while in some cases high Sc contents
(over ~35 ppm) are likely indicative of clinopyroxene accumulation. For Group
3, Sc/Y ratios also decrease until MgO gets down to ~4.5 wt.%, hence consistent
with extensive clinopyroxene fractionation up to a certain level (Figure 4.11).
CaO variations against MgO appear scattered in the Group 1 suite, perhaps owing
to intensive alteration and metamorphism (not shown). This relationship,
however, seems more coherent in Group 3 samples, and the decline in CaO
contents with decreasing MgO (until it reaches ~4.5%) may suggest fractionation
of plagioclase in addition to clinopyroxene (Figure 4.10). Therefore, covariations
of CaO and Sc with MgO observed within Group 3 samples show that both
plagioclase and clinopyroxene have been significant fractionating phases for this
suite. In contrast, Al2O3 reflects an inverse relationship with MgO for Group 1
suite (Figure 4.8), suggesting that plagioclase fractionation was negligible for this
group.
TiO2 increases with decreasing MgO in Group 1 samples, consistent with
fractionation of olivine and clinopyroxene (Figure 4.8). The higher TiO2
concentrations of some samples at a given MgO, however, may reflect
accumulation of amphibole and/or Fe-Ti oxides, or alternatively can be partly
attributed to the partial melting. Increasing TiO2 contents may also imply that
fractionation of Fe-Ti oxide phases (e.g. ilmenite, magnetite and titanomagnetite)
were insignificant for Group 1 suite. Within Group 3 suite, TiO2 tends to increase
until ~4.5 wt.% MgO, but then it declines rapidly at lower MgO contents (Figure
90
Figure 4.10. Variation of selected major elements (wt.%) against MgO (wt.%) for Group 3 suite.
4.10). This noticeable decrease can be attributed to amphibole and/or Fe-oxide
phase fractionation. Similarly, V and Nb concentrations correlate inversely with
MgO >~4.5 for this group, below which there appears a well-defined decreasing
trend. Fractionation of Fe-Ti oxides, especially ilmenite, can be very effective in
91
decreasing both V and Nb (e.g. Bedard, 1994). Amphibole can also partition V
very effectively as ilmenite, but not Nb. Therefore, the marked decreases in TiO2
and V may have been controlled by fractionation of both Fe-oxides (possibly
ilmenite) and amphibole, whereas Nb has been greatly fractionated by ilmenite.
The sharp decreases in Nd, Gd, Sm (not shown) and to a lesser extent Sc,
however, should have probably resulted from amphibole rather than Fe-Ti oxides.
Therefore, the resulting picture is that both Fe-Ti oxides and amphibole have
played an important role during the late-stage fractionation of Group 3 suite.
For Group 3 samples, P2O5 starts to decrease below 4.5% MgO (wt.%), indicating
fractionation of apatite (Figure 4.10), whereas no sign regarding fractionation of
this phase has been found in Group 1 suite (Figure 4.5). High P2O5 concentrations
seen in Group 1 suite can be attributed to apatite accumulation and/or generation
under small degrees of partial melting. However, since the former idea is not
supported by petrographical observations, formation by small degrees of partial
melting seems a more plausible reason, which results in high P2O5 contents.
If the geochemical implications stated above are taken into account with
petrographical observations, it can be suggested that Group 1 samples with
greater than ~15% MgO (wt.%) represent olivine cumulates and not primary
compositions. Fractionation process appears to have been effective for MgO
concentrations lower than ~15% MgO (wt.%). In the Group 1 suite, ~15% MgO
and 450 ppm Ni may characterize primary magma compositions. Olivine +
clinopyroxene ± spinel are the major mineral phases dominating the fractionation
history of Group 1 samples. Some of the samples within the suite have been also
influenced by clinopyroxene accumulation, consistent with their clinopyroxene-
rich petrography. Within Group 3 suite, none of the samples appear to have
compositions representative of primary magmas. Early stages of fractionation are
controlled by olivine + plagioclase + clinopyroxene, however in later stages Fe-
Ti oxides together with hb dominates the fractionation trends. Crystallization of
hornblende as a late-stage crystallizing phase in the fractionation sequence of the
92
metadiabases is supported by clinopyroxene crystals rimmed/overgrown by
hornblende.
Fig. 4.11. Variation of trace elements (ppm) against MgO (wt.%) for the SSZ-type suite.
93
4.3.2. Nature of the Source Region
Group 1 and Group 2 samples are characterized by low Zr/Nb ratios (2.1-11.1
and 4.1-15.5, respectively), reflecting significant enrichment of Nb in these
samples. The low ratios observed in these suites may imply involvement of
enriched source(s) and/or relatively small degrees of partial melting during their
genesis. Zr/Nb ratios appear to be extremely high in Group 3 suite (32.2-48.2; ave
= 40.07); a result of their Nb-depleted compositions, suggesting derivation from
depleted source such as N-MORB (Zr/Nb = 31.8; Sun and McDonough, 1989).
This interpretation is further supported by the Y/Nb ratios (13.4-17.6) of Group 3,
which are significantly higher than those of Groups 1 and 2, therefore consistent
with origin from a depleted source. The observed variability and high
concentrations in Nb and TiO2 values reflected by Group 1 suite clearly imply
involvement of different type of sources and/or source heterogeneity coupled
with varying degrees of melting. In contrast, the limited variation of Nb and TiO2
in Group 2 and Group 3 samples suggests that they have been probably derived
from relatively homogeneous source regions.
Fractional crystallization cannot account for the large Zr/Nb variations observed
within Group 1 and Group 2 suites. High Ce/Y ratios may have resulted from
crustal contamination, however this would lead high Zr/Nb at the same time.
Such a relationship is not observed (Figure 4.12). Indeed, within Group 1 suite,
there appears no meaningful relationship between Zr/Nb and MgO, which can be
interpreted as the result of fractional crystallization, and more importantly the
same significant Zr/Nb range is observed throughout the entire MgO spectrum.
Therefore, the observed variations in Group 1 and Group 2 suites should have
largely originated from source-related processes (e.g. partial melting, source
heterogeneity). As Group 2 samples display very limited variation in MgO, their
widely varying Zr/Nb ratios have not resulted from fractional crystallization.
Similarly, the large Zr/Nb spectrum varying in a limited Ce/Y interval in Group 3
suite appears to be largely result of source-related processes (e.g. source
depletion). Since this group is mainly composed of relatively evolved samples,
94
the effect of fractional crystallization on Zr/Nb ratio cannot be entirely excluded.
The remarkably high values of Ce/Y observed in Group 1 suite compared to
Groups 2 and 3 may indicate generation under smaller degrees of partial melting
and/or derivation from relatively a more enriched source region (Figure 4.12).
Figure 4.12. a) Zr-Nb variations observed within Group 1 suite, revealing two distinct subgroups with different Zr/Nb signatures. b) MgO-Zr/Nb plot, indicating the distinct Zr/Nb signatures shown by the subgroups are largely related to source processes. c) Zr/Nb-Ce/Y plot, indicating that the Zr/Nb and Ce/Y variations have been originated from source-related features rather than fractional crystallization or crustal contamination. N-MORB, E-MORB and OIB values from Sun and McDonough (1989).
95
It must be noted that Group 1 suite and to a lesser extent Group 2 display a large
range in Ce/Sm ratio at a given MgO ([Ce/Sm]OIB = 4.2-13.4, [Ce/Sm]E-MORB =
4.2-8.4), while this ratio tends to change in a limited interval in the case of Group
3 samples ([Ce/Sm]SSZ = 1.2-1.6) (Figure 4.13). This wide range especially
shown by Group 1 suite cannot be explained solely by fractional crystallization.
Instead, differences in degree of partial melting and/or source-related features
should account for such large variations. Ce/Sm ratio is not sensitive to
fractionation of olivine and plagioclase as well as Fe-Ti oxides, whereas
clinopyroxene can be effective in fractionating this ratio relative to the other
phases (DSm/DLa = 4.19; Johnson 1998). However, even substantial crystallization
of clinopyroxene (i.e. 90%) cannot account for the variations observed in Group 1
suite; even within subgroups. It appears, therefore, that the variations in Ce/Sm
ratios should have been largely inherited from varying degrees of partial melting
and/or the mantle source heterogeneities.
Figure 4.13. Ce/Yb and Ce/Sm variations against MgO (wt.%), highlighting the influence of source-related processes on creating the wide range shown by Group 1 suite.
96
Supporting this argument is the Ce/Yb ratios that span an extensive range in
Group 1 suite (Figure 4.13). During fractional crystallization, the residual melt
would become gradually more enriched in terms of both Ce and Yb with the
increasing degree of crystallization owing to their tendency to go to the liquid
phase. Thus, such a process should create relatively unfractionated Ce/Yb
distributions with respect to the primary melt. Therefore, the significant increase
in Ce/Yb with increasing Ce observed in Group 1 samples is consistent with the
influence of different degrees of melting and/or source processes rather than
fractional crystallization.
High Ce/Yb ratios of the OIB-type group may indicate the presence of residual
garnet in their mantle source(s). The lower Ce/Yb ratios observed in E-MORB-
type samples, however, likely reflect generation under somewhat large degrees of
partial melting that eventually lead to total exhaustion of garnet in the mantle
source. Another alternative explanation is that melting occurs across the garnet-
spinel transition, thus obscuring the effect of garnet alone.
The presence of marked Nb anomalies coupled with depletion in HFSE relative to
N-MORB observed in Group 3 suite are typical features of SSZ-type basalts and
suggests that the mantle wedge may have suffered melt extraction before magma
generation (e.g. Woodhead et al., 1993; Pearce et al., 1995; Sinton et al., 2003). It
has been argued that LILE (like Rb, Sr, Ba, U) and LREE are transported into
mantle wedge from the slab by aqueous fluids, whereas Th is transferred by
silicate melts (e.g. Brenan et al., 1995; Elliott et al., 1997). Therefore, significant
enrichment in LILE (except Th) with respect to N-MORB observed within Group
3 suite can be attributed to the role of slab fluids in addition to low-grade
alteration/metamorphism, while the depletions in these elements have probably
resulted from the latter processes that have led to remobilization of these
elements.
As noted above, SSZ-type Group 3 samples display typical LILE enrichment with
negative Nb-Ta signatures, leading to high Th/Ta (3.0-5.3) and Th/Nb (0.3-0.4)
97
values. In contrast, Group 1 and Group 2 suites show no negative Nb-Ta
anomalies, hence resulting in low Th/Ta (0.6-2.3 and 0.8-1.3, respectively) and
Th/Nb (0.05-0.13 and 0.05-0.09, respectively) ratios. Negative Nb-Ta anomalies
can be seen in some continental within-plate settings if the partial melting takes
place in the subcontinental lithospheric mantle that has been previously modified
by subduction components and/or they have been contaminated by continental
crust on their way to the surface (e.g. Hawkesworth et al., 1992; Ellam and Cox,
1989; Peate et al., 1992). Oceanic within-plate magmas, however, seem to be
devoid of such Nb-Ta anomalies caused by subduction- and continental crust-
related processes (e.g. Chaffey et al., 1989; Floyd, 1989; Sun and McDonough,
1989).
Negative Nb-Ta anomalies are also commonly associated with subduction zones
where metasomatic modification of mantle wedge occurs, leading to enrichment
of large ion lithophile elements (LILE) and light rare earth elements (LREE) via
fluids and melts generated by dehydration of the subducting oceanic slab (e.g.
Gill, 1981; Hawkesworth et al., 1993; Woodhead et al., 1993). However, Nb and
Ta are retained in the slab and/or in depleted mantle; which is assumed to be
linked to the presence of a residual phase(s), such as rutile and amphibole (e.g.
Green, 1995; Ionov and Hofmann, 1995) and this leads to negative Nb-Ta
anomalies in the magmas forming in subduction zones.
Group 1 and Group 2 suites have high Zr/Y and Nb/Y ratios, suggesting that
garnet may have been a residual phase (in varying amounts) in the source of these
samples (especially for Group 1 suite that displays higher fractionation of
LREE/HREE). Group 3 samples, however, have markedly lower Nb/Y ratios
coupled with low Zr/Y. As seen from Figure 4.14, all Group 1 and Group 2
samples plot above (or on) the ΔNb line of Fitton et al. (1997), suggesting their
derivation from enriched source(s), whereas all Group 3 samples are plotted
below the line, indicating that they have been derived from depleted source (N-
MORB-type source). It is significant that both Group 1 and Group 2 suites appear
to derive from similar type of sources, suggesting that the OIB-type Group 1
98
samples have been generated in response to low degrees of partial melting, while
the E-MORB-type Group 2 samples reflect higher degrees of partial melting.
Note also that the subgroups of the OIB-type suite clearly plot in distinct areas
that reflect the decoupling of Zr-Nb systematics related to melt-mixing processes.
Figure 4.14. Zr/Y-Nb/Y plot of the studied samples, indicating generation of Group 1 and Group 2 suites from enriched sources. The low ratios observed in Group 3 suite, however, imply derivation from depleted sources. The dividing ΔNb line (indicated as thick black line) is from Fitton et al. (1997).
Nb/Yb-Th/Yb plot is also particularly useful in differentiating between mantle
and subduction components (Figure 4.15). Within-plate processes leads to
simultaneous enrichment of Nb (Ta) and Th, while subduction events have a
significant effect on Th but not on Nb (e.g. Pearce, 1983; Pearce and Peate,
1995). Thus, basalts derived from mid-oceanic ridges (MORB) and within-plate
settings (OIB-like) will define a linear array (MORB array) where Th/Yb
increases with increasing Nb/Yb, whereas basalts generated in subduction zones
show increasing Th/Yb trends at nearly constant Nb/Yb. It is observed that OIB-
and E-MORB-type samples (Groups 1 and 2) plot along the MORB array. Note
99
that OIB-type samples are displaced towards higher Th/Yb and Nb/Yb values
compared to E-MORB-type, indicating the influence of degree of partial melting
and source-related features. SSZ-type samples, on the other hand, are
characterized by low Nb/Yb ratios because of their Nb-depleted nature. It must be
noted that Nb/Yb ratio is a good indicator of partial melting and it is not
influenced by contributions from subducting slab during subduction magmatism
(e.g. Pearce and Parkinson, 1993; Fretzdorff et al., 2002). Low Nb/Yb ratios
similar to that of N-MORB shown by SSZ-type samples are indicative of
relatively high degrees of partial melting of a depleted source, whereas the high
Nb/Yb values of E-MORB and OIB-type samples are consistent with their
derivation by lower degrees of partial melting of enriched source(s) as indicated
by Zr/Y-Nb/Y plot (Figure 4.14).
Figure 4.15. Th/Yb vs Nb/Yb plot (based on Pearce, 1983; Pearce and Peate, 1995), showing the influence of within-plate enrichment on Group 1 and Group 2, whereas Group 3 suite appears to have experienced subduction-related processes that make them shift upwards relative to the MORB array. N-MORB, E-MORB and OIB values from Sun and McDonough (1989).
100
4.3.3. Crustal Contamination
Low Ce/Nb and Th/Nb ratios mainly characterize the magmas unaffected by
crustal contamination (e.g. Pearce, 1983; Hart et al., 1989). Group 1 and Group 2
samples have low Ce/Nb (0.9-2.3 and 1.6-2.6, respectively) and Th/Nb ratios
(0.05-0.13 and 0.05-0.09, respectively), providing no evidence for crustal
contamination (Figure 4.16). In contrast, the Group 3 suite displays notably
higher ratios, which may be indicative of crustal involvement (Ce/Nb = 5.7-6.7;
Th/Nb = 0.25-0.37).
Figure 4.16. The sample suites studied here show no evidence of crustal contamination. (a) Variation of Ce/Nb and Th/Nb against Ce/Y; (b) Ce/Ti against Zr/Nb, Data for the Eymir metaclastics are taken from the unpublished data of Dr. M.C. Göncüoğlu.
101
HFSE-depleted patterns (relative to N-MORB) with negative Nb anomalies and
high Zr/Nb values shown by the Group 3 suite are suggestive of intra-oceanic
trace element signatures, indicating the influence of subduction zone processes
rather than crustal events (e.g. Pearce et al. 1995; De Astis et al., 1997; Elliott et
al., 1997; Peate and Pearce, 1998; Gribble et al., 1998; Woodhead et al., 1998;
Stern et al., 2006).
Since continental crust is enriched in LREE and Th, but depleted in Nb and Y
(e.g. Taylor and McLennan, 1995), crustally contaminated magmas are
characterized by high and positively correlated La/Nb, Th/Nb and Ce/Y
signatures. As seen from Figure 4.16, the studied suites do not show such a
relationship, indicating that continental crust has not been involved during their
genesis. Instead, the low Ce/Y, high Ce/Nb and Th/Nb ratios of Group 3, suggest
that these signatures should have been acquired from subduction-zone processes
(subduction enrichment) rather than crustal contamination. The absence of any
crustal input is also supported by the fact that none of the investigated suites have
tendency towards the composition of the Eymir metaclastics which are the
potential contaminants in the studied region (Figure 4.16). These clastics, as
mentioned before, represent the matrix material for Group 1 and Group 2 suites,
whereas Group 3 samples intrude into these metaclastics. Therefore, this result
clearly suggests that the samples have not experienced any influence from
continental crust.
4.3.4. Petrogenesis of the Nilüfer and Eymir Metabasic Rock Suites
In this section, the role of partial melting in generating the diversity of studied
rocks will be evaluated through geochemical modeling. Such a numerical
approach may provide a better understanding of the mantle source region and the
related processes (e.g. partial melting), thus they are of particular importance to
put some constraints on the petrogenesis of a magmatic suite. Through
geochemical modeling, one can explore the profound influence of residual garnet
on melt compositions, if the considered rock types are of enriched trace element
102
compositions, such as OIB- and E-MORB-type. The depleted-type samples (e.g.
SSZ- or N-MORB-type), on the other hand, would not reflect an elemental
impact that has been inherited from residual garnet. Instead, such compositions,
bear the traces of a spinel-dominated mantle, and in some cases, they may reflect
previous melt extraction events. Therefore, in order to track the influence of the
residual mantle minerals better, I treated the OIB- and E-MORB-type samples
(Groups 1 and 2) separately from the SSZ-type suite (Group 3). Furthermore,
specific elements or elemental pairs were chosen to perform the partial melting
models, which may give the best picture about their mantle sources and melting
systematics. All chemical groups were modeled by non-modal batch melting,
using the equations of Shaw (1970). The distribution coefficients used in the
calculations are compiled from McKenzie and O’Nions (1991), Kelemen (1993),
and Bedard (1994).
4.3.4.1. OIB- and E-MORB-type (Groups 1 and 2) samples
Geochemical modeling of the OIB- and E-MORB-type samples was carried out
with the goal of evaluating the role of garnet in the source region. Garnet can
fractionate LREE/HREE and MREE/HREE ratios as long as it remains as a
residual phase in the mantle source because the HREE are highly compatible in
this mineral (e.g. McKenzie and O’Nions, 1991; Johnson, 1998). If garnet is
totally consumed during partial melting or the source does not bear any garnet
(like spinel-lherzolite), then the change in LREE/HREE and MREE/HREE ratios
will be very small. Thus, the element pairs used for the modeling are Zr/Nb-
Ce/Yb, Ce/Yb-Lu/Hf, and Ce/Sm-Sm/Yb (Figure 4.17). Note that only garnet-
lherzolite partial melting curves are plotted because the melting curve of a spinel
lherzolite varies over a very limited interval compared to that of garnet-lherzolite.
Thus, for the partial melts derived from spinel-facies mantle, a representative
melt composition obtained by 7.5% melting of spinel-lherzolite source was used
in the plots instead. My aim in performing this modeling is to reproduce the
observed trace element concentrations in the sample groups by aggregating the
103
Figure 4.17. Geochemical modeling of the OIB- and E-MORB-type Nilüfer metabasic rocks using non-modal batch melting. Both mantle sources were assumed to have primitive mantle (PM) composition given by McKenzie and O’Nions (1991), except for Zr and Nb which are from Hofmann (1988). Numbers on the garnet-lherzolite curve indicate the percentage of degree of partial melting. 7.5% spinel-facies melt is indicated by a light-orange colored diamond. Aqua-colored solid lines represent melt-mixing lines and the corresponding numbers indicate the percentage of melt fraction contributed by garnet-facies mantle (e.g. 0.2 corresponds to 20%). The dashed lines represent melting curves which joins the melt compositions of equal melt-mixing mode.
104
Figure 4.17 (continued).
partial melts generated at different depths. Therefore, in all three plots, I
constructed some mixing lines that were calculated on the basis of the end-
members represented by garnet-facies melts varying between 1% and 5% at the
one end, while 7.5% spinel-facies melt at the other. Both garnet-lherzolite and
spinel-lherzolite sources were assumed to be of PM compositions compiled from
McKenzie and O’Nions (1991) and Hofmann (1988). Regarding the garnet-
lherzolite melting curves, the source mode is taken from McKenzie and O’Nions
(1991), while the melt mode is from Haase et al. (1997). For the calculation of
spinel-lherzolite melt, both source and melt modes are taken from Haase et al.
(1997).
Neither pure spinel lherzolite nor pure garnet lherzolite is capable of creating the
partial melt compositions representative of most of the studied samples (Figure
4.17). The scattered distribution of the samples, however, can be explained by
melt-mixing involving variable contributions from both garnet- and spinel-facies
melts. The OIB-type group melts require the largest contribution from garnet-
lherzolite, with greater than 50% garnet-facies melt in most cases. In contrast, E-
105
MORB-type melts appear to be dominated by contributions from spinel-facies
melts, with involvement of garnet-facies melt smaller than 50%.
Another important result is that although the OIB-type subgroups require
approximately the same mixing proportions for their genesis, Subgroup 1 largely
represents smaller melt fractions. The subgroup 2 melts are characterized by
garnet-facies melts formed by 2-5% partial melting. The geochemical modeling
presented here also may shed light onto the different Zr-Nb behaviors shown by
OIB-type subgroups. It is apparent that increasing Ce/Yb at nearly constant Zr/Nb
can be explained by melt-mixing involving small degree melt fractions (1-3%) of
garnet-lherzolite (where the contribution of garnet-facies melt is between 40-
90%) with spinel-facies melts (Fig. 4.17). This result supports earlier inferences
that the distinct Zr/Nb behaviors observed in OIB-type group resulted from
source-related processes, rather than from fractional crystallization or crustal
contamination.
The ratio-based geochemical modeling presented above provides a good
approximation on the degree of partial melting and melt-mixing phenomena for
the E-MORB- and OIB-type metabasic samples. However, although the
elemental ratios are good indicators to monitor the degree of partial melting, REE
variations based on absolute abundances (i.e. REE variation patterns) may
provide better constraints on this process. Since absolute abundances of trace
elements (including REE) will be affected by fractionation/accumulation
processes after partial melting, using primary or near primary melts is the best
way to quantify the degree of melting and related mixing events.
Samples with MgO (wt.%) contents between 11% and 17% were selected to
represent primary or near primary melts. Although these primary melt candidates
may not reflect the entire primary REE variation spectrum observed in the
dataset, they are representative of the majority of samples. Not all the variation
patterns of the assumed primary melts are parallel (not shown); they clearly
appear to be variably fractionated, suggesting different degrees of melt generation
106
and amount of mixing between garnet and spinel stability fields. To model the
primary melts, non-modal batch melting equation of Shaw (1970) was used and
the same procedure as in the previous section was applied. The calculation was
performed on the 6 representative samples which best reflect the variability
among the REE patterns.
As seen from Fig 4.18, the calculated melts appear to match very well with the
observed melts (the compositions represented by samples), therefore they can
provide a valuable insight for the melting systematics of the OIB-type suite. The
results indicate that the OIB-type primary melts can be modeled by 1-4% melting
of a garnet-lherzolite source with PM composition, which mixes at a ratio
between 60-100% garnet-facies melt, and they are in good agreement with those
obtained from the trace element modeling. Sample NIL-12 has a remarkable
HREE depletion compared to the other primary samples, thus reflecting strong
contribution from garnet-facies mantle. Indeed, the modeled melt suggests a
100% contribution from the garnet-bearing source which has undergone 3%
partial melting.
To perform REE-based melt modeling of the Group 2 E-MORB-type melts, two
samples were chosen with MgO contents greater than 8.5 wt.%. The E-MORB-
type samples are not typical of primary melts like their OIB-type counterparts, as
reflected by their somewhat low MgO contents varying between 8.7 and 9.0.
Thus, in order to get more realistic results, the REE contents of the samples to be
used in the modeling need to be corrected for fractionation. For this purpose,
olivine with 88% Fo content (Fo88) was added to the samples until their MgO
reached 13.5 wt.%. This MgO composition was chosen to be consistent with the
values used for the OIB-type samples.
The low REE concentrations of the E-MORB-type samples compared to OIB-
type group requires either generation under relatively high degrees of melting,
especially for sample GK-3 (~14%), or melting of a source that has experienced a
previous melt extraction. The latter alternative is preferred as it requires lower
107
Figure 4.18. REE modeling (chondrite-normalized) of the selected primary OIB-type samples. “Fgrt” corresponds to the percentage of melt contributed by garnet-facies mantle as in Figure 4.17. Normalization values from Sun and McDonough (1989).
108
Figure 4.18 (cont’d).
109
degrees of melting that are more consistent with results obtained for OIB-type
melts, and more importantly yields a better match between the calculated melts
and the observed melts.
To model this physical scenario, I first removed 6.5% melt from garnet-lherzolite
with PM composition (Source 1). Then, the residue was remelted at a fraction of
8%, and subsequently mixed with the varying degrees melts deriving from
another garnet lherzolite source with again PM composition (Source 2). For
both calculated melts, the contribution of the melts from Source 1 (previously
melt-extracted source) was 80% (Figure 4.19). It must be noted a different modal
mineralogy was used for the Source 1 relative to the Source 2 that includes the
same modal assemblage used for the OIB-type melt modelling (see Figure 4.19
for the details). The calculated melts appears to fit quite well with the observed
abundances for both samples. As seen from Figure 4.19, a smaller melt fraction
(1.5%) is required from Source 2 to reproduce the sample OR-104, while GK-3
requires 3% garnet-facies melt from the second source, consistent with its less
fractionated nature (i.e. low La/Yb).
4.3.4.2. SSZ-type (Group 3) samples
Assessment of influence of partial melting on the SSZ-type Eymir diabases was
performed by two methods. The first method used is based on elemental ratios,
very similar to that applied to the E-MORB- and OIB-type samples. The second
method, on the other hand, uses absolute abundances of Nb and Yb that were
corrected for fractionation to 9% MgO (wt.%). The reason for applying this MgO
value is that the modeling curves were directly taken from Pearce and Parkinson
(1993). These authors, in their work, constructed the partial melting curves on the
basis of the values that had been corrected for 9% MgO to minimize the effects of
fractional crystallization, thus providing a better estimation on melting conditions
in SSZ-type systems.
110
Figure 4.19. Modelling of the E-MORB-type samples. “FC” means the samples were corrected for fractionation before performing melt modeling. The subscripts “1” and “2” refer to the different garnet-lherzolite sources, namely Source 1 and Source 2. Regarding Source 1, the source and melt modes were presumed to have not changed after melt-extraction, and the source mode was assumed to be 0.595 ol + 0.195 opx + 0.150 cpx + 0.06 grt, which melts in the proportions given by Johnson et al. (1990). The source and melt modes of the Source 2 was assumed to be the same as that of garnet-lherzolite source in Figure 4.17.
For the elemental ratio modeling, Lu/Hf and Nb/Yb pairs were selected owing to
their relatively immobile nature in hydrous conditions of the subduction zone
systems as well as in post-magmatic processes (e.g. alteration, metamorphism)
(e.g. Pearce and Peate, 1995). Furthermore, these elements do not partition into
sediment melt as Th does (e.g. Elliot et al., 1997; Pearce and Stern, 2006), thus
111
they can provide good constraints on the degree of partial melting of the mantle
source. The modeling was performed using non-modal batch melting equation of
Shaw (1970). The mantle source were assumed to be of DMM composition and
compiled from Hofmann (1988).
The ratio-ratio modeling indicates that the Eymir melts cannot be obtained by
melting of a fertile DMM source (Fig. 4.20). However, ~5-7.5% melting of a
fertile DMM source that has previously experienced a 2.5% degree of melt
extraction can reproduce the observed composition of the Group 3 samples. Thus,
this may further explain the reason of depletion in HFSE relative to N-MORB
within this suite.
Fig 4.20. Ratio-ratio modeling of the Eymir diabases. DMM composition was taken as 1/10 of the MORB composition proposed by Hofmann (1988). The source mode for fertile DMM and the melt mode are from Kostopoulos (1991). After 2.5% melt extraction, the source mode was assumed to be 0.5813 ol + 0.2585 opx + 0.1376 cpx + 0.0226 spi on the basis of melting residues given by Kostopoulos (1991). The same melt mode was applied to the depleted DMM.
112
The second method, in constrast, uses absolute abundances of Nb and Yb, instead
of using elemental ratios (Figure 4.21). To perform this modeling, first the
samples with MgO greater than 5% were selected to obtain relatively primitive
compositions as much as possible. Second, to further remove the effects of
fractional crystallization on the studied samples, all the samples were corrected
using least-squares best-fit lines to give a final MgO content of 9% (wt.%). It
must be noted that in order to increase the sample resolution, two Eymir-type
samples from the dataset of Sayit and Göncüoglu (2009) were also added and
used for the fractionation correction and the modeling.
Figure 4.21. Nb-Yb modeling of the SSZ-type samples. The subscript “9” denotes the fractionation corrected abundance of that element. Modelling curves are from Pearce and Parkinson (1993). The solid black lines indicate the melting curves produced by melting of FMM and 5% depleted FMM sources. The dashed blue lines represent melting lines which joins the melt fractions that has experienced an equal amount of melting. For further details about the melting scheme used in the modeling, see Pearce and Parkinson (1993).
The modeling curves were adopted from Pearce and Parkinson (1993), which is
based on non-modal melting of fertile and depleted FMM sources. This
113
modeling, however, differ markedly from the previous one in the sense that
Pearce and Parkinson (1993) used different melting systematics, different
distribution coefficients as well as different mantle source compositions.
Although these clear differences, the resulting picture is consistent with the
previous result that requires a previous melt extraction (smaller than 5%).
However, the melting range appears to be different between these two models
(~5.-7.5% vs. ~25-30%). Considering that the Eymir metadiabases reflect BABB-
like character (see Chapter 5 for the details) on the basis their transitional
character between N-MORB and IAT, the melting range recorded by the first
model seems more realistic, since 25-30% degree of melting is rather high for the
melting regimes observed in the oceanic back-arc systems. Gribble et al. (1998)
suggest a total range of 6-24% for their “Spread BABB” from the Northern
Mariana Trough. Stolper and Newman (1994) also report a similar range between
5-19% for the basaltic glasses from the same region. Similarly, Kelley et al.
(2006) suggest a range of 5-15% for the melting of BABB. Pearce and Stern
(2006) also propose a maximum of 25% melting for the generation of the BABB
magmas. Therefore, of the two geochemical models presented here, the first one
(ratio-modeling) with a total melting range of ~5-7.5% appears to be more
appropriate for the genesis of the Eymir metadiabase dikes.
4.4. Discussion of the Geochemical Data Inferred from Nd-Pb-Hf Systematics.
The relatively large isotopic range of the OIB-type group as inferred from Nd-Pb-
Hf isotope systematics may suggest derivation from a heterogeneous mantle
source region. The limited Nd compositions of the E-MORB-type suite compared
to the OIB-type imply a more homogeneous source region for their petrogenesis.
The highly restricted isotopic variations displayed by the SSZ-type samples
strongly implicate generation from a relatively homogeneous source. There
appears to be no clear distinction between subgroups of the OIB-type group in
terms of Pb isotope ratios. All the sample suites display Nd and Hf isotopic
compositions higher than that of BSE, suggesting time-averaged incompatible
114
element depletion. Three OIB-type samples, however, have 143Nd/144Nd and 176Hf/177Hf values close to that of the BSE, thus indicating derivation from a less
depleted mantle source relative to the others. Sample IM-28 of the E-MORB
group, however, appears to have the lowest 143Nd/144Nd and 176Hf/177Hf ratios
compared to the other E-MORB and OIB-type samples, suggesting its more
depleted character. This indicates DMM reservoir may have provided an
important contribution during the genesis of this sample. It must be noted that all
E-MORB-type samples except for IM-28 exhibit similar Nd isotopic
characteristics with that of the more radiogenic group of the OIB-type suite. This
may suggest that the mantle sources of these two suites were very similar.
It is observed that some of the E-MORB and OIB-type samples with similar 143Nd/144Nd have distinct Ce/Sm ratios, indicating recent fractionation of
incompatible elements during partial melting (Figure 4.22). Two of the OIB-type
samples (IM-24, OR-98), however, appear to trend towards slightly lower 143Nd/144Nd with high Ce/Sm values; suggesting that this slight negative trend
can be linked to time-integrated evolution of Sm/Nd in the mantle source. It is
noteworthy that sample IM-28, with relatively radiogenic 143Nd/144Nd, also shows
low Ce/Sm values that may indicate the involvement of a depleted component
with high time-integrated Sm/Nd (i.e. DMM), thus in agreement with the
previous interpretation. The less radiogenic OIB-type subgroup shows slightly
lower Ce/Sm values, but markedly lower Nd isotope ratios than samples IM-24
and OR-98, indicating that the differences between the subgroups of the OIB-type
suite has been inherited from their mantle sources with distinct isotopic
compositions.
The Nd isotopic composition of the SSZ-type suite is somewhat close to some
samples from the OIB- and E-MORB-type suites, and distinctly lower than
sample IM-28. They also have distinctly higher 176Hf/177Hf than the E-MORB
and OIB-type samples. These features may suggest involvement of a distinct
component(s) (other than DMM) to explain the source characteristics of the SSZ-
115
type suite. A potential candidate would be a sediment component (e.g. sediment-
derived melt) that has transported into the source region from the subducting slab.
Fig 4.22. Ce/Sm vs 143Nd/144Nd plot, illustrating the close relationship between most of the E-MORB-type samples and OIB-type samples. The variation in Ce/Sm ratio at a given 143Nd/144Nd value, however, implies recent fractionation of the incompatible elements in response to partial melting.
As seen from Figure 4.6, the OIB- and E-MORB-type samples are dispersed in a
way that they extend to higher Pb isotopic compositions. This trend may suggest
the presence of HIMU as a potential end-member in the source region of OIB-
and E-MORB-type suites. However, the particularly high Pb isotopic values of
the two OIB-type samples appear to have resulted from post-magmatic processes.
The Nb/U, Ce/Pb and Nb/Pb ratios of these samples were evaluated to gain
insight into this question. These two samples have Nb/U ratios (47.0-59.8) which
lie within scatter of oceanic basalts worldwide (47 ± 10; Hofmann et al., 1986)
and uniform Nb/Th values (11.5-12.2). In contrast, Ce/Pb and Nb/Pb ratios are
significantly higher (Ce/Pb = 50.4-52.1; Nb/Pb = 26.0-44.0) than average oceanic
basalt values (Ce/Pb = 25 ± 5; Nb/Pb ~ 15; Hofmann et al., 1986; Sun and
McDonough, 1989). This observation may indicate that the extremely radiogenic
Pb isotopic characteristics of these samples have resulted from Pb loss during
116
post-magmatic processes, which seems to have extensively affected the Pb
isotope systematics. Since the HIMU nature of these samples does not appear to
be real (i.e. not a source feature), the Pb isotope ratios for these samples will not
be considered any further.
4.4.1. Characterization of Mantle source(s) of the OIB- and E-MORB-type
Suites
As noted in the previous section, the OIB- and E-MORB-type magmatic suites
show striking similarity except for sample IM-28 from the former and the “less
radiogenic subgroup” of the latter group. Although both groups display
enrichment in the more incompatible trace elements relative to N-MORB, the
OIB-type suite is clearly more enriched than E-MORB-type suite, and
dominantly of alkaline character. The geochemical modeling results suggest that
both suites require some melt-mixing processes to reproduce their observed
compositions; however their mixing systematics appear to be quite different from
each other. While the OIB-type group calls for a mixing scheme where end-
members are represented by garnet-facies and spinel-facies melts, the E-MORB-
type suite shows necessity for a mixing process where both end-members are of
garnet-facies-derived. Furthermore, the latter group requires a previous melt
extraction to recreate its relatively depleted composition.
The isotopic subgroups of the OIB-type suite are observed not to be consistent
with the Zr/Nb systematics. Apart from one sample (OR-48), all the isotopically
analyzed samples belong to “OIB-type 1” subgroup. Therefore, there are some
samples that reflect the same Zr/Nb behaviour, but different isotopic
characteristics (the first case). And, there is a sample that display distinct Zr/Nb
behavior, but the same isotopic signatures with some samples (the second case).
Such a result apparently suggests that the distinct Zr/Nb ratios of the OIB-type
subgroups is not a source feature, but due to a recent process (i.e. melt mixing).
The first case can be explained if the there are source regions (we can consider a
mantle plume as the source due to the oceanic character of volcanism as reflected
117
by no crustal contamination and geological constraints) with distinct isotopic
domains (a heterogeneous plume) that have experienced similar melt-mixing
scheme. In the second case, however, similar isotopic domains will undergo
melting with distinct mixing schemes.
Now, I will characterize the source region of the OIB- and E-MORB-type suites
and discuss the potential mantle end-members involved in the genesis of these
suites, leading to the observed heterogeneities.
To evaluate the possible mantle source domains involved in genesis of the OIB-
and E-MORB-type samples, mixing curves were constructed using 143Nd/144Nd, 176Hf/177Hf, 206Pb/204Pb and 208Pb/204Pb ratios. FOZO was assumed as the
common end-member (Hart et al. 1992), and the HIMU end-member was 2 Ga
recycled oceanic crust based on the compositions given by Chauvel et al. (1992).
EM II was assumed to represent recycled ancient oceanic lithosphere as
suggested by Workman et al. (2004).
The calculated mixing arrays clearly indicate that the OIB- and E-MORB suites
require multi-component mixing involving the FOZO, EM II and HIMU end-
member in varying amounts (Figure 4.23). This observation suggests that the
mantle source regions of these magmatic suites were heterogeneous. The
contribution of FOZO is greatest in the case of the E-MORB-type samples,
generally >50% overall, whereas OIB-type samples requires rather strong
contributions from HIMU and EM II components. Based on the robust Nd-Hf
isotopic space, it is observed that E-MORB-type sample OR-104 may reflect
mixing only between FOZO and HIMU without needing a third component. In
order to explain the compositions of the other samples, however, a third
component (EM-II) is needed. To illustrate the effect of EM-II on for the origin
of the other samples, a fourth mixing array was drawn, which emerges from
FOZO towards the mixture between EM-II and HIMU. The composition of this
mixture was selected as to comprise 90% EM-II and 10% HIMU. As seen from
the Hf-Nd plot, those samples lie on or very close to the fourth mixing line,
118
Figure 4.23. Mixing modeling on the basis of Pb-Nd, Hf-Nd and Pb-Pb systematics, explaining the possible origin of mantle source components of the E-MORB- and OIB-type suites. All the end-members were calculated back to 240 Ma based on the following compositions and assumptions. The present day isotopic composition of DMM is from Su and Langmuir (2003), while its trace element composition taken from Workman and Hart (2005). The present day isotopic composition of FOZO were assumed based on values given by Gibson et al. (2005) and Stracke et al. (2005). For the trace element composition, the least-enriched Walvis Ridge basalt (flow unit 3 of DSDP 527) analyzed by Gibson et al. (2005) was used; similar to their approach, but here the composition of that sample was used for the source not for the melt. The HIMU source were assumed as a 2Ga recycled oceanic crust, and its present day isotopic composition along with trace element composition and parent/daughter ratios required for its evolution are from Chauvel et al. (1992). The present day isotopic compositions of EM-II compiled from Workman et al. (2004) and Salters and Hart (1991). Its trace element composition from Workman et al. (2004).
119
Figure 4.23 (continued).
contributed by 50% FOZO and 50% the mixture of HIMU-EM-II. Therefore, this
indicates the necessity of multi-component mixing and that EM-II component has
been also involved in the mantle source of the E-MORB-type suite.
In contrast to the E-MORB-type samples that can be explained by the
involvement of FOZO, HIMU and EM-II, sample IM-28 with relatively
radiogenic isotopic Nd probably requires a different mixing systematics. The
radiogenic nature of this sample as compared with the others may suggest DMM
as a potential source component. Indeed, as seen from Fig 4.23, it is obvious that
this sample cannot be obtained by simply mixing FOZO with DMM. The
relatively radiogenic 143Nd/144Nd nature coupled with somewhat radiogenic Pb
isotopic compositions lead this sample to appear in a place that is bounded by
DMM, FOZO and HIMU. The mixing calculations suggest that this sample
reflects a mixture only between DMM and HIMU, and there is no requirement for
FOZO to be involved in the mixing. It must be noted the contribution of DMM
for the origin of IM-28 is really strong, being about 97%.
The origin of the OIB-type samples can also be explained in a similar manner,
with multi-component mixing, though the contribution of the end-members is
120
quite different in some cases. Two samples from the OIB-type suite can be
explained in terms of mixing largely between FOZO with HIMU, and possibly a
small contribution from EM-II. In this case, the contribution of FOZO is rather
dominant being more than 50%. Another two samples from this suite also
requires mixing where again FOZO is involved, but EM-II being involved at this
time. The influence of FOZO for these samples seems a bit weak, being smaller
than ~35%. Another two samples from the suite are observed to require different
mixing systematics relative to the formers. These samples appear to reflect
mixing mainly between HIMU and EM-II, with probable small contribution from
FOZO.
Therefore, the mixing arrays constructed on the basis of age-corrected end-
member components indicate that both OIB- and E-MORB-type samples (Group
1 and Group 2) require multi-component mixing to explain their isotope
systematics of their mantle sources. It must be noted, however, that the mixing
models presented are strictly based on both trace element and isotopic
composition of the end-members, which, in turn based on the published values.
So, they are highly sensitive to the values applied.
4.4.2. Characterization of Mantle source(s) of the SSZ-type Suite
For the generation of subduction-zone magmas, there are mainly two components
that originate from the slab and contribute to the overlying mantle wedge: slab-
derived fluids, and sediments or sediment melts (e.g., Gill, 1981; Hawkesworth et
al., 1993; Plank and Langmuir, 1993; Elliott et al., 1997). The efficiency of these
components on modifying the mantle wedge is variable; however, one of these
components is generally seen to dominate over the other (e.g. Woodhead et al.,
2001). Therefore, at this stage, it is important to decide what type of slab-
component could have been more effective for the genesis of SSZ-type suite. To
figure out this, several elemental ratios including Ba/Yb, Nb/Yb, Ba/Nb and
Th/Nb were first used before proceeding with isotope ratios (Figure 4.24).
121
Fig 4.24. Ba/Yb-Nb/Yb and Ba/Nb-Th/Nb plots (based on Pearce et al. 2005), indicating the influence of subduction zone components on the SSZ-type Group 3 samples. It is also apparent from the diagram that DMM is a potential mantle end member for the origin of SSZ-type suite. Average N-MORB, E-MORB and OIB are from Sun and McDonough (1989).
The altered nature of the SSZ samples makes conventional assessments of trace
element distributions in slab-derived fluids difficult. The LIL elements (except
Th) are known to be fluid mobile, thus they can be transported to the mantle
wedge region by aqueous fluids released at low temperatures (e.g. Pearce and
Peate, 1995; Pearce and Stern, 2006). In contrast, subduction-mobile elements
(e.g. LILE, LREE, Th, U, Pb) characterizes the behavior of sediment melt (or
bulk sediment) generated at high temperatures (e.g. Elliot et al., 1997; Woodhead
et al., 2001; Pearce and Stern, 2006). As a result, Ba/Th values can be considered
a proxy for shallow subduction component related to low temperature aqueous
fluids, whereas Th/Nb characterizes a deep subduction component related to high
temperature sediment melts. Thus, Ba/Nb is an appropriate proxy for the total
subduction component. In contrast, Nb/Yb is a stable indicator of mantle fertility
and melting degree, since these elements cannot be modified by subduction
processes (e.g. Pearce, 1983; Pearce and Parkinson, 1993; Gribble et al., 1998).
The SSZ-type samples have higher Ba/Yb ratios than average N-MORB (Fig.
4.24), thus this may reflect variable influence of subduction component related to
mobility of Ba. However, since the samples have undergone low-grade
122
metamorphism, there is also a strong possibility that Ba has been remobilized.
Indeed, when the samples with greater than 50 ppm Ba (sample DO-11 excluded)
are plotted against LOI, there appears a positive trend, suggesting that the Ba
contents of these samples have been partly controlled by post-magmatic
processes, whereas there is no meaningful relationship obtained for the rest of
samples (not shown). It is likely that sample DO-11B has been similarly affected
given its very high Ba content (631 ppm). Although some samples appear to have
been influenced by post-magmatic processes, the rest still have high Ba/Yb ratios
(relative to N-MORB) indicative of a subduction component related to aqueous
fluids.
A plot of Ba/Nb against Th/Nb (Fig 4.24) indicates that SSZ samples are
displaced towards markedly higher Th/Nb and Ba/Nb than N-MORB. This
observation clearly indicates that a deep subduction component has been involved
during the genesis of these samples. This plot further supports the influence of
slab-derived fluids as characterized by shallow subduction component.
Another important question is whether or not the Palaeotethyan plume mantle (as
possibly represented by the OIB- and E-MORB-type Nilüfer samples based on
this study) has influenced the compositions of the SSZ-type samples. Such a
problem can be best revealed by trace element ratios, since isotope ratios can
mislead owing to variable involvement of sediments into the mantle region. In the
previously given Th/Yb-Nb/Yb plot (Figure 4.15), none of the SSZ-type samples
(Group 3) appear to be directed towards the OIB compositions represented by
Group 1 suite. Instead, they are displaced towards higher Th/Yb contents due to
the presence of a sediment component, and follow a sub-parallel path with
respect to MORB array in response to variations in degree melting. Another
evidence comes from the Th/Nb-Nb/Sm variation (Figure 4.25), where the Group
3 samples clearly trend towards the sediment compositions represented by global
subducting sediment (GLOSS; Plank and Langmuir, 1998) and the sediment melt
(Hochstaedter et al., 2001).
123
Figure 4.25. Nb/Sm vs Th/Nb plot, indicating that the SSZ-type samples have not been affected by enriched-type (plume) component displayed by OIB-type samples. Instead, they appear to have involved a strong sediment component as indicated by relatively high Th/Nb ratios. GLOSS from Plank and Langmuir (1998). Sediment melt from Hochstaedter et al. (2001). N-MORB from Sun and McDonough (1989).
For the isotopic characterization of possible source components involved in the
genesis of the Group 3 suite, three end-members were used to construct the
mixing arrays (Figure 4.26). The isotopic composition of the mantle wedge was
assumed to have DMM composition, while the sediment melt and sediment fluid
are assumed to have isotopic ratios 18.45 for 206Pb/204Pb, and 0.5122 for 143Nd/144Nd. This assumption was made, since the isotopic compositions of the
sediments are known to be highly variable within subduction zones (e.g. Plank
and Langmuir, 1998; Woodhead et al., 2001), thus the exact characterization of
this component is very difficult to constraint.
To perform the mixing modeling, first an isotopic mixing array between DMM
and sediment melt was constructed. Then, two specific compositions on this
124
DMM-sediment melt mixture were chosen, and subsequently were mixed with a
sediment fluid component with the same isotopic composition as the sediment
melt was used to create two additional mixing arrays. As seen from Figure 4.26,
the calculated arrays fit very well with the compositions of the samples.
Therefore, the observed compositions can be reproduced by mixing of a MORB-
source mantle (DMM) with the 0.3-0.5% sediment melt, which, in turn, mixes
with a ~0.1-1% sediment fluid. It must be noted that the effect of sediment (either
as melt or fluid) on the mixing arrays is quite strong; only an amount of sediment
melt/fluid smaller than 1% can considerably change the composition of DMM.
Figure 4.26. Isotopic mixing modeling of the SSZ-type samples on the basis of Pb-Nd systematics, highlighting strong influence of sediment components on the isotopic composition of the studied samples. Isotopic composition of DMM was taken from Su and Langmuir (2003), while trace element composition from Workman and Hart (2005). Isotopic compositions of sediment melt and sediment fluid were assumed as 0.5122 for 143Nd/144Nd, 18.45 for 206Pb/204Pb. Trace element composition of the sediment melt from Hochstaedter et al. (2001), whereas the sediment fluid from Class et al. (2000). Numbers on the curves indicate the contribution of the end-member on the mixture.
125
4.5. Overall Geochemical Evaluation
The geochemical examination of the studied metabasic suites reveals 3 distinct
tectonomagmatic groups on the basis of immobile trace element chemistry. Two
of these groups are of enriched trace element chemistry relative to N-MORB,
namely OIB- and E-MORB-types, the latter of which being more depleted with
respect to the former. The third group has a depleted chemistry as reflected by
negative Nb anomaly coupled with HFSE abundances slightly lower than N-
MORB. The OIB-type group is further divided into 2 groups according to
differences in the Zr/Nb ratio.
The geochemical modeling highlights that the trace element compositions OIB-
and E-MORB-type magmas have been controlled principally by melt-mixing
and Göncüoğlu, 2009a). Compared with the widespread presence of OIB-type
magmas, the mafic rocks characterized by BABB signatures, though not so
extensive, are found in the Küre and Ankara regions (Ustaömer and Robertson,
1994; Sayıt and Göncüoğlu, 2009a).
Even though the subduction-accretion models appear to be more suitable for the
genesis of Karakaya basaltic magmas compared to the rift model, they also reflect
contradictory interpretations within themselves. Tekeli (1981), the forerunner of
the subduction-accretion hypothesis, proposes that the magmatic rocks represent
the products of arc-related setting and stated that these rocks together with the
other rock lithologies have been incorporated into an accretionary prism, forming
a tectonic mélange. Okay et al. (1996) also suggests a similar idea, arguing that
the Lower Karakaya Complex (their Nilüfer Unit) was formed in an ensimatic
forearc-intraarc basin. Below, in the light of the results obtained by this thesis
presented above in detail, the geodynamic evolution of the Karakaya Complex
and the related Palaeotethyan events will be discussed on a tectonomagmatic
framework.
There is no doubt that the age of the Karakaya Complex in NW Anatolia is
clearly of pre-Liassic. The mélange units of the Karakaya Complex are
unconformably overlain by Early Jurassic clastics thus limiting the uppermost age
of the complex to latest Triassic (Koçyiğit, 1987; Altıner et al., 1991; Okay et al.,
1991; Koçyiğit et al., 1991). This age is apparently younger than the Early
Triassic age proposed initially by Bingöl et al. (1973). This is probably due to
that they did not regard the overlying sequence as the part of the Karakaya
145
Complex, although they were aware of the fact that the cover sequence was of the
Middle-Late Triassic.
The latest Triassic age also marks the age of the common deformation phase that
has resulted from the so-called “Cimmeride Orogeny”. The trace of this orogenic
event is evidenced by the presence of Nilüfer-type metabasic rocks bearing high
pressure overprints. The most widespread of those rocks is observed as HP-
greenschists (Okay et al., 1991; Sayıt and Göncüoğlu, 2009a) as also indicated by
this study. The Ar-Ar phengite ages of the eclogites and blueschist metabasites
from the Nilüfer Unit are found to be Latest Triassic (Okay and Monie, 1997;
Okay et al., 2002), thus consistent with the geological results. Furthermore, the
Late Triassic age as indicated by a number of studies (e.g. Leven and Okay,
1996; Okay and Altıner, 2004) also confirms that the regional deformation
observed in the Karakaya Complex (consequently, the Sakarya Composite
Terrane) is restricted to the latest Triassic interval.
The lowermost limits that define the age of an oceanic realm on which the
Karakaya related units have been associated; however, is a matter of debate. This
problem mainly results from the reason how the Karakaya-related entities have
been interpreted in the Palaeotethyan framework. The continental-rift model (e.g.
Bingöl et al., 1973, Şengör and Yılmaz, 1981, Koçyiğit, 1987, Altıner and
Koçyiğit, 1993, Genç and Yılmaz, 1995) interprets the lithologies of the
Karakaya Complex as the result of opening of an E-W trending basin on the
northern margin of the Tauride-Anatolide Platform via back-arc spreading. This
tectonic model was developed primarily to explain the presence of exotic
limestone blocks as well as volcano-sedimentary assemblages composed mainly
of mafic lavas interbedded with limestone and chert, greywackes and arkosic
sandstones (Bingöl et al., 1973). However, in this case, the product is a small
basin which does not reflect the main ocean, namely the Palaeotethys. Thus, this
thought has led those workers to think a separate Karakaya ocean or basin that
was isolated from the Palaeotethys. Consequently, the defenders of this idea
suggest a Late Permian-Late Triassic period for the lifetime of this basin.
146
However, the presence of pelagic sediments of Late Carboniferous age (Okay and
Mostler, 1994) requires the existence of a deep basin as old as Carboniferous.
This is also supported by the Late Permian metamorphism age of the Nilüfer Unit
reported by Topuz et al. (2004). Their work suggests that the subduction process
was still ongoing in Late Permian, therefore indicating existence of a deep basin
before that time.
The other line of thought, which relates the generation of the Karakaya Complex
to a subduction/accretion prism, appears to be more appropriate solution. In this
alternative, some of the Karakaya-related assemblages are regarded to be purely
oceanic, such as seamount or oceanic plateau, and they, at the final stage, are
incorporated to an accretionary prism during latest Triassic together with the
other assemblages that derive from continental sources. Therefore, in the
subduction/accretion model, initially put forward by Tekeli (1981), some of the
tectonostratigraphic units should, at least, have developed on, or characterize the
Palaeotethys itself. Such a model can explain the presence of pelagic lithologies
which are of Late Carboniferous age, and the Late Permian metamorphic ages.
Initially put forward by Tekeli (1981), the subduction/accretion model itself,
however, is a highly debated subject. The scenarios include seamount(s), oceanic
island(s), and/or an oceanic plateau (Capan and Floyd, 1985; Pickett and
Robertson, 1996, 2004; Okay, 2000; Genç, 2004; Sayıt and Göncüoğlu, 2009a) to
be accreted during the closure of Palaeotethys. However, Okay et al. (1996),
similar to Tekeli (1981), argued that the basaltic rocks were generated in an arc-
related setting, and they were formed in an ensimatic forearc-intraarc basin. The
paucity of SSZ-type mafic rocks relative to abundant E-MORB and OIB-type
magmas within the Nilüfer Unit, however, suggest that this tectonic setting is not
suitable for the genesis of these mafic lavas. The Eymir metadiabases and the
Küre metabasalts, which bear SSZ-type signatures, on the other hand, are
products of different magmatic event, and they will be discussed in later
paragraphs.
147
An oceanic plateau origin, which is initally proposed by Okay (2000) and
followed by Genç (2004) in his own terms, is not supported by the geochemical
data obtained by this study. Oceanic plateaus are largely made up of basaltic
rocks of tholeiitic character (e.g. Mahoney et al., 1993; Frey et al., 2000) as
opposed to the alkaline character dominating the Nilüfer Unit (Capan and Floyd,
1985; Pickett and Robertson, 1996, 2004; Sayıt and Göncüoğlu, 2009a). The
Kerguelen Plateau, for example, is composed of tholeiitic basalts covering more
than 85% of the unit (e.g. Condie, 2001). In addition, oceanic plateaus are
characterized by largely flat REE patterns (e.g. Floyd, 1989; Mahoney et al.,
1993), which contrast with the OIB and E-MORB assemblages defining the
redefined Nilüfer Unit that displays variable enrichment in LREE relative to
HREE (Figure 4.2), and nearly flat N-MORB normalized incompatible trace
element patterns.
In terms of the rift model, there is no compelling geological or geochemical
evidence to support the suggestion that the Nilüfer basalts were emplaced in a
continental rift setting (Pickett and Robertson, 1996, 2004; Okay et al., 1996;
Sayıt and Göncüoğlu, 2009a). Within the Nilüfer Unit, there is no field evidence
of continental crustal material in primary contact with these OIB- and E-MORB-
type basalts. It is also significant in this context that the investigated basaltic
samples characterizing the Nilüfer Unit display little or no crustal contamination
as displayed by their geochemistry. Furthermore, a back-arc basin opened on a
continental basement does not also seem to be a plausible model for the
geodynamic evolution of the Nilüfer Unit, as the basaltic rocks lack any
geochemical signature which can be attributed to a subduction-modified mantle
(e.g. Ferrar Magmatic Province, Hergt et al., 1991). Hence, rift models with the
involvement of continental crust do not appear to be suitable for the genesis of
Nilüfer-type basalts considered in this study.
The Middle-Late Triassic (Anisian-Carnian) E-MORB- and OIB-like magmatism
(without crustal involvement) suggests that oceanic islands and/or seamounts
have formed on oceanic crust during this time interval (Sayıt and Göncüoğlu,
148
2009a). Although a seamount origin was previously proposed by Pickett and
Robertson (1996, 2004) for the Nilüfer Unit, their interpretation was restricted
only to the Nilüfer-type assemblages suggested by Okay et al. (1991) in NW
Anatolia. Therefore, this study differs considerably from those of Pickett and
Robertson in terms of both extent and terminology. Çapan and Floyd (1985) also
proposed a seamount origin; however their study also remained very local
compared to what has been suggested by this study.
The petrological model proposed by Sayıt and Göncüoğlu (2009a) suggests that
the seamounts were formed nearby the Palaeotethyan spreading ridge in
association with a mantle plume. According to their model, the OIB-like
magmatism results from the partial melts directly derived from the mantle plume.
The E-MORB-type melts, on the other hand, are the products of the melt-mixing
that has occurred as a result of mixing of enriched plume derived melts coming
from garnet-stability field with the depleted spinel-facies melts. According to this
model, the depleted spinel-facies melts were derived from an N-MORB source,
i.e. depleted asthenospheric mantle upwelling through the mid-ocean ridge. The
enriched character of the OIB-type melts is confirmed,here as indicated clearly by
isotope geochemistry (Figure 4.23). The presence of a depleted source for the
generation of E-MORB-type melts as previously suggested by Sayıt and
Göncüoğlu (2009a), however, is not confirmed by the current study (see Chapter
4), since the geochemistry of the E-MORB-type metabasic rocks reflects enriched
isotopic signatures (Figure 4.23), suggesting that the source of the E-MORB-type
melts should also have been an enriched source. This indicates that the
magmatism creating these seamounts should have occurred away from a
spreading center (if any). Therefore, the main mechanism that generates both type
of melts (E-MORB and OIB) was probably the plume itself.
5.9. The Geodynamic Model Proposed by This Study
As displayed by the geochemical and geological evidences presented by this
study as well as the previous studies, the redefined Nilüfer Unit characterizes
149
seamounts and ocean islands that were formed on the Palaeotethyan oceanic crust
in association of a mantle plume. After explaining the possible tectonic setting of
the Nilüfer Unit, the important questions are: what was the relation of these
oceanic islands with the other oceanic assemblages, and how were they
incorporated into a sedimentary mélange with continent-derived rocks (i.e.
Paleozoic platform carbonates, arkosic sandstones and greywackes?
Among the ocean-derived lithologies in close relation to the Palaeotethyan
oceanic lithosphere, the ones characterizing oceanic islands is now well-
constrained on the basis of this study as well as many published works (e.g.
Pickett and Robertson, 2004; Sayıt and Göncüoğlu, 2009a). These assemblages
mainly include metabasalts bearing dominantly alkaline OIB signatures and their
derivatives (e.g. pillow breccias, hyaloclastites) primarily associated with pelagic
and neritic limestones as well as chert and mudstones. Although these oceanic-
island-type assemblages are ubiquitously found, the metabasic rocks with N-
MORB signatures, reflecting the Palaeotethyan oceanic crust itself, have not been
revealed so far from the central and western sectors of the Karakaya Complex.
In contrast to the Nilüfer-type assemblages which include no terrigenous
sediments, the Eymir Unit is composed largely of metaclastics that indicate an
origin of a continental basement. These lithologies actually have misled the
workers in interpreting the Karakaya Complex. This is mainly due to the fact that
the mélange character of the Karakaya assemblages has been obscured. In most of
the places, these clastic lithologies form the matrix that envelops the metabasaltic
(the Nilüfer Unit) and limestone blocks. These clastics commonly appear as of
Late Triassic age, while in a few places significantly older ages has also been
reported.
Occurrence of the Na-amphibole-bearing metabasic rocks in the Nilüfer Unit
suggest that these lithologies should have buried deep inside the subduction zone
in relatively cold conditions. This evidence, together with the oceanic-island
character of these metabasic rocks, is indicative of a subduction/accretion prism,
150
where the fragments of oceanic islands have been incorporated and chaotically
mixed with the continental-derived lithologies.
In order to understand the geodynamic evolution of the study area between Late
Palaeozoic and the latest Triassic, the well-constrained findings requires the
following criteria to be taken into account:
1. The Karakaya Complex represents a subduction/accretion complex formed as a
result of the subduction of the Palaeotethyan oceanic lithosphere.
2. The formation age of the complex is the Late Triassic, while its metamorphism
age is the latest Triassic.
3. The oceanic lithologies incorporated into the accretionary prism represent
oceanic islands and their platforms, and they are of Middle-Late Triassic age.
4. Within the accretionary material, there exist lithologies derived from
continental and/or arc crust, and from a carbonate platform of Devonian-Permian
age.
5. The Karakaya Complex rests upon a Late Palaeozoic continental crust
fragment that belongs to the Sakarya Composite Terrane. The contact between
them appears to be mostly tectonic, though primary stratigraphic relationships
with some clastic units have also been reported.
6. At the end of Permian (Chanxingian), it appears that an OIB-type volcanic
activity started at the northern margin of the Sakarya continental crust or on an
oceanic basin (the Palaeotethys) to the north of that margin. This age constitutes
the oldest age that has been proven to reflect the age of volcanism.
7. For the Palaeozoic reconstruction, it is more appropriate to start with the end of
Permian, since there is no much data regarding that time interval.
Though highly speculative, it can be suggested that during Early Carboniferous,
the southward subduction of the Palaeotethyan oceanic slab resulted in arc-type
151
magmatism producing the Söğüt-type assemblages and associated granitoid
bodies (e.g. Yılmaz, 1981; Göncüoğlu et al., 2000) on the northern margin of the
Tauride-Anatolide Platform (Figure 5.1). At the same time interval, a back-arc rift
also developed to the south of the Söğüt arc (Göncüoğlu et al., 2007). This
continental back-arc rift, however, could not pass into advance stages, and
remained as a failed (aborted) rift as indicated by the absence of pelagic
assemblages. In this chain of events, it must be noted that the Palaeotethys,
representing the main ocean, is located to the north of the Sakarya Terrane. It can
be further argued that the southerly-dipping subduction may also have resulted in
the formation of the Küre-type oceanic crust on the Palaeotethys.
If the rift model (the first alternative) is integrated into the subduction/accretion
model (the second alternative), a geodynamic model as the following can be
proposed. During Late Permian, the continued subduction of the Palaeotethyan
oceanic slab resulted in rifting of the northern margin of the Tauride-Anatolide
Platform. This rift basin (will be called the Karakaya Rift Basin on the basis of
this study), was opened on the assemblages represented by a Söğüt-type arc
basement and an overlying carbonate platform of Tauride-Anatolide character.
Alternatively, this rift basin may have been opened in response to a mantle plume
rising beneath the Palaeotethyan lithosphere. However, in this case, one would
expect a highly voluminous magmatism, such as the Oligocene flood volcanism
in Yemen (Baker et al., 1996) or Parana-Etendeka flood volcanism (Peate, 1997).
Thus, the first option, namely a back-arc rift-type opening, seems more
applicable. The Karakaya rift basin became gradually deepened to the end of
Permian, as reflected by the Changxingian cherts alternating with arkosic
sandstones. While deeping during Early-Middle Triassic, the Permian and
Carboniferous limestone blocks of varying sizes were incorporated within the
sediments as a result of the gravity slides.
152
Figure 5.1. Geodynamic model for the evolution of the Karakaya Complex proposed by this study, integrating both rift- and subduction/accretion-related processes.
153
During Early?-Middle Triassic, the oceanic spreading brought the Palaeotethyan
oceanic lithosphere over the mantle plume, resulting in mainly alkaline OIB-like
magmatism with enriched geochemical signatures. These seamounts created in
response to this mantle-plume related magmatism probably grew up to the sea-
level or exceeded, and become oceanic islands that sit on the oceanic crust, as
indicated by the Anisian neritic limestones interbedded with the metabasalts. In
the deeper parts, the deep sea sediments (pelagic limestones, mudstones, cherts)
have also been deposited synchronously with metabasalts along the flanks of the
oceanic islands. The seamount/ocean island generation continued until early-Late
Triassic as indicated by the Ladinian?-Carnian cherts interbedded with
metabasalts in NW Anatolia (Sayıt and Göncüoğlu, 2009a). During the Late
Triassic, with the ongoing subduction, the oceanic islands started to have been
incorporated to the accretionary prism in front of the northern margin of the
Tauride-Anatolide platform. The area of subduction/accretion was probably away
from the forearc region where the active margin volcanism took place, and
represented by a thin accreted mélange (Closs, 1984). The evidence for this
comes from the intra-oceanic character of the metadiabase dikes cutting across
the subduction/accretion prism. Here, the oceanic islands were sliced and mixed
with material that derived from the Gondwanan carbonate platform and the
Karakaya rift basin. Some of the slices with ocean island material in the
subduction-accretion prism should have been deeply buried through the
subducting slab as displayed by the development of Na-amphibole found in the
Nilüfer metabasaltic rocks. In the deeper subducted slices, some of these
metabasic rocks also experienced amphibolite and eclogite facies metamorphism
(Topuz et al., 2004; Okay and Monie, 1997; Okay et al., 2002). During accretion,
some small piggy-back-type basins were formed on top of the prism, and both
shallow and deep sedimentation took place in these places. These small basins
were the places where the Late Triassic clastics were deposited along with the
Late Triassic cherts and limestones. Some of these clastics were later also
incorporated with the metabasaltic rocks and buried to the deeper levels within
the prism. At the end, with the closure of the Palaeotethys, the resulting picture is
154
a tectonic mélange characterized by pieces of dissimilar origin. This tectonic
mélange includes in some parts fragments of oceanic islands chaotically mixed
with the continental-derived clastics, while in some places comprises pieces of
continental rift and its carbonate platform and associated sediments.
The fate of the Küre basin is behind the scope of this study but is worth to
speculate. Most of the studies regard the Küre Basin as a small continental back-
arc basin that has advanced into the mature oceanic stage (e.g. Ustaömer and
Robertson 1994; Kozur et al., 2000; Stampfli and Borel, 2002; Moix et al., 2008),
and they treat the Karakaya and Küre assemblages as representive of different
basins. Okay et al. (2006), on the other hand, argue that there is no continental
sliver observed which separates the Karakaya and Küre lithologies in the field;
thus they assume that both were parts of the same ocean, namely the Palaeotethys.
As indicated by their SSZ-type affinities (Ustaömer and Robertson, 1994), the
Küre ophiolites are markedly different than the Nilüfer-type metabasic rocks
which are dominantly of OIB-type trace element signatures (Figure 4.2). This
striking difference shows that the Küre metabasalts should have represented a
different type of tectonic setting. The intra-oceanic geochemical nature of the
Küre extrusives away from any continent-derived effects suggests that it was
probably characterizing an oceanic back-arc basin (e.g. today’s the Mariana
Trough, the Manus Basin, or the East-Scotia Ridge; Gribble et al., 1998; Sinton et
al., 2003; Livermore, 2003) that had opened on the Palaeotethyan oceanic crust.
Thus, in this study the Küre basin is treated as a remnant of the Palaeotethyan
oceanic crust. In this respect, this interpretation is consistent with that of Okay et
al. (2006).
The SSZ-type Eymir metadiabase dikes geochemically evaluated in detail are
another matter of debate. In this study, the Eymir diabases are interpreted as the
post-accretionary dikes intruding the Karakaya complex during closure of the
Palaeotethys in latest Triassic. In the absence of any age constraints, these
metadiabases are regarded as pre-Liassic because of the following reasons. First,
based on the geological studies performed by Akyürek et al. (1984, 1996),
155
nowhere these metadiabase dikes appear to have intruded into rock assemblages
which are younger than Triassic. Second, if they were the products of a younger
closure event, i.e. Neotethys, they should have cross-cut a thick pile of the SCT
including the basement, the Karakaya Complex and the overlying Mesozoic
cover. In this case, it would be expected that the dikes should display continental
contamination to some extent. However, no studied metadiabase samples show
such a signature, therefore suggesting that these dikes should be probably of pre-
Liassic and represent the magmatism related to the termination of the
Palaeotethys.
156
CHAPTER 6
CONCLUSIONS
The Karakaya Complex is represented by a tectonic mélange that is composed of
several rock assemblages of diverse origin which were chaotically mixed with
each other during the latest Triassic as a result of the demise of the Palaeotethys.
Among these mélange units, the Nilüfer Unit of Okay et al. (1991), which
constitutes a part of pre-Liassic basement of the Sakarya Composite Terrane, is
redefined and reevaluated in this study. The redefined Nilüfer Unit is represented
by metabasic assemblages bearing OIB- and E-MORB-type signatures, which are
interbedded with shallow- and deep-sea lithologies including neritic and pelagic
limestones as well as mudstones and cherts. The Nilüfer-type assemblages can be
traced along a wide region within the Karakaya Complex, extending from Central
to NW Anatolia. To what extent the metabasic rocks cropping out in the eastern
part of the complex can be evaluated within the definition of the redefined
Nilüfer Unit; however, is a matter of debate.
The Nilüfer Unit is characterized entirely by ocean-derived assemblages; no
continental detritus is included. The presence of HP-greenschist facies metabasic
rocks (as reflected by the presence of Na-amphibole) suggests that the Nilüfer-
type assemblages has been transported to deep levels through a subduction zone
in relatively cold conditions. The presence of Na-amphibole is not only restricted
to the foliated (schistose) varieties, but also found in the non-foliated lithologies.
However, whether schistose or not, all metabasic lithologies within the Nilüfer
Unit show the same geochemical signature, namely E-MORB- and OIB-type.
157
On the basis of the detailed trace element chemistry performed in this study, the
Tepeköy Metamorphics, which were previously interpreted as an intra-oceanic
arc by Göncüoğlu et al. (2000), are found to be of OIB- and E-MORB-type
geochemical signatures, thus making them as a part of the Nilüfer Unit.
The Middle-Late Triassic age acquired from the neritic and pelagic limestones
interbedded with the metabasalts in the Hacılar area is consistent with the
previously suggested time interval for the generation of the Nilüfer Unit.
Regarding the Ankara region, it is not appropriate to separate the Karakaya units
as “less” or “more” metamorphic. It is clearly shown by this study that the
assemblages previously regarded as “less metamorphic” in the Ankara region do
actually bear the traces of high pressure metamorphism. The intensity of
deformation and degree of metamorphism is observed to change within short
distances.
The Eymir Unit, which is the other redefined unit in this study, comprises
variably deformed and metamorphosed clastic lithologies. The Eymir Unit
constitutes the matrix material in which the variable-sized blocks of the
metabasic rocks (the Nilüfer Unit) and limestones are embedded. The Eymir
metaclastics are intruded by metadiabase dikes that display intra-oceanic SSZ-
type characteristics. The Carnian age finding obtained from the radiolarians in a
chert layer alternating with the metaclastics of the Eymir Unit indicates the
presence of piggy-back-type basins formed on top of the accretionary prism
during the closure of the Palaeotethys.
No paleontological or absolute age has been acquired regarding the age of the
Eymir metadiabases. However, in the light of regional geological observations
and non-contaminated geochemical nature of these dikes suggest that they are
probably of pre-Liassic and represent the post-accretionary magmatism during
the latest Triassic.
158
The Nilüfer metabasic assemblages have OIB- and E-MORB-type trace element
signatures, whereas the Eymir metadibases are markedly different, displaying
intra-oceanic SSZ-type signatures. As demonstrated by trace and isotope
geochemistry, both Nilüfer and Eymir metabasic rocks show no evidence of
contamination by continental crust. The absence of crustal contamination, but
cross-cutting the metaclastic lithologies indicate that these dikes have probably
intruded into a thin accreted mélange in front of the main accretionary prism.
The Nilüfer-type metabasic rocks, including both OIB- and E-MORB-type, are
found to have been derived from a heterogeneous mantle source carrying
enriched isotopic signatures (FOZO, HIMU, and EMII). The SSZ-type Eymir
metadiabases, on the other hand, requires a depleted mantle source which has
been modified by of slab-derived fluids and sediment melts.
This study proposes a geodynamic model integrating both rift and
subduction/accretion models. As a working hypothesis, I suggest here that during
latest Permian, the southward subduction of the Palaeotethys led to rifting on the
northern margin of the Gondwana, forming a basin as represented by the rift
succession observed in the Geyve region (Göncüoğlu et al., 2000, 2004). The
Nilüfer Unit, representing the seamount(s) and oceanic island(s), was generated
during Early(?)-Middle Triassic, while the plume affected the Palaeotethyan
oceanic lithosphere, giving way to the E-MORB/OIB-type plume-related
magmatism. During the latest Triassic, closure of the Palaeotethys resulted in
incorporation of seamounts/oceanic islands and rift-related assemblages that
became further associated with clastic material derived from peripheral forearc
region of the accretionary prism. At the end, this chaotic amalgamation created
what is known as the Karakaya Complex.
In order to provide further constraints on the geodynamic evolution of the
Karakaya Complex, more studies are needed on the northern and eastern parts of
the complex, especially regarding the geochemical characteristics of the
159
metabasic rocks cropping out in these regions. These geochemical findings, of
course, should be supported by any paleontological or absolute age dating.
160
REFERENCES
Adamia, S., Bayraktutan, S., and Lordkipanidge, M., 1995. Structural correlations and Phanerozoic evolution of the Causasus-Eastern Pontides. In: Erler, A., Ercan, T., Bingöl, E., and Örcen, E. (eds.), Geology of the Black Sea Region. MTA Publications, 69-75.
Akyürek, B., and Soysal, Y., 1983. Biga Yarımadası Güneyinin (Savaştepe-Kırkağaç-Bergama-Ayvalık) temel jeoloji özellikleri. Maden Tetkik ve Arama Enstitüsü Dergisi, 95/96, 1-13.
Akyürek, B., Bilginer, E., Dağer, Z., and Sunu, O., 1979a. Hacılar (K. Çubuk-Ankara) bölgesinde Alt Triyas’ın varlığı. Türkiye Jeoloji Kurumu Bülteni, 22/2, 169-174.
Akyürek, B., Bilginer, E., Çatal, E., Dağer, Z., Soysal, Y., and Sunu, O., 1979b. Eldivan-Şabanözü (Çankırı) dolayında ofiyolit yerleşimine ilişkin bulgular. JMO yayınları, S.9, Ankara.
Akyürek, B., Bilginer, E., Akbaş, B., Hepşen, N., Pehlivan, Ş., Sunu, O., Soysal, Y., Dağer, Z., Çatal, E., Sözeri, B., Yıldırım, H., and Hakyemez, Y., 1982. Ankara-Elmadağ-Kalecik dolayının jeolojisi. Maden Tetkik ve Arama Enstitüsü, Rapor No : 7298 (unpublished).
Akyürek, B., Bilginer, E., Akbaş, B., Hepşen, N., Pehlivan, Ş., Sunu, O., Soysal, Y., Dağer, Z., Çatal, E., Sözeri, B., Yıldırım, H., and Hakyemez, Y., 1984. Basic geological features of Ankara-Elmadağ-Kalecik region. Jeoloji Mühendisliği, 20, 31-46 (In Turkish with English abstract).
Akyürek, B., Duru, M., Sütçü, Y.F., Papak, İ. Şaroğlu, F., Pehlivan, N., Gönenç, O., Granit, S., and Yaşar, T., 1996. Ankara ilinin çevre jeolojisi ve doğal kaynaklar projesi (1994 yılı Jeoloji grubu çalışmaları). Maden Tetkik ve Arama Enstitüsü, Rapor No: 9961 (unpublished).
Akyürek, B., Duru, M., Sütçü, Y.F., Papak, İ. Şaroğlu, F., Pehlivan, N., Gönenç, O., Granit, S., and Yaşar, T., 1997. 1/100000 ölçekli açınsama nitelikli Türkiye Jeoloji Haritaları Serisi, Ankara-F15 paftası: MTA yayınları, Ankara.
161
Albarède, F., Telouk, P., Blichert-Toft, J., Boyet, M., Agranier, A., and Nelson, B., 2004. Precise and accurate isotopic measurements using multiple-collector ICPMS. Geochimica et Cosmochimica Acta, 68, 2725-2744.
Altıner, D., and Koçyiğit, A., 1993. Third remark on the geology of the Karakaya basin. An Anisian megablock in northern central Anatolia: micropaleontologic, stratigraphic and tectonic implications for the rifting stage of Karakaya basin, Turkey. Revue de Palaeobiologie, 12, 1-17.
Baker, J.A., Thirlwall, M.F., and Menzies, M.A., 1996. Sr-Nd-Pb isotopic and trace element evidence for crustal contamination of plume-derived flood basalts: Oligocene flood volcanism in western Yemen. Geochimica et Cosmochimica Acta, 60, 2559-2581.
Bedard, J.H., 1994. A procedure for calculating the equilibrium distribution of trace elements among the minerals of cumulate rocks, and the concentration of trace elements in the coexisting liquids. Chemical Geology, 118, 143-153.
Bilchert-Toft, J., Chauvel, C., and Albarède, F., 1997. Separation of Hf and Lu for high-precision isotope analysis of rock samples by magnetic sector-multiple collector ICP-MS. Contributions to Mineralogy and Petrology, 127, 248-260.
Bingöl, E., Akyürek, B., and Korkmazer, B., 1973. The geology of the Biga Peninsula and some features of the Karakaya Formation. Proceedings of the 50th Anniversary of the Turkish Republic Earth Science Congress. Mineral Research and Exploration Institute of Turkey (MTA) Publications, 70-77 (in Turkish with English abstract).
Brenan, J.M., Shaw, H.F., Ryerson, F.J., and Phinney, D.L., 1995. Mineral-aqueous fluid partitioning of trace elements at 900°C and 2.0 Gpa: Constraints on the trace element chemistry of mantle and deep crustal fluids. Geochimica et Cosmochimica Acta, 59, 3331-3350.
Chaffey, D. J., Cliff, R.A., and Wilson, B.M., 1989. Characterization of the St. Helena magma source. In: Saunders, A.D., and Norry, M.J. (eds.), Magmatism in the Ocean Basins. Geological Society, London, Special Publications, 42, 257-276.
162
Chauvel, C., Hofmann, A.W., and Vidal, P., 1992. HIMU-EM: The French Polynesia connection. Earth and Planateray Science Letters, 110, 99-119.
Cheatham, M., Sangrey, W.F., and White, W.M., 1993. Sources of error in external calibration ICP-MS analysis of geological samples and improved nonlinear drift correction procedure. Spectrochimica Acta, 48B, E487-E506.
Class, C., Miller, D.M., Goldstein, S.L., and Langmuir, C.H., 2000. Distinguishing melt and fluid subduction components in Umnak Volcanics, Aletuian Arc. Geochemistry Geophysics Geosystems, 1, 1999GC000010.
Closs, M., 1984. Flow melanges and the structural evolution of accretionary wedges. In: Raymond, L.A. (ed.), Melanges: Their nature, origin, and significance: Geological Society of America, Special Paper, 198, 71-79.
Coleman, R.G., and Lanphere, M.A., 1971. Distribution and age of high-grade blueschists, associated eclogites, and amphibolites from Oregon and California. Geological Society of America Bulletin, 82, 2397-2412.
Condie, K.C., 2001. Mantle Plumes and Their Record in Earth History. Cambridge University Press, 306 pp.
Çapan, U.Z., and Floyd, P.A., 1985. Geochemical and petrographic features of metabasalts within units of Ankara melange, Turkey. Ofioliti, 10, 3-18.
De Astis, G., La Volpe, L., Peccerillo, A., and Civetta, L., 1997. Volcanological and petrological evolution of Vulcano island (Aeolian Arc, southern Tyrrhenian Sea). Journal of Geophysical Research, 102, 8021-8050.
Dönmez, M., Akçay, A.E., Kara, H., Yergök, A.F., and Esentürk, K., 2008. 1/100000 ölçekli açınsama nitelikli Türkiye Jeoloji Haritaları Serisi, Kırşehir-I30 paftası: MTA yayınları, Ankara.
Dupre, B., and Allegre, C.J., 1983. Pb-Sr isotope variation in Indian Ocean basalts and mixing phenomena. Nature, 303, 142-146.
Ellam, R.M., and Cox, K.G., 1989. A Proterozoic lithospheric source for Karoo magmatism: evidence from the Nuanetsi picrites. Earth and Planetary Science Letters, 92, 207-218.
163
Elliott, T., Plank, T., Zindler, A., White, W., and Bourdon, B., 1997. Element transport from slab to volcanic front at the Mariana arc. Journal of Geophysical Research, 102, 14991-15019.
Erk, A.S., 1977. Ankara civarında Genç Paleozoyiğin Kulm fliş formasyonu. Maden Tetkik ve Arama Dergisi, 88, 73-94.
Erol, O., 1956. Ankara güneydoğusundaki Elma Dağı ve çevresinin jeolojisi ve jeomorfolojisi üzerinde bir araştırma. MTA yayınları, Seri. D, 9, Ankara.
Faure, G., 2001. Origin of Igneous Rocks: The Isotopic evidence. New York, Springer-Verlag, 496 pp.
Fitton, J.G., Saunders, A.G., Norry, M.J., Hardarson, B.S., Taylor, R.N., 1997. Thermal and chemical structure of the Iceland plume. Earth and Planetary Science Letters 153, 197-208.
Floyd, P.A., 1989. Geochemical features of intaplate oceanic plateau basalts. In: Saunders A.D., Norry, M.J. (eds.), Magmatism in the Ocean Basins. Geological Society, London, Special Publications, 42, 215-230.
Floyd, P.A., and Winchester, J.A., 1978. Identification and discrimination of altered and metamorphosed volcanic rocks using immobile elements. Chemical Geology, 21, 291-306.
Fretzdorff, S., Livermore, R.A., Devey, C.W, Leat, P.T., and Stoffers, P., 2002. Petrogenesis of the Back-arc East Scotia Ridge, South Atlantic Ocean. Journal of Petrology, 43, 1435-1467.
Frey, F.A., Green, D.H., and Roy, S.D., 1978. Integrated models of basalt petrogenesis: a study of quartz tholeiites to olivine melilitites from Southeastern Australia utilizing geochemical and experimental petrological data. Journal of Petrology, 19, 463-513.
Frey, F.A., Coffin, M.F., Wallace, P.J., et al. 2000. Origin and evolution of a submarine large igneous province: the Kerguelen Plateau and Broken Ridge, southern Indian Ocean. Earth and Planetary Science Letters, 176, 73-89.
Furman, T., Bryce, J.G., Karson, J., and Iotti, A., 2004. East African Rift System (EARS) plume structure: insights from Quaternary mafic lavas of Turkana, Kenya. Journal of Petrology, 45, 1069-1088.
164
Genç, Ş., 1987. Geology of the region between Uludağ and the İznik lake. IGCP Project No 5. Guide book for the field excursion along Western Anatolia, Turkey, 19-25.
Genç, Ş.C., 2004. A Triassic large igneous province in the Pontides, northern Turkey: geochemical data for its tectonic setting. Journal of Asian Earth Sciences, 22, 503-516.
Genç, Ş.C., and Yılmaz, Y., 1995. Evolution of the Triassic continental margin, northwest Anatolia. Tectonophysics, 243, 193-207.
Gibson, S.A., Thompson, R.N., Day, J.A., Humpris, S.E., and Dickin, A.P., 2005. Melt-generation processes associated with the Tristan mantle plume: Constraints on the origin of EM-1. Earth and Planetary Science Letters, 237, 744-767.
Gill, J.B., 1981. Orogenic Andesites and Plate Tectonics. New York, Springer-Verlag, 390 pp.
Göncüoğlu, M.C., Erendil, M., Tekeli, O., Aksay, A., Kuşçu, İ., and Ürgün, B., 1987. Geology of the Armutlu Peninsula. IGCP Project No 5, Guide Book. Field Excursion along Western Anatolia, 12-18.
Göncüoğlu, M.C., Turhan, N., Şentürk, K., Uysal, Ş., Özcan, A., and Işık, A., 1996. Geological characteristics of the structural units in Central Sakarya between Nallıhan and Sarıcakaya. Mineral Research and Exploration Institute of Turkey (MTA) Report, No. 10 094 (In Turkish).
Göncüoğlu, M.C., Dirik, K., and Kozlu, H., 1997. Pre-Alpine and Alpine Terranes in Turkey: explanatory notes to the terrane map of Turkey. Annales Geologique de Pays Hellenique, 37, 515-536.
Göncüoğlu, M.C., Turhan, N., Şentürk, K., Özcan, A., and Uysal, Ş. 2000. A geotraverse across NW Turkey: tectonic units of the Central Sakarya region and their tectonic evolution. In: Bozkurt, E., Winchester, J., Piper, J.A. (eds.), Tectonics and magmatism in Turkey and the Surrounding Area. Geological Society, London, Special Publications, 173, 139-161.
Göncüoğlu, M.C., Kuwahara, K., Tekin, K.U., and Turhan, N., 2004. Upper Permian (Changxingian) radiolarian cherts within the clastic successions of the “Karakaya Complex” in NW Anatolia. Turkish Journal of Earth Sciences, 13, 201-213.
165
Göncüoğlu, M.C., Çapkınoğlu, Ş., Gürsu, S., Noble, P., Turhan, N., Tekin, U.K., Okuyucu, C., and Göncüoğlu, Y., 2007. The Mississippian in the Central and Eastern Taurides (Turkey): constraints on the tectonic setting of the Tauride-Anatolide Platform. Geologica Carpathica, 58, 427-442.
Green, T.H., 1995. Significance of Nb/Ta as an indicator of geochemical processes in the crust-mantle system. Chemical Geology 120. 347-359.
Greenly, E., 1919. The geology of Anglesey: Great Britain Geological Survey Memoir, 1, 980.
Gribble, R.F., Stern, R.J., Newman, S., Bloomer, S.H., and O’Hearn, T., 1998. Chemical and isotopic composition of lavas from the northern Mariana Trough; implications for magma genesis in back-arc basins. Journal of Petrology, 39, 125-154.
Haase, K.M., Stoffers, P., and Garbe-Schönberg, C.D., 1997. The petrogenetic evolution of lavas from Easter Island and neighbouring seamounts, near-ridge hotspot volcanoes in the SE Pacific. Journal of Petrology 38, 785-813.
Hart, S.R., 1984. A large-scale isotope anomaly in the Southern Hemisphere mantle. Nature, 309, 753-757.
Hart, S.R., and Davis, K.E., 1978. Nickel partitioning between olivine and silicate melt. Earth and Planetary Science Letters, 40, 203-219.
Hart, S.R., Hauri, E.H., Oschmann, L.A., and Whitehead, J.A., 1992. Mantle plumes and entrainment: isotopic evidence. Science, 256, 517-520.
Hart, W.K., Wolde, G.C., Walter, R.C., and Mertzman, S.A., 1989. Basaltic volcanism in Ethiopia: constraints on continental rifting and mantle interactions. Journal of Geophysical Research 94, 7731-7748.
Hawkesworth, C.J., Gallagher, K., Kelly, S., Mantovani, M., Peate, D.W., Regelous, M., and Rogers, N.W., 1992. Parana magmatism and the opening of South Atlantic. In: Storey, B.C., Alabaster, T., Pankhurst, R.J. (eds.), Magmatism and the Causes of Continental Break-up. Geological Society, London, Special Publications, 68, 221-240.
166
Hawkesworth, K., Gallagher, K., Hergt, J.M., and McDermott, F., 1993. Mantle and slab contributions in arc magmas. Annual Review of Earth and Planetary Science, 21, 175-204.
Hergt, J.M., Peate, D.W., and Hawkesworth, C.J., 1991. The petrogenesis of Mesozoic Gondwana low-Ti flood basalts. Earth and Planetary Science Letters, 105, 134-148.
Hochstaedter, A., Gill, J., Peters, R., Broughton, P., Holden, P., and Taylor, B., 2001. Across-arc geochemical trends in the Izu-Bonin arc: contributions from the subducting slab. Geochemistry Geophysics Geosystems, 2, 2000GC000105.
Hofmann, A.W., 1988. Chemical differentiation of the Earth: the relationship between mantle, continental crust, and oceanic crust. Earth and Planetary Science Letters, 90, 297-314.
Hofmann, A.W., Jochum, K.P., Seufert, M., and White, W.M., 1986. Nb and Pb in oceanic basalts: new constraints on mantle evolution. Earth and Planetary Science Letters, 79, 33-45.
Hsü, K.J., 1968. Principles of melanges and their bearing on the Franciscan-Knoxville Paradox. Geological Society of America Bulletin, 79, 1063-1074.
Ionov, D.A., and Hofmann, A.W., 1995. Nb-Ta-rich mantle amphiboles and micas: Implications for subduction-related metasomatic trace element fractionations. Earth and Planetary Science Letters, 131, 341-356.
Jacobsen, S.B., and Wasserburg, G.J., 1984. Sm-Nd isotopic evolution of chondrites and achondrites, II. Earth and Planetary Science Letters, 67, 137-150.
Johnson, K.T.M., 1998. Experimental determination of partition coefficients for rare earth and high-field-strength elements between clinopyroxene, garnet, and basaltic melt at high pressures. Contributions to Mineralogy and Petrology, 133, 60-68.
Johnson, K.T.M., Dick, H.J.B., and Schimizu, N., 1990. Melting in the oceanic upper mantle: an ion microprobe study of diopsides in abyssal peridotites. Journal of Geophysical Research, 95, 2661-2678.
167
Kaya, O., 1991. Stratigraphy of the Pre-Jurassic sedimentary rocks of the western parts of Turkey; type area study and tectonic considerations. type area study and tectonic considerations. Newsletter for Stratigraphy, 23, 123-140.
Kaya, O., and Mostler, H., 1992. A Middle Triassic age for low-grade greenschist facies metamorphic sequence in Bergama (İzmir), western Turkey: the first paleontological age assignment and structural-stratigraphic implications. Newsletter for Stratigraphy, 26, 1-17.
Kaya, O., Wiedmann, J., and Kozur, H., 1986. Preliminary report on the stratigraphy, age and structure of the so-called Late Paleozoic and/or Triassic “mélange or “suture zone complex” of northwestern and western Turkey. Yerbilimleri, 13, 1-16.
Kaya, O., Kozur, H., Sadeddin, W., and Helvacı, H., 2001. Late Norian conodont age for a metacarbonate unit in NW Anatolia, Turkey. Geobios, 34, 527-532.
Kelemen, P.B., Shimizu, N., and Dunn, T., 1993. Relative depletion of niobium in some arc magmas and the continental crust: partitioning of K, Nb, La and Ce during melt/rock reaction in the upper mantle. Earth and Planetary Science Letters, 120, 111-134.
Klein, E.M., Langmuir, C.L., and Staudigel, H., 1991. Geochemistry of basalts from the Southeast Indian Ridge, 115°E-138°E. Journal of Geophysical Research, 96, 2089-2107.
Koçyiğit, A., 1987. Tectono-stratigraphy of the Hasanoglan (Ankara) region: evolution of the Karakaya orogen. Yerbilimleri, 14, 269-293 (In Turkish with English abstract).
Koçyiğit, A., 1991a. First remark on the geology of Karakaya basin. Karakaya Orogen and pre-Jurassic nappes in eastern Pontides, Turkey. Geologica Romana, 27, 3-11.
Koçyiğit, A., 1991b. An example of an accretionary forearc basin from northern Central Anatolia and its implications for the history of subduction of Neo-Tethys in Turkey. Geological Society of America Bulletin, 103, 22-36.
Koçyiğit, A., 1992. Southward-vergent imbricate thrust zone in Yuvaköy: A record of the latest compressional event related to the collisional tectonic regime in Ankara-Erzincan Suture zone, TAPG Bull 4/I, 111-118.
168
Koçyiğit, A., and Tokay, M., 1985. Çatalçam (Zevker)-Erzincan arasında Kuzey Anadolu Fay Kuşağı’nın sismo-tektonik incelemesi: Fay Kuşağı’nın tektono-stratigrafisi, sistematiği ve Neotektonik özellikleri. Bayındırlık ve İskan Bakanlığı, Teknik Araş. Ve Uyg. Gn. Müd., Proje Kod no: 82-04-08-00-02, 101 pp (unpublished).
Koçyiğit, A., and Lünel, A.T., 1987. Geology and tectonic setting of Alcı region, Ankara. METU Journal of Pure and Applied Sciences, 20, 35-57.
Koçyiğit, A., Kaymakçı, N., Rojay, B., Özcan, E., Dirik, K., and Özçelik, Y., 1991. İnegöl-Bilecik-Bozüyük arasında kalan alanın jeolojik etüdü. Orta Dogu Teknik Üniversitesi-Türkiye Petrolleri Anonim Ortaklıgı projesi raporu, no: 90-03-09-01-05 (unpublished).
Kostopoulos, D.K., 1991. Melting of the shallow upper mantle: a new perspective. Journal of Petrology, 32, 671-699.
Kozur, H., 1997. Pelagic Permian and Triassic of the western Tethys and its paleogeographic and stratigraphic significance. Abstracts, XLVIII. Berg- und Hüttenmannischer Tag, Technische Universitat Bergakademie Freiberg, 21-25.
Kozur, H., Aydın, M., Demir, O., Yakar, H., Göncüoğlu, M.C., and Kuru, F., 2000. New stratigraphic and palaeogeographic results from the Palaeozoic and early Mesozoic of the Middle Pontides (northern Turkey) in the Azdavay, Devrekani, Küre and Inebolu areas: Implications for the Carboniferous-Early Cretaceous geodynamic evolution and some related remarks to the Karakaya oceanic rift basin. Geologica Croatica, 53, 209-268.
Leven, E.Ja., and Okay, A.I., 1996. Foraminifera from the exotic Permo-Carboniferous limestone blocks in the Karakaya Complex, northwest Turkey. Rivista Italiana Paleontologia e Stratigrafia, 102, 139-174.
Livermore, R., 2003. Back-arc spreading and mantle flow in the East Scotia Sea. In: Larter, R.D., and Leat, P.T. (eds.), Intra-Oceanic Subduction Systems: Tectonic and Magmatic Processes. Geological Society, London, Special Publications, 219, 315-331.
Mahoney, J.J., Storey, M., Duncan, R.A., Spencer, K.J., and Pringle, M., 1993. Geochemistry and geochronology of Leg 130 basement lavas: nature and origin of the Ontong Java Plateau. In: Berger WH, Kroenke LW, Mayer LA et al. Proc ODP Sci Results 130, College Station TX (Ocean Drilling Program), 3-22.
169
McKenzie, D., and O’Nions, R. K., 1991. Partial melt distributions from inversion of rare earth element concentrations. Journal of Petrology, 32, 1021-1091.
Moix, P., Beccaletto, L., Kozur, H.W., Hochard, C., Rosselet, F., and Stampfli, G.M., 2008. A new classification of the Turkish terranes and sutures and its implication for the paleotectonic history of the region. Tectonophysics, 451, 7-39.
Norman, M.D., and Garcia, M.O., 1999. Primitive magmas and source characteristics of the Hawaiian plume: petrology and geochemistry of shield picrites. Earth and Planetary Science Letters, 168, 27-44.
Norman, T., 1973. On the structure of the Ankara melange. Proceedings of the 50th Anniversary of the Turkish Republic Earth Science Congress. Mineral Research and Exploration Institute of Turkey (MTA) Publications, 77-94 (in Turkish with English abstract).
Okay, A.İ., 1989. Tectonic units in the Pontides, northern Turkey. In: Sengör, A.M.C. (ed.), Tectonic Evolution of the Tethyan Region. Kluwer Academic Publishers, USA, 109-116.
Okay, A.İ., 2000. Was the Late Triassic orogeny in Turkey caused by the collision of an oceanic plateau? In: Bozkurt, E., Winchester, J., Piper, J.A. (Eds.), Tectonics and magmatism in Turkey and the Surrounding Area. Geological Society, London, Special Publications, 173, 139-161.
Okay, A.İ., and Monie, 1997. Early Mesozoic subduction in the Eastern Mediterranean: Evidence from Triassic eclogite in nortwest Turkey. Geology, 25, 595-598.
Okay, A.I., and Tüysüz, O., 1999. Tethyan sutures of northern Turkey. In: Durand, B., Jolivet, L., Horvath, F., and Seranne, M. (eds.), The Mediterranean Basins: Tertiary Extension within the Alpine Orogen. Geological Society, London, Special Publications, 156, 475-515.
Okay, A.İ., and Altıner, D., 2004. Uppermost Triassic limestone in the Karakaya Complex-stratigraphic and tectonic significance. Turkish Journal of Earth Sciences, 13, 187-199.
Okay, A.İ., and Göncüoğlu, M.C., 2004. The Karakaya Complex: A review of data and concepts. Turkish Journal of Earth Sciences, 13, 77-95.
170
Okay, A.İ., Siyako, M, and Bürkan, B.A., 1991. Geology and tectonic evolution of the Biga Peninsula, northwest Turkey. Bulletin of Technical University of Istanbul, 44, 191-256.
Okay, A.İ., Satır, M., Maluski, H., Siyako, M., Monie, P., Metzger, R., and Akyüz, S., 1996. Paleo- and Neo-Tethyan events in northwest Turkey: geological and geochronological constraints. In: Yin, A., Harrison, M. (Eds.), Tectonics of Asia. Cambridge University Press, 420-441.
Okay, A.İ., Monod, O., and Monie, P., 2002. Triassic blueschists and eclogites from northwest Turkey: vestiges of the Paleo-Tethyan subduction. Lithos, 64, 155-178.
Okay, A.I., Satır, M., and Siebel, W., 2006. Pre-Alpide Palaeozoic and Mesozoic orogenic events in the Eastern Mediterranean region. In: Gee, D.G., and Stephenson, R.A. (eds.), European Lithosphere Dynamics. Geological Society, London, Memoirs, 32, 389-405.
Önder, F., and Göncüoğlu, M.C., 1989. Armutlu yarımadasında (Batı Pontidler) Üst Triyas konodontları. Maden Tetkik ve Arama Dergisi, 109, 147-152.
Özgül, L., 1993. Tectono-stratigraphy of the İmrahor (Ankara) region. B. Sc. Research Project, Middle East Technical University, 47 pp, Ankara.
Patchett, P.J., 1983. Importance of the Lu-Hf isotopic system in studies of planetary chronology and chemical evolution. Geochimica et Cosmochimica Acta, 47. 81-91.
Patchett, P.J., and Tatsumoto, M., 1980. Hafnium isotope variations in oceanic basalts. Geophysical Research Letters, 7, 1077-1080.
Pearce, J.A., 1975. Basalt geochemistry used to investigate past tectonic environments on Cyprus. Tectonophysics, 25, 41-67.
Pearce, J.A., 1983. The role of sub-continental lithosphere in magma genesis at active continental margins. In: Hawkesworth, C.J., and Norry, M.J. (eds.), Continental basalts and mantle xenoliths, 230-249. Nantwich: Shiva.
Pearce, J.A., and Cann, J.R., 1973. Tectonic setting of basic volcanic rocks determined using trace element analysis. Earth and Planetary Science Letters, 19, 290-300.
171
Pearce, J.A., and Norry, M., 1979. Petrogenetic implications of Ti, Zr, Y and Nb variations in volcanic rocks. Contributions to Mineralogy and Petrology, 69, 33-47.
Pearce, J.A., and Parkinson, I.J., 1993. Trace element models for mantle melting: application to volcanic arc petrogenesis. In: Prichard H.M., Alabaster T., Harris N.B.W., and Neary C. R., (eds.), Magmatic Processes and Plate Tectonics. Geological Society, London, Special Publications, 76, 373-403.
Pearce, J.A., Peate, D.W., 1995. Tectonic implications of the composition of volcanic arc magmas. Annual Review of Earth and Planetary Sciences 23, 251-285.
Pearce, J.A., and Stern, R.J., 2006. Origin of back-arc basin magmas: trace element and isotope perspectives. In: Christie, D.M., Fisher, C.R., Lee, S.-M., and Givens, S. (eds.), Back-Arc Spreading Systems: Geological, Biological, Chemical, and Physical Interactions, AGU, Geophysical Monographs, 166, 63-86.
Pearce, J.A., Baker, P.E., Harvey, P.K., and Luff, I.W., 1995. Geochemical evidence for subduction fluxes, mantle melting and fractional crystallization beneath the South Sandwich Island Arc. Journal of Petrology, 36, 1073-1109.
Pearce, J.A., Kempton, P.D., Nowell, G.M., Noble, S.R., 1999. Hf-Nd element and isotope perspective on the nature and provenance of mantle and subduction components in arc-basin systems: examples from the western Pacific. Journal of Petrology, 40, 1579-1611.
Pearce, J.A., Stern, R.J., Bloomer, S.H., and Fryer, P., 2005. Geochemical mapping of the Mariana Arc-Basin System: implications for the nature and distribution of subduction components. Geochemistry Geophysics Geosystems, 6, 2004GC000895.
Pearce, J.A., Kempton, P.D., and Gill, J.B., 2007. Hf-Nd evidence for the origin and distribution of mantle domains in the SW Pacific. Earth and Planetary Science Letters, 260, 98-114.
Peate, D.W., 1997. The Parana-Etendeka Province. In: Mahoney, J.J., and Coffin, M. (eds.), Large Igneous Provinces: Continental, Oceanic, and Planetary Flood Volcanism. AGU, Geophysical Monographs 100, 217-245.
172
Peate D.W., and Pearce, J.A., 1998. Causes of spatial compositional variations in Mariana arc lavas: Trace element evidence. The Island Arc, 7, 479-495.
Peate, D.W., Hawkesworth, C.J., and Mantovani, M.S.M., 1992. Chemical stratigraphy of the Parana lavas (South America): classification of magma types and their spatial distribution. Bulletin of Volcanology, 55, 119-139.
Pickett, E.A., and Robertson, A.H.F., 1996. Formation of the Late Paleozoic-Early Mesozoic Karakaya complex and related ophiolites in northwestern Turkey by Palaeotethyan subduction-accretion. Journal of the Geology Society, London, 153, 995-1009.
Pickett, E.A., and Robertson, A.H.F., 2004. Significance of the volcanogenic Nilüfer unit and related components of the Triassic Karakaya Complex for Tethyan Subduction/Accretion Processes in NW Turkey. Turkish Journal of Earth Sciences, 13, 97-143.
Plank, T., and Langmuir, C.H., 1993. Tracing trace elements from sediment input to volcanic output at subduction zones. Nature, 362, 739-743.
Plank, T., and Langmuir, C.H., 1998. The chemical composition of subducting sediment and its consequences for the crust and mantle. Chemical Geology, 145, 325-394.
Raymond, L.A., 1984. Classification of melanges. In: Raymond, L.A. (ed.), Melanges: Their nature, origin, and significance: Geological Society of America, Special Paper, 198, 7-20.
Rhodes, J.M., 1995. The 1852 and 1968 Mauna Loa picrite eruptions: clues to parental magma compositions and the magmatic plumbing system. AGU, Geophysical Monographs, 92, 241-262.
Robertson, A.H.F., 2002. Overview of the genesis and emplacement of Mesozoic ophiolites in the Eastern Mediterranean Tethyan region. Lithos, 65, 1-67.
Robertson, A.H.F., Ustaömer, T., Pickett, E., Collins, A., Andrew, T., and Dixon, J.E., 2004. Testing models of Late Palaeozoic-Early Mesozoic orogeny in Western Turkey: support for an evolving open-Tethys model. Journal of the Geology Society, London, 161, 501-511.
173
Rojay, B., and Göncüoğlu, M.C., 1997. Tectonic setting of some pre-Liassic low grade metamorphics in northern Anatolia. Yerbilimleri, 19, 109-118.
Saha, A., Basu, A.R., Wakabayashi, J., and Wortman, G.L., 2005. Geochemical evidence for a subducted infant arc in Franciscan high-grade-metamorphic tectonic blocks. Geological Society of America Bulletin, 117, 1318-1335.
Salters, V.J.M., and Hart, S.R., 1991. The mantle sources of ocean ridges, islands and arcs: the Hf-isotope connection. Earth and Planetary Science Letters, 104, 364-380.
Salters, V.J.M., and White, W.M., 1998. Hf constraints on mantle evolution. Chemical Geology, 145, 447-460.
Sayıt, K., and Göncüoğlu, M.C., 2009a. Geochemistry of mafic rocks of the Karakaya Complex, Turkey: Evidence for plume-involvement in the extensional oceanic regime during Middle-Late Triassic. International Journal of Earth Sciences, 98, 367-385.
Sayıt, K., and Göncüoğlu, M.C., 2009b. Geochemical characteristics of the basic volcanic rocks within the Karakaya Complex: A review. Yerbilimleri, 30, 181-191.
Sayıt K., Göncüoglu, M.C., and Furman, T., 2008. E-MORB- and OIB-Type Metabasalts From The Karakaya Complex: Trace Element Evidence For Melting Across The Spinel-Garnet Transition. Eos Transactions AGU, 89(53), Fall Meeting Supplement, Abstract V43B-2163.
Sayıt, K., Göncüoğlu, M.C., and Furman, T., 2009. Relict Seamounts within the Palaeotethyan Karakaya Complex, Turkey. Eos Transactions AGU, 90(52), Fall Meeting Supplement, Abstract V51C-1706.
Schilling, J.-G., Hanan, B.B., McCully, B., Kingsley, R.H., and Fontignie, D., 1994. Influence of the Sierra Leone mantle plume on the equatorial Mid-Atlantic Ridge: A Nd-Sr-Pb isotopic study. Journal of Geophysical Research, 99, 12005-12028.
Shaw, D.M., 1970. Trace element fractionation during anatexis. Geochimica at Cosmochimica Acta, 34, 237-243.
Sinton, J.M., Ford, L.L., Chappell, B., and McCulloch, M.T., 2003. Magma genesis and mantle heterogeneity in the Manus Back-Arc Basin, Papua New Guinea. Journal of Petrology, 44, 159-195.
174
Stampfli, G.M., 2000. Tethyan oceans. In: Bozkurt, E., Winchester, J., Piper, J.A. (eds.), Tectonics and magmatism in Turkey and the Surrounding Area. Geological Society, London, Special Publications, 173, 1-23.
Stampfli, G.M., Mosar, J., Favre, P., Pillevuit, A., and Vannay, J.-C., 2001. Permo-Mesozoic evolution of the western Tethyan realm: the Neotethys/East-Mediterranean connection. In: Ziegler, P.A., Cavazza, W., Robertson, A.H.F., and Crasquin-Soleau, S. (eds.), PeriTethys Memoir 6: Peritethyan Rift/wrench Basins and Passive Margins, IGCP 369. Memoirs du Museum National d’Historie Naturelle, 186, 51-108.
Stampfli, G.M., and Borel, G.D., 2002. A plate tectonic model for the Paleozoic and Mesozoic constrained by dynamic plate boundaries and restored synthetic oceanic isochrons. Earth and Planetary Science Letters, 196, 17-33.
Staudigel, H., Davies, G.R., Hart, S.R., Marchant, K.M., and Smith, B.M., 1995. Large scale isotopic Sr, Nd and O isotopic anatomy of altered oceanic crust: DSDP/ODP sites 417/418. Earth and Planateray Science Letters, 130, 169-185.
Stern, R.J., Kohut, E., Bloomer, S.H., Leybourne, M., Fouch, M., and Vervoort, J., 2006. Subduction factory processes beneath the Guguan cross-chain, Mariana Arc: no role for sediments, are serpentinites important? Contributions to Mineralogy and Petrology, 151, 202-221.
Stracke, A., Hofmann, A.W., and Hart, S.R., 2005. FOZO, HIMU, and the rest of the mantle zoo. Geochemistry Geophysics Geosystems, 6, Q05007, doi: 10.1029/2004GC000824.
Su, Y., and Langmuir, C.H., 2003. Global MORB chemistry compilation at the segment scale, PhD Thesis, Department of Earth and Environmental Sciences, Columbia University.
Sun, S.S., and McDonough, W.F., 1989. Chemical and isotopic systematics of oceanic basalts: implications for mantle composition and processes. In: Saunders, A.D., and Norry, M.J., (eds) Magmatism in the Ocean Basins. Geological Society, London, Special Publications, 42, 313-345.
Şengör, A.M.C., 2003. The repeated discovery of melanges and its implications for the possibility and the role of objective evidence in the scientific enterprise. Geological Society of America, Special Paper, 373, 385-445.
175
Şengör, A.M.C., and Yılmaz, Y., 1981. Tethyan Evolution of Turkey: a plate tectonics approach. Tectonophysics, 75, 181-241.
Şengör, A.M.C., Yılmaz, Y., and Ketin, İ., 1980. Remnants of a pre-Late Jurassic ocean in northern Turkey: Fragments of Permian-Triassic Paleo-Tethys. Geological Society of America Bulletin, 91, 599-609.
Şengör, A.M.C., Yılmaz, Y., and Sungurlu, O., 1984. Tectonics of the Mediterranean Cimmerides: nature and evolution of the western termination of Paleo-Tethys. In: Dixon, J.E., Robertson, A.H.F. (eds.), The Geological Evolution of the Eastern Mediterranean. Geological Society, London, Special Publications, 17, 77-112.
Taylor, S.R., and McLennan, S.M., 1995. The geochemical evolution of continental crust. Reviews of Geophysics, 33, 241-265.
Thirlwall, M.F., 2002. Multicollector ICP-MS analysis of Pb isotopes using a 207Pb-204Pb double spike demonstrates up to 400 ppm/amu systematic errors in Tl-normalization. Chemical Geology, 184, 255-279.
Todt, W., Cliff, R.A., Hanser, A., and Hofmann, A.W., 1996. Evaluation of a 202Pb-205Pb double spike for high precision lead isotope analysis. In: Basu, A., and Hart, S. (eds.) Earth Processes: Reading the Isotopic Code. American Geophysical Union, 429-437.
Topuz, G., Altherr, R., Satır, M., and Schwarz, W.H., 2004. Low-grade metamorphic rocks from the Pulur complex, NE Turkey: implications for the pre-Liassic evolution of Eastern Pontides. International Journal of Earth Sciences, 93, 72-91.
Turhan, N., Okuyucu, C., and Göncüoğlu, M.C., 2004. Autochthonous Upper Permian (Midian) carbonates in the Western Sakarya Composite Terrane, Geyve Area, Turkey: Preliminary data. Turkish Journal of Earth Sciences, 13, 215-229.
Türkecan, A., and Yurtsever, A., 2002. 1/500000 ölçekli Türkiye Jeoloji Haritaları, İstanbul paftası, MTA yayınları, Ankara.
176
Ustaömer, T., and Robertson, A.H.F., 1994. Late Paleozoic marginal basin and subduction-accretion: the Paleotethyan Küre Complex, Central Pontides, northern Turkey. Journal of the Geology Society, London, 151, 291-305.
Ustaömer, T., and Robertson, A.H.F., 1999. Geochemical evidence used to test alternative plate tectonic models for the pre-Upper Jurassic (Palaeotethyan) units in the Central Pontides, N Turkey. Geological Journal, 34, 25-53.
Ünalan, G., Yüksel, V., Tekeli, T., Gönenç, O., Seyirt, Z., and Hüseyin, S., 1976. Haymana-Polatlı yöresinin (GB Ankara) Üst Kretase-Alt Tersiyer stratigrafisi ve paleocoğrafik evrimi. TJK Bülteni, 19/2, 159-176.
Weaver, B.L., Wood, D.A., Tarney, J., and Joron, J.L., 1987. Geochemistry of ocean island basalts from the South Atlantic: Ascension, Bouvet, St. Helena, Gough and Tristan da Cunha. In: Fitton, J.G., and Upton, B.G.J. (eds) Alkaline Igneous Rocks. Geological Society, London, Special Publications, 30, 253-267.
Weaver, B.L., Wood, D.A., Tarney, J., and Joron, J.L., 1986. Role of subducted sediment in the genesis of ocean-island basalts: Geochemical evidence from South Atlantic Ocean islands. Geology, 14, 275-278.
White, W. M., Albarède, F., and Télouk, P., 2000. High-precision analysis of Pb isotope ratios by multi-collector ICP-MS. Chemical Geology, 167, 257-270.
Wiedmann, J., Kozur, H., and Kaya, O., 1992. Faunas and age significance of the pre-Jurassic turbidite-olistostrome unit in the western parts of Turkey. Newsletter for Stratigraphy, 26, 133-144.
Winchester, J.A., and Floyd, P.A., 1977. Geochemical discrimination of different magma series and their differentiation products using immobile elements. Chemical Geology, 20, 325-343.
Wood, D.A., Gibson, I.L., and Thompson, R.N., 1976. Elemental mobility during zeolite facies metamorphism of the Tertiary basalts of eastern Iceland. Contributions to Mineralogy and Petrology, 55, 241-254.
Woodhead, J., Eggins, S., and Gamble, J., 1993. High field strength and transition element systematics in island arc and back-arc basin basalts: evidence for multi-phase melt extraction and a depleted mantle wedge. Earth and Planetary Science Letters, 114, 491-504.
177
Woodhead, J.D., Eggins, S.M., and Johnson, R.W., 1998. Magma genesis in the New Britain Island Arc: further insights into melting and mass transfer processes. Journal of Petrology, 39, 1641-1668.
Woodhead, J.D., Hergt, J.M., Davidson, J.P., and Eggins, S.M., 2001. Hafnium isotope evidence for “conservative” element mobility during subduction zone processes. Earth and Planetary Science Letters, 192, 331-346.
Workman, R.K., and Hart, S.R., 2005. Major and trace element composition of the depleted MORB mantle (DMM). Earth and Planetary Science Letters, 231, 53-72.
Workman, R.K., Hart, S.R., Jackson, M., Regelous, M., Farley, K.A., Blusztajn, J., Kurz, M., and Staudigel, H., 2004. Recycled metasomatized lithosphere as the origin of the Enriched Mantle II (EM2) end-member: Evidence from the Samoan Volcanic Chain. Geochemistry Geophysics Geosystems, 5, Q04008, doi: 10.1029/2003GC000623.
Yalınız, M.K., and Göncüoğlu, M.C., 2002. Geochemistry and petrology of “Nilüfer-type” metabasic rocks of eastern Kozak Massif, NW Turkey. 1. International Symposium of Istanbul Technical University, The Faculty of Mines on Earth Sciences and Engineering, Istanbul, Abstracts, pp 158.
Yılmaz, Y., 1981. Sakarya kıtası güney kenarının tektonik evrimi. İstanbul Yerbilimleri, 1, 33-52.
Yılmaz, Y., Serdar, H.S., Genç C., Yiğitbaş, E., Gürer Ö.F., Elmas, A., Yıldırım, M., Bozcu, M., and Gürpınar, O., 1997. The Geology and Evolution of the Tokat Massif, South Central Pontides, Turkey. International Geology Review, 39, 365-382.
Zindler, A., and Hart, S., 1986. Chemical Geodynamics. Annual Review of Earth and Planetary Science, 14, 493-571.
178
APPENDIX A
INFORMATION REGARDING THE STUDY AREAS
In Central Anatolia, the first part of the study area is located in İmrahor village; 5
km southeast of Ankara. This area covers an area of approximately 4 km2 and it is
included in the Ankara I29-b2 and I29-b3 quadrangles of 1:25000 topographic map
of Turkey lying between the coordinates of 39°52’00’’ - 39°53’30’’ N latitudes and
32°52’30’’ - 32°55’00’’ E longitudes. The main hills in the study area are Çanakcı
Hill in the north and Kocakaya Hill in the south.
The second part comprises Üreğil, Zerdalitepe and Kusunlar, which are located
about 9 km and 11 km southeast of Ankara, respectively. This part covers an area
of approximately 14 km2 and it is included in the Ankara I29-b2 quadrangles of
1:25000 topographic map of Turkey lying between the coordinates of 39°52’30’’ -
39°55’30’’ N latitudes and 32°55’30’’ - 33°00’00’’ E longitudes. The main hills in
the study area are Yumru Hill to the west, Tarla Hill in the south and Hanyeri Hill
in the west.
The third part of the study area consists of Bayındır, Ortaköy, Gökçeyurt and
Lalahan; located about 10 km and 13 km east of, and 16 and 19 km east of Ankara,
respectively. This study area covers approximately 25 km2 and it is included in the
Ankara I29-b2 and Kırşehir I30-a1 quadrangles of 1:25000 topographic maps of
Turkey lying between the coordinates of 39°54’30’’ - 39°58’30’’ N latitudes and
33°00’00’’ - 33°07’30’’ E longitudes. The highest peaks in the study area are the
Mıhlı and Yaylabaşı Hills in the west, the Yayla Hill to the north and the Deliömer
Hill in the east.
179
The fourth part of the study area includes Hasanoğlan, Kavaklı, Doğanoluk,
Çardakbağı, and Bozca, which are located about 10 km, 16 km, 19 km, 21 km and
30 km northeast of Ankara, respectively. This study area covers approximately 30
km2 and it is included in the Ankara H30-d3 and H30-d4 quadrangles of 1:25000
topographic map of Turkey lying between the coordinates of 40°00’00’’ -
40°05’30’’ N latitudes and 33°05’00’’ - 33°14’00’’ E longitudes. The main hills in
the study area are Yenibağ Hill in the southwest, Gölbaşı and Keçikıran Hills to the
east and Dedekaya Hill in the southeast.
The fifth part comprises Hacılar (Çubuk) which is located 24 km southwest of
Ankara. This study area covers about 2 km2, and included in the Ankara I29-a3
quadrangles of 1:25000 topographic map of Turkey lying between the coordinates
of 39°45’55’’ - 39°46’13’’ N latitudes and 32°42’30’’ - 32°43’00’’ E longitudes.
The highest peak in the area is the Hacılar Hill in the west.
The sixth part of the study area comprises Eymir and Karataş, located 13 km and
15 km southwest of Ankara. It covers an area of approximately 25 km2 and it is
included in the Ankara I29-b4 quadrangles of 1:25000 topographic map of Turkey
lying between the coordinates of 39°47’00’’ - 39°51’00’’ N latitudes and
32°48’30’’ - 32°52’30’’ E longitudes. The highest peaks are Taşlık Hill in the
southwest and Tandıroğlu Hill in the north.
The final part of the study area in Central Anatolia includes Hacılar (Çubuk) which
is located 55 km northeast of Ankara. It occupies an area of approximately 3 km2
and it is included in the Ankara H30-a1 quadrangles of 1:25000 topographic map
of Turkey lying between the coordinates of 40°25’00’’ - 40°26’00’’ N latitudes and
33°02’00’’ - 33°03’30’’ E longitudes. The main hills in the study area are Beytaşı
Hill in the north, Taşlıkıran Hill in the west, and Alanbaşı Hill in the south.
In the Central Sakarya region, the studied region includes Karaçobanpınarı,
Alpagut, Laçin and Emremsultan. It covers an area of approximately 700 km2 and
it is included in the Ankara H25-c3,c4, H25-d3,d4, H26-c3,c4, H26-d3,d4
quadrangles of 1:25000 topographic map of Turkey lying between the coordinates
180
of 40°00’30’’ - 40°10’30’’ N latitudes and 30°23’30’’ - 31°24’30’’ E longitudes.
The highest peaks are the Dededoruğu Hill to the west, Top Hill in the near-central
part and Çalkaya Hill to the east.
In NW Anatolia, the first part of the study area consists of Sipali, Bahçecik, and
Subaşı, which are located 43 km, 57 km and 50 km northeast-southeast of Bursa. It
occupies an area of approximately 20 km2, and it is included in the Bursa H23-d2
quadrangles of 1:25000 topographic map of Turkey lying between the coordinates
of 40°05’30’’ - 40°13’40’’ N latitudes and 29°34’30’’ - 29°45’00’’ E longitudes.
Main hills in the study area are Asarlık Hill to the southeast, Kocadüz Hill in the
south and Kaplıkaya Hill to the north. The second part the study area is around
Nilüfer Valley (the Doğancı Dam) which is located 12 km southwest of Bursa. It
occupies an area of approximately 15 km2, and it is included in the Bursa H21-
c2,c3 quadrangles of 1:25000 topographic map of Turkey lying between the
coordinates of 40°03’30’’ - 40°09’30’’ N latitudes and 28°56’00’’ - 28°59’30’’ E
longitudes. Main hills in the study area are Akbaba Hill to the north, Babasultan
Hill in the west, and Pırnallıkaya Hill to the south.
Surname, Name: Sayıt, Kaan Nationality: Turkish (TC) Date and Place of Birth: 14 December 1981, Ankara Marital Status: Single Phone: +90312 2105735 Fax: +90312 2105750 e-mail: [email protected]
EDUCATION
Degree Institution Year of Graduation MS METU Geological Engineering 2005 BS METU Geological Engineering 2003 High School Ankara Cumhuriyet High School 1998
WORK EXPERIENCE Year Place Enrollment 2010 Aegir Ridge, North Atlantic Ocean Shipboard Scientist 2009 San Diego State University Project Member 2007-2008 Pennsylvania State University Research Scholar 2004-present METU Geological Engineering Teaching Assistant
FOREIGN LANGUAGES Fluent English
PUBLICATIONS
1. Sayıt, K., Göncüoğlu, M.C. and Furman, T. Petrological reconstruction of Triassic seamounts/oceanic islands within the Palaeotethys: Geochemical implications from the Karakaya Subduction/Accretion Complex, Northern Turkey (in review, submitted to Lithos).
2. Catlos, E.J., Sayıt, K., Sivasubramanian, P., and Dubey, C.S., 2010. Geochemical and geochronological data from charnockites and anorthosites from India's Kodaikanal-Palani Massif, Southern Granulite Terrain, India. (accepted, submitted to Bose volume titled "Topics in Igneous Petrology: a tribute to Prof. Mihir K. Bose" to be published by Springer)
3. Göncüoğlu, M.C., Sayıt, K., and Tekin, U.K. 2010. Oceanization of the northern Neotethys: Geochemical evidence from ophiolitic melange basalts within the İzmir-Ankara suture belt, NW Turkey. Lithos, 116, 175-187.
191
4. Sayıt, K. and Göncüoğlu, M.C., 2009. Geochemical characteristics of the basic volcanic rocks within the Karakaya Complex: A review. Yerbilimleri, 30, 181-191 (In Turkish with English abstract).
5. Sayıt, K. and Göncüoğlu, M.C., 2009. Geochemistry of mafic rocks of the Karakaya Complex, Turkey: Evidence for plume-involvement in the extensional oceanic regime during Middle-Late Triassic. International Journal of Earth Sciences, 98, 367-385.