Energy 25 (2000) 427–443 www.elsevier.com/locate/energy A risk based heat exchanger analysis subject to fouling Part I: Performance evaluation Syed M. Zubair * , Anwar K. Sheikh, Muhammad Younas, M.O. Budair Department of Mechanical Engineering, King Fahd University of Petroleum & Minerals, Dhahran 31261, Saudi Arabia Abstract Heat exchangers operating in the power and process industries are fouled to a greater or lesser extent depending on surface temperature, surface condition, material of construction, fluid velocity, flow geometry and fluid composition. This fouling phenomenon is time-dependent and will result in a decrease in the thermal effectiveness of a heat exchanger. Once the thermal effectiveness decreases to a minimum accept- able level, cleaning of the equipment becomes necessary to restore the performance. In this paper, we present a simple probabilistic approach to characterize various fouling models that are commonly encoun- tered in many industrial processes. These random fouling growth models are then used to investigate the impact on risk-based thermal effectiveness, overall heat-transfer coefficient and the hot- and cold-fluid outlet temperatures of a shell-and-tube heat exchanger. All the results are presented in a generalized form in order to demonstrate the generality of the risk-based procedure discussed in this paper. 2000 Elsevier Science Ltd. All rights reserved. 1. Introduction Heat exchangers are extensively used in the power and process industries to transfer heat from one fluid stream to another. The thermal–hydraulic performance of these heat exchangers decreases continuously with time due to fouling, which is defined as the formation of deposits on heat transfer equipment (HTE). These deposits may be due to sedimentation, crystallization, organic or biological growths, corrosion products, or a combination of these effects [1–5]. In addition, where the heat flux is relatively high, as in steam generators, fouling can lead to local hot spots and ultimately may result in mechanical failure of HTE, and hence an unscheduled shutdown of the plant. This may result in both economic and human loss, particularly in refineries and thermal power plants. It is also important to mention that the designers and operators of HTE * Corresponding author. Tel.: + 966-3-860-2540; fax: 966-3-860-2949. E-mail address: [email protected](S.M. Zubair). 0360-5442/00/$ - see front matter 2000 Elsevier Science Ltd. All rights reserved. PII:S0360-5442(99)00080-8
Transcript
Energy 25 (2000) 427–443www.elsevier.com/locate/energy
A risk based heat exchanger analysis subject to foulingPart I: Performance evaluation
Syed M. Zubair*, Anwar K. Sheikh, Muhammad Younas, M.O. BudairDepartment of Mechanical Engineering, King Fahd University of Petroleum & Minerals, Dhahran 31261, Saudi
Arabia
Abstract
Heat exchangers operating in the power and process industries are fouled to a greater or lesser extentdepending on surface temperature, surface condition, material of construction, fluid velocity, flow geometryand fluid composition. This fouling phenomenon is time-dependent and will result in a decrease in thethermal effectiveness of a heat exchanger. Once the thermal effectiveness decreases to a minimum accept-able level, cleaning of the equipment becomes necessary to restore the performance. In this paper, wepresent a simple probabilistic approach to characterize various fouling models that are commonly encoun-tered in many industrial processes. These random fouling growth models are then used to investigate theimpact on risk-based thermal effectiveness, overall heat-transfer coefficient and the hot- and cold-fluidoutlet temperatures of a shell-and-tube heat exchanger. All the results are presented in a generalized formin order to demonstrate the generality of the risk-based procedure discussed in this paper. 2000 ElsevierScience Ltd. All rights reserved.
1. Introduction
Heat exchangers are extensively used in the power and process industries to transfer heat fromone fluid stream to another. The thermal–hydraulic performance of these heat exchangersdecreases continuously with time due to fouling, which is defined as the formation of depositson heat transfer equipment (HTE). These deposits may be due to sedimentation, crystallization,organic or biological growths, corrosion products, or a combination of these effects [1–5]. Inaddition, where the heat flux is relatively high, as in steam generators, fouling can lead to localhot spots and ultimately may result in mechanical failure of HTE, and hence an unscheduledshutdown of the plant. This may result in both economic and human loss, particularly in refineriesand thermal power plants. It is also important to mention that the designers and operators of HTE
0360-5442/00/$ - see front matter 2000 Elsevier Science Ltd. All rights reserved.PII: S0360-5442(99)00080-8
428 S.M. Zubair et al. / Energy 25 (2000) 427–443
Nomenclature
A heat transfer area (m2)C fluid capacitance rate (W K21)Cr fluid capacitance ratio (Cr=Cmin/Cmax)f probability density function (h21)HTE heat transfer equipmentDH enthalpy change (J)M median time (h)m mass flow rate (kg h21)n number of shell passesNTU number of transfer units (NTU=UA/Cmin)P probabilityp risk levelQ heat transfer rate (W)Rf fouling resistance (m2 K W21)Rf,c critical fouling resistance (m2 K W21)T temperature (K)t time (h)tC time constant (h21)U overall heat-transfer coefficient (W m22 K 21)
Greek symbols
√a scatter in timee heat exchanger effectivenessF() cumulative normal distribution functionf rate of deposition or removal (m2 K J21)
Subscripts
C clean conditionc cold fluidc,i cold-fluid inletc,o cold-fluid outletd depositionF fouled conditionf foulingh hot fluidh,i hot-fluid inleth,o hot-fluid outlet
429S.M. Zubair et al. / Energy 25 (2000) 427–443
max maximummin minimumr removal
Superscripts
∗ asymptotic valuen exponent for the power-law model
must be able to predict performance variations as the fouling proceeds. The designer needs thisinformation to ensure that the user requirements with regard to preventive maintenance schedulescan be met, while the user of HTE must be able to formulate rational operating schedules forequipment-management purposes.
To answer some of the questions of the designers and operators of HTE, a project is beingcarried out at the King Fahd University of Petroleum and Minerals, Dhahran. One of the majorobjectives of the project is to provide a risk-based mathematical structure to the heat exchangerfouling problem and then discuss rational maintenance and/or replacement strategies to reducethe overall maintenance and operating costs of heat exchangers subject to fouling. In this paper,we present a risk-based (or probabilistic) approach to the analysis of fouling models and thendescribe its impact on the thermal performance of heat exchangers.
2. Fouling growth models
The most widely accepted fouling model is based on the following general material balanceequation first proposed by Kern and Seaton [6]:
dRf(t)dt
5fd2fr. (1)
It should be noted that the rate of fouling deposition,fd, depends on the type of fouling mechanism(sedimentation, crystallization, organic material growth, etc.), while the rate of fouling removal,fr, depends on both the hardness or adhesive strength of the deposit and the shear stress due tothe flow velocity, as well as the system configuration. The rates of deposition and removal havebeen given many different forms (depending upon the type and mechanism of fouling) by variousinvestigators. This time-dependent behavior of the fouling process can be characterized by anumber of fouling models proposed in the literature [1,2,5–8]. These models are the linear, power-law, falling-rate and asymptotic fouling growth models and are discussed by Zubair et al. [9,10]and Sheikh et al. [11]. The different models result from the large number of uncertainties associa-ted with the fouling growth process, particularly when considering actual heat exchanger appli-cations. Zubair et al. [9,10] and Sheikh et al. [11] have demonstrated that these models are proba-bilistic in nature. In particular, the distribution of fouling resistance of heat exchanger tubes withrespect to time characterizes these random processes. They have shown that there is a considerable
430 S.M. Zubair et al. / Energy 25 (2000) 427–443
scatter inRf(t) at any timet and, similarly, for any fixed value ofRf, there is a correspondingscatter in the values oft. Sheikh et al. [11] have also demonstrated that for a fixed risk levelp=P(Rf(t)#Rf,c), whereRf,c is the critical acceptable value of fouling resistance, the time to reachthis critical value will be distributed as an alpha distribution for a linear fouling growth model,i.e., whenRf(t) is a linear function of time. It is important to mention that the probability distri-bution function has two main indicators, namely the median time,M, to reach the critical levelof fouling [i.e., p=0.50=P(Rf(t)#Rf,c)] and a scatter in the growth rate of the fouling processdescribed by a scatter parameter√a. As will be demonstrated in the following sections, thesetwo parameters have a significant impact on the thermal performance of heat exchangers.
2.1. Linear fouling model
Linear fouling behavior is generally associated with the crystallization of a well-formed depositconsisting of a substantially pure salt that is largely uncontaminated by the presence of co-precipi-tated impurities. The strong bonds characterizing the structure of such deposits prevent significantremoval rates. This hypothesis, initially proposed by Taborek et al. [1], was further supported bythe experimental work of Hasson et al. [12], Andritsos et al. [13] and Zubair et al. [14] whileinvestigating the mechanism of CaCO3 scale growth in laboratory experiments.
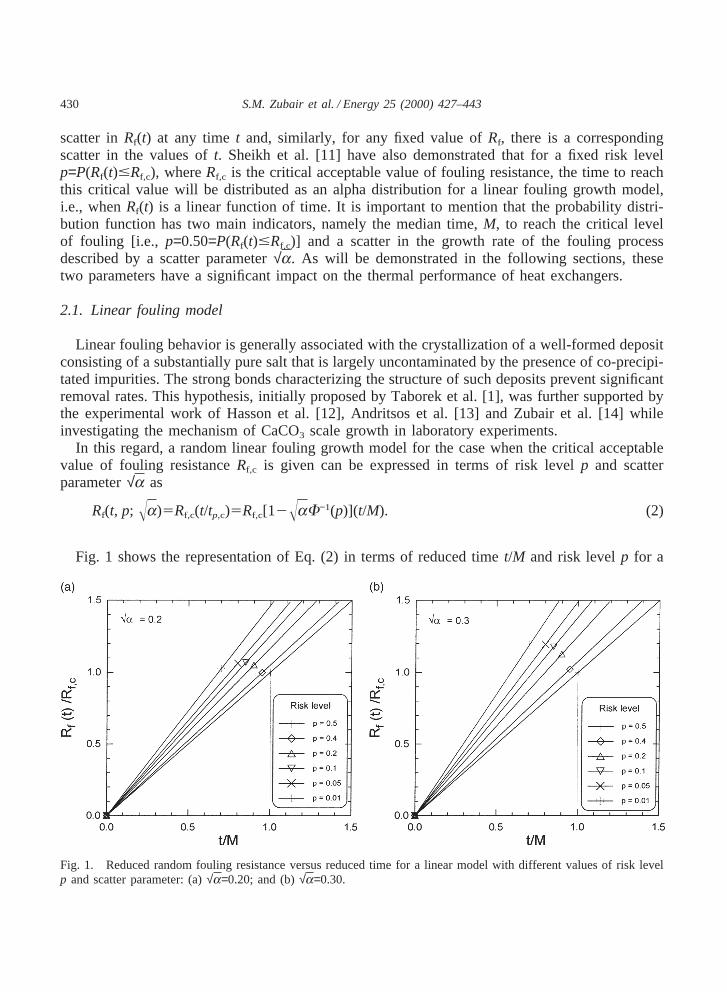
In this regard, a random linear fouling growth model for the case when the critical acceptablevalue of fouling resistanceRf,c is given can be expressed in terms of risk levelp and scatterparameter√a as
Fig. 1 shows the representation of Eq. (2) in terms of reduced timet/M and risk levelp for a
Fig. 1. Reduced random fouling resistance versus reduced time for a linear model with different values of risk levelp and scatter parameter: (a)√a=0.20; and (b)√a=0.30.
431S.M. Zubair et al. / Energy 25 (2000) 427–443
given scatter parameter√a. Fig. 1(a) is for√a=0.20, while Fig. 1(b) is for√a=0.30. It can beseen from these figures that for a low risk level, for example whenp=0.01 (i.e., 99% reliability),the time to reach the critical level of fouling is much smaller than for the deterministic case (i.e.,p=0.50). As expected, Fig. 1(b) shows somewhat more scatter and that an even smaller time isrequired to reach the critical value at a given risk level compared with Fig. 1(a).
2.2. Power-law fouling model
The power-law fouling growth mechanism has been observed by Khan et al. [15] whileinvestigating the deposition of CaCO3 under relatively high operating temperatures. Sheikh et al.[11] have also shown that replicate corrosion fouling data of Somerscales and Kassemi [16] canbe represented by a power-law model.
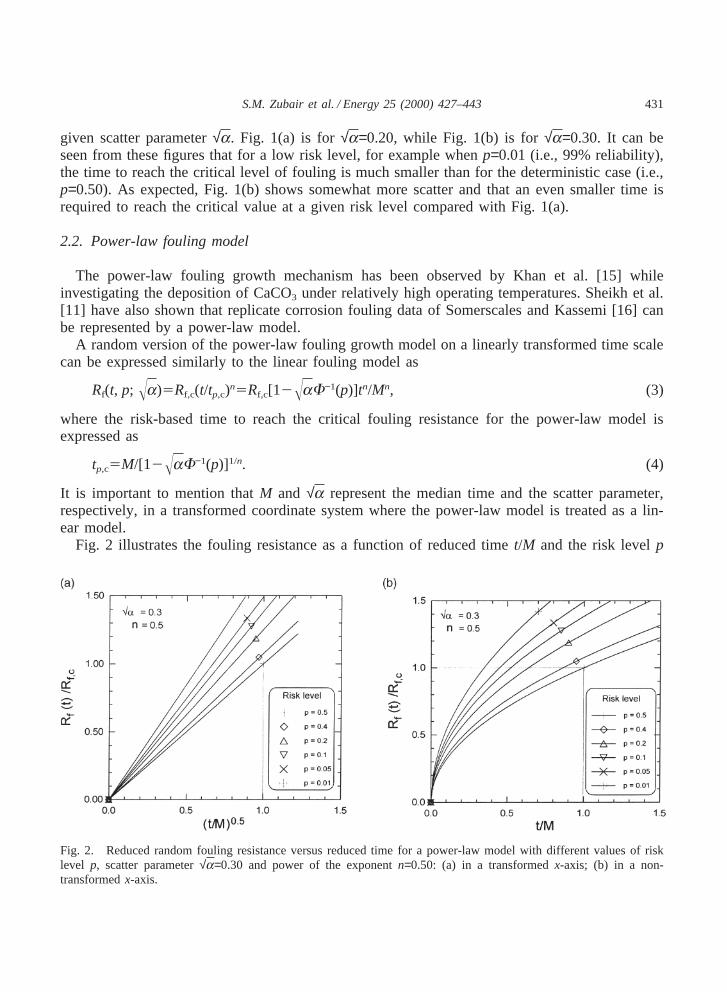
A random version of the power-law fouling growth model on a linearly transformed time scalecan be expressed similarly to the linear fouling model as
where the risk-based time to reach the critical fouling resistance for the power-law model isexpressed as
tp,c5M/[12ÎaF−1(p)]1/n. (4)
It is important to mention thatM and √a represent the median time and the scatter parameter,respectively, in a transformed coordinate system where the power-law model is treated as a lin-ear model.
Fig. 2 illustrates the fouling resistance as a function of reduced timet/M and the risk levelp
Fig. 2. Reduced random fouling resistance versus reduced time for a power-law model with different values of risklevel p, scatter parameter√a=0.30 and power of the exponentn=0.50: (a) in a transformedx-axis; (b) in a non-transformedx-axis.
432 S.M. Zubair et al. / Energy 25 (2000) 427–443
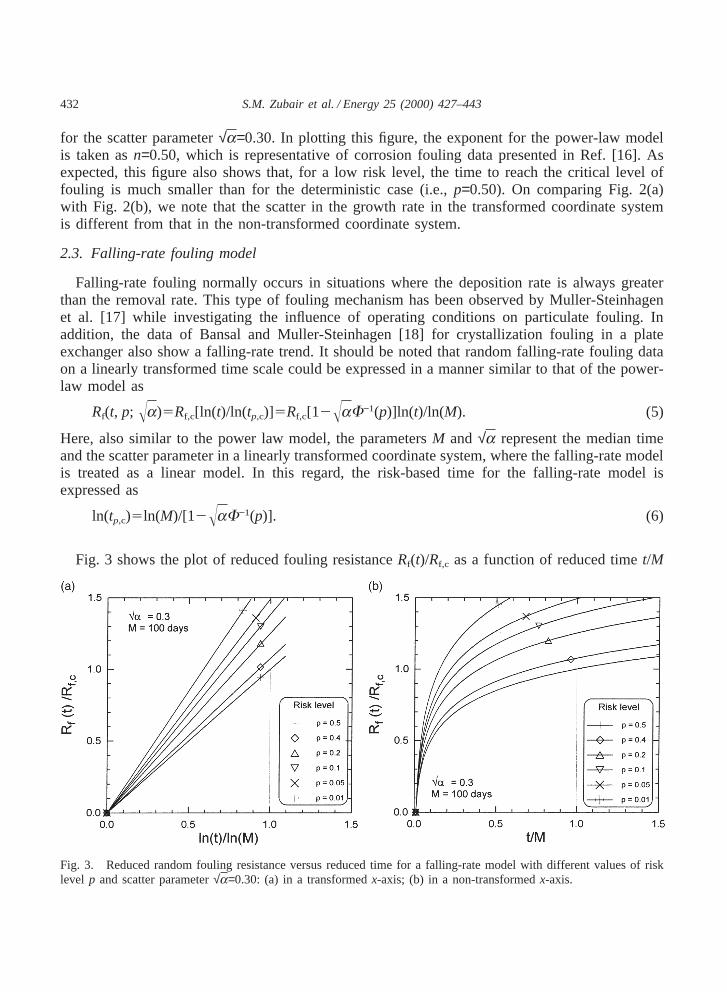
for the scatter parameter√a=0.30. In plotting this figure, the exponent for the power-law modelis taken asn=0.50, which is representative of corrosion fouling data presented in Ref. [16]. Asexpected, this figure also shows that, for a low risk level, the time to reach the critical level offouling is much smaller than for the deterministic case (i.e.,p=0.50). On comparing Fig. 2(a)with Fig. 2(b), we note that the scatter in the growth rate in the transformed coordinate systemis different from that in the non-transformed coordinate system.
2.3. Falling-rate fouling model
Falling-rate fouling normally occurs in situations where the deposition rate is always greaterthan the removal rate. This type of fouling mechanism has been observed by Muller-Steinhagenet al. [17] while investigating the influence of operating conditions on particulate fouling. Inaddition, the data of Bansal and Muller-Steinhagen [18] for crystallization fouling in a plateexchanger also show a falling-rate trend. It should be noted that random falling-rate fouling dataon a linearly transformed time scale could be expressed in a manner similar to that of the power-law model as
Here, also similar to the power law model, the parametersM and √a represent the median timeand the scatter parameter in a linearly transformed coordinate system, where the falling-rate modelis treated as a linear model. In this regard, the risk-based time for the falling-rate model isexpressed as
ln(tp,c)5ln(M)/[12ÎaF−1(p)]. (6)
Fig. 3 shows the plot of reduced fouling resistanceRf(t)/Rf,c as a function of reduced timet/M
Fig. 3. Reduced random fouling resistance versus reduced time for a falling-rate model with different values of risklevel p and scatter parameter√a=0.30: (a) in a transformedx-axis; (b) in a non-transformedx-axis.
433S.M. Zubair et al. / Energy 25 (2000) 427–443
and risk levelp for the scatter parameter√a=0.30. In this figure we note again that the scatterin the fouling growth rate in the transformed coordinate system is different from that in the non-transformed coordinate system. Also, we notice that the time to reach the critical level of foulingis large for a deterministic case (p=0.50) compared with a low risk level case. For example, thereduced time to reach the critical level forp=0.10 (i.e., 90% reliability) is about 30% that of thedeterministic case.
2.4. Asymptotic fouling model
An asymptotic fouling growth model is often observed in cooling water heat exchangers. Inthese heat exchangers, the conditions leading to the formation of a scale layer of a weak, lesscoherent structure are associated with the simultaneous crystallization of salts of different crystalshapes, or with the presence of suspended particles embedded in the crystalline structure. Hasson[19] has indicated that growth of such deposits is expected to create internal stresses in the scalelayer, so that the removal processes become progressively more effective with the deposit thick-ness. Such considerations lead to an asymptotic scale thickness, at which the deposition is bal-anced by the scale removal mechanism.
The random (or probabilistic) asymptotic fouling growth model on a transformedy-axis canbe written as
ln[1/(12Rf/R∗f )]5t/tC. (7)
The above equation may be explained as a linear version of the asymptotic fouling growth model,where the time constanttC is expressed in terms of the critical acceptable value of fouling resist-anceRf,c and the time to reach this critical valuetp,c, expressed as
tC5tp,c/ln[1/(12Rf,c/R∗f )] (8)
and
tp,c5M/[12ÎaF−1(p)]. (9)
Substituting the value oftC into Eq. (7) and rearranging, we get
Rf(t, p; Îa)5R∗f [12exp{2ln[1/(12Rf,c/R∗
f )][12ÎaF−1(p)]t/M}]. (10)
Similar to the above two random fouling growth models, the parametersM and√a represent themedian time and the scatter parameter in a transformed coordinate system, where the exponentialfouling growth model may be treated as a linear model.
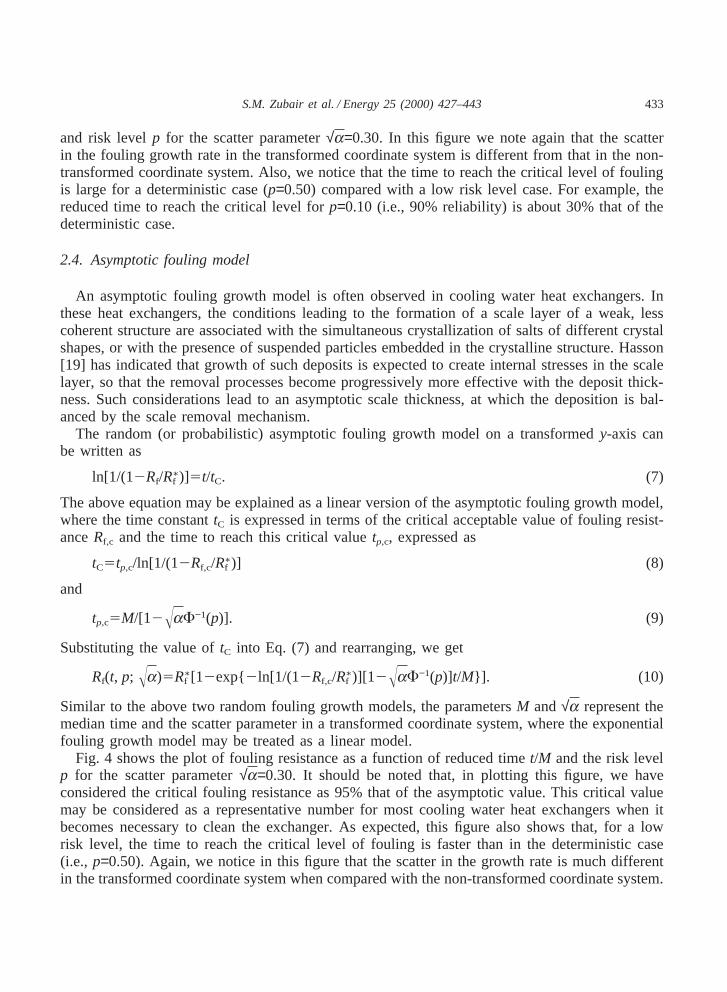
Fig. 4 shows the plot of fouling resistance as a function of reduced timet/M and the risk levelp for the scatter parameter√a=0.30. It should be noted that, in plotting this figure, we haveconsidered the critical fouling resistance as 95% that of the asymptotic value. This critical valuemay be considered as a representative number for most cooling water heat exchangers when itbecomes necessary to clean the exchanger. As expected, this figure also shows that, for a lowrisk level, the time to reach the critical level of fouling is faster than in the deterministic case(i.e., p=0.50). Again, we notice in this figure that the scatter in the growth rate is much differentin the transformed coordinate system when compared with the non-transformed coordinate system.
434 S.M. Zubair et al. / Energy 25 (2000) 427–443
Fig. 4. Reduced random fouling resistance versus reduced time for an exponential model with different values of risklevel p and scatter parameter√a=0.30: (a) in a transformedy-axis; (b) in a non-transformedy-axis.
3. Thermal performance of a heat exchanger
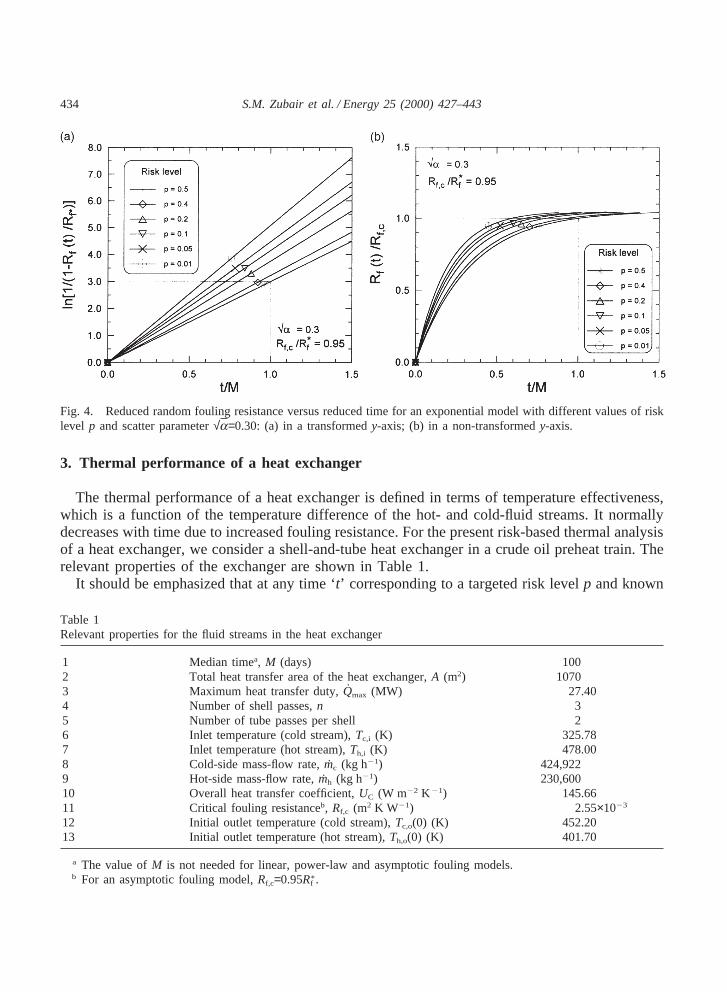
The thermal performance of a heat exchanger is defined in terms of temperature effectiveness,which is a function of the temperature difference of the hot- and cold-fluid streams. It normallydecreases with time due to increased fouling resistance. For the present risk-based thermal analysisof a heat exchanger, we consider a shell-and-tube heat exchanger in a crude oil preheat train. Therelevant properties of the exchanger are shown in Table 1.
It should be emphasized that at any time ‘t’ corresponding to a targeted risk levelp and known
Table 1Relevant properties for the fluid streams in the heat exchanger
1 Median timea, M (days) 1002 Total heat transfer area of the heat exchanger,A (m2) 10703 Maximum heat transfer duty,Qmax (MW) 27.404 Number of shell passes,n 35 Number of tube passes per shell 26 Inlet temperature (cold stream),Tc,i (K) 325.787 Inlet temperature (hot stream),Th,i (K) 478.008 Cold-side mass-flow rate,mc (kg h21) 424,9229 Hot-side mass-flow rate,mh (kg h21) 230,60010 Overall heat transfer coefficient,UC (W m22 K 21) 145.6611 Critical fouling resistanceb, Rf,c (m2 K W21) 2.55×10²³
12 Initial outlet temperature (cold stream),Tc,o(0) (K) 452.2013 Initial outlet temperature (hot stream),Th,o(0) (K) 401.70
a The value ofM is not needed for linear, power-law and asymptotic fouling models.b For an asymptotic fouling model,Rf,c=0.95R∗
f .
435S.M. Zubair et al. / Energy 25 (2000) 427–443
M and√a, the effectiveness of an exchanger with ‘n’ shell passes and 2n, 4n, 6n, etc. tube passescan be expressed as [20]
en(t, p; Îa)5Q(t, p; Îa)
Qmax
5{[1 −e1(t, p; Îa)Cr]/[1−e1(t, p; Îa)]} n−1
{[1 −e1(t, p; Îa)Cr]/[1−e1(t, p; Îa)]} n−Cr
, (11)
wheree1(t, p; √a) is the effectiveness of a heat exchanger with one shell pass and 2, 4, 6, etc.tube passes; notice thate1(0, p; √a) is the effectiveness of the heat exchanger at timet=0 whenthere is no fouling. It is given in terms of the time-dependent number of transfer units,NTU(t, p; √a), and the fluid capacitance ratio (Cr=Cmin/Cmax) as [21]
e1(t, p; Îa)52/511Cr11+exp[−NTU(t, p; Îa)(1+C2
r )1/2]
1−exp[−NTU(t, p; Îa)(1+C2r )1/2]
(11C2r )1/26. (12)
It should be noted thatCmin is related to the fluid stream which defines the maximum heat transferrate that will occur in a counter-flow heat exchanger with an infinite area. For example, when‘max’ belongs to the hot stream and ‘min’ to the cold stream, we get
Cr5Th,i−Th,o(t, p; Îa)
Tc,o(t, p; Îa)−Tc,i
. (13)
The NTU at any time ‘t’ in the above equation is given by
NTU(t; p, Îa)5U(t, p; Îa)A/Cmin, (14)
where the time- and risk-dependent overall heat-transfer coefficient can be expressed by consider-ing fouling as an additional resistance to heat transfer as
U(t; p, Îa)5UC/[11UcRf(t; p, Îa)]. (15)
U(t, p; √a) andRf(t, p; √a) are the overall heat-transfer coefficient and fouling resistance at anytime ‘t’ with an associated risk levelp and scatter parameter√a, respectively; andUC is theoverall heat transfer coefficient under clean conditions. It should also be noted that the outlet,hot- and cold-fluid temperatures are time- and risk-dependent. These temperatures can be easilyobtained by calculating their respective enthalpies from the following expression
Q(t; p, Îa)5mDH(t; p, Îa). (16)
After substitution of the hot- and cold-fluid temperatures in the Lee–Kessler equations [22], weget after some simplification [23]
Qmax5mh
en(t, p; Îa)[(a1Th,i1a2T2
h,i1a3T3h,i)2(a1Th,o1a2T2
h,o1a3T3h,o)], (17)
436 S.M. Zubair et al. / Energy 25 (2000) 427–443
where
Th,o5Th,o(t, p; Îa). (18)
a1, a2 anda3 are the constants for a fluid stream, which can be determined by using the procedurediscussed in API Data Book [22], andTh,i, Th,o are the hot-fluid inlet and outlet temperatures,respectively.
A computer program was developed by Sheikh et al. [23] as a part of a general algorithm tostudy the time- and risk-dependent heat exchanger effectiveness based on a linear random foulinggrowth model of the exchanger. This program is further extended to incorporate power-law, fall-ing-rate and asymptotic random fouling growth models in determining the heat exchanger’s effec-tiveness, as well as to study the impact of fouling on the overall heat-transfer coefficient and hot-and cold-fluid outlet temperatures.
4. Results and discussion
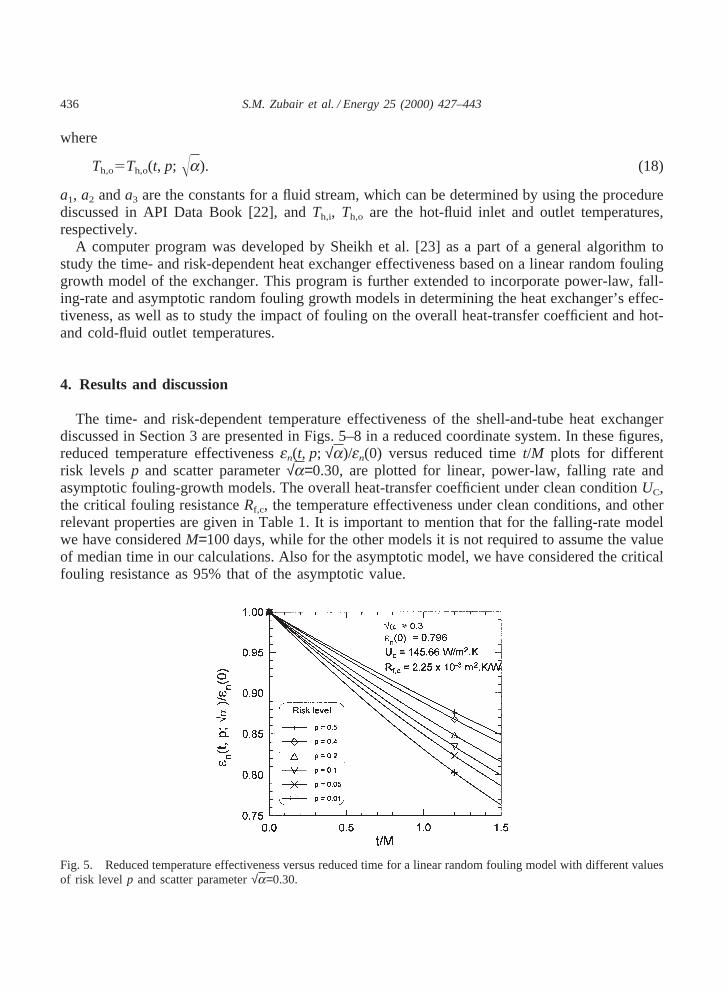
The time- and risk-dependent temperature effectiveness of the shell-and-tube heat exchangerdiscussed in Section 3 are presented in Figs. 5–8 in a reduced coordinate system. In these figures,reduced temperature effectivenessen(t, p; √a)/en(0) versus reduced timet/M plots for differentrisk levels p and scatter parameter√a=0.30, are plotted for linear, power-law, falling rate andasymptotic fouling-growth models. The overall heat-transfer coefficient under clean conditionUC,the critical fouling resistanceRf,c, the temperature effectiveness under clean conditions, and otherrelevant properties are given in Table 1. It is important to mention that for the falling-rate modelwe have consideredM=100 days, while for the other models it is not required to assume the valueof median time in our calculations. Also for the asymptotic model, we have considered the criticalfouling resistance as 95% that of the asymptotic value.
Fig. 5. Reduced temperature effectiveness versus reduced time for a linear random fouling model with different valuesof risk level p and scatter parameter√a=0.30.
437S.M. Zubair et al. / Energy 25 (2000) 427–443
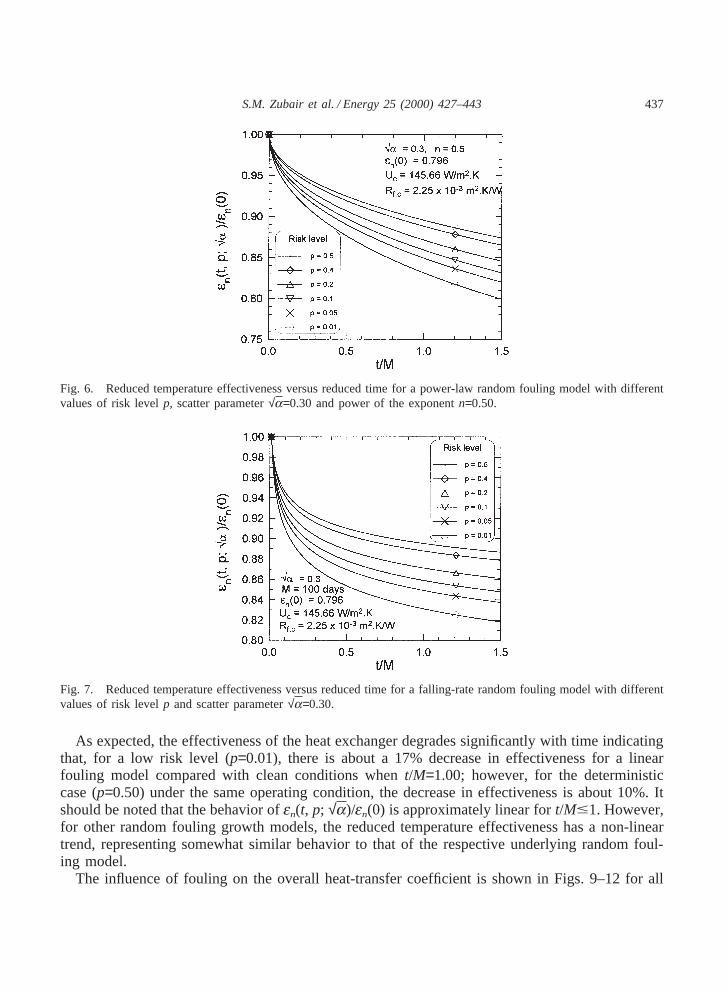
Fig. 6. Reduced temperature effectiveness versus reduced time for a power-law random fouling model with differentvalues of risk levelp, scatter parameter√a=0.30 and power of the exponentn=0.50.
Fig. 7. Reduced temperature effectiveness versus reduced time for a falling-rate random fouling model with differentvalues of risk levelp and scatter parameter√a=0.30.
As expected, the effectiveness of the heat exchanger degrades significantly with time indicatingthat, for a low risk level (p=0.01), there is about a 17% decrease in effectiveness for a linearfouling model compared with clean conditions whent/M=1.00; however, for the deterministiccase (p=0.50) under the same operating condition, the decrease in effectiveness is about 10%. Itshould be noted that the behavior ofen(t, p; √a)/en(0) is approximately linear fort/M#1. However,for other random fouling growth models, the reduced temperature effectiveness has a non-lineartrend, representing somewhat similar behavior to that of the respective underlying random foul-ing model.
The influence of fouling on the overall heat-transfer coefficient is shown in Figs. 9–12 for all
438 S.M. Zubair et al. / Energy 25 (2000) 427–443
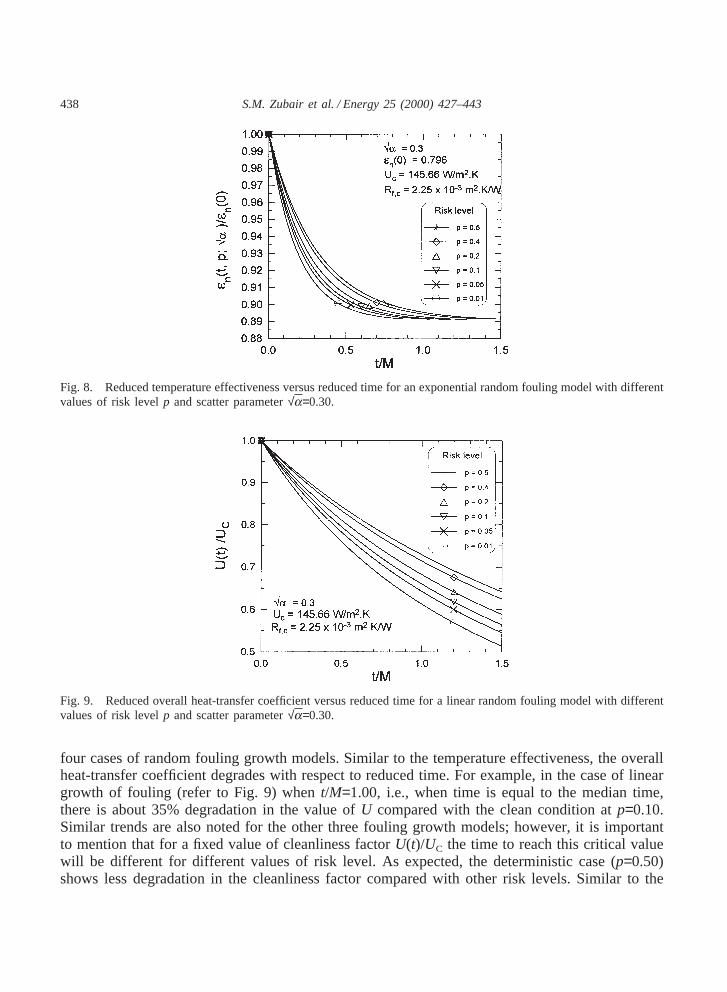
Fig. 8. Reduced temperature effectiveness versus reduced time for an exponential random fouling model with differentvalues of risk levelp and scatter parameter√a=0.30.
Fig. 9. Reduced overall heat-transfer coefficient versus reduced time for a linear random fouling model with differentvalues of risk levelp and scatter parameter√a=0.30.
four cases of random fouling growth models. Similar to the temperature effectiveness, the overallheat-transfer coefficient degrades with respect to reduced time. For example, in the case of lineargrowth of fouling (refer to Fig. 9) whent/M=1.00, i.e., when time is equal to the median time,there is about 35% degradation in the value ofU compared with the clean condition atp=0.10.Similar trends are also noted for the other three fouling growth models; however, it is importantto mention that for a fixed value of cleanliness factorU(t)/UC the time to reach this critical valuewill be different for different values of risk level. As expected, the deterministic case (p=0.50)shows less degradation in the cleanliness factor compared with other risk levels. Similar to the
439S.M. Zubair et al. / Energy 25 (2000) 427–443
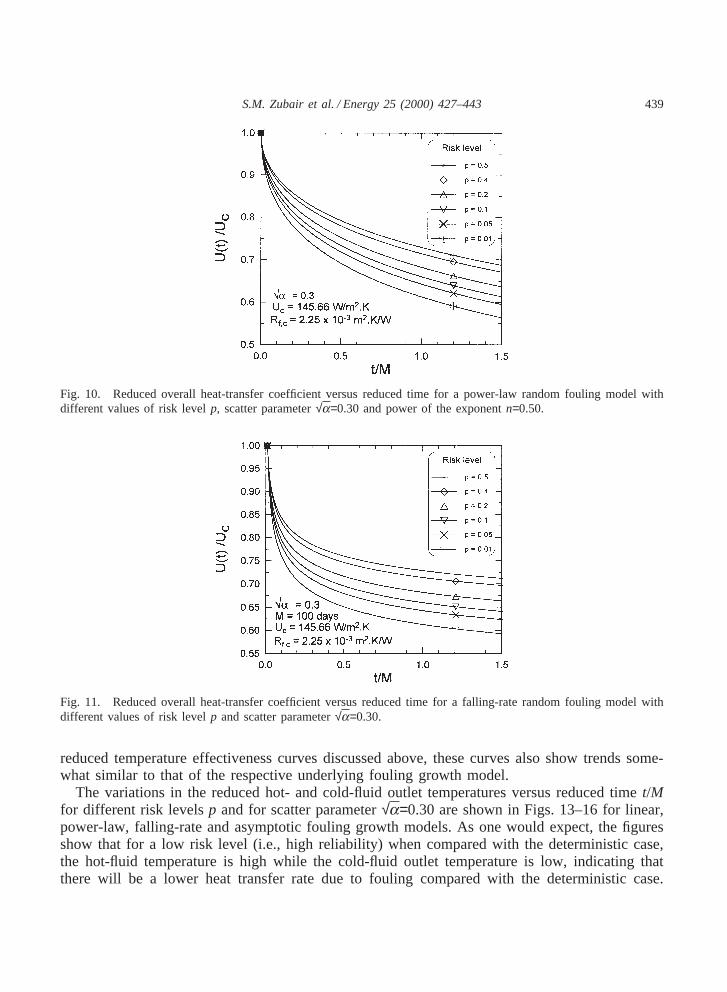
Fig. 10. Reduced overall heat-transfer coefficient versus reduced time for a power-law random fouling model withdifferent values of risk levelp, scatter parameter√a=0.30 and power of the exponentn=0.50.
Fig. 11. Reduced overall heat-transfer coefficient versus reduced time for a falling-rate random fouling model withdifferent values of risk levelp and scatter parameter√a=0.30.
reduced temperature effectiveness curves discussed above, these curves also show trends some-what similar to that of the respective underlying fouling growth model.
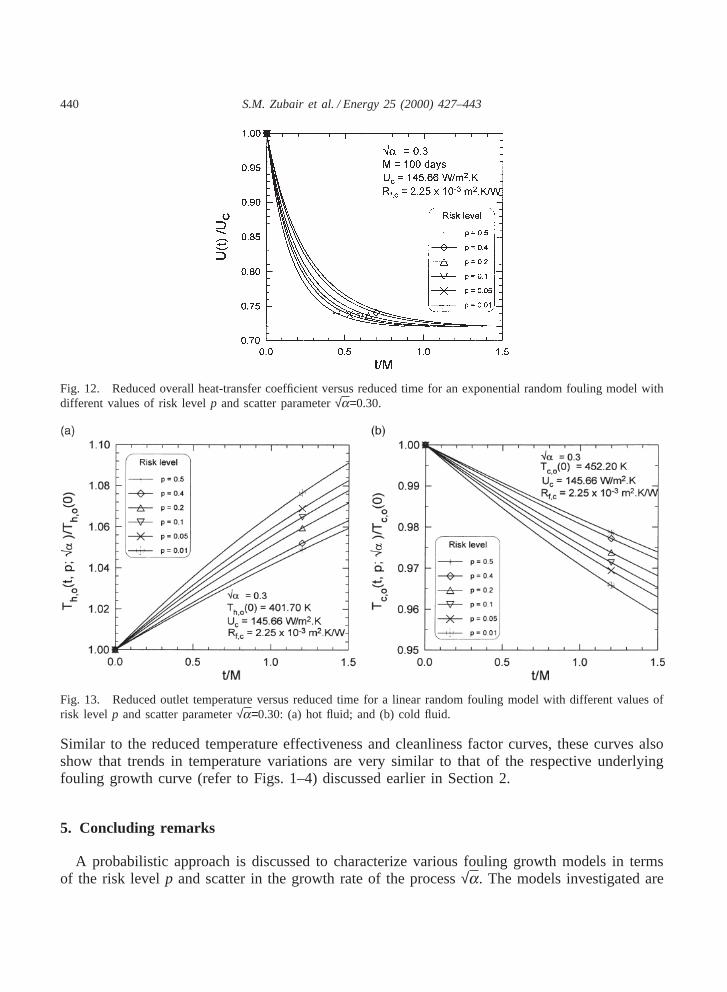
The variations in the reduced hot- and cold-fluid outlet temperatures versus reduced timet/Mfor different risk levelsp and for scatter parameter√a=0.30 are shown in Figs. 13–16 for linear,power-law, falling-rate and asymptotic fouling growth models. As one would expect, the figuresshow that for a low risk level (i.e., high reliability) when compared with the deterministic case,the hot-fluid temperature is high while the cold-fluid outlet temperature is low, indicating thatthere will be a lower heat transfer rate due to fouling compared with the deterministic case.
440 S.M. Zubair et al. / Energy 25 (2000) 427–443
Fig. 12. Reduced overall heat-transfer coefficient versus reduced time for an exponential random fouling model withdifferent values of risk levelp and scatter parameter√a=0.30.
Fig. 13. Reduced outlet temperature versus reduced time for a linear random fouling model with different values ofrisk level p and scatter parameter√a=0.30: (a) hot fluid; and (b) cold fluid.
Similar to the reduced temperature effectiveness and cleanliness factor curves, these curves alsoshow that trends in temperature variations are very similar to that of the respective underlyingfouling growth curve (refer to Figs. 1–4) discussed earlier in Section 2.
5. Concluding remarks
A probabilistic approach is discussed to characterize various fouling growth models in termsof the risk levelp and scatter in the growth rate of the process√a. The models investigated are
441S.M. Zubair et al. / Energy 25 (2000) 427–443
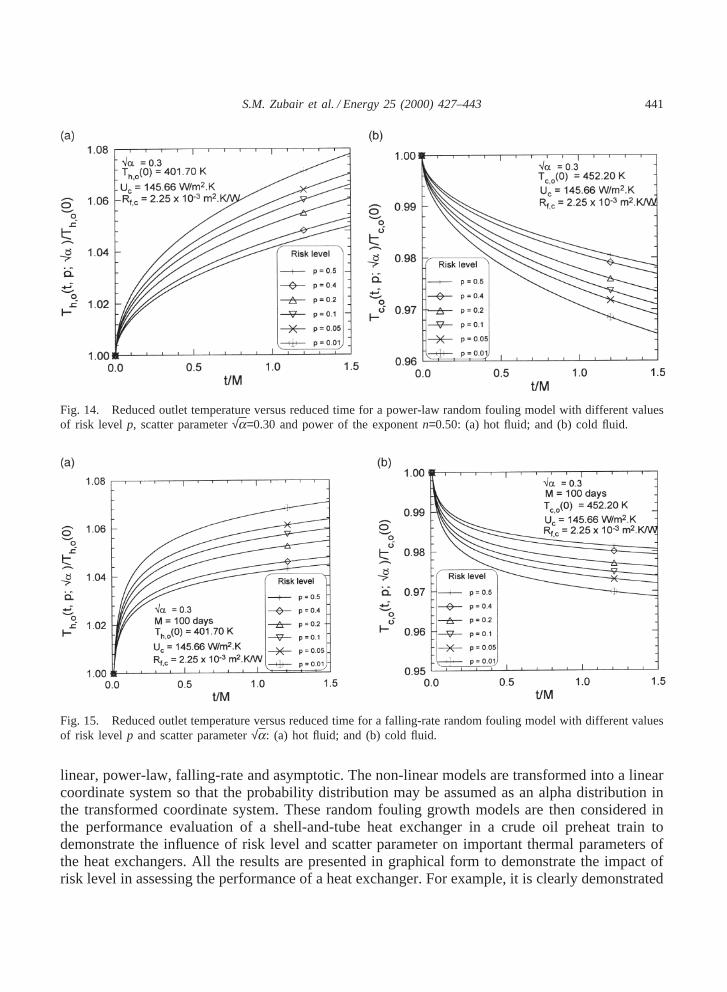
Fig. 14. Reduced outlet temperature versus reduced time for a power-law random fouling model with different valuesof risk level p, scatter parameter√a=0.30 and power of the exponentn=0.50: (a) hot fluid; and (b) cold fluid.
Fig. 15. Reduced outlet temperature versus reduced time for a falling-rate random fouling model with different valuesof risk level p and scatter parameter√a: (a) hot fluid; and (b) cold fluid.
linear, power-law, falling-rate and asymptotic. The non-linear models are transformed into a linearcoordinate system so that the probability distribution may be assumed as an alpha distribution inthe transformed coordinate system. These random fouling growth models are then considered inthe performance evaluation of a shell-and-tube heat exchanger in a crude oil preheat train todemonstrate the influence of risk level and scatter parameter on important thermal parameters ofthe heat exchangers. All the results are presented in graphical form to demonstrate the impact ofrisk level in assessing the performance of a heat exchanger. For example, it is clearly demonstrated
442 S.M. Zubair et al. / Energy 25 (2000) 427–443
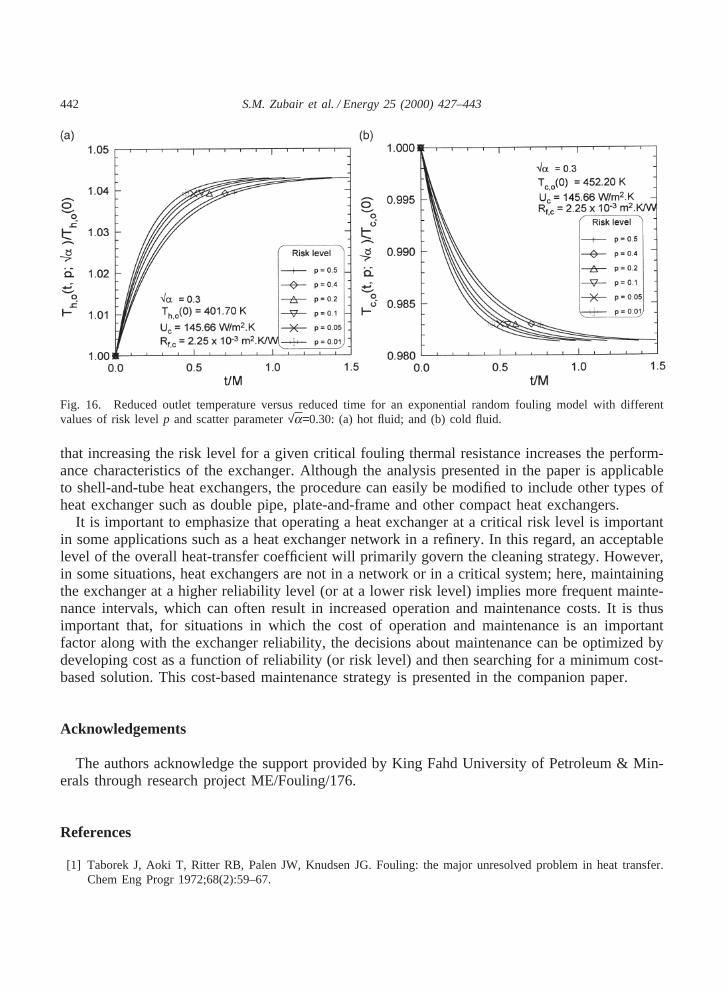
Fig. 16. Reduced outlet temperature versus reduced time for an exponential random fouling model with differentvalues of risk levelp and scatter parameter√a=0.30: (a) hot fluid; and (b) cold fluid.
that increasing the risk level for a given critical fouling thermal resistance increases the perform-ance characteristics of the exchanger. Although the analysis presented in the paper is applicableto shell-and-tube heat exchangers, the procedure can easily be modified to include other types ofheat exchanger such as double pipe, plate-and-frame and other compact heat exchangers.
It is important to emphasize that operating a heat exchanger at a critical risk level is importantin some applications such as a heat exchanger network in a refinery. In this regard, an acceptablelevel of the overall heat-transfer coefficient will primarily govern the cleaning strategy. However,in some situations, heat exchangers are not in a network or in a critical system; here, maintainingthe exchanger at a higher reliability level (or at a lower risk level) implies more frequent mainte-nance intervals, which can often result in increased operation and maintenance costs. It is thusimportant that, for situations in which the cost of operation and maintenance is an importantfactor along with the exchanger reliability, the decisions about maintenance can be optimized bydeveloping cost as a function of reliability (or risk level) and then searching for a minimum cost-based solution. This cost-based maintenance strategy is presented in the companion paper.
Acknowledgements
The authors acknowledge the support provided by King Fahd University of Petroleum & Min-erals through research project ME/Fouling/176.
References
[1] Taborek J, Aoki T, Ritter RB, Palen JW, Knudsen JG. Fouling: the major unresolved problem in heat transfer.Chem Eng Progr 1972;68(2):59–67.
443S.M. Zubair et al. / Energy 25 (2000) 427–443
[2] Taborek J, Aoki T, Ritter RB, Palen JW, Knudsen JG. Predictive methods for fouling behavior. Chem Eng Progr1972;68(7):69–78.
[3] Suitor JW, Warner WJ, Ritter RB. The history and status of research in fouling of exchangers in cooling waterservice. Can J Chem Eng 1976;55:374–80.
[4] Chenoweth JM. Final report of the HTRI/TEMA joint committee to review the fouling section of the TEMAstandards. Heat Transf Eng 1990;11(1):73–107.
[5] Bott TR. Fouling of heat exchangers. Amsterdam: Elsevier Science Publishers Ltd, 1995.[6] Kern DQ, Seaton RE. A theoretical analysis of thermal surface fouling. Br Chem Eng 1959;4(5):258–62.[7] Epstein N. Fouling: technical aspects (afterward to fouling in heat exchangers). In: Somerscales EFC, Knudsen
JG, editors. Fouling of heat transfer equipment. Washington (DC): Hemisphere, 1981:31–53.[8] Al-Ahmad MI, Abdelaleem FA. Scale and fouling problems and its reflection on the performance of industrial
thermal processes. In: Proceedings of the 3rd Saudi Engineering Conference. King Saud University Press Collegeof Engineering, Riyadh, Saudi Arabia, Vol. 1, 1991:1–11.
[9] Zubair SM, Sheikh AK, Shaik MN. A probabilistic approach to the maintenance of heat-transfer equipment subjectto fouling. Energy 1992;17(8):769–76.
[10] Zubair SM, Sheikh AK, Budair MO, Badar MA. A maintenance strategy for heat-transfer equipment subject tofouling: a probabilistic approach. ASME J Heat Transf 1997;119(3):575–80.
[11] Sheikh AK, Zubair SM, Younas M, Budair MO. Some remarks on the probabilistic basis for characterizing foulingdata. In: Bott TR, Melo LF, Panchal CB, Somerscales EFC, editors. Understanding Heat Exchanger Fouling andIts Mitigation. New York: Begell House, 1999:393–400.
[12] Hasson D, Avriel M, Resnick W, Rozenman T, Windreich S. Mechanisms of calcium carbonate deposition onheat transfer surfaces. Ind Eng Chem Fundamentals 1968;7(1):59–65.
[13] Andritsos N, Kontopoulou M, Karabelas AJ. Calcium carbonate deposit formation under isothermal conditions.Can J Chem Eng 1996;74:911–9.
[14] Zubair SM, Sheikh AK, Budair MO, Haq MU, Quddus A, Ashiru OA. Statistical aspects of CaCO3 fouling inAISI 316 stainless steel tubes. ASME J Heat Transf 1997;119(3):581–8.
[15] Khan MS, Zubair SM, Budair MO, Sheikh AK, Quddus A. Fouling resistance model for prediction of CaCO3
scaling in AISI 316 tubes. Heat Mass Transf 1996;32(1-2):73–80.[16] Somerscales EFC, Kassemi M. Fouling due to corrosion products formed on a heat-transfer surface. ASME J
Heat Transf 1987;109(1):267–71.[17] Muller-Steinhagen H, Reif F, Epstein N, Watkinson AP. Influence of operating conditions on particulate fouling.
Can J Chem Eng 1988;66(1):42–50.[18] Bansal B, Muller-Steinhagen H. Crystallization fouling in plate heat exchangers. ASME J Heat Transf
1993;115(3):584–91.[19] Hasson D. Progress in precipitation fouling research — a review. In: Bott TR, Melo LF, Panchal CB, Somerscales
EFC, editors. Understanding Heat Exchanger Fouling and Its Mitigation. New York: Begell House, 1999:67–89.[20] Jamin B. Exchanger stages solved by graph. Hydrocarbon Process 1970;49(7):137–45.[21] Kern DQ. Heat exchanger design for fouling service. Chem Eng Progr 1966;62(7):51–6.[22] Anon. Procedure 7B4.7: alternate computer method for enthalpy of petroleum fractions. API data book — pet-
roleum refining. 4th edition, 1978, 7.133-7.134, American Petroleum Institute, New York[23] Sheikh AK, Zubair SM, Haq MU, Budair MO. Reliability-based maintenance strategies for heat exchangers subject
to fouling. ASME J Energy Resourc Technol 1996;118(4):306–12.


![Heat Exchanger Fouling and Cleaning - MODEL ...heatexchanger-fouling.com/papers/papers2019/32_Lozano F...Fouling rate is also traditionally (and incorrectly, see [13]) equated with](https://static.documents.pub/doc/80x56/5eda5de9b3745412b57139a0/heat-exchanger-fouling-and-cleaning-model-heatexchanger-f-fouling-rate.jpg)