HAL Id: halshs-00389789 https://halshs.archives-ouvertes.fr/halshs-00389789 Submitted on 29 May 2009 HAL is a multi-disciplinary open access archive for the deposit and dissemination of sci- entific research documents, whether they are pub- lished or not. The documents may come from teaching and research institutions in France or abroad, or from public or private research centers. L’archive ouverte pluridisciplinaire HAL, est destinée au dépôt et à la diffusion de documents scientifiques de niveau recherche, publiés ou non, émanant des établissements d’enseignement et de recherche français ou étrangers, des laboratoires publics ou privés. A Risk Management Approach for Portfolio Insurance Strategies Benjamin Hamidi, Bertrand Maillet, Jean-Luc Prigent To cite this version: Benjamin Hamidi, Bertrand Maillet, Jean-Luc Prigent. A Risk Management Approach for Portfolio Insurance Strategies. 2009. halshs-00389789
Transcript
HAL Id: halshs-00389789https://halshs.archives-ouvertes.fr/halshs-00389789
Submitted on 29 May 2009
HAL is a multi-disciplinary open accessarchive for the deposit and dissemination of sci-entific research documents, whether they are pub-lished or not. The documents may come fromteaching and research institutions in France orabroad, or from public or private research centers.
L’archive ouverte pluridisciplinaire HAL, estdestinée au dépôt et à la diffusion de documentsscientifiques de niveau recherche, publiés ou non,émanant des établissements d’enseignement et derecherche français ou étrangers, des laboratoirespublics ou privés.
A Risk Management Approach for Portfolio InsuranceStrategies
Benjamin Hamidi, Bertrand Maillet, Jean-Luc Prigent
To cite this version:Benjamin Hamidi, Bertrand Maillet, Jean-Luc Prigent. A Risk Management Approach for PortfolioInsurance Strategies. 2009. halshs-00389789
Documents de Travail duCentre d’Economie de la Sorbonne
A Risk Management Approach for Portfolio
Insurance Strategies
Benjamin HAMIDI, Bertrand MAILLET, Jean-Luc PRIGENT
2009.34
Maison des Sciences Économiques, 106-112 boulevard de L'Hôpital, 75647 Paris Cedex 13http://ces.univ-paris1.fr/cesdp/CES-docs.htm
ISSN : 1955-611X
“A Risk Management Approach
for Portfolio Insurance Strategies”∗
Benjamin Hamidi† Bertrand Maillet‡ Jean-Luc Prigent§
- May 2009 -
Abstract
Controlling and managing potential losses is one of the main objec-tives of the Risk Management. Following Ben Ameur and Prigent (2007)and Chen et al. (2008), and extending the first results by Hamidi et al.(2009) when adopting a risk management approach for defining insuranceportfolio strategies, we analyze and illustrate a specific dynamic portfolioinsurance strategy depending on the Value-at-Risk level of the coveredportfolio on the French stock market. This dynamic approach is derivedfrom the traditional and popular portfolio insurance strategy (Cf. Blackand Jones, 1987; Black and Perold, 1992): the so-called “Constant Pro-portion Portfolio Insurance” (CPPI). However, financial results producedby this strategy crucially depend upon the leverage – called the multiple– likely guaranteeing a predetermined floor value whatever the plausiblemarket evolutions. In other words, the unconditional multiple is definedonce and for all in the traditional setting.The aim of this article is to further examine an alternative to the standardCPPI method, based on the determination of a conditional multiple. Inthis time-varying framework, the multiple is conditionally determined inorder to remain the risk exposure constant, even if it also depends uponmarket conditions. Furthermore, we propose to define the multiple as afunction of an extended Dynamic AutoRegressive Quantile model of theValue-at-Risk (DARQ-VaR). Using a French daily stock database (CAC40and individual stocks in the period 1998-2008), we present the main per-formance and risk results of the proposed Dynamic Proportion PortfolioInsurance strategy, first on real market data and secondly on artificialbootstrapped and surrogate data. Our main conclusion strengthens theprevious ones: the conditional Dynamic Strategy with Constant-risk expo-sure dominates most of the time the traditional Constant-asset exposureunconditional strategies.
Following Ben Ameur and Prigent (2007), Chen et al. (2008) and Hamidi et al.(2009), we apply the usual Risk Management approach to a particular type ofportfolio insurance: the Constant Proportion Portfolio Insurance (CPPI - Cf.Black and Jones, 1987; Black and Perold, 1992). In other words, the risk of thenew insured strategy is the true target and not the global asset weight exposureto risky assets as in the traditional approach.The standard general method crucially depends upon the leverage – called themultiple – guaranteeing a predetermined floor whatever the plausible marketevolutions. However, the unconditional multiple is defined once and for all inthe traditional CPPI setting. We propose in this article an alternative to thestandard CPPI method, based on the determination of a conditional multiple.In a time-varying framework, the multiple is conditionally determined in orderthe risk exposure to remain constant, but to depend on market conditions.In other words, while the traditional strategy is indeed a Constant-exposureProportion Portfolio Insurance strategy, the strategy we examine has the maincharacteristic of being a Constant-risk Proportion Portfolio Insurance one.Moreover, we propose to define the conditional multiple as a function of theValue-at-Risk (VaR) of the protected portfolio, which itself is modelled in a time-series framework following Engle and Manganelli (2004) and Gourieroux andJasiak (2008) through a Dynamic AutoRegressive Quantile modelling (DARQ-VaR model). Thus, when the forecasted risk increases, the leverage of the CPPIshould decrease and vice-versa.The paper is organized as follows. After having recalled some basics aboutProportion Portfolio Insurance (PPI), we describe in section 3 the way we modelthe conditional multiple. In section 4, we present and estimate a particularspecification of the general model presented in section 3 and compare it to thetraditional unconditional strategy using real and several realistic artificial seriesbased on the CAC40 Index and its components. Section 5 concludes. Appendix1 justifies the proposed time-varying approach in an Insurance Portfolio context,whilst we briefly present in Appendix 2 the performance measures we use forevaluating the interest of a risk management approach for the Insurance ofPortfolios.
2 Basics about Proportion Portfolio Insurance
The general Portfolio Insurance principle aims to allow investors to recover, atmaturity, a given proportion of their initial capital. One of the standard PPImethods is the Constant Proportion Portfolio Insurance (CPPI). This strategyis based on a specific simple dynamic allocation on a risky asset and on a riskless
2
Document de Travail du Centre d'Economie de la Sorbonne - 2009.34
one, aiming to guarantee a predetermined value at the end of the investmentperiod.The management of a cushioned portfolio follows a dynamic portfolio alloca-tion and it is based on the definition of three virtual quantities: the floor, thecushion and the multiple. The floor is the minimum value of the portfolio thatis acceptable for an investor at maturity. The value of the insured portfolio isinvested in a risky asset and in a non-risky asset, in a proportion that varies inorder to insure at any time the guaranteed floor value. Hence, the investmentself-financed strategy aims that the portfolio has, at a certain maturity, a valueequal, at minimum, to the floor, (i.e., a predetermined percentage of the capitaldeposit at the beginning of the management period). The so-called cushion isdefined as the difference between the portfolio value and the guaranteed floor.It represents a certain amount of the value of the portfolio that is dedicated toabsorb some potential market shocks. Its size should be large enough for rep-resenting, each day, the maximum theoretical amount that can be lost withoutcompromising the guaranteed capital.The ratio between the risk-exposed asset value and the cushion corresponds, atany time, to the so-called multiple (defined once for all in the standard strat-egy). The multiple thus reflects the exposure of the portfolio. In its traditionalversion, the cushioned management strategy continuously targets a constantproportion of (unconditional) risk exposure. It means that the amount investedin the risky asset is determined by multiplying the cushion by the multiple.However, the crucial point of this simple strategy is to choose the targeted mul-tiple. For instance, if the risky asset price drops, the value of the cushion mustremain (by definition) superior or equal to zero. Therefore, the portfolio basedon the cushion method will have (theoretically) a value superior or equal to thefloor. Nevertheless, if the (fixed) multiple is too high (and/or the cushion istoo low), a large fall in price of the risky asset may damage the value of theportfolio, which may fall below the guaranteed value. The cushion should thusallow the portfolio manager to absorb a market shock inferior or equal to theinverse of the multiple.In a PPI framework, the multiple has to be at any time below the maximum ofthe (negative) realizations of the underlying risky asset return. The guaranteeis thus perfect in the only case where the unconditional multiple is equal to one.In all other cases (for conditional or unconditional multiples), the guarantee isonly provided according to plausible market conditions, that have to be definedby a set of assumptions regarding the potential loss on the risky asset one mayface.The probabilistic approach offers a pseudo-guarantee, mainly consisting in therespect, at any time, of the guarantee condition at a predefined significance levelof probability. Using the quantile hedging approach, the guarantee constraintis associated to a significance level and the multiple must be lower than theinverse of the conditional quantile of the asset return distribution.Thus, the target multiple can be re-interpreted as the inverse of the maximumloss that can bear the cushioned portfolio before the re-balancing of its riskycomponent, at a given confidence level. Hamidi et al. (2009) propose a first
3
Document de Travail du Centre d'Economie de la Sorbonne - 2009.34
conditional multiple model based on Value-at-Risk (VaR). This risk measureis based on a quantile function (i.e., an inverse of the cumulative distributionfunction), and measures the potential loss of a portfolio over a defined periodat a given confidence level. We complement hereafter their first results.
3 From the Extended DARQ-VaR Model to theConditional Multiple in a CPPI Framework
Since it reflects the maximal exposure of the portfolio, the multiple is the cru-cial parameter of CPPI strategies. For a perfect capital guarantee, the multiplemust be lower or equal to the inverse of the maximum loss of the risky assetreturn, until the portfolio manager can rebalance his position. For instance,if the risky asset drops drastically, the cushion must remain positive otherwisethe predetermined floor is passed and the guarantee violated, (i.e., the spread– varying across time – between the portfolio value and the guaranteed floormust be positive). Nevertheless, before the manager can re-adjust his position,the cushion allows the portfolio manager, by construction, for the absorption ashock smaller or equal to the inverse of the (superior limit of) the multiple.Several unconditional multiple determination methods have been developed inthe literature, but they all reduce the risk dimension of the strategy to the riskyasset exposure (see Black and Perold, 1992). Thus, these traditional uncondi-tional methods do not fully take into consideration the risk of the underlyingasset that changes according, for instance, to market conditions. In other words,the risk of the risky asset proportion is considered as a constant through thewhole life of the structured product. Looking at the time-variation of the ampli-tude and intensity of risk (see for instance Longin and Solnik, 1995), we proposeto model the conditional multiple as a function of the VaR. The target multipleis then:
mt = |V aRt (rt−1; β) + dt|−1 (1)
where V aRt (rt−1; β) is the first percentile of the conditional distribution ofdaily returns of the underlying asset, rt corresponds to the periodic return ofthe risky part of the portfolio covered, β is the vector of unknown parameters ofthe conditional percentile function, and dt represents the exceeding maximumreturn during the estimation period.
When modelling the conditional multiple, we hereafter adopt a probabilis-tic quantile hedging approach, based on an extended Dynamic AutoRegressiveValue-at-Risk model (DARQ-VaR), which is written in a particular extendedAsymmetric Slope CAViaR specification - chosen for illustration purposes (seeEngle and Manganelli, 2004), such as:
V aRt (rt; β) = β1 + β2 × V aRt−1 (rt−1; β) + β3 × max (0; rt−1)+β4 × [−min (0; rt−1)]
(2)
where the βi, i = [1, . . . , 4], are several parameters to estimate and rt is the
4
Document de Travail du Centre d'Economie de la Sorbonne - 2009.34
risky asset return at time t.The probability of 1% associated to the DARQ-VaR was chosen not only forfocusing on true extremes but also for having enough data points for recoveringgood estimations. Without introducing the parameter dt, the probability ofviolating the floor would have been equal to 1%. Working here at a daily fre-quency, this probability would thus have been too high for describing a realisticinvestor’s demand (a multiple often equal to 30 or so). However, for a lowerrebalancing time frequency (weekly or monthly), values of conditional multiplesbecome more realistic. Moreover, if we assume that the portfolio manager cantotally rebalance his position in one day, this particular estimation of the condi-tional multiple allows the portfolio manager for guaranteeing the predeterminedfloor defined by the investor. More generally, if the centile is well modelled (hitratio not significantly different from 1%, no cluster of exceeding times, and lim-ited exceeding maximum return from the centile) then the guarantee is (almost)insured (see Appendix 1). Finally, since the multiple is here modelled as afunction of DARQ-VaR, it can also be interpreted in terms of Expected Short-fall. The parameter dt allows for taking into account the risky asset dispersionof return in the (fat-)tail of the distribution of the risky asset returns. Thisparameter represents the highest failure of the model, and corresponds to oneof the highest negative returns in the sample. The combination of both VaRand dt is then closely linked to a measure of the Expected Shortfall. The VaRis here monitored (the risky asset allocation depending upon it), and extremereturns are taken into consideration through the parameter dt. The proposedstrategy can then be viewed as an application of Risk Management principlesinto a Portfolio Insurance context: the conditional multiple depends upon theforecasted Value-at-Risk, which depends on its turn to the lagged Value-at-Risk(and returns) and the highest failure of the model over the past. We propose inthe next section to observe what type of results this kind of conditional approachcan provide.
4 Data, Implementation Methods and Empiri-
cal Evidence of the Dynamic Strategy on theFrench Stock Market
We compare hereafter the performances of cushioned portfolios using a previ-ously presented DARQ-VaR specification, and some of the traditional uncondi-tional leveraged CPPI strategies associated to several levels of risk defined byan unconditional multiple fixed once and for all to values ranging from 3 to 13.We use CAC40 daily returns and single returns of its fifty main componentssince inception (stocks changing during the history of the series). The sampleperiod consists of 21 years of daily data, from the 9th of July 1987 to 30th ofApril 2008. This total period consists of 5,242 returns which we split in twoperiods: we use a rolling window of 2,785 returns for dynamically in-sampleestimating the parameters and a post-sample period consisting of 2,457 returns
5
Document de Travail du Centre d'Economie de la Sorbonne - 2009.34
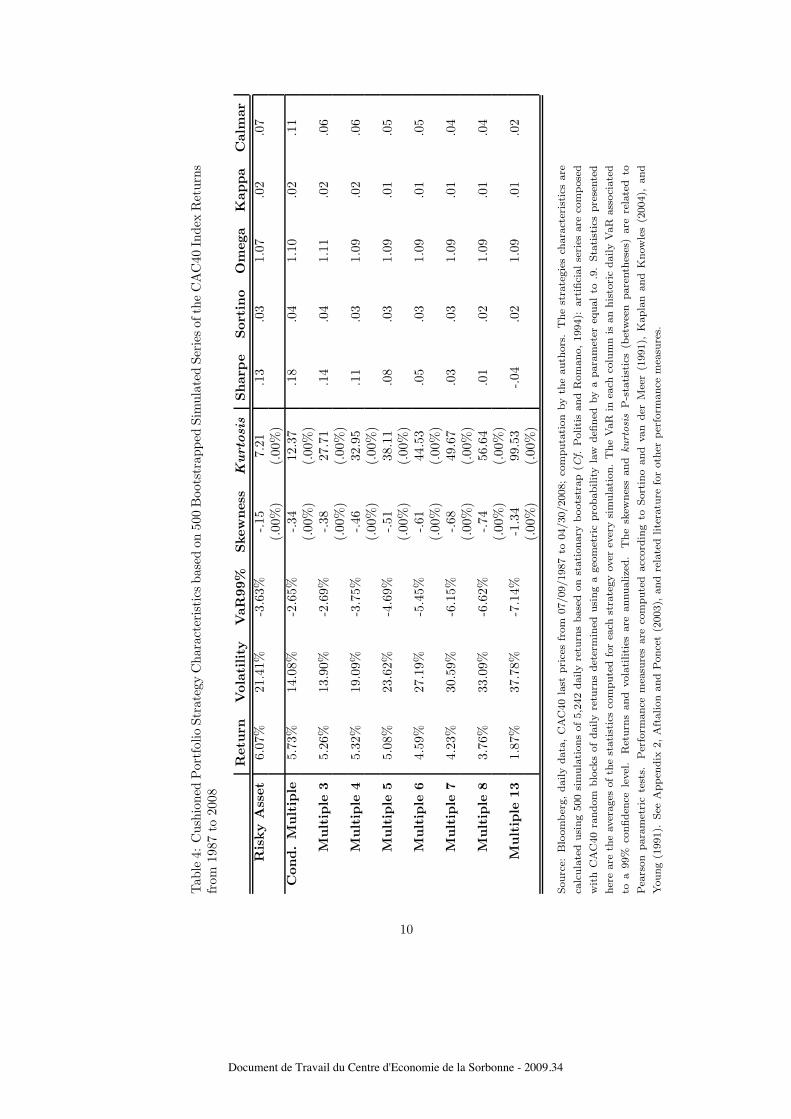
for out-of-sample testing the various strategies. The following application onthe CAC40 provides only a statistical illustration of the comparison betweenunconditional and conditional multiple-based portfolios built with the same se-ries of returns. However, the proposed self-financed Dynamic PPI strategy canbe easily applied using, for instance, an Exchange Trading Fund on the FrenchIndex, with some transaction costs; moreover, it is worth noticing that a fairbuy-and-hold benchmark should also include the dividends.After having estimated the DARQ-VaR model, we use it for defining daily con-ditional multiples and the related time-varying strategy. We then compare itwith traditional CPPI strategies based on an unconditional multiple used inpractice (between 3 and 13). Comparisons between the conditional multiplestrategy and unconditional methods are presented in Tables 1 to 5. The firstcomparisons are based on observed prices: the CAC40 Index (see Table 1 and2). For limiting the potential impact of the Index construction method, wecomplement the results of the former table by those of Table 3, that concern anequally weighted portfolio based on the fifty main components of the CAC40 In-dex since inception. Table 4 and 5 are related to comparisons based on realisticartificial series rebuilt from the CAC40 series, following first a simple stationarybootstrap (Politis and Romano, 1994) and secondly a surrogate data simulationprocedure (Schreiber and Schmidzt, 2000).All results, however, converge in the same way: the conditional Dynamic Strat-egy with Constant-risk exposure dominates most of the time the traditionalConstant-asset exposure unconditional strategies in terms of return per unit ofrisk, combining a return close to the one of the best unconditional strategy,with a volatility amongst the lowest. While the risk of the conditional strategyis defined ex ante (with an almost Constant-risk exposure), it, however, appears- ex post - among the best portfolio strategies.
5 Concluding Remarks
The model and estimation methods proposed in this article provide a rigorousframework for fixing, at each date, a conditional multiple, preserving a con-stant exposition to risk defined by a shortfall constraint within an actual RiskManagement approach. The dynamic setting starts with the conditioning ofthe time-varying multiple, through an extended DARQ-VaR for monitoring thetrue risk exposure of the structured product.Hamidi et al. (2009) show that this strategy proves efficiency in the Americanstock market, whilst we complement here their results by both using CAC40and a basket of French stocks, and artificial series built using bootstrap andsurrogate techniques (thus limiting the dependency of the results to startingdates and asset price paths). This work will be improved in the near future,explicitly replacing the function of the conditional centile by a coherent measureof risk - namely the Expected Shortfall, expressed in a quantile regression condi-tional setting, for having a more robust and flexible estimation of the conditionalmultiple.
6
Document de Travail du Centre d'Economie de la Sorbonne - 2009.34
Tab
le1:
Cus
hion
edPor
tfol
ioSt
rate
gyC
hara
cter
istics
onth
eC
AC
40In
dex
from
1998
to20
08
Ret
urn
Vol
atility
VaR
99%
Ske
wnes
sK
urto
sis
Shar
pe
Sor
tino
Om
ega
Kap
pa
Cal
mar
Ris
ky
Ass
et3.
07%
23.0
3%-4
.14%
-.02
5.90
.00
.02
1.04
.02
.05
(.00
%)
(.00
%)
Con
d.
Mult
iple
3.03
%13
.18%
-2.6
5%-.36
10.0
3.0
0.0
31.
06.0
2.1
0(.00
%)
(.00
%)
Mult
iple
32.
13%
6.80
%-1
.36%
-.76
12.1
8-.13
.03
1.07
.02
.11
(.00
%)
(.00
%)
Mult
iple
41.
79%
9.00
%-1
.98%
-.78
11.1
8-.13
.02
1.05
.01
.07
(.00
%)
(.00
%)
Mult
iple
51.
43%
11.7
0%-2
.58%
-.83
10.4
1-.13
.01
1.04
.01
.04
(.00
%)
(.00
%)
Mult
iple
61.
02%
13.6
4%-3
.11%
-.82
9.85
-.15
.01
1.03
.01
.03
(.00
%)
(.00
%)
Mult
iple
7.6
7%17
.07%
-3.9
3%-.84
10.5
9-.14
.01
1.03
.01
.02
(.00
%)
(.00
%)
Mult
iple
8.4
3%19
.13%
-4.4
5%-.88
11.2
5-.13
.01
1.03
.01
.01
(.00
%)
(.00
%)
Mult
iple
13.1
3%20
.67%
-4.5
6%-2
.02
29.9
4-.14
.01
1.03
.00
.00
(.00
%)
(.00
%)
Sourc
e:B
loom
ber
g,
daily
data
,C
AC
40
last
pri
ces
from
07/09/1987
to04/30/2008;
com
puta
tion
by
the
auth
ors
.R
eturn
sand
Vola
tiliti
esare
annualize
d.
The
VaR
ofea
chco
lum
nis
an
his
tori
cdaily
VaR
ass
oci
ate
dto
a99%
confiden
cele
vel
.T
he
skew
nes
sand
kurt
osi
sP
-sta
tist
ics
(bet
wee
n
pare
nth
eses
)are
rela
ted
toPea
rson
para
met
ric
test
s.Per
form
ance
mea
sure
sare
com
pute
dacc
ord
ing
toSort
ino
and
van
der
Mee
r(1
991)
and
Kapla
n
and
Know
les
(2004).
See
Appen
dix
2,A
ftalion
and
Ponce
t(2
003)
and
rela
ted
lite
ratu
refo
roth
erper
form
ance
mea
sure
s.
7
Document de Travail du Centre d'Economie de la Sorbonne - 2009.34
Tab
le2:
Con
dition
alM
ultipl
eSt
rate
gyR
anki
ngvs
Unc
ondi
tion
alSt
rate
gies
acco
rdin
gto
Per
form
ance
Mea
sure
s
Shar
pe
Sor
tino
Om
ega
Kap
pa
Cal
mar
Info
rmat
ion
Fam
aJe
nse
nC
ondit
ional
Mult
iple
Ran
kin
g1
12
12
11
3
Sourc
e:B
loom
ber
g,daily
data
,C
AC
40
last
pri
ces
from
07/09/1987
to04/30/2008;co
mputa
tion
by
the
auth
ors
.In
sure
dst
rate
gie
spre
sente
din
table
1are
ranked
acc
ord
ing
tose
ver
alper
form
ance
mea
sure
s(f
or
defi
nit
ions,
see
refe
rence
sin
Table
1,A
ppen
dix
2and
Aft
alion
and
Ponce
t,2003).
8
Document de Travail du Centre d'Economie de la Sorbonne - 2009.34
Tab
le3:
Cus
hion
edPor
tfol
ioSt
rate
gyC
hara
cter
istics
onan
Equ
ally
Wei
ghte
dC
ompo
nent
sps
eudo
-CA
C40
Por
tfol
iofr
om19
98to
2008
Ret
urn
Vol
atility
VaR
99%
Ske
wnes
sK
urto
sis
Shar
pe
Sor
tino
Om
ega
Kap
pa
Cal
mar
Ris
ky
Ass
et9.
96%
20.1
7%-3
.75%
-.03
7.16
.33
.05
1.11
.03
.20
(.00
%)
(.00
%)
Con
d.
Mult
iple
4.59
%12
.93%
-2.5
1%-.68
9.1
.10
.03
1.08
.02
.13
(.00
%)
(.00
%)
Mult
iple
33.
58%
8.29
%-1
.86%
-.86
10.8
6.0
4.0
41.
10.0
2.1
6(.00
%)
(.00
%)
Mult
iple
43.
36%
11.3
1%-2
.56%
-.91
11.8
4.0
1.0
31.
07.0
2.1
1(.00
%)
(.00
%)
Mult
iple
52.
81%
14.7
7%-3
.34%
-1.0
112
.00
-.03
.02
1.06
.01
.07
(.00
%)
(.00
%)
Mult
iple
62.
85%
19.0
9%-4
.19%
-.97
12.1
5-.02
.02
1.05
.01
.06
(.00
%)
(.00
%)
Mult
iple
72.
65%
23.7
4%-5
.31%
-.94
11.8
9-.03
.02
1.05
.01
.05
(.00
%)
(.00
%)
Mult
iple
82.
24%
29.4
1%-6
.20%
-1.0
512
.84
-.04
.02
1.05
.01
.03
(.00
%)
(.00
%)
Mult
iple
13.3
1%45
.46%
-9.9
3%-1
.42
17.4
-.07
.02
1.06
.01
.00
(.00
%)
(.00
%)
Sourc
e:B
loom
ber
g,daily
data
,C
AC
40
fift
ym
ain
com
ponen
tla
stpri
ces
from
12/31/1987
to01/16/2008;
com
puta
tion
by
the
auth
ors
.T
he
equally
wei
ghte
dport
folio
isbase
don
the
fift
ym
ain
CA
C40
com
ponen
tssi
nce
itsin
cepti
on
and
isre
bala
nce
dea
chday
.R
eturn
sand
vola
tiliti
esare
annualize
d.
The
VaR
inea
chco
lum
nis
an
his
tori
cdaily
VaR
ass
oci
ate
dto
a99%
confiden
cele
vel
.T
he
skew
nes
sand
kurt
osi
sP
-sta
tist
ics
(bet
wee
npare
nth
eses
)
are
rela
ted
toPea
rson
para
met
ric
test
s.Per
form
ance
mea
sure
sare
com
pute
dacc
ord
ing
toSort
ino
and
van
der
Mee
r(1
991),
Kapla
nand
Know
les
(2004),
and
Young
(1991).
See
Appen
dix
2,A
ftalion
and
Ponce
t(2
003)
and
rela
ted
lite
ratu
refo
roth
erper
form
ance
mea
sure
s.
9
Document de Travail du Centre d'Economie de la Sorbonne - 2009.34
Tab
le4:
Cus
hion
edPor
tfol
ioSt
rate
gyC
hara
cter
isti
csba
sed
on50
0B
oots
trap
ped
Sim
ulat
edSe
ries
ofth
eC
AC
40In
dex
Ret
urns
from
1987
to20
08
Ret
urn
Vol
atility
VaR
99%
Ske
wnes
sK
urto
sis
Shar
pe
Sor
tino
Om
ega
Kap
pa
Cal
mar
Ris
ky
Ass
et6.
07%
21.4
1%-3
.63%
-.15
7.21
.13
.03
1.07
.02
.07
(.00
%)
(.00
%)
Con
d.
Mult
iple
5.73
%14
.08%
-2.6
5%-.34
12.3
7.1
8.0
41.
10.0
2.1
1(.00
%)
(.00
%)
Mult
iple
35.
26%
13.9
0%-2
.69%
-.38
27.7
1.1
4.0
41.
11.0
2.0
6(.00
%)
(.00
%)
Mult
iple
45.
32%
19.0
9%-3
.75%
-.46
32.9
5.1
1.0
31.
09.0
2.0
6(.00
%)
(.00
%)
Mult
iple
55.
08%
23.6
2%-4
.69%
-.51
38.1
1.0
8.0
31.
09.0
1.0
5(.00
%)
(.00
%)
Mult
iple
64.
59%
27.1
9%-5
.45%
-.61
44.5
3.0
5.0
31.
09.0
1.0
5(.00
%)
(.00
%)
Mult
iple
74.
23%
30.5
9%-6
.15%
-.68
49.6
7.0
3.0
31.
09.0
1.0
4(.00
%)
(.00
%)
Mult
iple
83.
76%
33.0
9%-6
.62%
-.74
56.6
4.0
1.0
21.
09.0
1.0
4(.00
%)
(.00
%)
Mult
iple
131.
87%
37.7
8%-7
.14%
-1.3
499
.53
-.04
.02
1.09
.01
.02
(.00
%)
(.00
%)
Sourc
e:B
loom
ber
g,daily
data
,C
AC
40
last
pri
ces
from
07/09/1987
to04/30/2008;
com
puta
tion
by
the
auth
ors
.T
he
stra
tegie
sch
ara
cter
isti
csare
calc
ula
ted
usi
ng
500
sim
ula
tions
of5,2
42
daily
retu
rns
base
don
stati
onary
boots
trap
(Cf.
Politi
sand
Rom
ano,1994):
art
ifici
alse
ries
are
com
pose
d
wit
hC
AC
40
random
blo
cks
of
daily
retu
rns
det
erm
ined
usi
ng
ageo
met
ric
pro
bability
law
defi
ned
by
apara
met
ereq
ual
to.9
.Sta
tist
ics
pre
sente
d
her
eare
the
aver
ages
ofth
est
ati
stic
sco
mpute
dfo
rea
chst
rate
gy
over
ever
ysi
mula
tion.
The
VaR
inea
chco
lum
nis
an
his
tori
cdaily
VaR
ass
oci
ate
d
toa
99%
confiden
cele
vel
.R
eturn
sand
vola
tilities
are
annualize
d.
The
skew
nes
sand
kurt
osi
sP
-sta
tist
ics
(bet
wee
npare
nth
eses
)are
rela
ted
to
Pea
rson
para
met
ric
test
s.Per
form
ance
mea
sure
sare
com
pute
dacc
ord
ing
toSort
ino
and
van
der
Mee
r(1
991),
Kapla
nand
Know
les
(2004),
and
Young
(1991).
See
Appen
dix
2,A
ftalion
and
Ponce
t(2
003),
and
rela
ted
lite
ratu
refo
roth
erper
form
ance
mea
sure
s.
10
Document de Travail du Centre d'Economie de la Sorbonne - 2009.34
Tab
le5:
Cus
hion
edPor
tfol
ioSt
rate
gyC
hara
cter
istics
base
don
500
Surr
ogat
edSi
mul
ated
Seri
esof
the
CA
C40
Inde
xR
etur
nsfr
om19
87to
2008
Ret
urn
Vol
atility
VaR
99%
Ske
wnes
sK
urto
sis
Shar
pe
Sor
tino
Om
ega
Kap
pa
Cal
mar
Ris
ky
Ass
et6.
39%
21.3
8%-3
.62%
-.15
7.32
.15
.03
1.07
.02
.09
(.00
%)
(.00
%)
Con
d.
Mult
iple
4.92
%14
.64%
-2.7
6%-.21
14.2
8.1
1.0
41.
09.0
2.0
9(.00
%)
(.00
%)
Mult
iple
34.
17%
14.2
6%-2
.75%
-.46
29.8
7.0
6.0
31.
09.0
2.0
7(.00
%)
(.00
%)
Mult
iple
43.
65%
19.2
5%-3
.78%
-.53
38.1
2.0
2.0
21.
07.0
1.0
5(.00
%)
(.00
%)
Mult
iple
52.
97%
23.3
7%-4
.61%
-.56
46.3
9-.01
.02
1.07
.01
.04
(.00
%)
(.00
%)
Mult
iple
62.
31%
26.4
2%-5
.24%
-.56
55.3
7-.04
.02
1.06
.01
.03
(.00
%)
(.00
%)
Mult
iple
71.
76%
28.5
4%-5
.62%
-.62
67.4
6-.05
.02
1.06
.01
.02
(.00
%)
(.00
%)
Mult
iple
81.
38%
29.8
2%-5
.78%
-.69
82.2
4-.06
.02
1.06
.01
.01
(.00
%)
(.00
%)
Mult
iple
13.4
7%32
.16%
-5.3
6%-.52
185.
63-.09
.02
1.08
.01
.00
(.00
%)
(.00
%)
Sourc
e:B
loom
ber
g,
daily
data
,C
AC
40
last
pri
ces
from
07/09/1987
to04/30/2008;
com
puta
tion
by
the
auth
ors
.T
he
stra
tegy
chara
cter
isti
csare
calc
ula
ted
usi
ng
500
sim
ula
tions
of
5,2
42
daily
retu
rns
base
don
asu
rrogate
data
tech
niq
ue
(Cf.
Sch
reib
erand
Sch
mid
zt,
2000):
ori
gin
alse
ries
of
daily
retu
rns
are
firs
tra
ndom
lyto
tally
re-o
rder
edand
then
seco
nd
pair
-wis
eper
mute
dunti
lth
enew
seri
essh
are
som
esi
milari
ties
wit
hth
eori
gin
al
one
(±10%
of
firs
tco
rrel
ati
on
coeffi
cien
tsand
of
the
long
mem
ory
para
met
erof
vola
tility
).T
he
stati
stic
spre
sente
dher
eare
the
aver
ages
of
the
stati
stic
sco
mpute
dfo
rea
chst
rate
gy
over
ever
ysi
mula
tion.
The
VaR
inea
chco
lum
nis
an
his
tori
cdaily
VaR
ass
oci
ate
dto
a99%
confiden
cele
vel
.T
he
skew
nes
sand
kurt
osi
sP
-sta
tist
ics
(bet
wee
npare
nth
eses
)are
rela
ted
toPea
rson
para
met
ric
test
s.Per
form
ance
mea
sure
sare
com
pute
dacc
ord
ing
toSort
ino
and
van
der
Mee
r(1
991),
Kapla
nand
Know
les
(2004),
and
Young
(1991).
See
Appen
dix
2,
Aft
alion
and
Ponce
t(2
003)
and
rela
ted
lite
ratu
refo
roth
erper
form
ance
mea
sure
s.
11
Document de Travail du Centre d'Economie de la Sorbonne - 2009.34
6 References
Aftalion F. and P. Poncet, (2003), Les techniques de mesure de performances,Economica, 139 pages.
Ben Ameur H. and J.-L. Prigent, (2007), “Portfolio Insurance: Determinationof a Dynamic CPPI Multiple as Function of State Variables”, THEMA WorkingPaper, University of Cergy, 22 pages.
Bertrand Ph. and J.-L. Prigent, (2002), “Portfolio Insurance: the ExtremeValue Approach to the CPPI Method”, Finance 23(2), 69-86.
Black F. and R. Jones, (1987), “Simplifying Portfolio Insurance”, Journal ofPortfolio Management 14(1), 48-51.
Black F. and A. Perold, (1992), “Theory of Constant Proportion Portfolio In-surance”, Journal of Economic Dynamics and Control 16(3), 403-426.
Bontemps Ch. and N. Meddahi, (2005), “Testing Normality: A GMM Ap-proach”, Journal of Econometrics 124(1), 149-186.
Chen J., C. Chang, J. Hou and Y. Lin, (2008), “Dynamic Proportion PortfolioInsurance using Genetic Programming with Principal Component Analysis”,Expert Systems with Applications: An International Journal 35(1), 273-278.
Engle R. and S. Manganelli, (2004), “CAViaR: Conditional AutoRegressiveValue-at-Risk by Regression Quantiles”, Journal of Business and EconomicStatistics 22(4), 367-381.
Gourieroux Ch. and J. Jasiak, (2008), “Dynamic Quantile Models”, Journal ofEconometrics 147(1), 198-205.
Hamidi B., E. Jurczenko and B. Maillet, (2009), “A CAViaR Modelling for aSimple Time-Varying Proportion Portfolio Insurance Strategy”, Bankers, Mar-kets & Investors, forthcoming 2009, 21 pages.
Kaplan P. and J. Knowles, (2004), “Kappa: A Generalized Downside Risk-adjusted Performance Measure”, Journal of Performance Measurement 8(3),42-54.
Longin F. and B. Solnik, (1995), “Is the Correlation in International EquityReturns Constant: 1960-1990?”, Journal of International Money and Finance14(1), 3-26.
Politis D. and J. Romano, (1994), “The Stationary Bootstrap”, Journal of theAmerican Statistical Association 89(428), 1303-1313.
Schreiber T. and A. Schmidtz, (2000), “Surrogate Time-series”, Physica D 142,346-382.
Sortino F. and R. van der Meer, (1991), “Downside Risk”, Journal of PortfolioManagement 17(4), 27-31.
Young T., (1991), “Calmar Ratio: A Smoother Tool”, Futures 20(1), 40.
12
Document de Travail du Centre d'Economie de la Sorbonne - 2009.34
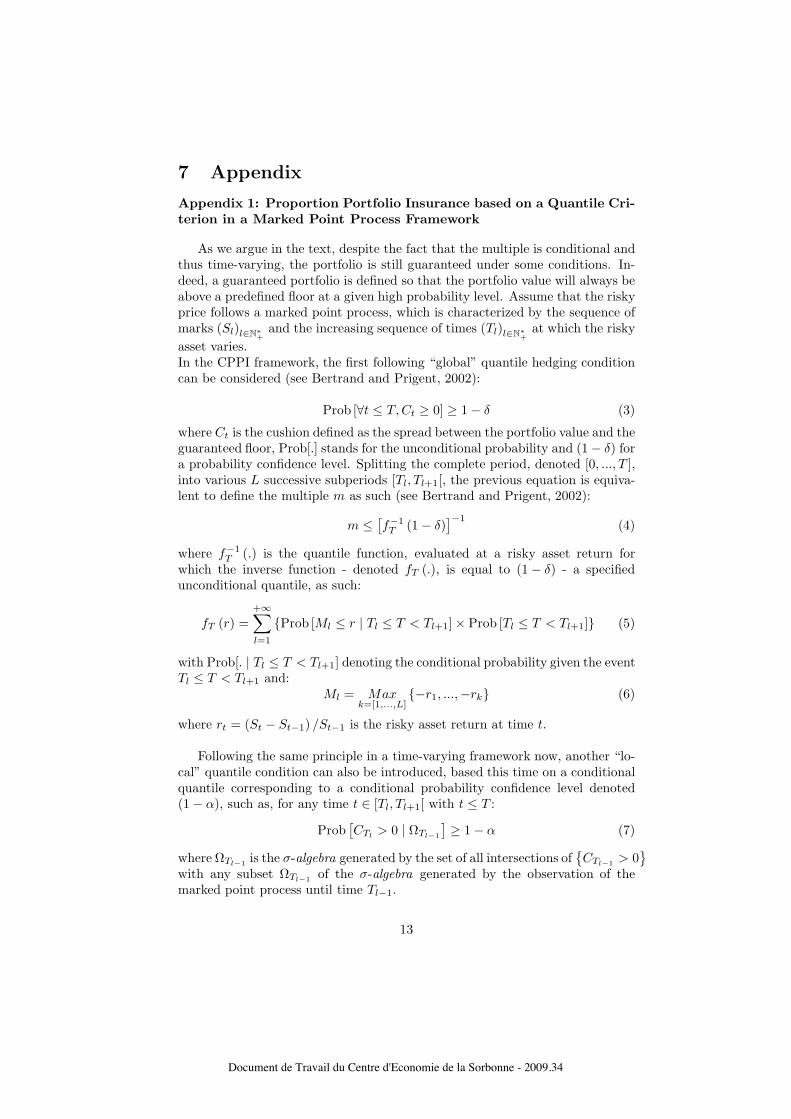
7 Appendix
Appendix 1: Proportion Portfolio Insurance based on a Quantile Cri-terion in a Marked Point Process Framework
As we argue in the text, despite the fact that the multiple is conditional andthus time-varying, the portfolio is still guaranteed under some conditions. In-deed, a guaranteed portfolio is defined so that the portfolio value will always beabove a predefined floor at a given high probability level. Assume that the riskyprice follows a marked point process, which is characterized by the sequence ofmarks (Sl)l∈N∗
+and the increasing sequence of times (Tl)l∈N∗
+at which the risky
asset varies.In the CPPI framework, the first following “global” quantile hedging conditioncan be considered (see Bertrand and Prigent, 2002):
Prob [∀t ≤ T, Ct ≥ 0] ≥ 1 − δ (3)
where Ct is the cushion defined as the spread between the portfolio value and theguaranteed floor, Prob[.] stands for the unconditional probability and (1 − δ) fora probability confidence level. Splitting the complete period, denoted [0, ..., T ],into various L successive subperiods [Tl, Tl+1[, the previous equation is equiva-lent to define the multiple m as such (see Bertrand and Prigent, 2002):
m ≤ [f−1
T (1 − δ)]−1
(4)
where f−1T (.) is the quantile function, evaluated at a risky asset return for
which the inverse function - denoted fT (.), is equal to (1 − δ) - a specifiedunconditional quantile, as such:
fT (r) =+∞∑
l=1
Prob [Ml ≤ r | Tl ≤ T < Tl+1] × Prob [Tl ≤ T < Tl+1] (5)
with Prob[. | Tl ≤ T < Tl+1] denoting the conditional probability given the eventTl ≤ T < Tl+1 and:
Ml = Maxk=[1,...,L]
−r1, ...,−rk (6)
where rt = (St − St−1) /St−1 is the risky asset return at time t.
Following the same principle in a time-varying framework now, another “lo-cal” quantile condition can also be introduced, based this time on a conditionalquantile corresponding to a conditional probability confidence level denoted(1 − α), such as, for any time t ∈ [Tl, Tl+1[ with t ≤ T :
Prob[CTl
> 0 | ΩTl−1
] ≥ 1 − α (7)
where ΩTl−1 is the σ-algebra generated by the set of all intersections ofCTl−1 > 0
with any subset ΩTl−1 of the σ-algebra generated by the observation of themarked point process until time Tl−1.
13
Document de Travail du Centre d'Economie de la Sorbonne - 2009.34
From previous condition (7), an upper bound on the multiple can be deducedaccording to specific assumptions (see Ben Ameur and Prigent, 2007, for thespecial case of GARCH-type models with a deterministic transaction-time).
Appendix 2: About some Performance Measures
Sharpe RatioThe Sharpe ratio is one of the most popular performance measures. It is de-fined as the ratio between the excess return about the risk free rate over thevolatility of the analysed portfolio. However, use of the Sharpe ratio in perfor-mance measurement is subject to some criticisms since returns do not displaya normal distribution. For example, the use of dynamic strategies results in anasymmetric return distribution, as well as fat tails, leading to the danger thatthe use of standard risk and performance measures will underestimate risk andoverestimate performance per unit of risk.
Sortino, Omega and Kappa MeasuresLower partial moments measure risk by negative deviations of the realized re-turns, to a minimum acceptable return. The lower partial moment of order n iscalculated using power n. Because lower partial moments consider only nega-tive deviations to a minimal acceptable return (which could be zero), they are amore appropriate measure of risk than the standard deviation, which considersnegative and positive deviations from expected return (see Sortino and van derMeer, 1991). The choice of the order n determines the extent to which the de-viations are weighted. The lower partial moment of order 0 can be interpretedas the shortfall probability, the lower partial moment of order 1 as the expectedshortfall, and the lower partial moment of order 2 as the semi-variance. Theorder of the lower partial moment to be chosen is linked to the downside-riskaversion of the investor. The more he is averse, the higher the order (since itgives extra weights to extreme pay-offs). The Omega (see Shadwick and Keat-ing, 2002), the Sortino ratio (see Sortino and van der Meer, 1991), and Kappa3 (see Kaplan and Knowles, 2004) make use respectively of the lower partialmoments of order 1, 2 and 3.
Calmar RatioAs the Sharpe ratio, the Calmar ratio is defined as the ratio between the excessreturn about the risk free rate over a risk measure of the analysed portfolio. TheCalmar ratio (see Young, 1991), uses the maximum drawdown over a three-yearperiod as the risk measure at the denumerator instead of the standard devia-tion of returns. The drawdown being the loss incurred over a certain investmentperiod (peak-to-valley price difference), drawdown-based performance measuresare particularly popular in practice, since they are better connected to the over-all loss that can face an investor (without any reference to a specific observationfrequency).
14
Document de Travail du Centre d'Economie de la Sorbonne - 2009.34
Jensen MeasureThe Jensen measure considers the average return above what is explained bythe capital asset pricing model. The beta factor is generally calculated usingthe correlation between the returns of a market index and the returns of theinvestment fund. The Jensen measure is, however, often criticized because itcan be manipulated by leveraging the fund return, and because it is based onthe assumption that alpha and beta can be clearly split.
15
Document de Travail du Centre d'Economie de la Sorbonne - 2009.34