Page 1
Proceedings of the 2009 Ground Vehicle Systems Engineering and Technology Symposium (GVSETS)
A Robust Durability Process for Military Ground Vehicles, Purushothaman, Jayakumar, Datta, Pisipati, and Critchley
Page 1 of 9
A ROBUST DURABILITY PROCESS FOR MILITARY GROUND VEHICLES
Nammalwar Purushothaman, PhD Paramsothy Jayakumar, PhD
James Critchley, PhD U.S. Combat Systems
BAE Systems Troy, MI
Sandip Datta, PhD Venkat Pisipati
TAC Worldwide for BAE Systems
Troy, MI
ABSTRACT
BAE Systems has departed from traditional design rules of thumb and implemented a full-vehicle
durability fatigue life analysis process at the design concept level to support lighter weight component designs.
The durability process includes derivation of test duty cycles, generation of virtual loads from vehicle dynamic
simulations, cascading of hundreds of channels of suspension attachment loads, and prediction of accumulated
damage/fatigue life for both quasi-static and transient responses using a finite element vehicle structural model.
The fatigue analysis process is typically deterministic, however the stochastic nature of the loads, material
properties, and build variations should also be considered to ensure a robust durability process. The process is
demonstrated on a heavy wheeled-vehicle platform using a generic duty cycle with examples shown at each
stage of the process. This study additionally demonstrates the effects of variability of loads, materials, and
geometry on the overall durability performance of the structure.
INTRODUCTION Vehicle durability refers to the long term performance of a
vehicle under the repetitive loading due to driving and other
operating conditions. In normal operating conditions, tires
and suspensions experience road loads and cascade
throughout the vehicle body. The transfer and distribution of
loads varies with the structural, inertial, and material
attributes of the vehicle body and manifest as repetitive
loads on the system and components. These repetitive loads
cause fatigue damage and the accumulation of damage
ultimately results in the initiation of cracks, crack
propagation, and system or part failure. A design for
durability process is a method of managing the accumulation
of fatigue damage to prevent cracks from initiating in
advance of the complete design life of the vehicle.
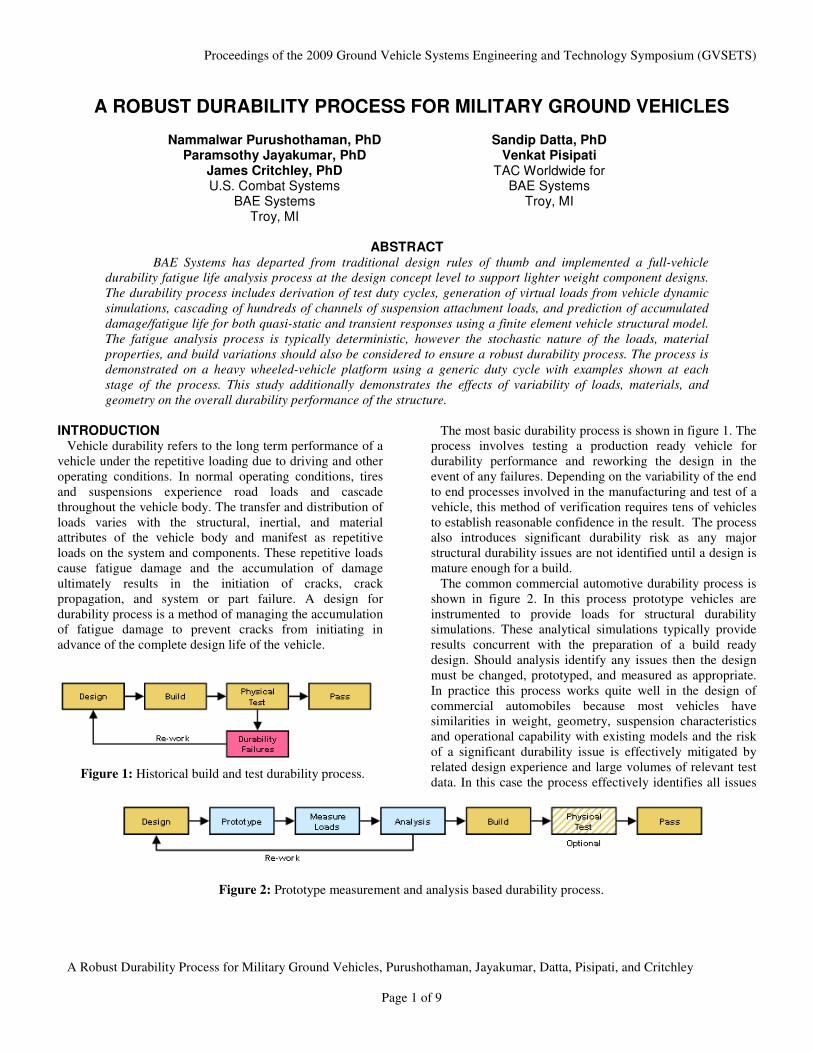
The most basic durability process is shown in figure 1. The
process involves testing a production ready vehicle for
durability performance and reworking the design in the
event of any failures. Depending on the variability of the end
to end processes involved in the manufacturing and test of a
vehicle, this method of verification requires tens of vehicles
to establish reasonable confidence in the result. The process
also introduces significant durability risk as any major
structural durability issues are not identified until a design is
mature enough for a build.
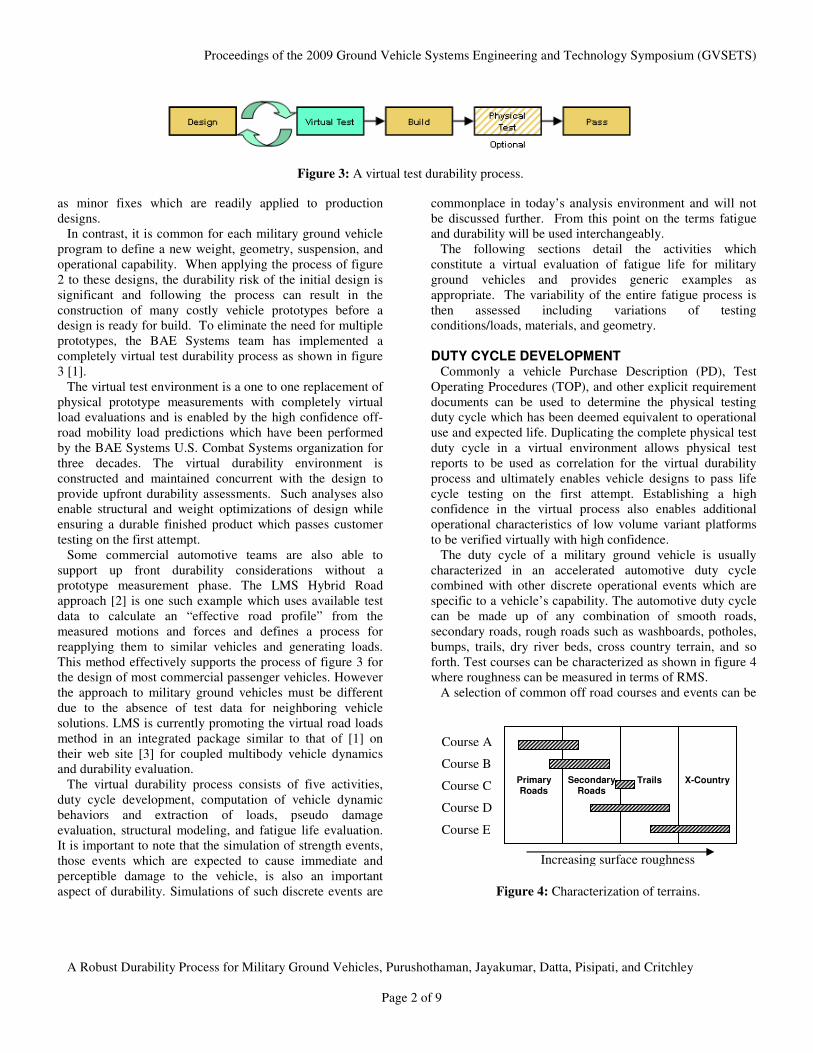
The common commercial automotive durability process is
shown in figure 2. In this process prototype vehicles are
instrumented to provide loads for structural durability
simulations. These analytical simulations typically provide
results concurrent with the preparation of a build ready
design. Should analysis identify any issues then the design
must be changed, prototyped, and measured as appropriate.
In practice this process works quite well in the design of
commercial automobiles because most vehicles have
similarities in weight, geometry, suspension characteristics
and operational capability with existing models and the risk
of a significant durability issue is effectively mitigated by
related design experience and large volumes of relevant test
data. In this case the process effectively identifies all issues
Figure 2: Prototype measurement and analysis based durability process.
Figure 1: Historical build and test durability process.
Page 2
Proceedings of the 2009 Ground Vehicle Systems Engineering and Technology Symposium (GVSETS)
A Robust Durability Process for Military Ground Vehicles, Purushothaman, Jayakumar, Datta, Pisipati, and Critchley
Page 2 of 9
as minor fixes which are readily applied to production
designs.
In contrast, it is common for each military ground vehicle
program to define a new weight, geometry, suspension, and
operational capability. When applying the process of figure
2 to these designs, the durability risk of the initial design is
significant and following the process can result in the
construction of many costly vehicle prototypes before a
design is ready for build. To eliminate the need for multiple
prototypes, the BAE Systems team has implemented a
completely virtual test durability process as shown in figure
3 [1]. The virtual test environment is a one to one replacement of
physical prototype measurements with completely virtual
load evaluations and is enabled by the high confidence off-
road mobility load predictions which have been performed
by the BAE Systems U.S. Combat Systems organization for
three decades. The virtual durability environment is
constructed and maintained concurrent with the design to
provide upfront durability assessments. Such analyses also
enable structural and weight optimizations of design while
ensuring a durable finished product which passes customer
testing on the first attempt.
Some commercial automotive teams are also able to
support up front durability considerations without a
prototype measurement phase. The LMS Hybrid Road
approach [2] is one such example which uses available test
data to calculate an “effective road profile” from the
measured motions and forces and defines a process for
reapplying them to similar vehicles and generating loads.
This method effectively supports the process of figure 3 for
the design of most commercial passenger vehicles. However
the approach to military ground vehicles must be different
due to the absence of test data for neighboring vehicle
solutions. LMS is currently promoting the virtual road loads
method in an integrated package similar to that of [1] on
their web site [3] for coupled multibody vehicle dynamics
and durability evaluation.
The virtual durability process consists of five activities,
duty cycle development, computation of vehicle dynamic
behaviors and extraction of loads, pseudo damage
evaluation, structural modeling, and fatigue life evaluation.
It is important to note that the simulation of strength events,
those events which are expected to cause immediate and
perceptible damage to the vehicle, is also an important
aspect of durability. Simulations of such discrete events are
commonplace in today’s analysis environment and will not
be discussed further. From this point on the terms fatigue
and durability will be used interchangeably.
The following sections detail the activities which
constitute a virtual evaluation of fatigue life for military
ground vehicles and provides generic examples as
appropriate. The variability of the entire fatigue process is
then assessed including variations of testing
conditions/loads, materials, and geometry.
DUTY CYCLE DEVELOPMENT Commonly a vehicle Purchase Description (PD), Test
Operating Procedures (TOP), and other explicit requirement
documents can be used to determine the physical testing
duty cycle which has been deemed equivalent to operational
use and expected life. Duplicating the complete physical test
duty cycle in a virtual environment allows physical test
reports to be used as correlation for the virtual durability
process and ultimately enables vehicle designs to pass life
cycle testing on the first attempt. Establishing a high
confidence in the virtual process also enables additional
operational characteristics of low volume variant platforms
to be verified virtually with high confidence.
The duty cycle of a military ground vehicle is usually
characterized in an accelerated automotive duty cycle
combined with other discrete operational events which are
specific to a vehicle’s capability. The automotive duty cycle
can be made up of any combination of smooth roads,
secondary roads, rough roads such as washboards, potholes,
bumps, trails, dry river beds, cross country terrain, and so
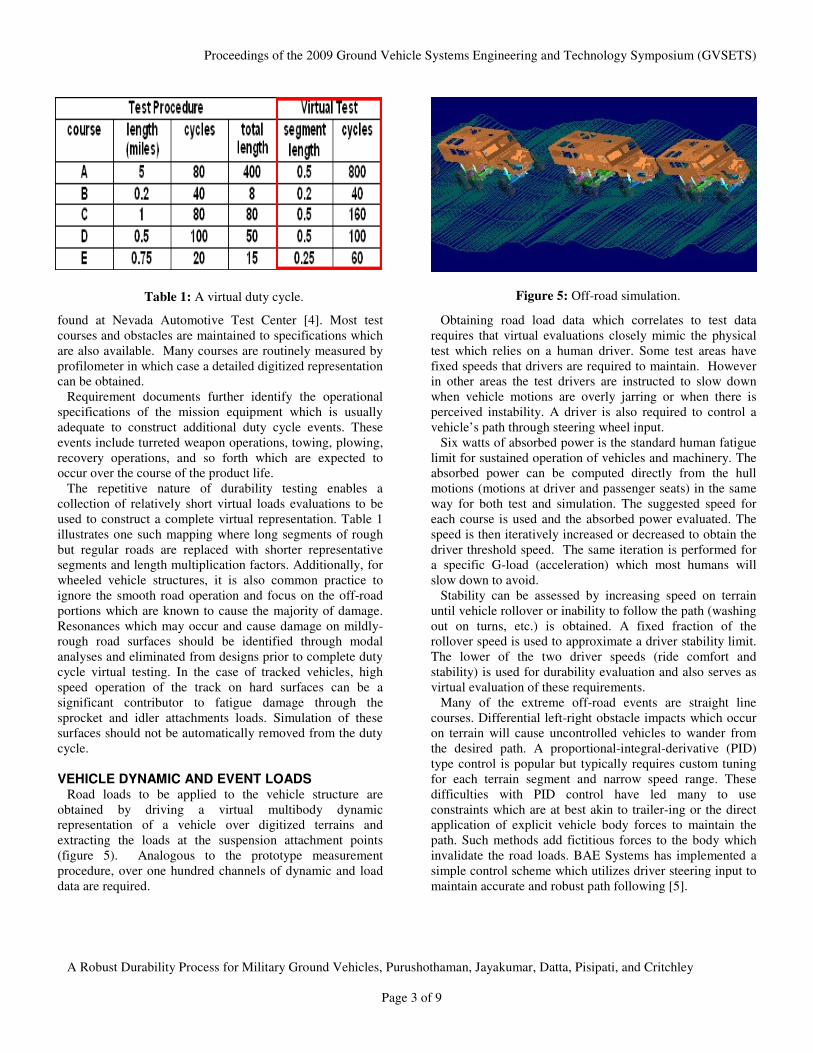
forth. Test courses can be characterized as shown in figure 4
where roughness can be measured in terms of RMS.
A selection of common off road courses and events can be
Figure 3: A virtual test durability process.
Figure 4: Characterization of terrains.
Increasing surface roughness
Primary Roads
Secondary Roads
Trails
X-Country
Course A
Course B
Course C
Course D
Course E
Page 3
Proceedings of the 2009 Ground Vehicle Systems Engineering and Technology Symposium (GVSETS)
A Robust Durability Process for Military Ground Vehicles, Purushothaman, Jayakumar, Datta, Pisipati, and Critchley
Page 3 of 9
found at Nevada Automotive Test Center [4]. Most test
courses and obstacles are maintained to specifications which
are also available. Many courses are routinely measured by
profilometer in which case a detailed digitized representation
can be obtained.
Requirement documents further identify the operational
specifications of the mission equipment which is usually
adequate to construct additional duty cycle events. These
events include turreted weapon operations, towing, plowing,
recovery operations, and so forth which are expected to
occur over the course of the product life.
The repetitive nature of durability testing enables a
collection of relatively short virtual loads evaluations to be
used to construct a complete virtual representation. Table 1
illustrates one such mapping where long segments of rough
but regular roads are replaced with shorter representative
segments and length multiplication factors. Additionally, for
wheeled vehicle structures, it is also common practice to
ignore the smooth road operation and focus on the off-road
portions which are known to cause the majority of damage.
Resonances which may occur and cause damage on mildly-
rough road surfaces should be identified through modal
analyses and eliminated from designs prior to complete duty
cycle virtual testing. In the case of tracked vehicles, high
speed operation of the track on hard surfaces can be a
significant contributor to fatigue damage through the
sprocket and idler attachments loads. Simulation of these
surfaces should not be automatically removed from the duty
cycle.
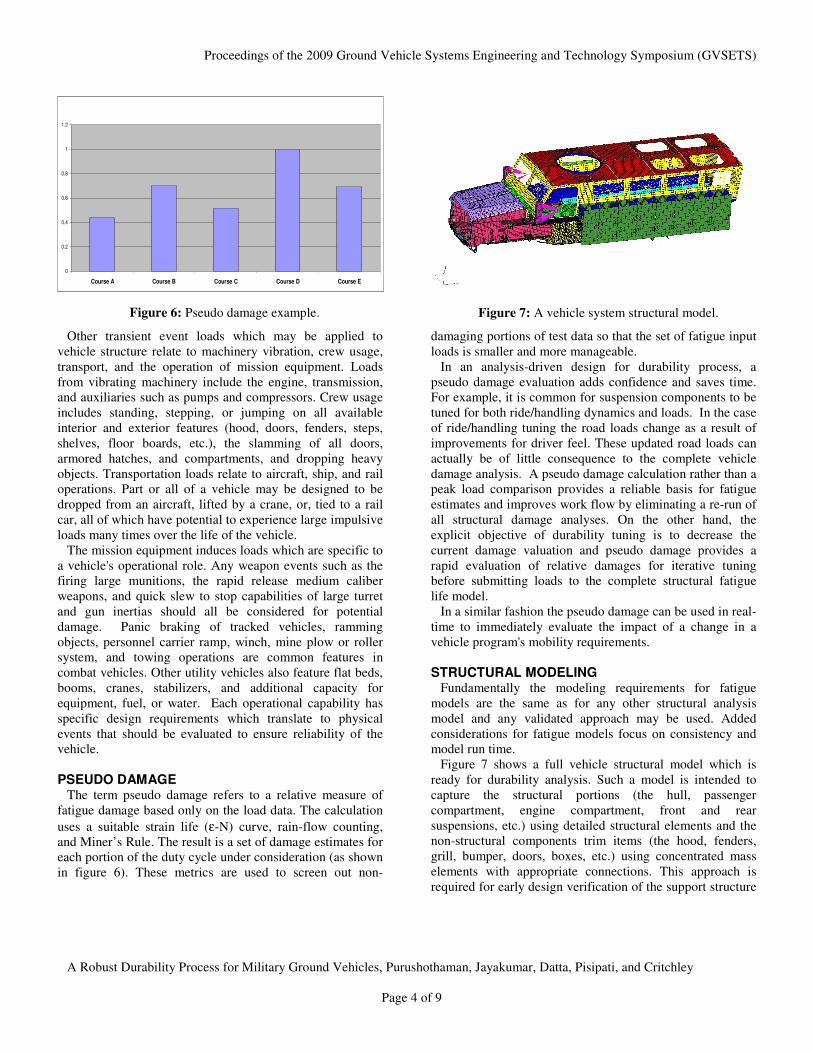
VEHICLE DYNAMIC AND EVENT LOADS Road loads to be applied to the vehicle structure are
obtained by driving a virtual multibody dynamic
representation of a vehicle over digitized terrains and
extracting the loads at the suspension attachment points
(figure 5). Analogous to the prototype measurement
procedure, over one hundred channels of dynamic and load
data are required.
Obtaining road load data which correlates to test data
requires that virtual evaluations closely mimic the physical
test which relies on a human driver. Some test areas have
fixed speeds that drivers are required to maintain. However
in other areas the test drivers are instructed to slow down
when vehicle motions are overly jarring or when there is
perceived instability. A driver is also required to control a
vehicle’s path through steering wheel input.
Six watts of absorbed power is the standard human fatigue
limit for sustained operation of vehicles and machinery. The
absorbed power can be computed directly from the hull
motions (motions at driver and passenger seats) in the same
way for both test and simulation. The suggested speed for
each course is used and the absorbed power evaluated. The
speed is then iteratively increased or decreased to obtain the
driver threshold speed. The same iteration is performed for
a specific G-load (acceleration) which most humans will
slow down to avoid.
Stability can be assessed by increasing speed on terrain
until vehicle rollover or inability to follow the path (washing
out on turns, etc.) is obtained. A fixed fraction of the
rollover speed is used to approximate a driver stability limit.
The lower of the two driver speeds (ride comfort and
stability) is used for durability evaluation and also serves as
virtual evaluation of these requirements.
Many of the extreme off-road events are straight line
courses. Differential left-right obstacle impacts which occur
on terrain will cause uncontrolled vehicles to wander from
the desired path. A proportional-integral-derivative (PID)
type control is popular but typically requires custom tuning
for each terrain segment and narrow speed range. These
difficulties with PID control have led many to use
constraints which are at best akin to trailer-ing or the direct
application of explicit vehicle body forces to maintain the
path. Such methods add fictitious forces to the body which
invalidate the road loads. BAE Systems has implemented a
simple control scheme which utilizes driver steering input to
maintain accurate and robust path following [5].
Table 1: A virtual duty cycle. Figure 5: Off-road simulation.
Page 4
Proceedings of the 2009 Ground Vehicle Systems Engineering and Technology Symposium (GVSETS)
A Robust Durability Process for Military Ground Vehicles, Purushothaman, Jayakumar, Datta, Pisipati, and Critchley
Page 4 of 9
Other transient event loads which may be applied to
vehicle structure relate to machinery vibration, crew usage,
transport, and the operation of mission equipment. Loads
from vibrating machinery include the engine, transmission,
and auxiliaries such as pumps and compressors. Crew usage
includes standing, stepping, or jumping on all available
interior and exterior features (hood, doors, fenders, steps,
shelves, floor boards, etc.), the slamming of all doors,
armored hatches, and compartments, and dropping heavy
objects. Transportation loads relate to aircraft, ship, and rail
operations. Part or all of a vehicle may be designed to be
dropped from an aircraft, lifted by a crane, or, tied to a rail
car, all of which have potential to experience large impulsive
loads many times over the life of the vehicle.
The mission equipment induces loads which are specific to
a vehicle's operational role. Any weapon events such as the
firing large munitions, the rapid release medium caliber
weapons, and quick slew to stop capabilities of large turret
and gun inertias should all be considered for potential
damage. Panic braking of tracked vehicles, ramming
objects, personnel carrier ramp, winch, mine plow or roller
system, and towing operations are common features in
combat vehicles. Other utility vehicles also feature flat beds,
booms, cranes, stabilizers, and additional capacity for
equipment, fuel, or water. Each operational capability has
specific design requirements which translate to physical
events that should be evaluated to ensure reliability of the
vehicle.
PSEUDO DAMAGE The term pseudo damage refers to a relative measure of
fatigue damage based only on the load data. The calculation
uses a suitable strain life (ε-N) curve, rain-flow counting,
and Miner’s Rule. The result is a set of damage estimates for
each portion of the duty cycle under consideration (as shown
in figure 6). These metrics are used to screen out non-
damaging portions of test data so that the set of fatigue input
loads is smaller and more manageable.
In an analysis-driven design for durability process, a
pseudo damage evaluation adds confidence and saves time.
For example, it is common for suspension components to be
tuned for both ride/handling dynamics and loads. In the case
of ride/handling tuning the road loads change as a result of
improvements for driver feel. These updated road loads can
actually be of little consequence to the complete vehicle
damage analysis. A pseudo damage calculation rather than a
peak load comparison provides a reliable basis for fatigue
estimates and improves work flow by eliminating a re-run of
all structural damage analyses. On the other hand, the
explicit objective of durability tuning is to decrease the
current damage valuation and pseudo damage provides a
rapid evaluation of relative damages for iterative tuning
before submitting loads to the complete structural fatigue
life model.
In a similar fashion the pseudo damage can be used in real-
time to immediately evaluate the impact of a change in a
vehicle program's mobility requirements.
STRUCTURAL MODELING Fundamentally the modeling requirements for fatigue
models are the same as for any other structural analysis
model and any validated approach may be used. Added
considerations for fatigue models focus on consistency and
model run time.
Figure 7 shows a full vehicle structural model which is
ready for durability analysis. Such a model is intended to
capture the structural portions (the hull, passenger
compartment, engine compartment, front and rear
suspensions, etc.) using detailed structural elements and the
non-structural components trim items (the hood, fenders,
grill, bumper, doors, boxes, etc.) using concentrated mass
elements with appropriate connections. This approach is
required for early design verification of the support structure
0
0.2
0.4
0.6
0.8
1
1.2
Course A Course B Course C Course D Course E
Figure 6: Pseudo damage example. Figure 7: A vehicle system structural model.
Page 5
Proceedings of the 2009 Ground Vehicle Systems Engineering and Technology Symposium (GVSETS)
A Robust Durability Process for Military Ground Vehicles, Purushothaman, Jayakumar, Datta, Pisipati, and Critchley
Page 5 of 9
and serves as a baseline model to further predict the
performance of any specific component or group of
components by substituting detailed local component models
into the full vehicle environment. In this way the system
shown in figure 7 is actually configured to test a hood design
in detail.
Shell elements are used throughout the hull where such
assumptions are valid and solid models are used for the cast
and forged components as found in the suspension and other
areas. For computational efficiency all elements are modeled
with linear shape functions. If loads are found to challenge
the linear approximation of the stiff vehicle structure then
either the load case is properly considered a strength event
or redesign is required as high cycle nonlinear deformations
will result in failure.
Special attention is given to the element quality at welded
and bolted connection areas where crack initiation is
expected to occur. An industry standard 5-7 mm mesh size is
used for the critical areas of the structure and a progressively
higher size is used away from the critical areas to manage
model size and computation time. Solid parts are also given
a coat of thin shells (of negligible stiffness) to obtain
accurate surface stresses for the linear elements.
FATIGUE LIFE There are two types of fatigue analyses in use for structural
durability. The first is stress based or σ-N analysis which is
applicable for low stress and high cycle fatigue. In vehicle
systems this corresponds to loads from high speed rotating
equipment such as the engine, transmissions, and auxiliaries.
The second is strain based or ε-N analysis which is
applicable for high stress, low cycle fatigue as from road
loads and other transient loads. A process of integrating the
strain based method is described here.
Typical operating loads can be broadly classified as quasi-
static or dynamic, with quasi-static accounting for over 90%
of all structural fatigue analysis. It is the dynamic/modal
response of the vehicle or component under the given
loading which determines whether the loading is to be
treated as quasi-static or dynamic.
When the flexible modes of the structure are much greater
than the dominant excitation frequency of the loads (3 to 4
times), it suffices to apply a quasi-static fatigue analysis. At
the other extreme transient simulations must be used.
A dynamic load analysis may be required if the validity of
the quasi-static assumption is in question. Typically modal
fatigue analysis entails a significant cost penalty over quasi-
static fatigue analysis and should be used only if the
following conditions are satisfied:
i. The dominant mode of the structure is
approximately equal to the dominant mode of the
loading excitation.
ii. The damage of the structure under quasi-static
fatigue analysis is significant.
The three frequency ranges ( «, ≈ , ») and conditions for
the modal/dynamic case can then be used to evaluate the
proper structural models and generate the basis stress on the
structure. The quasi-static method generates the six
components of the stress tensor for each element under unit
loading in each excitation degree of freedom. These stresses
are scaled by the road loads to generate the stress tensor time
history for each element.
For modal fatigue analysis, the modal stresses are
generated from unit excitations for all modes up to a pre-
determined maximum frequency of interest. This maximum
frequency is typically 1.75 to 2.5 times the maximum
excitation frequency of the loading.
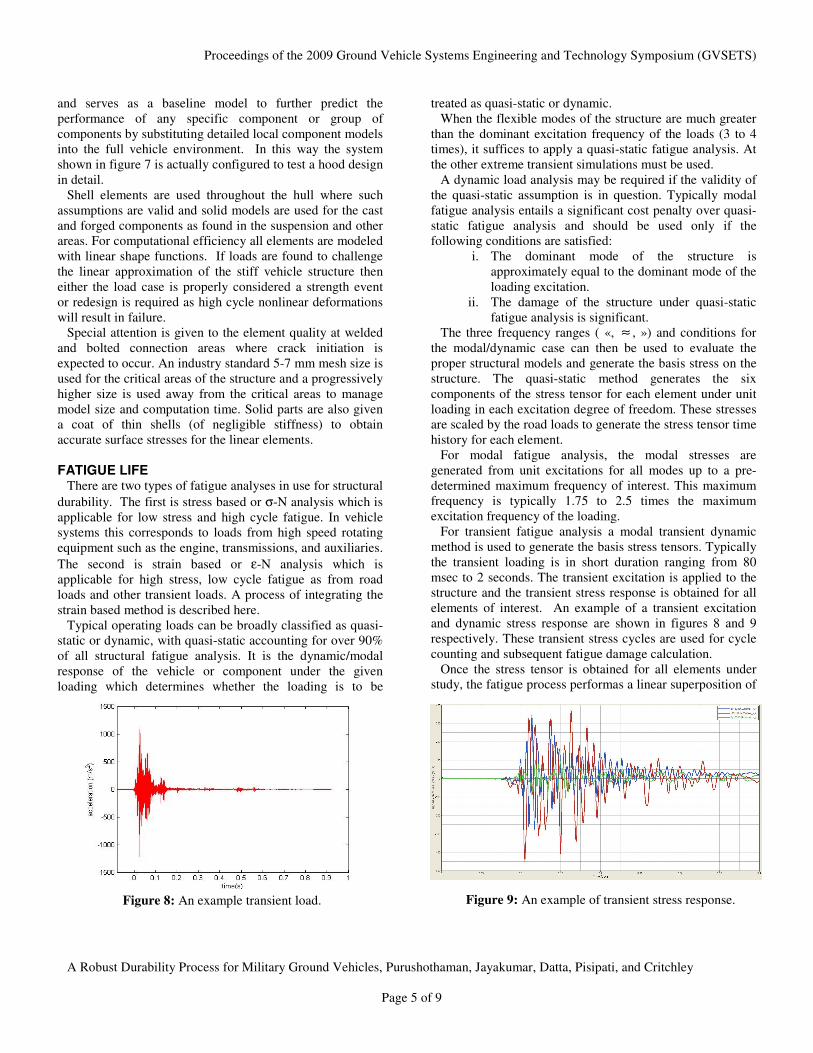
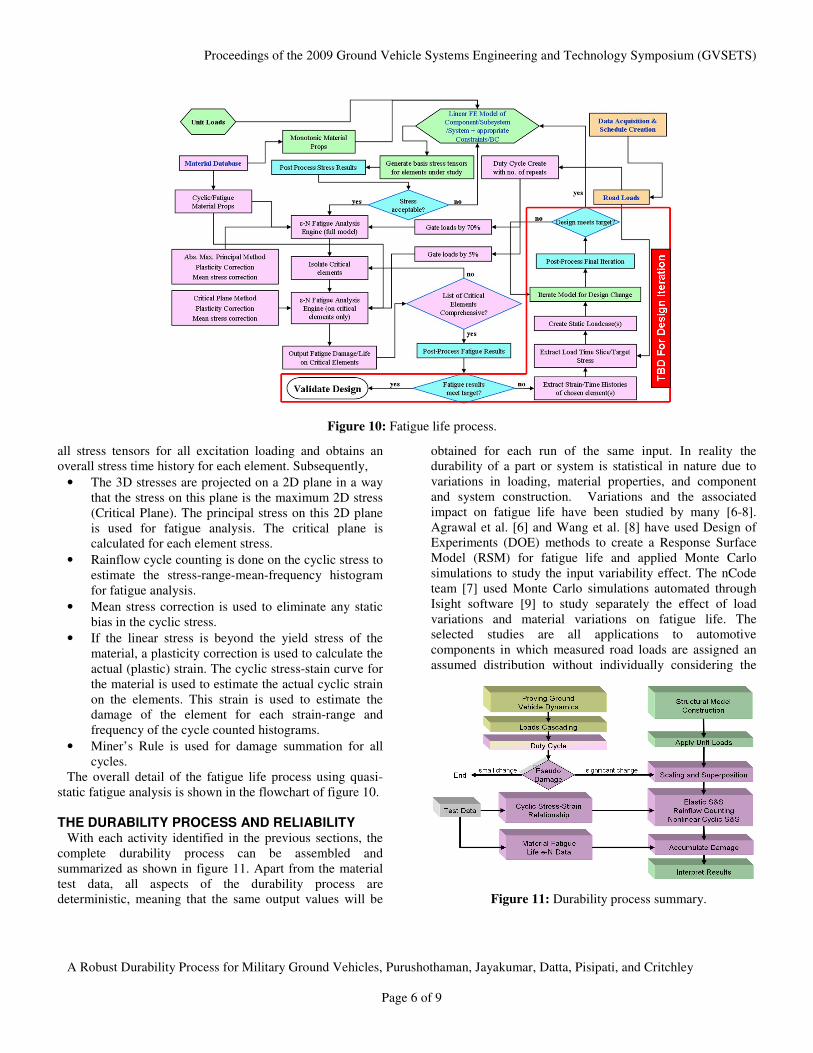
For transient fatigue analysis a modal transient dynamic
method is used to generate the basis stress tensors. Typically
the transient loading is in short duration ranging from 80
msec to 2 seconds. The transient excitation is applied to the
structure and the transient stress response is obtained for all
elements of interest. An example of a transient excitation
and dynamic stress response are shown in figures 8 and 9
respectively. These transient stress cycles are used for cycle
counting and subsequent fatigue damage calculation.
Once the stress tensor is obtained for all elements under
study, the fatigue process performas a linear superposition of
Figure 8: An example transient load. Figure 9: An example of transient stress response.
Page 6
Proceedings of the 2009 Ground Vehicle Systems Engineering and Technology Symposium (GVSETS)
A Robust Durability Process for Military Ground Vehicles, Purushothaman, Jayakumar, Datta, Pisipati, and Critchley
Page 6 of 9
all stress tensors for all excitation loading and obtains an
overall stress time history for each element. Subsequently,
• The 3D stresses are projected on a 2D plane in a way
that the stress on this plane is the maximum 2D stress
(Critical Plane). The principal stress on this 2D plane
is used for fatigue analysis. The critical plane is
calculated for each element stress.
• Rainflow cycle counting is done on the cyclic stress to
estimate the stress-range-mean-frequency histogram
for fatigue analysis.
• Mean stress correction is used to eliminate any static
bias in the cyclic stress.
• If the linear stress is beyond the yield stress of the
material, a plasticity correction is used to calculate the
actual (plastic) strain. The cyclic stress-stain curve for
the material is used to estimate the actual cyclic strain
on the elements. This strain is used to estimate the
damage of the element for each strain-range and
frequency of the cycle counted histograms.
• Miner’s Rule is used for damage summation for all
cycles.
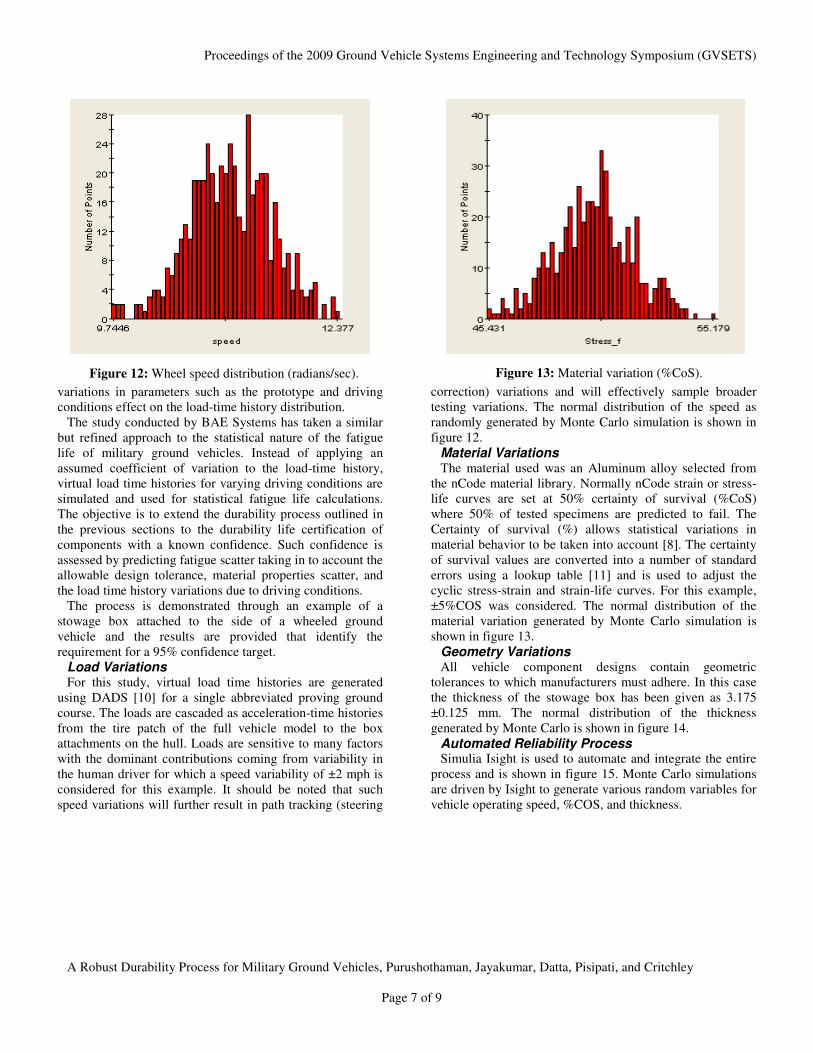
The overall detail of the fatigue life process using quasi-
static fatigue analysis is shown in the flowchart of figure 10.
THE DURABILITY PROCESS AND RELIABILITY With each activity identified in the previous sections, the
complete durability process can be assembled and
summarized as shown in figure 11. Apart from the material
test data, all aspects of the durability process are
deterministic, meaning that the same output values will be
obtained for each run of the same input. In reality the
durability of a part or system is statistical in nature due to
variations in loading, material properties, and component
and system construction. Variations and the associated
impact on fatigue life have been studied by many [6-8].
Agrawal et al. [6] and Wang et al. [8] have used Design of
Experiments (DOE) methods to create a Response Surface
Model (RSM) for fatigue life and applied Monte Carlo
simulations to study the input variability effect. The nCode
team [7] used Monte Carlo simulations automated through
Isight software [9] to study separately the effect of load
variations and material variations on fatigue life. The
selected studies are all applications to automotive
components in which measured road loads are assigned an
assumed distribution without individually considering the
Figure 10: Fatigue life process.
Figure 11: Durability process summary.
Page 7
Proceedings of the 2009 Ground Vehicle Systems Engineering and Technology Symposium (GVSETS)
A Robust Durability Process for Military Ground Vehicles, Purushothaman, Jayakumar, Datta, Pisipati, and Critchley
Page 7 of 9
variations in parameters such as the prototype and driving
conditions effect on the load-time history distribution.
The study conducted by BAE Systems has taken a similar
but refined approach to the statistical nature of the fatigue
life of military ground vehicles. Instead of applying an
assumed coefficient of variation to the load-time history,
virtual load time histories for varying driving conditions are
simulated and used for statistical fatigue life calculations.
The objective is to extend the durability process outlined in
the previous sections to the durability life certification of
components with a known confidence. Such confidence is
assessed by predicting fatigue scatter taking in to account the
allowable design tolerance, material properties scatter, and
the load time history variations due to driving conditions.
The process is demonstrated through an example of a
stowage box attached to the side of a wheeled ground
vehicle and the results are provided that identify the
requirement for a 95% confidence target.
Load Variations For this study, virtual load time histories are generated
using DADS [10] for a single abbreviated proving ground
course. The loads are cascaded as acceleration-time histories
from the tire patch of the full vehicle model to the box
attachments on the hull. Loads are sensitive to many factors
with the dominant contributions coming from variability in
the human driver for which a speed variability of ±2 mph is
considered for this example. It should be noted that such
speed variations will further result in path tracking (steering
correction) variations and will effectively sample broader
testing variations. The normal distribution of the speed as
randomly generated by Monte Carlo simulation is shown in
figure 12.
Material Variations The material used was an Aluminum alloy selected from
the nCode material library. Normally nCode strain or stress-
life curves are set at 50% certainty of survival (%CoS)
where 50% of tested specimens are predicted to fail. The
Certainty of survival (%) allows statistical variations in
material behavior to be taken into account [8]. The certainty
of survival values are converted into a number of standard
errors using a lookup table [11] and is used to adjust the
cyclic stress-strain and strain-life curves. For this example,
±5%COS was considered. The normal distribution of the
material variation generated by Monte Carlo simulation is
shown in figure 13.
Geometry Variations All vehicle component designs contain geometric
tolerances to which manufacturers must adhere. In this case
the thickness of the stowage box has been given as 3.175
±0.125 mm. The normal distribution of the thickness
generated by Monte Carlo is shown in figure 14.
Automated Reliability Process Simulia Isight is used to automate and integrate the entire
process and is shown in figure 15. Monte Carlo simulations
are driven by Isight to generate various random variables for
vehicle operating speed, %COS, and thickness.
Figure 12: Wheel speed distribution (radians/sec). Figure 13: Material variation (%CoS).
Page 8
Proceedings of the 2009 Ground Vehicle Systems Engineering and Technology Symposium (GVSETS)
A Robust Durability Process for Military Ground Vehicles, Purushothaman, Jayakumar, Datta, Pisipati, and Critchley
Page 8 of 9
After each set of random values are provided by the Monte
Carlo engine, Isight automatically submits in order the
DADS, NASTRAN, and nCode evaluations to provide a
single fatigue life value. Isight has a standard NASTRAN
component which takes the thickness variable and runs
NASTRAN to provide an output file containing elemental
stresses for unit loading. DADS and nCode have batch
interfaces which are run by custom scripts. These scripts are
executed by Isight through a component called Simcode.
For each operating speed value, DADS computes the load
time history for the whole vehicle over terrain and provides
cascaded stowage box attachment acceleration time
histories. nCode takes these accelerations and time histories
and the elemental stresses from NASTRAN and the %COS
to compute the damage for all elements and writes out
logarithmic life (log life) of the element with the lowest
value.
RESULTS AND DISCUSSION Five hundred Monte Carlo simulations were run on a
single desktop computer overnight. The log life response
probability distribution and cumulative distribution are
shown in figures 16 and 17. The probability distribution of a
log life is a normal distribution as expected. The mean life is
3.76 repeats of the given duty cycle with a standard
deviation of 0.074. Values of life at three standard deviations
above and below the mean are 6.27 and 2.25 respectively.
From the cumulative distribution, it can be interpreted that
at 50% confidence the life is 3.76 repeats and at 95%
confidence the life is 2.87. The ratio of 50% confidence
value to 95% confidence value is 1.3 for this particular
study. A factor of safety of 2 to 4 is the current automotive
industry value being applied to the analytically predicted
fatigue life to account for all variability.
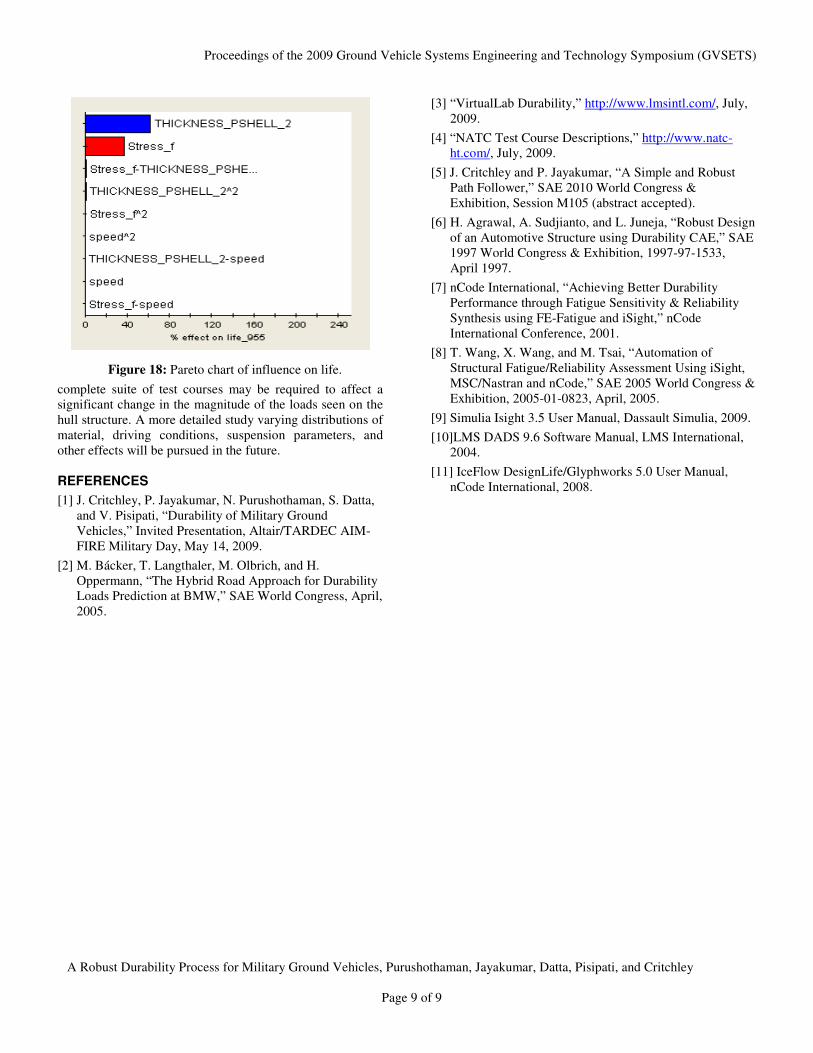
The effect of various factors has been shown in the Pareto
chart of figure 18. The box thickness design tolerance, even
though very small, has the most influence on fatigue life
followed by the material properties. To influence the
variations of fatigue life, larger speed variations or the
Figure 14: Thickness variation (mm).
Figure 16: Log life probability distribution.
Figure 17: Log life cumulative distribution.
Figure 15: Isight process.
Page 9
Proceedings of the 2009 Ground Vehicle Systems Engineering and Technology Symposium (GVSETS)
A Robust Durability Process for Military Ground Vehicles, Purushothaman, Jayakumar, Datta, Pisipati, and Critchley
Page 9 of 9
complete suite of test courses may be required to affect a
significant change in the magnitude of the loads seen on the
hull structure. A more detailed study varying distributions of
material, driving conditions, suspension parameters, and
other effects will be pursued in the future.
REFERENCES
[1] J. Critchley, P. Jayakumar, N. Purushothaman, S. Datta,
and V. Pisipati, “Durability of Military Ground
Vehicles,” Invited Presentation, Altair/TARDEC AIM-
FIRE Military Day, May 14, 2009.
[2] M. Bácker, T. Langthaler, M. Olbrich, and H.
Oppermann, “The Hybrid Road Approach for Durability
Loads Prediction at BMW,” SAE World Congress, April,
2005.
[3] “VirtualLab Durability,” http://www.lmsintl.com/, July,
2009.
[4] “NATC Test Course Descriptions,” http://www.natc-
ht.com/, July, 2009.
[5] J. Critchley and P. Jayakumar, “A Simple and Robust
Path Follower,” SAE 2010 World Congress &
Exhibition, Session M105 (abstract accepted).
[6] H. Agrawal, A. Sudjianto, and L. Juneja, “Robust Design
of an Automotive Structure using Durability CAE,” SAE
1997 World Congress & Exhibition, 1997-97-1533,
April 1997.
[7] nCode International, “Achieving Better Durability
Performance through Fatigue Sensitivity & Reliability
Synthesis using FE-Fatigue and iSight,” nCode
International Conference, 2001.
[8] T. Wang, X. Wang, and M. Tsai, “Automation of
Structural Fatigue/Reliability Assessment Using iSight,
MSC/Nastran and nCode,” SAE 2005 World Congress &
Exhibition, 2005-01-0823, April, 2005.
[9] Simulia Isight 3.5 User Manual, Dassault Simulia, 2009.
[10]LMS DADS 9.6 Software Manual, LMS International,
2004.
[11] IceFlow DesignLife/Glyphworks 5.0 User Manual,
nCode International, 2008.
Figure 18: Pareto chart of influence on life.