1 A Robust Voice Activity Detector for Wireless Communications Using Soft Computing Francesco Beritelli, Member IEEE, Salvatore Casale, Member IEEE, Alfredo Cavallaro Istituto di Informatica e Telecomunicazioni - University of Catania V.le A. Doria 6, 95125 - Italy email: (beritelli, casale, acavallaro)@iit.unict.it Manuscript received date: 15/09/97 Manuscript revised date: 6/03/1998 Abstract Discontinuous transmission based on speech/pause detection represents a valid solution to improve the spectral efficiency of new-generation wireless communication systems. In this context, robust Voice Activity Detection (VAD) algorithms are required, as traditional solutions present a high misclassification rate in the presence of the background noise typical of mobile environments. This paper presents a voice detection algorithm which is robust to noisy environments thanks to a new methodology adopted for the matching process. More specifically, the VAD proposed is based on a pattern recognition approach in which the matching phase is performed by a set of six fuzzy rules trained by means of a new hybrid learning tool. A series of objective tests performed on a large speech database, varying the signal-to-noise ratio, the types of background noise and the input signal level, showed that, as compared with the VAD recently standardized by ITU-T in Rec. G.729 Annex B, the Fuzzy VAD on average achieves an improvement in reduction both of the activity factor of about 25 % and of the clipping introduced of about 43 %. Informal listening tests also confirm an improvement in the perceived speech quality. Keywords: Voice activity detection, Speech coding, Mobile communications, Fuzzy logic, Pattern recognition Correspondence address: Prof. Salvatore Casale Istituto di Informatica e Telecomunicazioni - University of Catania V.le A. Doria 6, 95125, Catania - Italy Phone: +39 +95 339449 Fax: +39 +95 338280 email: [email protected]
Transcript
1
A Robust Voice Activity Detector for Wireless CommunicationsUsing Soft Computing
Francesco Beritelli, Member IEEE, Salvatore Casale, Member IEEE, Alfredo CavallaroIstituto di Informatica e Telecomunicazioni - University of Catania
V.le A. Doria 6, 95125 - Italyemail: (beritelli, casale, acavallaro)@iit.unict.it
Manuscript received date: 15/09/97
Manuscript revised date: 6/03/1998
Abstract
Discontinuous transmission based on speech/pause detection represents a valid solution to improve
the spectral efficiency of new-generation wireless communication systems. In this context, robust
Voice Activity Detection (VAD) algorithms are required, as traditional solutions present a high
misclassification rate in the presence of the background noise typical of mobile environments. This
paper presents a voice detection algorithm which is robust to noisy environments thanks to a new
methodology adopted for the matching process. More specifically, the VAD proposed is based on a
pattern recognition approach in which the matching phase is performed by a set of six fuzzy rules
trained by means of a new hybrid learning tool. A series of objective tests performed on a large
speech database, varying the signal-to-noise ratio, the types of background noise and the input
signal level, showed that, as compared with the VAD recently standardized by ITU-T in Rec. G.729
Annex B, the Fuzzy VAD on average achieves an improvement in reduction both of the activity
factor of about 25 % and of the clipping introduced of about 43 %. Informal listening tests also
confirm an improvement in the perceived speech quality.
Prof. Salvatore CasaleIstituto di Informatica e Telecomunicazioni - University of CataniaV.le A. Doria 6, 95125, Catania - ItalyPhone: +39 +95 339449 Fax: +39 +95 338280email: [email protected]
2
1. Introduction
Interest in more efficient communication systems that are capable of providing a better quality of
service (QoS) has increased in the last few years. This need is particularly felt in the field of
wireless communications, where the features determining the QoS are more critical and numerous.
One important aspect of recent digital cellular systems is the robustness of the speech coding
algorithms needed for the channel to be used efficiently: they have to be robust not only to channel
degradation, but also to the background noise typical of mobile environments.
The use of speech compression techniques, in fact, has become fundamental in various fields of
application, from the telephone service sector where, in both wired and wireless networks, an
increasing reduction in bandwidth is required, to multimedia systems, in which efficient information
storage is also necessary. The recent growth of mobile and multimedia communications has
increased the demand for a new generation of very low bit-rate speech coders capable of providing
a trade-off between perceptive quality and computational complexity tailored to the application.
Recently, the ITU-T (International Telecommunication Union - Telecommunications Sector)
proposed a new toll-quality 8 kbit/s standard (G.729) and a reduced-complexity version (G.729
annex A) designed for simultaneous voice and data in multimedia communications [1]. Further,
thanks to a new generation of efficient speech compression algorithms, the goal of a toll-quality
coding for bit-rates below 4 kbit/s gets closer and closer, so new standardization activities are
proceeding in this direction [2].
A significative reduction in the bit rate can, however, be achieved not only by developing new,
more efficient coding models, but also by silence compression, detecting the pauses in a typical
telephone conversation by means of a Voice Activity Detector (VAD). As is well known, in fact,
the bit rate needed for a perceptually faithful representation of silence or background noise is
considerably lower than the bit rate used for active speech coding.
A Voice Activity Detector (VAD) aims to distinguish between speech and several types of acoustic
background noise even with low signal-to-noise ratios (SNRs). Therefore, in a typical telephone
conversation, a VAD, together with a comfort noise generator (CNG), achieves a silence
compression. In the field of multimedia communications, silence compression allows the speech
channel to be shared with other information, thus guaranteeing simultaneous voice and data
applications [1][3]. Statistical multiplexing of several telephone conversations is also based on
pause detection by means of a Digital Speech Interpolator (DSI) [4]. In a cellular radio system that
uses the Discontinuous Transmission (DTX) mode, such as the Global System for Mobile
communications (GSM), a VAD reduces co-channel interference, increasing the number of radio
channels, and power consumption in portable equipment. Moreover, a VAD is vital to reduce the
3
average bit rate in future generations of digital cellular networks, such as the Universal Mobile
Telecommunication Systems (UMTS), which provide for variable bit-rate (VBR) speech coding
[5][6][7]. In this context, most of the capacity gain is due to the distinction between speech activity
and inactivity.
As is well known, above all with low SNRs, the speech/pause classifier must be robust to every
type of background noise in that the performance of a VAD is critical for the overall speech quality.
When some of speech frames are detected as noise, intelligibility is seriously impaired due to
speech clipping in the conversation. If, on the other hand, the percentage of noise detected as speech
is high, the potential advantages of silence compression are not obtained [1]. In the presence of
background noise it may be difficult to distinguish between speech and silence, so for voice activity
detection in wireless environments more efficient algorithms are needed [8, 12].
The activity detection algorithm proposed in this paper is based on a pattern recognition approach in
which the feature extraction module uses the same set of acoustic parameters adopted by the VAD
recently standardized by ITU-T in Rec. G.729 annex B [13][14] , but the matching phase is based
on Fuzzy Logic (FL) [15]. The set of fuzzy rules was obtained automatically by a new hybrid
learning tool, FuGeNeSys [16][17], which exploits the advantages of Neural Networks (NNs),
Genetic Algorithms (GAs) and Fuzzy Logic. These methodologies, which belong to a large subclass
of artificial intelligence called Soft Computing [15], have been introduced for intelligent signal
processing since they often give better performance levels than traditional methods. Fuzzy logic, for
example, is a simple, robust, non-linear technique developed to allow formal management of
uncertainty and imprecision, which recently has proved to be a valid alternative in the field of
robust speech classification as well [8][12][18, 23].
Through a series of performance comparisons with the ITU-T G.729 annex B VAD and the VAD
standardized by ETSI (European Telecommunications Standards Institute) for the GSM mobile
communication system [24], varying the type of background noise and the signal-to-noise ratios, we
outline the validity of the new methodology in terms of both communication quality improvement
and bit-rate reduction as compared with the traditional solution.
The paper is organized as follows. Section 2 presents a brief review of the VADs standardized by
ETSI for the GSM system in Rec. 06.32 and by ITU-T in Rec. G.729 Annex B. In Section 3 we
describe the objective and subjective methods for the performance evaluation of a Voice Activity
Detector. The hybrid learning tool used for fuzzy rule extraction is briefly described in Section 4.
Section 5 presents the new fuzzy logic-based voice activity detection algorithm. A performance
evaluation of the proposed VAD and a comparison with traditional solutions are presented in
Section 6. Section 7 concludes the paper.
4
2. Review of reference VADs considered
In this section we describe two main algorithms for voice activity detection, considered as
references in the performance evaluation and comparison phase: the VAD standardized by ETSI for
the GSM system, and the VAD standardized by ITU-T for the 8 kbit/s G.729 speech coder [1].
2.1 The ETSI VAD for the GSM System
The GSM VAD is essentially an energy detector based on an adaptive threshold mechanism. The
input for the activity/inactivity classification is some parameters calculated by the GSM codec on
frames of 160 samples (20 ms). The input signal is filtered by an adaptive analysis filter to reduce
the amount of background noise, the coefficients of which are calculated from the autocorrelation
coefficients of the input signal averaged out over four consecutive frames. This average operation
gives a more reliable voice/noise discrimination. The threshold and the adaptive filter coefficients
are usually updated only when there is no speech, i.e. during periods comprising only noise.
This event occurs if at least one of the following conditions is verified:
- the energy of the signal is very low;
- the speech signal spectrum is stationary, and the signal does not contain a periodic component or
sinusoids relating to network information tones.
Signal stationarity is calculated by the Likelihood Ratio (LHR) between the coefficients of the
current LPC (Linear Predictive Coding) filter and the average over the last four frames. When the
LHR spectral distortion is lower than a fixed threshold, the signal is considered to be stationary. The
presence of a periodic component is determined using the pitch values calculated by the GSM
speech coder every 5 ms.
To prevent pauses between syllables from being misclassified as periods of inactivity, thus causing
speech clipping, the active voice decision is maintained for a period of 5 frames (100 ms). This
hangover period is only added when the VAD has detected active speech for at least three
consecutive frames, thus excluding the likelihood that occasional disturbances present in silent
periods will prolong the period misdetected as being active. The main feature of this VAD is that it
is a “fail-safe” system, i.e. one which in doubtful cases indicates active speech rather than silence.
2.2 The ITU-T VAD for G.729
Recently, a new VAD was standardized by ITU-T in Rec. G.729 Annex B [13][14]; it allows the
ITU-T G.729 8 kbit/s speech coder to select between two operative coding modes: if the VAD flag
is 1, the speech codec is invoked to code/decode active voice frames; if the VAD output is 0,
DTX/CNG algorithms are used to code/decode non-active voice frames.
5
The parameters adopted by the G.729 Annex B standard for voice activity detection are calculated
in a window of 80 speech samples (a 10-ms frame, sampling at 8 kHz) and are:
• The full-band energy difference ∆Ef ;
• The low-band energy difference ∆El;
• The zero-crossing difference ∆ZC;
• The spectral distortion ∆S.
More specifically, all these differential parameters are the difference between each parameter and
its respective long-term average. The long-term averages of the parameters are updated only in the
presence of background noise, so they follow the changing nature of the background noise. For the
first Ni = 32 frames an initialization stage of the long-term averages takes place and the voice
activity decision is forced to 1 (activity mode) if the frame full band energy is above 15 dB;
otherwise the voice activity decision is forced to 0 (inactivity mode). If the frame number is equal to
Ni, an initialization stage for the characteristic energies of the background noise occurs. Then a set
of difference parameters are calculated as the difference between the current frame parameters and
running averages of the background noise characteristics.
In the next stage, the initial voice activity decision is made using multi-boundary decision regions in
the space of the four difference measures. The active voice decision is given as the union of the
decision regions and the non-active voice decisions is its complementary logical decision.
The generic boundary decision in the four-dimensional space is as follows:
IF ∆Pi < a⋅ ∆Pk + b THEN Flag =1 i, k=1, ..., 4 (1)
where ∆Pi and ∆Pk are two of the four differential parameters; a and b are constants. If none of 14
conditions like (1) is “TRUE” the Flag is set to 0. The final decision is given by the energy
consideration together with the last two frame decisions (smoothing decision).
3. Performance evaluation methods
Literature provides objective and subjective criteria for measuring performance and comparing two
different VADs. As regards the objective tests, in order to evaluate the amount of clipping and how
often noise is detected as speech, the VAD outputs are compared with those of an ideal VAD. The
performance of the VADs was evaluated on the basis of the following four traditional parameters
[25]:
• FEC (Front End Clipping): clipping introduced in passing from noise to speech activity;
6
• MSC (Mid Speech Clipping): clipping due to speech misclassified as noise;
• OVER: noise interpreted as speech due to the VAD flag remaining active in passing from speech
activity to noise;
• NDS (Noise Detected as Speech): noise interpreted as speech within a silence period.
These four parameters are illustrated in Fig. 1. The first two parameters, FEC and MSC, give the
amount of clipping introduced, whereas OVER and NDS give the increment in the activity factor.
In addition, as a simple percentage of misclassification gives no information about the amount or
duration of the clipping, it is useful to evaluate the degradations by means of outlier measurements
relative to the distribution of clipping [26].
Although the method described above provides useful objective information concerning the
performance of a VAD, it only gives an initial estimate as regards the subjective effect. For
example, the effects of speech signal clipping can at times be hidden by the presence of background
noise and it depends on the model chosen for the comfort noise synthesis, so some of the clipping
measured with objective tests is in reality not audible. It is therefore important to carry out
subjective tests on the VADs, the main aim of which is to ensure that the clipping perceived is
acceptable. This kind of test requires a certain number of listeners to judge recordings containing
the processing results of the VADs being tested. The listeners have to give marks on the following
features:
• Quality;
• Comprehension difficulty;
• Audibility of clipping.
These marks, obtained by listening to several speech sequences, are then used to calculate average
results for each of the features listed above, thus providing a global estimate of the behaviour of the
VAD being tested. To conclude, whereas objective methods are very useful in an initial stage to
evaluate the quality of a VAD, subjective methods are more significant. As, however, they are more
expensive (since they require the participation of a certain number of people for a few days) they
are generally only used when a proposal is about to be standardized.
4. The learning tool used for fuzzy rule extraction
A more efficient alternative to deal with the problem of voice activity detection is to use
methodologies like fuzzy logic which are suitable for problems requiring approximate rather than
exact solutions, and which can be represented through descriptive or qualitative expressions, in a
more natural way than mathematical equations. More specifically, the VAD proposed in this work
uses a set of fuzzy rules as the matching phase. The rules governing a fuzzy system are often
7
written using linguistic expressions which formalize the empirical rules by means of which a human
operator is able to describe the process in question using his own experience. Fuzzy rules are
therefore generally obtained manually according to heuristic criteria derived from knowledge of the
problem. This approach, however, may have great drawbacks when no a priori knowledge is
available about the input-output link the fuzzy system has to provide, or when it is highly complex
or non-linear. In addition it requires a long refinement phase in the definition of the term sets of
each input variable which optimize the system (e.g. low, medium, high).
In this paper we have adopted the FuGeNeSys (Fuzzy Genetic Neural System) tool [16-17]. It
represents a new fuzzy learning approach based on genetic algorithms and neural networks which
obtains the fuzzy rules in a supervised manner. The advantage of this is that the fuzzy knowledge
base is created automatically. The tool also makes it possible to obtain the minimum set of fuzzy
rules for optimization of the problem, discarding any rules that are of no use.
The main features of FuGeNeSys are:
• the number of rules needed for learning is always very low. In the various applications
developed the number has always been below ten [8][12][17, 23];
• the learning error is comparable to, if not better than, that of other techniques described in
literature;
• simplified fuzzy knowledge bases can be generated, i.e. the tool is capable of eliminating the
unnecessary antecedents in any rule;
• significant features are correctly identified;
The tool can be used in both classification and interpolation problems.
Below we will give a brief outline of the basic procedures followed by the learning tool used for
fuzzy rule extraction.
4.1 Genetic algorithms
GAs have been deeply investigated for two decades as a possible approach to solving many search
and optimization problems [27]. These algorithms are a sort of artificial evolution of virtual
individuals, selected by means of a Fitness Function.
In practice, GAs are a robust way to search for the global optimum of a generic function with
several variables; they are very flexible and not sensitive to the classical problem of local optimum.
The flow of our GA can be simply explained as follows:
• t=0 ;
• P(0)=(P1,P2,...,PN);
• While not (End Condition) do
8
⇒ Generate PR from P(t), applying reproduction operator;
⇒ Generate PC from PR, applying crossover operator;
⇒ Generate PM from PC, applying mutation operator;
⇒ Generate PH from PM applying hill descending operator;
• P(t+1)= PH
• t=t+1 ;
• end while.
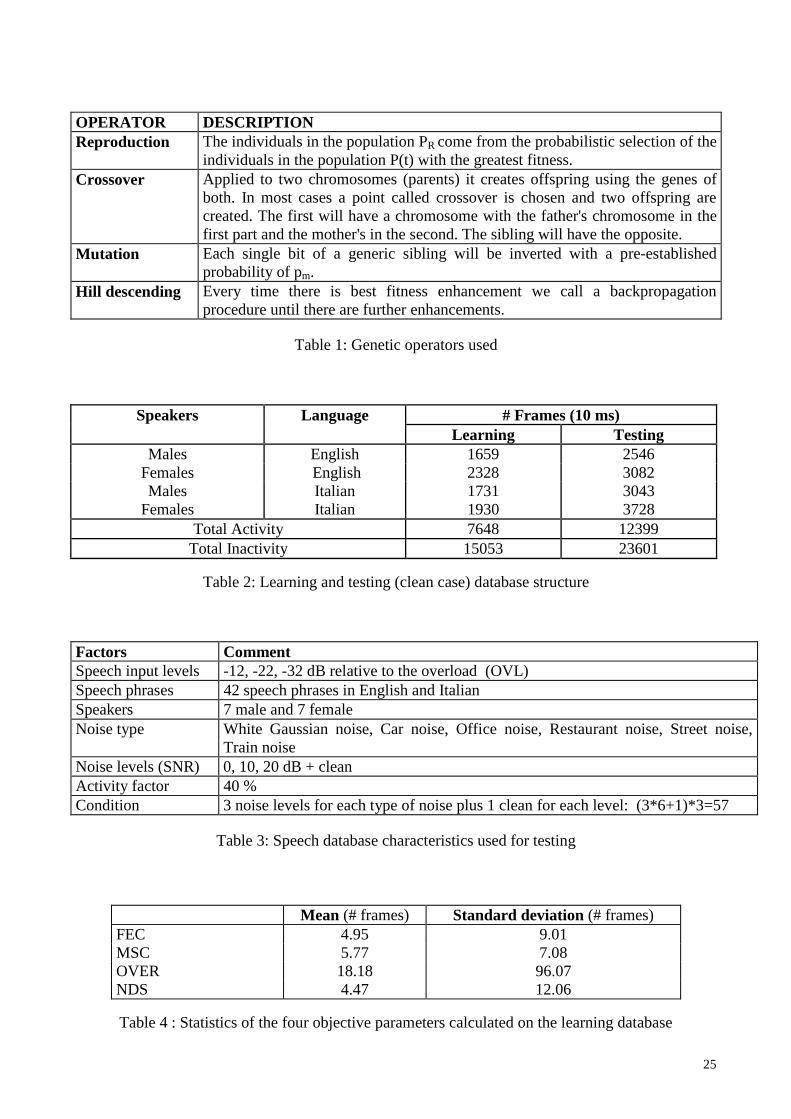
The operations performed by the genetic operators are described in Table 1.
We maintain the best solution in the population because it is proved that canonical GAs will never
converge to the global optimum. In order to enhance performance in terms of execution time and
minimization of GA error an equivalent NN was associated to processing of the fuzzy rules. The
resulting network is a three-layered one. This is the non-standard genetic operator mentioned above
as the hill descending operator. There is an autonomous mechanism to adjust the learning speeds in
this equivalent network, establishing different learning rates at different layers. Therefore the
mixture of GAs and NNs generates a fuzzy inference, i.e. fuzzy rules and tuned membership
functions.
4.2 The fuzzy inferential method adopted and its coding
Each individual in the genetic population is a set of R fuzzy rules. Each rule comprises I inputs
(antecedents) and O outputs (consequents) represented by an equal number of fuzzy sets connected
by the fuzzy operator AND (i.e. minimum). The membership functions are Gaussians which can
thus be characterized by a center and a variance.
Every element is therefore an individual whose genetic heritage is made up of the sequence of I
inputs and O outputs for all the R rules, giving a total of (I+O)R fuzzy sets.
As we used this tool in classification we adopted the Weighted Mean (WM) defuzzification method
which offers better results in this kind of problem.
Let us illustrate the equations used to calculate the fuzzy inferences in greater detail. Each rule has a
maximum of I antecedents. For the generic r-th rule, the i-th antecedent Pir has the following form:
Pir=(Xi is FSir) (2)
Xi is the i-th input and is crisp. That is, Xi is the fuzzy set which is always null with the exception of
the numerical value xi, for which the degree of membership assumes the value 1. FSir is a fuzzy set.
9
It has a Gaussian membership function µir(x), univocally determined by a centre cir and a variance
parameter γir according to the following equation:
2)(2)(ir
ircxirex−−
=γ
µ (3)
Considering the crisp nature of the inputs, the degree of truth αir of a generic antecedent Pir is:
2)(2
irircixire
−−=
γα (4)
The connector between the various antecedents is always AND, as calculated by Zadeh [15]. So the
degree of truth, θr, of the r-th rule is the least of the degrees of truth αir for the antecedents
belonging to the rule:
ir1minr αθ Ii== (5)
For the conclusion of the rules, each rule has an associated numerical output value zr. Using WM
defuzzification means that the higher the degree of truth of a rule, the closer the defuzzified value y
will be to zr.
The analytical expression of this defuzzification method is:
∑
∑R
1=r r
R1=r r
=yθ
θ rz(6)
where zr are crisp values (output singletons).
Fig.2 gives a practical example of calculation of a fuzzy inference made up of only two rules. The
inference has two rules, two inputs X1 and X2 and an output Y.
4.3 Fuzzy inference complexity
The computational load of a fuzzy system is very low. For a software implementation it is possible
to compute the degrees of truth of a premise θ simply through look-up tables. Therefore, using a
fuzzy system with R rules, I inputs and O outputs, to compute the degree of activation of the rules,
R⋅I memory accesses are needed to calculate the degree of truth of the antecedents, R minimum
operations among I values to calculate the degree of truth of the premises of the rules θr, and R⋅O
products, 2(R⋅O-1) sums and O divisions for the defuzzification process.
10
5. The Fuzzy Voice Activity Detector
The problem of activity detection is decisive for speech quality, especially in mobile environments
where communication occurs against a noisy background. As we shall see in Section 6, the
performance of the ITU-T G.729 VAD standard degrades above all in the presence of background
noise. In order to improve the ITU-T VAD performance, in this Section we propose a new valid
alternative that is very robust even in wireless environments with low SNRs.
5.1 Functional scheme of the FVAD
The functional scheme of the Fuzzy Voice Activity Detector (FVAD) is shown in Fig. 3. It is based
on a traditional pattern recognition approach [28][29]: the set of parameters calculated in the feature
extraction phase are the same as those used in G.729, whereas the matching phase is performed by a
set of six fuzzy rules obtained automatically through the new hybrid learning tool described in
Section 4. For the training phase of the fuzzy system, the frames of several clean speech sequences,
spoken by male and female speakers, were marked manually as belonging to the activity and non-
activity classes.
As is well known, a fuzzy system allows a gradual, continuous transition rather than a sharp change
between two values. So, the Fuzzy VAD proposed returns a continuous output ranging from 0 (Non
Activity) to 1 (Activity), which does not depend on whether the single inputs have exceeded a
threshold or not, but on an overall evaluation of the values they have assumed. The FVAD
translates several individual parameters into a single continuous value which, in our case, indicates
the degree of membership in the Activity class and the complement of the degree of membership in
the Non-Activity class.
The final decision is made by comparing the output of the fuzzy system, which varies in a range
between 0 and 1, with a fixed threshold experimentally chosen by minimizing the total error
(FEC+MSC+OVER+NDS) and the standard deviation of the MSC and NDS parameters. In this
way we found an appropriate value for the hangover module that satisfies the MSC and NDS
statistics, reducing the total error. The hangover mechanism chosen is similar to that adopted by the
GSM [24].
5.2 Speech database
The speech database used to obtain the learning and testing patterns contains sequences recorded in
a non-noisy environment (Clean sequences, SNR=60 dB), sampled at 8000 Hz and linearly
quantized at 16 bits per sample. It consists of 60 speech phrases (in English and Italian) spoken by
36 native speakers, 18 males and 18 females. The database was then subdivided into a learning and
11
a testing database (Table 2) which naturally contains different phrases and speakers from the first
one. The two databases were marked manually as active and non-active speech segments. In order
to have satisfactory statistics as regards the languages and the speakers, the male and female
speakers and the languages were equally distributed between the two databases. Further, to reflect
the statistics of a normal telephone conversation (about 40% of activity and 60% of non-activity),
we introduced random pause segments, extracting the length of talkspurts and silence periods from
an exponential population.
The learning database consists of only clean sequences, so the trained fuzzy system used for the
matching phase is independent of any type of background noise.
In order to evaluate the effects of changes in the speech level we considered 3 different levels in the
testing database: -12, -22, -32 dBovl, i.e. relative to the overload point of 16 bit word length,
whereas the effect of background noise on VAD performance was tested by digitally adding
various types of stationary and non-stationary background noise, made available by CSELT (Centro
Studi E Laboratori Telecomunicazione), to the clean testing sequence at different signal-to-noise
ratios (20, 10, 0 dB). More specifically, the testing database includes the following examples of
noise:
• White Gaussian noise
• Car noise
• Office noise
• Restaurant noise
• Street noise
• Train noise.
A more detailed description of the testing database is given in Table 3.
To summarize, the learning database comprises clean speech sequences at -22 dBovl lasting about 4
minutes, whereas the testing database includes clean speech and noisy sequences corresponding to
about 342 minutes of signal, divided into 57 one-way conversations of 6 minutes each (6 types of
additive noise with 3 different SNRs and 3 different levels, plus 3 clean files at different levels).
5.3 FVAD fuzzy rules and complexity
After the training phase we obtained a knowledge base of only six fuzzy rules. Figure 4 shows the
six fuzzy rules the tool extrapolated from the examples. In the rows we have the rules, and in the
first four columns the four fuzzy system inputs. Each of the fuzzy sets represented has the Universe
12
of Discourse corresponding to the relative input on the abscissa and the truth values on the
ordinates. The crisp value of the output singleton is presented in the last column. More specifically,
we say that 0 is inactivity and 1 is activity. If we neglect very large fuzzy sets we can give a
linguistic representation of the six fuzzy rules:
Rule 1 : IF (∆S is medium-low ) THEN (Y is active)
Rule 2 : IF (∆Ef is very high) THEN (Y is inactive)
Rule 3 : IF (∆El is low) AND (∆S is very low) AND (∆ZC is high) THEN (Y is active)
Rule 4 : IF (∆El is low) AND (∆S is high) AND (∆ZC is medium) THEN (Y is active)
Rule 5 : IF (∆El is high) AND (∆S is very low) AND (∆ZC is low) THEN (Y is active)
Rule 6 : IF (∆El is high) AND (∆S is not low) AND (∆ZC is very high) THEN (Y is active)
Of course, the output of the fuzzy system, which indicates the degree of membership in the
Activity/Inactivity classes, depends on an overall evaluation of the input parameter values by means
of the defuzzification process.
For example, we have a high output (i.e. the frame is detected as active) if ∆Εf is not high and ∆S is
medium-low, whereas we have a low output (i. e. the frame is detected as inactive) if ∆S is medium
and ∆Εf is very high and ∆ZC is not high; in this last case, in fact, only the degree of truth of rule 2
is high, while the degree of truth of the other rules is low.
Using the WM method described in Section 4.2 for the inferential procedure, it can easily be seen
that the computational load of the new approach remains very low. In short, considering I=4 inputs,
O=1 output and R=6 rules, to determine the Activity/Non-Activity decision for each frame we need:
additions, O=1 division. Bearing in mind that a minimum operation between I=4 values involves 3
comparisons, we can estimate about 59 cycles of instructions.
5.4 Decision module
In order to establish an optimal threshold value with which to compare the fuzzy system output, we
analyzed the total misclassification error with respect to a threshold value , Fth, ranging between 0
and 1. Fig. 5 shows the behaviour of the total error, besides that of misclassification of the single
FEC, MSC, OVER and NDS parameters.
The threshold was chosen in such a way as to achieve a trade-off between the values of the four
parameters. Although some of them (specifically MSC and FEC) can be improved by introducing a
successive hangover mechanism, which delays the transitions from 1 to 0, the presence of a
13
hangover block makes the values of the OVER and NDS parameters worse. The latter were
therefore given priority over MSC and FEC in choosing the threshold.
Analysis of Fig. 5 shows that the minimum total error is achieved with about Fth =0.21. We chose
Fth=0.25, so as to reduce the value of OVER and NDS; as mentioned previously, the corresponding
increase in FEC and MSC can be solved by introducing a hangover mechanism. The threshold Fth
was also chosen so as to minimize the variance of the parameters affected by the hangover: this then
allows us to design a suitable hangover for our VAD.
5.5 Hangover mechanism
We used a VAD hangover to eliminate mid-burst clipping of low levels of speech. The mechanism
is similar to the one used by the GSM VAD. The hangover is only added to speech bursts which
exceed a certain duration (burstconst) to avoid extending noise spikes. We chose the duration of the
hangover (hangconst) and the burstconst by analyzing the statistics of the MSC and NDS
parameters respectively. Figs. 6 and 7 give the histograms of the above parameters and Table 4 lists
the mean and standard deviation values.
On the basis of the values given in Table 4, we chose a burstconst value of 6 frames (60 ms) and a
hangconst of 10 frames (100 ms). In this way we reduced the clipping introduced by the VAD and,
at the same time, did not increase the activity factor by much. This can be seen in Figs. 8 and 9,
which show comparisons between the clipping introduced and the activity increase with and
without a hangover block. As can be observed, the introduction of the hangover reduces the
clipping occurrences and leaves the activity statistics practically unaltered.
6. Experimental results and comparison
In this Section we compare the performance of the ITU-T G.729 standard VAD, the GSM VAD and
the FVAD proposed in this paper. Comparisons were performed using the testing speech database
described in Section 5.2, considering, besides the clean case, three different values of signal-to-
noise ratio (0, 10, 20 dB), and three different signal levels (-12, -22, -32 dBovl). All results were
averaged on the six types of background noise considered in Section 5.2. The results were analyzed
considering the percentage of FEC and MSC in active voice frames and the percentage of OVER
and NDS in non-active voice frames. We also considered the total contribution of FEC and MSC
(FEC+MSC) to calculate the amount of clipping introduced, the total contribution of OVER and
NDS (OVER+NDS) to calculate the increase in activity and, lastly, the contribution of all four
parameters (FEC+MSC+OVER+NDS) to calculate the total amount of misclassification.
14
Tables 5 and 6 show a performance comparison varying level of speech signal and SNR. In the case
of a speech level of -22 dBovl, in terms of FEC, the FVAD performs better than the G.729 except in
the clean case and with an SNR of 0 dB, for which performance is similar. In terms of MSC, the
FVAD performs better at all SNRs. In terms of OVER, the FVAD performance is slightly worse,
but in terms of NDS it is much better than that of the G.729 and similar to that of the GSM VAD.
At an SNR of 0 dB we observed a strong deterioration in the performance of the GSM VAD.
Therefore, as shown in Table 6, the fuzzy voice activity detector performs better than the G.729 in
terms of both the clipping introduced and the increase in activity. At SNR=10 dB, for example, we
halved both misclassification errors. We also observed that on average FVAD performance is
similar to that of the GSM VAD, which in turn performs better than the ITU-T standard.
In the case of a speech level of -32 dBovl, the performance of the FVAD and G.729 VAD is
substantially unchanged whereas we observed an improvement in that of the GSM VAD in terms of
the activity factor but a deterioration in terms of clipping, above all with very high and very low
SNRs. Finally, in the case of a signal level of -12 dBovl, in terms of MSC, the FVAD still performs
better than the G.729 (in fact the performance is substantially unchanged with respect to the -22
dBovl case), whereas in terms of FEC we observed a slight worsening at SNR=0 dB and an
improvement in GSM VAD performance in terms of clipping. In terms of OVER the GSM VAD
presents worse performance when the SNR is below 20 dB. In terms of NDS we observed a
deterioration in the performance of both the FVAD and the G.729 in the clean case. In terms of
OVER and NDS, of course, GSM VAD performance is worse due to the high signal level.
Therefore, in terms of total error at this speech level, FVAD and G.729 performance is slightly
worse, whereas the GSM VAD performs much better in terms of the clipping introduced, but much
worse in terms of the increase in activity. Below SNR=20 dB, in fact, FVAD performance is better
than that of both the G.729 and the GSM VAD.
Figures (10a-10c) give the total error varying the SNR and signal level. We observed that, above
all with low SNRs, FVAD and G.729 performance is relatively independent of speech level changes
in that they use differential parameters, whereas GSM VAD performance depends strongly on
speech level changes because it uses energy comparisons.
A performance evaluation with varying types of background noise is shown in Figs. (11a-11f). The
FVAD results are always better than those of the G.729. More specifically, we have a significant
improvement in the case of car, train and street noises. Further, for non-stationary background
noise, FVAD performance is also better than that of the GSM VAD, whereas for stationary noise,
performance is similar except for the car noise case.
15
We also made comparisons considering several sequences of modern and classical music, sampled
at 8 kHz. More specifically, we calculated the percentage of clipping introduced by the 3 different
VADs. The results indicate that the GSM VAD introduces about 5 % of clipping, the G.729 VAD
20 % and the FVAD 14 %.
To evaluate the efficiency of this new method in terms of perceived speech quality and the effect on
listeners of the clipping introduced we carried out a series of informal listening tests. Using
headphone, we played various speech sequences, extracted from the testing database (with different
levels, types of additive noise and SNRs) to 30 listeners and recorded their evaluations. We asked
the listeners to mark the sequences on three different scales, Quality, Difficulty and Clipping
Audibility, so as to compare the G.729 VAD and the FVAD, using the G.729 Comfort Noise
Generator to synthesize the silence frames. Table 7 gives the results for each scale and each SNR, in
terms of percentage of preference. The FVAD performs better than the G.729 VAD in terms of
clipping audibility, while performance is similar in terms of quality and difficulty.
Table 8 shows the amount of clipping introduced (FEC or MSC) of a length greater than X frames,
where X=0, 10, 20, 40, 60, 80. The values given in the table were calculated considering the speech
sequences of the testing database at –22 dBovl . As the values show, the FVAD introduces a lower
amount of clipping than the traditional solution; it performs better than the G.729 for outliers less
than 20 frames, whereas in other cases it has a slightly wider, though comparable, distribution than
G.729. On the basis of these results the FVAD would appear, unlike the G.729, to present an
intrinsic hangover in addition to the external mechanism. Bearing in mind the study presented in
[26], this would account for the fact that the FVAD performs better in subjective terms as well.
To summarize, comparing the fuzzy-based version with the traditional solution, performance is
similar in the clean case, for which the ITU-T G.729 standard VAD performs well, but when the
noise level increases, FVAD performance improves, in some cases quite considerably. More
specifically, the results obtained show a clear improvement in FVAD performance, in that the
activity factor is reduced by about 25 %. Further, on average we have a reduction in voice activity
clipping of about 43 %. We observed that on average the GSM VAD performs better than the ITU-
T standard except for the clean case, where it presents a higher FEC value with a signal level of -22
and -32 dBovl. Finally, we observed from results obtained using various types of background noise
that the FVAD always performs better than the GSM VAD except for the car noise case.
16
7. Conclusion
In conclusion, we have presented a new voice activity detector based on fuzzy logic. The new
approach is more efficient than the traditional threshold method since it exploits all the information
and the non-linearity in the input pattern of parameters. The six fuzzy rules on which the matching
phase is based were obtained through a training phase performed by means of a new hybrid learning
tool, without any need for a priori knowledge of the problem.
The results obtained show a clear improvement in fuzzy VAD performance as compared with the
traditional solution, with a negligible increase in complexity. On average, the FVAD allows an
improvement over the G.729 VAD of about 25 % in bit rate reduction and of about 43 % in clipping
reduction, maintaining the compatibility with the ITU-T standard. Informal listening tests also show
a slight improvement in the perceived speech and music quality, above all in terms of clipping
audibility. Furthermore, FVAD performance is on average similar to that of the GSM VAD with the
advantages of a low algorithm delay (10 ms) and less sensitivity to signal level changes. Finally, we
observed a linear link between the SNR and the threshold which minimizes the total error. The
direction for future research is thus to improve performance even further by adapting the transition
threshold of the decision module and the constants of the hangover mechanism.
AcknowledgementThe authors wish to thank the anonymous reviews for the helpful comments and suggestions.
References[1] R. V. Cox, P. Kroon, “Low Bit-Rate Speech Coders for Multimedia Communications” , IEEE
Communications Magazine, vol.34, n. 12, Dec. 1996, pp. 34-41.[2] P. Barret, “Encoding of speech signals at bit rates around 4 kbits”, ITU-T contribution, Q. 21/16
Meeting report, document 29-E (WP3/16), Geneva, 17-27 March 1997.[3] K. Sririam, P. K. Varshney, J. G. Shanthikumar, “Discrete-Time Analysis of Integrated
Voice/Data Multiplexers with and without Speech Activity Detectors, IEEE J-SAC vol. 1, n. 6,Dec. 1983, pp. 1124-1132.
[4] G. Wu, J.W. Mark, “Multiuser Variable Rate Subband Coding Incorporating DSI and BufferControl”, IEEE Trans. on Communications, vol. 38, n. 12, Dec. 1990, pp. 2159-2165.
[5] A. Gersho, "Advances in Speech and Audio Compression", IEEE Proc., vol. 82, no. 6, pp. 900-918, Jun. 1994.
[6] E. Paksoy, K. Srinivasan, A. Gersho, "Variable Bit-Rate CELP Coding of Speech with PhoneticClassification", European Trans. on Telecommunications., vol. 5, pp. 591-601, Sep.-Oct., 1994.
[7] L. Cellario, D. Sereno, "CELP Coding at Variable Rate", European Trans. onTelecommunications, vol. 5, pp. 603-613, Sep-Oct 1994.
[8] F. Beritelli, S. Casale, A. Cavallaro “A Voice Activity Detector for Mobile Communicationsbased on Fuzzy Logic” Proc. European Symposium on Intelligent Techniques (ESIT ’97), Bari,Italy, March 20-21, 1997, pp. 91-95.
[9] J. Stegmann, G. Schroeder, “Robust Voice Activity Detection Based on the WaveletTransform”, Proc. IEEE Workshop on Speech Coding For Telecommunications, PoconoManor, Pennsylvania, USA, September 7-10, 1997, pp. 99-100.
17
[10] T. B. Minde, S. Bruhn, E. Ekudden, H. Hermansson, “Requirements on speech coders imposedby speech service solutions in cellular systems”, Proc. IEEE Workshop on Speech Coding ForTelecommunications, Pocono Manor, Pennsylvania, USA, September 7-10, 1997, pp. 89-90.
[11] K. Srinivasan, A. Gersho, “Voice Activity Detection for Cellular Networks”, IEEE Workshopon Speech Coding for Telecommunications, pp. 85-86, Oct. 1993.
[12] F. Beritelli, S. Casale, A. Cavallaro, “Improved VAD G.729 Annex B for mobilecommunications using soft computing” contribution ITU-T, Question 19/16, document AH-Q19-6, Experts meeting, Washington, 2-5 September 1997.
[13] A. Benyassine, E. Shlomot, H.Y. Su, D. Massaloux, C. Lamblin, J.P. Petit, “ITUReccomendation G.729 Annex B: A Silence Compression Scheme for Use with G.729Optimized for V.70 Digital Simultaneous Voice and Data Applications”, IEEE CommunicationsMagazine, Sept. 1997, vol. 35, n. 9, pp. 64-73.
[14] Rec. ITU-T G.729 Annex B, 1996.[15] L.A.Zadeh “Fuzzy Logic, Neural Networks and Soft Computing”, Comm. of the ACM, vol. 37,
no.3, Mar. 1994.[16] M. Russo, “A genetic approach to fuzzy learning”, 1-st Int. Workshop on Neuro-Fuzzy
Systems, EPFL, Lausanne, 29-31 Aug. 1996, pp. 9-16.[17] M. Russo, “FuGeNeSys: Fuzzy Genetic Neural System”, to appear in the IEEE Transactions
on Fuzzy Systems.[18] F. Beritelli, S. Casale, M. Russo “Multilevel Speech Classification Based on Fuzzy Logic”,
IEEE Workshop on Speech Coding, Annapolis, Maryland, USA, Sep. 1995, pp. 97-98.[19] F. Beritelli, S. Casale, M. Russo, "A Voiced/Unvoiced Speech Discrimination Technique Based
on Fuzzy Logic", Eurospeech '95: 4-th European Conference on Speech Communication andTechnology, Madrid, Spain, Sep. 1995, pp. 389-392
[20] F. Beritelli, S. Casale, M. Russo, “Robust Phase Reversal Tone Detection Using SoftComputing”, IEEE International Symposium on Uncertainty Modeling and Analysis -Conference of the North American Fuzzy Information Processing Society (ISUMA-NAFIPS’95), Maryland, USA, Sep. 1995, pp. 589-594
[21] F. Beritelli, “Speech classification and coding for future generation mobile systems” (inItalian), Ph.D. Thesis, University of Catania, Italy, Feb. 1997.
[22] F. Beritelli, S. Casale, P. Usai, “Background Noise Classification in Mobile Environmentsusing Fuzzy Logic” contribution ITU-T (WP 3/12), Meeting on “Noise aspects in evolvingnetworks”, Question 17/12, Geneva, 9-16 April 1997.
[23] F. Beritelli, S. Casale, “Robust Voiced/Unvoiced Speech Classification using Fuzzy Rules”,Proc. IEEE Workshop on Speech Coding, Pocono Manor, Pennsylvania, USA, 7-10 Sept. 1997,pp. 5-6.
[24] ETSI GSM 06.32 (ETS 300-580-6) “European digital cellular telecommunications system(Phase 2); Voice Activity Detection (VAD)“, September 1994.
[25] D. K. Freeman et al., “The voice activity detector for the Pan-European digital cellular mobiletelephone service, “ in IEEE Proc. Int. Conference on Acoustic, Speech and Signal Processing,Glasgow, May 1989, pp. 369-372.
[26] J. G. Gruber, L. Strawczynski, “Subjective Effects of Variable Delay and Speech Clipping inDynamically Managed Voice Systems”, IEEE Trans. on Communications, vol. 33, n. 8, Aug.1985, pp. 801-808.
[27] K.S. Tang, K.F. Man, S. Kwong, Q. He, “Genetic Algorithms and their Applications”, IEEESignal Processing Magazine, Nov. 1996, vol. 13, n. 6, pp. 22-37.
[28] K. Fukunaga, “Introduction to Statistical Pattern Recognition”, Academic Press, San Diego,California, 1990.
[29] D. H. Kil, F. B. Shin, “Pattern recognition and prediction with applications to signalcharacterization”, AIP (American Institute of Physics) Press, Woodbury, New York, 1996.
18
List of figure captions:
Fig. 1 Objective parameters for performance evaluation
Fig. 2 Practical inferencing
Fig. 3 Functional scheme of the FVAD
Fig. 4 Fuzzy rules
Fig. 5 Misclassification errors versus decision threshold
Fig. 6 MSC histogram
Fig. 7 NDS histogram
Fig. 8 FEC+MSC histogram
Fig. 9 OVER+NDS histogram
Fig. 10 Results varying levels of speech signal
Fig. 11 Results varying types of background noise
List of table captions:
Table 1: Genetic operators used
Table 2: Learning and testing (clean case) database structure
Table 3: Speech database characteristics used for testing
Table 4: Statistics of the four objective parameters calculated on the learning database
Table 5: Comparison in terms of FEC, MSC, OVER and NDS varying levels of speech signal and
SNR
Table 6: Comparison in terms of FEC + MSC, OVER + NDS and FEC + MSC + OVER + NDS
varying levels of speech signal and SNR
Table 7: Subjective test results
Table 8: Comparisons in terms of outliers
19
Fig. 1 Objective parameters for performance evaluation
X1 X2
α11
α12
θ1=0.25
α 21 α 22
θ2=0.15
z1=0.6
IF (X 1 IS P11) AND (X2 IS P12) THEN (Y IS z1)
z2=0.4
y=θ1z1+θ2z2 =0.525
θ1+θ2
X1 X2
IF (X 1 IS P11) AND (X2 IS P12) THEN (Y IS z1)
Fig.2 Practical inferencing
Fig. 3 Functional scheme of the FVAD
0=Non Activity
Matching(Fuzzy System)
HangoverDecisionModule
Inputspeech
1
0
1=ActivityFeature
Extraction
FEC MSC OVER NDS
Activity
VAD decision
Inactivity
20
1
1
0
1
1
1
Rule 1
Rule 2
Rule 3
Rule 4
Rule 5
Rule 6
∆Ef ∆El ∆ZC∆S
Fig. 4 Fuzzy rules
Fig. 5 Misclassification errors versus decision threshold
0%
5%
10%
15%
20%
25%
30%
0 0.1 0.2 0.3 0.4 0.5 0.6 0.7 0.8 0.9 1
Fth
Mis
clas
sific
atio
n FEC
MSC
OVER
NDS
TOTAL
21
Fig. 6 MSC histogram
Fig. 7 NDS histogram
0
2000
4000
6000
8000
10000
12000
14000
16000
10 60 110 160 210 260
(ms)
Num
ber
of o
ccur
ence
s
0
1000
2000
3000
4000
5000
6000
10 60 110 160 210 260
(ms )
Num
ber
of o
ccur
ence
s
22
Fig. 8 FEC+MSC histogram
Fig. 9 OVER+NDS histogram
0
1000
2000
3000
4000
5000
6000
7000
8000
10 60 110 160 210 260
(ms)
Num
ber
of o
ccur
ence
s
NO_Hang.
Hang.
020004000
60008000
1000012000
140001600018000
10 60 110 160 210 260
(ms)
Num
ber
of o
ccur
ence
s
NO_Hang.
Hang.
23
Fig 10 Results varying levels of speech signal
(a) GSM
0%
10%
20%
30%
40%
50%
60%
70%
0 10 20 CLEAN
SNR (dB)
(b) G729
0%
20%
40%
60%
0 10 20 CLEAN
SNR (dB)
(c ) FVAD
0%10%20%30%40%50%60%70%
0 10 20 CLEAN
SNR (dB)
-12 dBovl -22 dBovl -32 dBovl
24
Fig. 11 Results varying types of background noise
(a) White
0%
10%
20%
30%
40%
50%
0 10 20
SNR (dB)
(b) Street
0%
5%
10%
15%
20%
25%
30%
0 10 20
SNR (dB)
(d) Office
0%
10%
20%
30%
40%
50%
0 10 20
SNR (dB)
(c ) Car
0%
10%
20%
30%
40%
50%
60%
0 10 20
SNR (dB)
(e) Train
0%
5%10%
15%20%
25%
30%35%
40%
0 10 20
SNR (dB)
GSM G729 FVAD
(f) Restaurant
0%
10%
20%
30%
40%
50%
0 10 20
SNR (dB)
25
OPERATOR DESCRIPTIONReproduction The individuals in the population PR come from the probabilistic selection of the
individuals in the population P(t) with the greatest fitness.Crossover Applied to two chromosomes (parents) it creates offspring using the genes of
both. In most cases a point called crossover is chosen and two offspring arecreated. The first will have a chromosome with the father's chromosome in thefirst part and the mother's in the second. The sibling will have the opposite.
Mutation Each single bit of a generic sibling will be inverted with a pre-establishedprobability of pm.
Hill descending Every time there is best fitness enhancement we call a backpropagationprocedure until there are further enhancements.
Table 1: Genetic operators used
# Frames (10 ms)Speakers LanguageLearning Testing
Males English 1659 2546Females English 2328 3082Males Italian 1731 3043
Females Italian 1930 3728Total Activity 7648 12399
Total Inactivity 15053 23601
Table 2: Learning and testing (clean case) database structure
Factors CommentSpeech input levels -12, -22, -32 dB relative to the overload (OVL)Speech phrases 42 speech phrases in English and ItalianSpeakers 7 male and 7 femaleNoise type White Gaussian noise, Car noise, Office noise, Restaurant noise, Street noise,
Train noiseNoise levels (SNR) 0, 10, 20 dB + cleanActivity factor 40 %Condition 3 noise levels for each type of noise plus 1 clean for each level: (3*6+1)*3=57
Table 3: Speech database characteristics used for testing
Mean (# frames) Standard deviation (# frames)FEC 4.95 9.01MSC 5.77 7.08OVER 18.18 96.07NDS 4.47 12.06
Table 4 : Statistics of the four objective parameters calculated on the learning database