University of Rhode Island University of Rhode Island DigitalCommons@URI DigitalCommons@URI Open Access Master's Theses 2014 A ROTATIONAL ISOMERIC STATE APPROACH TOWARDS A ROTATIONAL ISOMERIC STATE APPROACH TOWARDS UNDERSTANDING ELASTOMER CHAIN CONFORMATIONS IN UNDERSTANDING ELASTOMER CHAIN CONFORMATIONS IN TIRES TIRES Suvrajyoti Kar University of Rhode Island, [email protected]Follow this and additional works at: https://digitalcommons.uri.edu/theses Recommended Citation Recommended Citation Kar, Suvrajyoti, "A ROTATIONAL ISOMERIC STATE APPROACH TOWARDS UNDERSTANDING ELASTOMER CHAIN CONFORMATIONS IN TIRES" (2014). Open Access Master's Theses. Paper 299. https://digitalcommons.uri.edu/theses/299 This Thesis is brought to you for free and open access by DigitalCommons@URI. It has been accepted for inclusion in Open Access Master's Theses by an authorized administrator of DigitalCommons@URI. For more information, please contact [email protected].
Transcript
University of Rhode Island University of Rhode Island
DigitalCommons@URI DigitalCommons@URI
Open Access Master's Theses
2014
A ROTATIONAL ISOMERIC STATE APPROACH TOWARDS A ROTATIONAL ISOMERIC STATE APPROACH TOWARDS
UNDERSTANDING ELASTOMER CHAIN CONFORMATIONS IN UNDERSTANDING ELASTOMER CHAIN CONFORMATIONS IN
Follow this and additional works at: https://digitalcommons.uri.edu/theses
Recommended Citation Recommended Citation Kar, Suvrajyoti, "A ROTATIONAL ISOMERIC STATE APPROACH TOWARDS UNDERSTANDING ELASTOMER CHAIN CONFORMATIONS IN TIRES" (2014). Open Access Master's Theses. Paper 299. https://digitalcommons.uri.edu/theses/299
This Thesis is brought to you for free and open access by DigitalCommons@URI. It has been accepted for inclusion in Open Access Master's Theses by an authorized administrator of DigitalCommons@URI. For more information, please contact [email protected].
polybutadiene, squared radius of gyration, Gaussian distribution, polymer
shape.
2.1 Graphical Abstract
Conformation Distribution Taut conformations
expand more with T Sizes and Shapes
Figure 1. Graphical abstract
2.2 Introduction
Vehicle tires are the most important application of rubber worldwide. Methods
have been looked at to develop tires which would give better fuel economy without
15
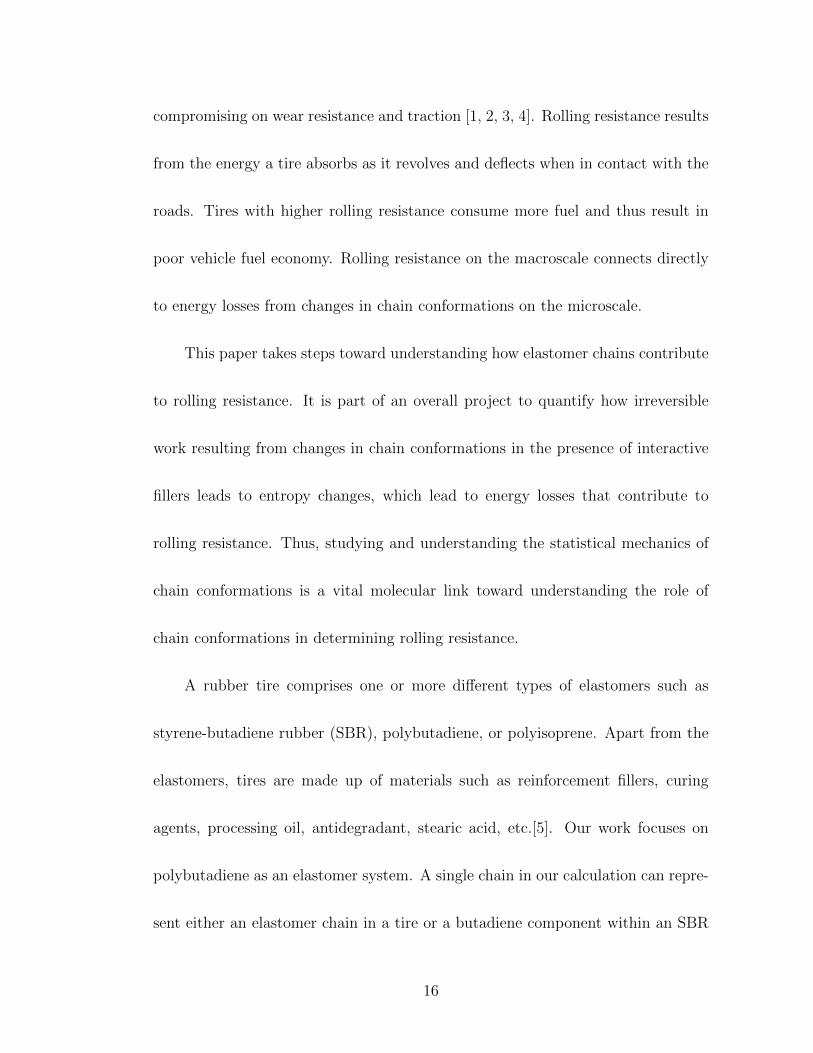
compromising on wear resistance and traction [1, 2, 3, 4]. Rolling resistance results
from the energy a tire absorbs as it revolves and deflects when in contact with the
roads. Tires with higher rolling resistance consume more fuel and thus result in
poor vehicle fuel economy. Rolling resistance on the macroscale connects directly
to energy losses from changes in chain conformations on the microscale.
This paper takes steps toward understanding how elastomer chains contribute
to rolling resistance. It is part of an overall project to quantify how irreversible
work resulting from changes in chain conformations in the presence of interactive
fillers leads to entropy changes, which lead to energy losses that contribute to
rolling resistance. Thus, studying and understanding the statistical mechanics of
chain conformations is a vital molecular link toward understanding the role of
chain conformations in determining rolling resistance.
A rubber tire comprises one or more different types of elastomers such as
styrene-butadiene rubber (SBR), polybutadiene, or polyisoprene. Apart from the
elastomers, tires are made up of materials such as reinforcement fillers, curing
agents, processing oil, antidegradant, stearic acid, etc.[5]. Our work focuses on
polybutadiene as an elastomer system. A single chain in our calculation can repre-
sent either an elastomer chain in a tire or a butadiene component within an SBR
16
block co-polymer.
In this work we have generated numerous (100,000) isolated single chains
of uncorrelated random conformations of cis- and trans-1,4-polybutadiene chains
under unperturbed conditions (balanced attractive and repulsive polymer-solvent
interactions, i.e. theta-conditions). Using a single chain in each computation is
justified because a flexible polymer surrounded by the same polymer takes on the
same average shape as a single random polymer chain in a theta solvent [6, 7, 8].
The polybutadiene chains were generated using Flory’s Rotational Isomeric State
approach (RIS) [9]. Each chain realization in RIS provides an independent sample.
Thus while the standard Molecular Dynamics and Monte Carlo methods provides
sequences of related states, the small changes that occur in each step lead to
correlations that must be relaxed to sample an equilibrium distribution. The RIS
method offers an advantage of generating a large number of uncorrelated random
chain conformations in a computationally cheap manner.
Mark [10, 11] and Abe and Flory [12] previously used the RIS method to gen-
erate random conformations of cis- and trans-1,4-polybutadiene chains. Mark’s
work focused on computing and comparing characteristic ratios of chains with ex-
perimentally obtained values, obtaining temperature coefficients of mean squared
17
end-to-end distance of chains, as well as comparing intramolecular energies between
different rotational isomeric states per repeat unit of polybutadiene. In addition
to the properties computed by Mark, Abe and Flory computed various other prop-
erties of random polybutadiene chain conformations including strain-birefringence
coefficients and coefficients of rotational isomerization under stretching.
Mattice and Li [13] used molecular dynamics to simulate single chains and
bulk structures of amorphous cis-1,4-polybutadiene under unperturbed conditions.
A single chain of cis-1,4-polybutadiene consists of 99 repeat units. The low en-
ergy states computed were in accordance with the ones suggested by Mark [10]
and by Abe and Flory [12]. Population probability distributions about the bond
angle supplements and torsion angles were found to be different for single chain
and bulk structures. This difference suggested intermolecular origin conforma-
tional differences between single chain and bulk structures. The bulk structure of
polybutadiene allowed Mattice and Li to compute cohesive energy of the system.
Cohesive energy is defined as the energy needed to remove a molecule from the
bulk system and it was around 4100 cal/mol.
Our focus is on studying size and shape properties of random chain confor-
mations of polybutadiene. We computed characteristic ratios of cis- and trans-1,4
18
polybutadiene chains at different chain lengths and over a range of temperatures.
Comparing the probability density distribution of the chains at different temper-
atures has explained the reason behind average swelling of chains with increasing
temperature. We also studied chain shapes at different chain lengths and over a
temperature range. Finally, we looked at joint probability correlations between
chain size and shape and the extents of correlation and anti-correlation for cis-
and trans-1,4-polybutadiene chains.
2.3 Methodology
In the RIS approximation, torsions about bonds are treated as existing in
one or more discrete rotational states, with each of these states chosen to coincide
with a region of low potential energy. States differ in relative energy and thus in
Boltzmann-weighted probability. Discrete states are defined only around bonds
that allow torsion. Rotations about the double bond are not allowed.
2.3.1 Chain Generation
Each polybutadiene chain was built in an atom-by-atom manner considering
three torsional angles per repeat unit (φi, φi+1, φi+3) around the three single C–C
bonds, as shown in figure 2. Atom positions in a single repeat unit depend on these
three torsion angles. Torsion angles φi and φi+3 affect positions of the pendant H
19
atoms (Hi, Hi′ , Hi+3, and Hi+3′) attached to the backbone C atoms (Ci and Ci+3)
joined by i and i+3 bonds. They also directly affect positions of the C atoms (Ci+1
and Ci+4). Torsion angle φi+1 affects positions of the pendant H atoms (Hi+1 and
Hi+2) attached to the C atoms (Ci+1 and Ci+2). It also directly affects positions
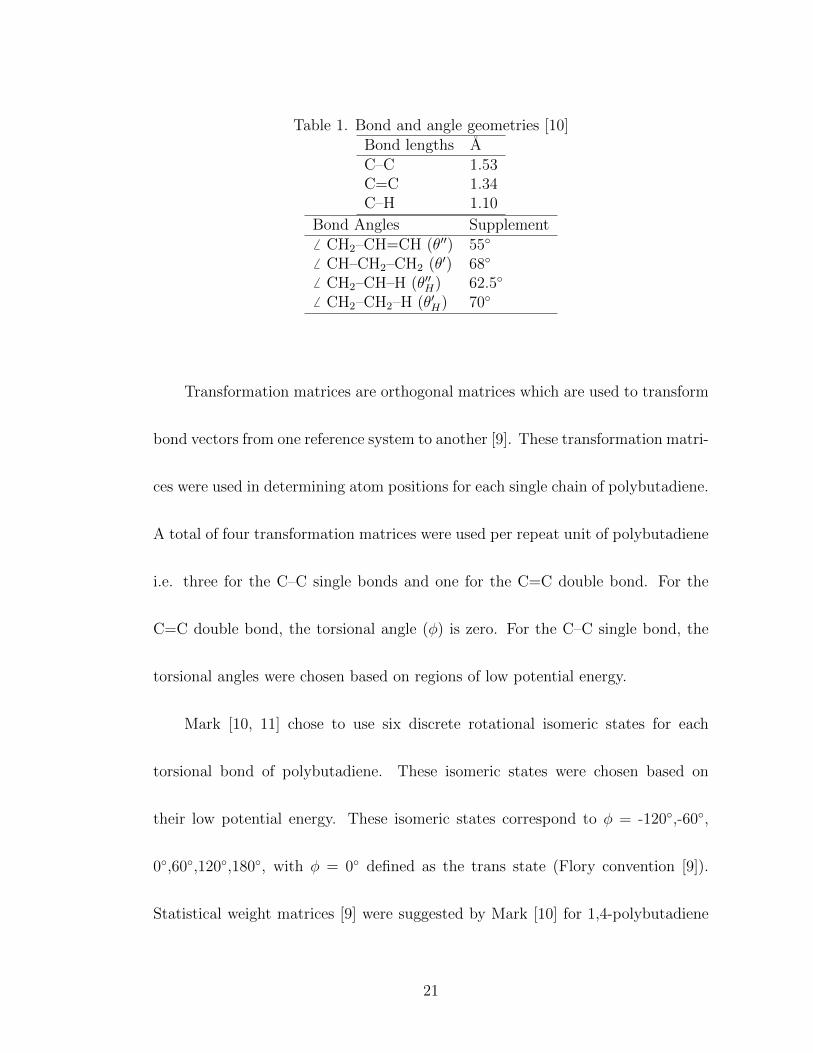
of the C atoms (Ci+2 and Ci+3). Bond angle supplements and bond lengths used
in our computations were obtained from Mark [10, 11] and are shown in Table 1.
Abe and Flory [12] used the same values in their calculations.
Figure 2. Trans-1,4-polybutadiene structure showing bonds, bond angles and tor-sion angles. Atoms from Ci to Ci+3 and their pendant hydrogens comprise a singlerepeat unit. Numbering employs Flory’s convention [9].
20
Table 1. Bond and angle geometries [10]Bond lengths AC–C 1.53C=C 1.34C–H 1.10
Bond Angles Supplement6 CH2–CH=CH (θ′′) 55◦
6 CH–CH2–CH2 (θ′) 68◦
6 CH2–CH–H (θ′′H) 62.5◦
6 CH2–CH2–H (θ′H) 70◦
Transformation matrices are orthogonal matrices which are used to transform
bond vectors from one reference system to another [9]. These transformation matri-
ces were used in determining atom positions for each single chain of polybutadiene.
A total of four transformation matrices were used per repeat unit of polybutadiene
i.e. three for the C–C single bonds and one for the C=C double bond. For the
C=C double bond, the torsional angle (φ) is zero. For the C–C single bond, the
torsional angles were chosen based on regions of low potential energy.
Mark [10, 11] chose to use six discrete rotational isomeric states for each
torsional bond of polybutadiene. These isomeric states were chosen based on
their low potential energy. These isomeric states correspond to φ = -120◦,-60◦,
0◦,60◦,120◦,180◦, with φ = 0◦ defined as the trans state (Flory convention [9]).
Statistical weight matrices [9] were suggested by Mark [10] for 1,4-polybutadiene
21
systems. The same set of matrices and statistical weights were used in our work.
The partition function [9] shows each possible combination of rotational iso-
meric states of a chain. The pair wise probability of a single conformation equals
its contribution to the partition function, divided by the partition function. Please
refer to the appendix for a discussion on statistical weights, statistical weight ma-
trices, partition function, and transformation matrices.
Total energy of the system is a summation of the torsional energy [9] and the
energy resulting from the dispersion interactions between non-bonded atoms calcu-
lated using the Lennard-Jones (6-12) potential [15]. Non-bonded atoms separated
by three or more bonds contribute to the non-bonded interaction energy computed
using the Lennard-Jones (6-12) potential. Every conformation of polybutadiene
generated in our work have fixed bond lengths and bond angles, and thus the bond
energies do not affect the overall energy of the system.
100,000 isolated single chains of cis- and of trans-1,4-polybutadiene were sim-
ulated at each state of various conformations and lengths ranging over degrees
of polymerization n = 15, 25, 50, 75, 100, and 120 repeat units, all at 343 K.
Additional simulations were carried out for a single chain length (n = 50) at dif-
ferent temperatures T = 275, 300, 323, 343, 375, and 400 K. Ensemble averages
22
of the various chain size and shape parameters were calculated in order to under-
stand behavior of cis and trans chains over different ranges of chain length and
temperature. Further calculations obtained correlations among chain size, length
and shape. The chains were generated based on pair probabilities and thus the
ensemble averages are Boltzmann-weighted probability averages.
2.3.2 Chain size and shape parameters
An important chain size parameter is the squared end-to-end distance r2,
which is calculated as
r2 = (r2x + r2y + r2z) (1)
where rx, ry, rz are the x, y and z coordinates of the end-to-end distance vector r.
The squared radius of gyration (r2g) is computed using the distance of each atom
in the polymer chain to the center of mass,
r2g =1
N
N∑j=1
(rj − rcom)2 (2)
rj is the position vector of atom j of a polymer chain, rcom is the position vector
of the center of mass of a polymer chain, and N is the total number of atoms in
23
the chain.
Theodorou and Suter [16] used the eigenvalues (λ1, λ2, λ3) of a radius of
gyration matrix (S) to quantify contributions directed along the three principal
directions (eigenvectors) of a chain conformation.
S =
x2 xy xzxy y2 yzxz yz z2
(3)
where
x2 =1
N
N∑j=1
(xj − xcom)2 (4)
y2 =1
N
N∑j=1
(yj − ycom)2 (5)
z2 =1
N
N∑j=1
(zj − zcom)2 (6)
xj, yj, zj are the x, y, and z coordinates of atom j of a polymer chain, and xcom,
ycom, zcom are the x, y, and z coordinates of the center of mass of the polymer
chain. The overbar indicates average over all chain atoms. We transformed the
radius of gyration matrix to a principal axis system, which diagonalised the radius
of gyration matrix in such a manner that the eigenvalues of the matrix were in
24
descending order (λ1 ≥ λ2 ≥ λ3). Eigenvalue λ1 corresponds to the longest princi-
pal direction while λ2 and λ3 correspond to secondary directions. This effectively
represents the size of a polymer chain in each direction, rather than with the radius
rg of a hollow sphere having the same mass and moment of inertia as the polymer
chain. The squared radius of gyration equals the sum of the three eigenvalues,
r2g = λ1 + λ2 + λ3 (7)
Computing the radius of gyration matrix (equation 3) enabled quantifying chain
shape. The chain shape parameters studied were b (asphericity or deviation from
spherical shape), c (acylindricity or deviation from cylindrical shape) and κ2 (rel-
ative shape anisotropy) [16]:
b = λ1 −(λ2 + λ3
2
)(8)
c = λ2 − λ3 (9)
κ2 =
(b2 + 3
4c2
r4g
)(10)
25
Averages of r2, r2g , b/r2g , c/r
2g , and κ2 used an equal weighting for each chain at each
condition. This is appropriate because relative Boltzmann-weighted probabilities
are taken into account while generating the chain conformations.
2.4 Results and Discussion
2.4.1 Chain size
Characteristic ratio (Cn) of unperturbed chains [9, 17] is defined as the ratio
of mean squared end-to-end distance of a real chain under the theta condition to
that of a freely jointed chain with the same number of bonds and bond length,
Cn =〈r2〉0nl2
(11)
n is the number of backbone bonds along a polymer chain and l is the bond length.
Cn quantifies chain expansion due to bond angle and torsion angle correlations.
The subscript 0 of the mean squared end-to-end distance represents unperturbed
conditions.
We computed characteristic ratios of cis- and of trans-1,4-polybutadiene chains
of different chain lengths at one temperature (T = 343 K) and of a single chain
length (n = 50) at multiple temperatures. Figures 3 and 4 illustrate Cn results for
different chain lengths and over different temperatures, respectively. Experimental
26
values are taken from Moraglio [7] and Abe and Fujita [8]; computed values are
from Mark [10, 11].
Figure 3 shows that calculated characteristic ratios are in good agreement
with the experimental and prior computed characteristic ratios in the limit of
infinite chain length for cis-1,4-polybutadiene chains. For trans-1,4-polybutadiene
chains, the calculated characteristic ratios are slightly higher than prior computed
values in the limit of infinite chain length. The characteristic ratios increased with
increasing chain length for both cis and trans chains. The higher characteristic
ratio for trans chains indicates a greater chain extension, which is potentially a
consequence of the greater distance spanned between the carbon atoms bonded to
the double bonded carbons. In figure 3, the prior computed characteristic ratio
values for cis chains are almost indistinguishable from the experimental values.
The characteristic ratio increased with temperature for both cis and trans chains,
as shown in figure 4, and the increase was larger for trans than for cis polybutadiene
chains. This indicates swelling of the average chain size upon heating.
In the limit of long chains, the mean squared radius of gyration 〈r2g〉0 should
equal 1/6 of the mean squared end-to-end distance 〈r2〉0 [9]. Figure 3 shows the
ratio 〈r2〉0/〈r2g〉0 was higher than 6 for shorter trans chains and decreased to 6 for
27
longer chains. The ratio was slightly higher than 6 for cis chains at all chain lengths.
Figure 4 shows that the ratio 〈r2〉0/〈r2g〉0 was almost independent of temperature
for cis chains, whereas for trans chains it increased with increase in temperature.
0 0.02 0.04 0.06 0.084
4.5
5
5.5
6
6.5
1/n
Cn
trans
cis
Figure 3. Characteristic ratio vs. inverse of chain length n for cis-(filled) and trans-(unfilled) 1,4-polybutadiene using 〈r2〉0 (circle) and 6〈r2g〉0 (square). Literatureresults at 1/n = 0 indicate models [10, 11] (+) and experimental values [7, 8] (5).These symbols are used throughout unless otherwise specified.
28
260 300 340 380 4204
4.5
5
5.5
6
6.5
T(K)
Cn
cis
trans
Figure 4. Characteristic ratio vs. temperature for cis- and trans-1,4-polybutadienechains of 50 repeat units. Symbols match figure 2.
The probability density distribution of the squared end-to-end distance was
calculated and compared with a Gaussian probability density distribution [9, 17],
P (r2)dr =(
3
2πCnnl2
) 32
exp
(−3r2
2Cnnl2
)2πrdr (12)
A Gaussian model assumes each chain behaves like a freely jointed chain. The
segments of each chain in such an ensemble can be considered as performing a
random walk in three dimensions with the only constraint being that each segment
must be joined to its neighbors with a fixed bond length [9, 17].
Figure 5 compares the probability density distribution of squared end-to-end
29
distance for cis and trans chains with the Gaussian model. Squared end-to-end
distance of the cis chains ranged from around 10 to 7,000 A2, and for the trans
chains around 10 to 14,000 A2. Trans chains have a wider distribution than cis
chains and consequently have higher characteristic ratios. For cis chains, agreement
between our simulation results and the Gaussian model was observed for chain sizes
in the range of around 250 to 500 A2 as well as in the range of around 1050 to 3000
A2. Our trans chain simulation results showed agreement with the Gaussian model
for chain size range of around 250 to 1050 A2 as well as in the range of around
3500 to 6500 A2. We classify these chain size ranges as medium size considering
the entire range of the chain size distribution. These medium size chains have
the highest probability of occurence. While smaller chains have a comparable
probability density, they span a much smaller range in squared end-to-end distance.
The Gaussian model predicted higher probability than the simulation results for
shorter (chain size range of around 10 to 250 A2 for both cis and trans) chains as
well as longer (chain size range of around 3000 to 7000 A2 for cis and around 6500
to 14000 A2 for trans) chains. Simulation results showed higher probability than
those predicted by the Gaussian model for cis chains in the size range of around
500 to 1050 A2 and for trans chains in the size range of around 1050 to 3500 A2.
30
101
102
103
104
105
10−7
10−6
10−5
10−4
10−3
r2 Å2
Prob
abili
ty d
ensi
ty (
1/Å
2 )
Figure 5. Probability density distribution of squared end-to-end distance for cis-and trans-1,4-polybutadiene chains of 50 repeat units at 343 K. Lines indicate aGaussian distribution.
The temperature dependences of the probability density distributions of chain
sizes for cis- and trans-1,4-polybutadiene are shown in figure 6. Squared end-to-
end distance has a much wider distribution than the squared radius of gyration.
Smaller size trans chains were slightly more probable at lower temperatures than
at higher ones. Cis chains showed probabilities more independent of temperature.
31
101
102
103
104
105
10−8
10−7
10−6
10−5
10−4
10−3
10−2
rg2, r2 Å2
Prob
abili
ty d
ensi
ty (
1/Å
2 )
275K300K323K343K375K400K
trans, rg2
cis, rg2
cis, r2trans, r2
Figure 6. Probability density distribution of r2 and r2g for cis- and trans-1,4-polybutadiene chains of 50 repeat units at different temperatures.
The temperature dependencies of characteristic ratio and of chain size distri-
bution appear to conflict with each other. The characteristic ratios increased with
temperature, as shown in figure 4, though figure 6 suggests similar probabilities for
the most probable chains (i.e. medium size chains) at different temperatures. Only
small absolute changes in probability densities with temperature were observed for
all chain sizes. The contributing factor to the increase in average chain size with
temperature was the extended conformations, i.e larger chain sizes. There was a
larger relative increase, though smaller absolute change, in probability density for
larger chain sizes with temperature, as compared to a smaller relative decrease in
probability density for smaller chain sizes. Despite this small change in low prob-
32
ability conformations, it resulted in an increase in average chain size. This effect
was more pronounced for trans chains than for cis polybutadiene chains.
To examine this effect further, the characteristic ratio was calculated using
only a subset of the chain size distribution, shown in figure 7. Chains with squared
end-to-end distance ranging from 10 to 300 A2 were considered as smaller chains
and chains with squared end-to-end distance greater than 4000 A2 were considered
as larger chains. The characteristic ratios increased more with temperature for
larger chain sizes of both cis and trans chains, whereas very little increase in char-
acteristic ratio was observed for smaller chain sizes of cis and trans chains. The
increase in charactersitic ratio of larger chain sizes was much more prominent in
trans than in cis chains. Increases in characteristic ratio with temperature (figure
4) can thus be attributed to the size increases of extended and taut chain confor-
mations. Polymer chain swelling with heating can be attributed to a size increase
of the relatively few extended and taut conformations, rather than expansion uni-
formly across conformations of all sizes. The greater increase of characteristic ratio
with temperature for larger chains, as shown in figures 4 and 7, indicates that this
“taut conformation effect” was more prominent for trans than for cis polybutadiene
chains.
33
260 300 340 380 4204
4.5
5
5.5
6
6.5
7
T(K)
Cn
cis
trans
Figure 7. Characteristic ratio for larger (downward triangle) and smaller (upwardtriangle) subsets of the chain size distribution for cis- and trans-1,4-polybutadienechains of 50 repeat units.
2.4.2 Chain shape
Ensemble averages of chain shape parameters were obtained in order to quan-
tify shape variations among polybutadiene chains. Since each chain establishes its
own principal axes, the analysis uses a different coordinate system for each chain.
The results thus emphasize the deviations of each chain from a symmetric shape.
Rotation differences between the principal axes and the original (x,y,z) coordinates
are not important and were not taken into account when combining the results into
averages and distributions.
The eigenvalues λ1, λ2, and λ3 of the radius of gyration matrix indicate the
34
extents of orthogonal principal axes that span the region occupied by a chain in
primary and secondary directions. Ratios of eigenvalues thus indicate if chains are
being stretched or compressed. Figures 8 and 9 show the eigenvalue ratios as func-
tions of inverse of chain length and temperature, respectively. These calculations
were carried out at 343 K and for 50 repeat units respectively.
Figure 8 shows that trans chains were more stretched than cis chains along
the principal direction. For trans chains, the extent of stretching decreased slightly
with increasing chain length. For cis chains, the extent of stretching was larger with
increasing chain length. The change in ratio between the two secondary directions
followed the same trend as the principal direction but more subtly. These behaviors
indicate that trans chains were slightly more spherical while cis chains were slightly
less spherical with increasing chain length. At the same chain length, trans chains
were slightly less spherical than cis chains. At long chain lengths, trans and cis
chains have similar spherical shapes. The changes in the ratio between the two
secondary directions were small compared to the changes in average chain size
〈r2g〉0.
Figure 9 shows there was little or no variation in relative chain extent with
temperature for cis chains. The principal direction ratio increased slightly with
35
temperature for trans chains, while minor variations arose in ratio between the
two secondary directions. This shows that as the temperature increased, trans
chains were slightly more stretched along the principal direction. Little or no
variation in relative chain extent for cis chains meant little or no change in their
shape with temperature. Trans chains stretched slightly and thus were slightly
less spherical with increasing temperature. Chain shape trends shown in figures 8
and 9 confirm that variations in the eigenvalue (λ1) corresponding to the longest
principal direction have the most significant effects on chain shapes.
0 0.02 0.04 0.06 0.082
4
6
8
10
12
14
1/n
Eig
enval
ue
rati
o
⟨λ1/λ
3⟩
⟨λ2/λ
3⟩
trans
cis
Figure 8. Averaged ratios of the largest and intermediate eigenvalues to the small-est eigenvalue at 343 K.
36
260 300 340 380 4202
4
6
8
10
12
14
T(K)
Eig
enval
ue
rati
o
⟨λ1/λ
3⟩
⟨λ2/λ
3⟩
trans
cis
Figure 9. Averaged ratios of the largest and intermediate eigenvalues to the small-est eigenvalue for chains of 50 repeat units.
Figures 10 and 11 show variations in average shape parameters with inverse
of chain length and temperature respectively. An asphericity factor (b/r2g) of 0
suggests a spherical shape and 1 suggests a rod-like shape, while an acylindricity
factor (c/r2g) of 0 suggests a round cross section and 0.5 suggests a more flat cross
section normal to the longest axis. κ2 of 0 suggests a rod-like shape whereas 1
suggests structures of tetrahedral or of higher symmetry [16].
Figure 10 shows that both cis and trans chains show similar asphericity of
0.6 at longer chain lengths. An asphericity of 0.6 corresponds to a chain with
contribution to the squared radius of gyration that is around 5.5 times larger in
37
the longest direction; it is also consistent with the 12:2.5:1 ratios shown in figures
8 and 9. Cis chains were more spherical at shorter chain lengths and gradually
were slightly less spherical with increasing chain length, whereas trans chains were
less spherical at smaller chain lengths and were very slightly more spherical with
increasing chain length. This change in shape was more subtle for trans chains
than cis. This behavior followed the same trend shown in figure 8.
Figure 11 shows that cis chains exhibited little or no change in shape with
temperature. Trans chains were slightly less spherical with increasing temperature.
This behavior followed the same trend shown in figure 9.
The relative shape anisotropy followed the same trend as asphericity as func-
tions of both chain length and temperature. The acylindricity did not show
much observable deviation with chain length or temperature for either cis or trans
polybutadiene chains. Its value of 0.1 indicates chain fluctuations moderately
larger in one minor direction compared to the other and thus corroborates the
effect of small changes in ratio between the two secondary directions as compared
to average chain size, as shown in figures 8 and 9.
38
0 0.02 0.04 0.06 0.080.1
0.2
0.3
0.4
0.5
0.6
0.7
0.8
1/n
Shap
e par
amet
ers
⟨b/rg
2⟩0
⟨c/rg
2⟩0
⟨κ2⟩0
trans
cis
Figure 10. Average shape factors with inverse of chain length at 343 K. Subscript0 indicates unperturbed conditions.
260 300 340 380 4200.1
0.2
0.3
0.4
0.5
0.6
0.7
0.8
T(K)
Shap
e p
aram
eter
s
⟨b/rg
2⟩0
⟨c/rg
2⟩0
⟨κ2⟩0
cis
trans
Figure 11. Average shape factors with temperature for chains of 50 repeat units.Subscript 0 indicates unperturbed conditions.
39
2.4.3 Joint correlations in size and shape
Joint correlations between chain size and shape were studied to determine if
their variations with chain length and temperature were independent or dependent
properties. Cis and trans chains showed similar joint correlation behavior, with
correlation and anti-correlation between chain size and shape occuring to a greater
extent for trans chains as compared to cis chains.
Figures 12 and 13 show joint correlations for cis chains of 50 repeat units.
Multiple visualizations of these three-dimensional plots are available as sup-
plementary material (chapter 3). Differences[P (b/r2g , r
2g)− P (b/r2g)P (r2g)
]and
[P (c/r2g , r
2g)− P (c/r2g)P (r2g)
]of 0 indicate size and shape are completely indepen-
dent of each other, i.e. they act as mutually exclusive events. A positive difference
indicates correlated events, while negative indicates anti-correlation.
For small rod-like chains, which arise less typically than average, figure 12
indicates some anti-correlation between size and shape. Small chains were nearer to
spherical in shape, and high correlation between chain size and shape was observed
for them. For medium size chains, some correlation was found for chains that are
near rod-like, while notable anti-correlation was found for more spherical chains.
Rod-like large chains showed correlation between chain size and shape.
40
Figure 13 shows size-shape correlations for acylindricity in cis chains. Small
chains showed good correlation with being nearly round in cross section. Medium
size chains showed correlation for chains that were more flattened in cross section.
For medium size chains with round cross sections, the relationship between size
and shape became anti-correlated. Large chains showed minor correlation between
chain size and shape with being nearly round in cross section.
0 0.2 0.4 0.6 0.8 1 0 200400600800−0.01
−0.005
0
0.005
0.01
0.015
0.02
rg2 Å2
b/rg2
P b, g(b
/rg2 ,r
g2 ) −
P b(b/r
g2 )Pg(r
g2 ) (
1/Å
2 )
−5 0 5 10 15
x 10−3
rod
sphere
Figure 12. Joint correlations of probability density of chain size (Pg) and aspheric-ity (Pb) for cis chains of 50 repeat units at 343 K.
41
00.10.20.30.40.5 0 200400600800−0.02
−0.01
0
0.01
0.02
0.03
0.04
rg2 Å2c/r
g2
P c, g(c
/rg2 ,r
g2 ) −
P c(c/r
g2 )Pg(r
g2 ) (
1/Å
2 )
−0.01 0 0.01 0.02
flattened
round
Figure 13. Joint correlations of probability density of chain size (Pg) and acylin-dricity (Pc) for cis chains of 50 repeat units at 343 K.
In total, different size and shape probability density distributions were found
for cis and trans chains over different chain lengths and across a range of tempera-
tures. Probability densities are related to the work required to alter chain size and
shape, and thus different probability densities for cis- and trans-1,4-polybutadiene
indicate different extents of work that must be done in order to alter chain size
and shape. Quantifying this deformation work is the subject of ongoing research.
2.5 Conclusions
Ensemble averages and probability density distributions of sizes and shapes
of cis- and trans-1,4-polybutadiene chains have been quantified for isolated single
42
chains under undeformed theta conditions. Such conformations are considered to
be representative for a chain in its own melt.
Characteristic ratios were larger with increasing chain length for both cis
and trans chains, and these were in good agreement with experimental and prior
computed values (cis-1,4-polybutadiene), and slightly higher than prior computed
values (trans-1,4-polybutadiene). Characteristic ratios were higher for trans chains
than for cis chains and indicate greater chain extension, which could be due to a
greater distance spanned between the carbon atoms bonded to the double bonded
carbons.
A Gaussian model predicted higher probability than simulation results at
shorter and longer chain sizes for both cis and trans chains. Simulation results pre-
dicted a higher probability than the Gaussian model at certain regions of medium
size chains for cis and trans chains while at other regions of medium size chains,
simulation and Gaussian results were in agreement.
Characteristic ratios increased with increasing temperature for both cis and
trans chains, with trans chains showing greater temperature dependence. Small
absolute changes in chain size probability densities with increasing temperature
was observed. Smaller chain conformations showed a smaller relative decrease in
43
probability density as compared to a larger relative increase in probability density
for larger chain conformations with increasing temperature, thus resulting in an
increase in average chain size. For constant chain length, larger chain sizes showed
a much higher increase in characteristic ratios with temperature than smaller chain
sizes. This accounted for an increase in average characteristic ratio of polybutadi-
ene chains with increasing temperature, which results in chain swelling on heating.
This “taut conformation effect” was more pronounced for trans- than for cis-1,4-
polybutadiene chains.
With increasing chain length, trans chains were slightly compressed while cis
chains were stretched along the principal direction. Resultantly trans chains were
slightly more spherical and cis chains were slightly less spherical with increasing
chain length. At the same chain length, trans chains were slightly less spherical
than cis chains. At long chain lengths, trans and cis chains have similar spherical
shapes. The extent of stretching and compression was greater along the principal
direction than the secondary directions. With increasing temperature, trans chains
were slightly stretched along the principal direction whereas cis chains showed
little or no change in shape. Thus trans chains were slightly less spherical with
increasing temperature, while little or no variation in shape was computed for cis
44
chains. Variations of the largest eigenvalue λ1 of the radius of gyration matrix
have the most significant effects on chain shapes: most changes in shapes arose
from changes along the longest principal direction.
At longer chain lengths, both cis and trans chains showed similar asphericity.
Little or no variation was computed in acylindricity for either cis or trans polybu-
tadiene chains. Relative shape anisotropy followed the same trend as asphericity
as functions of both chain length and temperature for cis and trans polybutadiene
chains.
Joint correlation studies revealed that size and shape parameters are mutually
dependent properties of chains. For asphericity, small size rod-like cis chains indi-
cated anti-correlation between size and shape. Small size spherical chains showed
high amount of correlation between size and shape. For medium size chains, no-
table anti-correlation between size and shape was observed for spherical chains
whereas some correlation between size and shape was observed for near rod-like
chains. Large rod-like chains showed correlation between size and shape. For
acylindricity, round cross section small size chains showed good correlation be-
tween size and shape, whereas medium size chains showed correlation between
size and shape for flattened cross section chains. Round cross section medium
45
size chains showed anti-correlation between chain size and shape. Large chains
showed minor correlation between size and shape with being nearly round in cross
section. Trans chains showed similar correlation and anti-correlation between size
and shape as cis chains, yet to a greater extent.
Cis- and trans-1,4-polybutadiene show different size and shape probability
density distributions, which imply different amounts of deformation work to alter
chain shape and size. Quantifying this deformation work and its implications for
mechanical properties, viscoelastic properties, and rolling resistance are the subject
of ongoing work.
2.6 Acknowledgements
We thank the Ford Motor Company University Research Program for funding
this research.
List of References
[1] C. M. Blow and C. Hepburn, Rubber Technology and Manufacture. Plastics
and Rubber Institute, London, 1982.
[2] J. L. White, Rubber Processing: technology, materials, and principles.
Hanser, Munich, 1995.
[3] J. W. Ten Brinke, V. M. Litvinov, J. E. G. J. Wijnhoven, J. W. M. Noorder-
meer, “Interactions of stober silica with natural rubber under the influence of
46
coupling agents, studied by 1H NMR T2 relaxation analysis,” Macromolecules,
vol. 35, pp. 10 026–37, 2002.
[4] L. A. E. M. Reuvekamp, S. C. Debnath, J. W. Ten Brinke, J. P. Van Swaaij,
J. W. M.Noordermeer, “Effect of zinc oxide on the reaction of TESPT silane
coupling agent with silica and rubber,” Rubber Chem.Tech, vol. 77, no. 1,
2004.
[5] C. M. Flanigan, L. Beyer, D. Klekamp, D. Rohweder, B. Stuck, and E. R.
Terrill, “Comparative study of silica, carbon black and novel fillers in tread
compounds.” 180th Technical Meeting of the Rubber Division of the Amer-
ican Chemical Society, Cleveland, OH, pp. 504-35, 2011.
[6] P. J. Flory, Principles of Polymer Chemistry. Cornell University Press, 1953.
[7] G. Moraglio, “Cistactic polybutadiene: unperturbed molecular dimensions at
various temperatures,” Eur. Polym. J., vol. 1, no. 2, pp. 103–9, 1965.
[8] M. Abe and H. Fujita, “Binary mixtures of theta-solvents,” J. Phys. Chem.,
vol. 69, no. 10, pp. 3263–7, 1965.
[9] P. J. Flory, Statistical Mechanics of Chain Molecules. Wiley Interscience,
1969.
[10] J. E. Mark, “Random-coil configurations of cis-l,4-polybutadiene and cis-1,4-
[11] J. E. Mark, “Interpretation of random-coil configurations of trans-1,4-
polybutadiene and trans-1,4-polyisoprene,” J. Amer. Chem. Soc., vol. 89,
no. 26, pp. 6829–35, 1967.
47
[12] P. J. Flory and Y. Abe, “Configurational statistics of 1,4-polybutadiene
chains,” Macromolecules, vol. 4, no. 2, pp. 219–29, 1971.
[13] W. L. Mattice and Y. Li, “Atom-based modeling of amorphous 1,4-cis-
polybutadiene,” Macromolecules, vol. 25, pp. 4942–47, 1992.
[14] M. P. Allen and D. J. Tildesley, Computer Simulation of Liquids. Oxford
Univ. Press, 1987.
[15] G. J. Maitland, M. Rigby, E. Smith, and W. Wakeham, Intermolecular Forces,
Their Origin and Determination. Clarrendon Press, Oxford, 1981.
[16] D. N. Theodorou and U. W. Suter, “Shape of unperturbed linear polymers:
polypropylene,” Macromolecules, vol. 18, no. 6, pp. 1206–14, 1985.
[17] P. C. Hiemenz and T. P. Lodge, Polymer Chemistry, 2nd Edition. CRC
Press, Taylor & Francis Group, 2007.
48
CHAPTER 3
Supplementary Material
Supplementary material contains three dimensional visualizations of joint cor-
relations between chain size and shape. The plots have been rotated at intervals
of 60◦ about their azimuth angle (az) i.e rotated at intervals of 60◦ about their
horizontal axes. The vertical elevation (el) of the plots is 15◦. All the plots are
for 50 repeat unit cis-1,4-polybutadiene chains at 343 K. Trans-1,4-polybutadiene
chains show similar correlation and anti-correlation behavior between chain size
and shape as cis chains, yet to a greater extent.
49
az = 0°, el=15°
az = 60°, el=15°
az = 120°, el=15°
az = 180°, el=15°
az = 240°, el=15°
az = 300°, el=15°
Figure 14. Joint correlations of probability density of chain size (Pg) and aspheric-ity (Pb) for cis-1,4-polybutadiene chains of 50 repeat units at 343 K.
50
az = 0°, el=15°
az =60°, el=15°
az =120°, el=15°
az = 180°, el=15°
az = 240°, el=15°
az = 300°, el=15°
Figure 15. Joint correlations of probability density of chain size (Pg) and acylin-dricity (Pc) for cis-1,4-polybutadiene chains of 50 repeat units at 343 K.
51
CHAPTER 4
Conclusions, Current Work and Future Work
Flory’s Rotational Isomeric State approach was used to generate isolated single
chains of cis- and trans-1,4-polybutadiene over a range of temperatures and chain
lengths. 100,000 isolated single chains were generated under each condition of
chain length and temperature. Using a single chain is justified since a flexible
polymer surrounded by the same polymer takes on the same average shape as
a single random polymer chain. Probability density distributions of the chain
ensembles were quantified under unperturbed conditions (attractive and repulsive
forces balanced between polymer-solvent i.e. theta conditions).
4.1 Conclusions
Characteristic ratios were in good agreement with experimental [1, 2] and
prior computed values [3] (cis-1,4-polybutadiene), and slightly higher than prior
computed values [4] (trans-1,4-polybutadiene). Cis and trans chains characteristic
ratios were larger with increasing chain length. Higher characteristic ratios for
trans chains than cis chains indicated greater chain extension, which could poten-
tially be a result of greater distance spanned between the carbon atoms bonded
52
to the double bonded carbons. Characteristic ratios computed here increased with
increasing temperature, with the increase being more prominent for trans chains
than cis polybutadiene chains. Small absolute changes in chain size probability
densities with temperature were observed. The increase in characteristic ratio can
be attributed to a larger relative increase in probability density of larger size chains
as compared to a smaller relative decrease in probability density of the smaller size
chains with increasing temperature. This resulted in an increase in the average size
of the chains with increasing temperature. The larger chains showed a much higher
increase in characteristic ratios with temperature than smaller chains, and this ef-
fect was stronger for trans than for cis chains. Increase in characteristic ratios can
be attributed to the size increase of the extended and taut chain conformations;
hence we have named this effect as the “taut conformation effect”. Swelling of
these polymer chains upon heating can thus be attributed to a size increase of the
relatively few extended and taut conformations, rather than expansion uniformly
across conformations of all sizes.
For limit of long chains, the mean squared radius of gyration 〈r2g〉0 should
equal 1/6 of the mean squared end-to-end distance 〈r2〉0 [5]. The ratio 〈r2〉0/〈r2g〉0
was higher than 6 for shorter trans chains and decreased to 6 at longer lengths.
53
For cis chains, the ratio was slightly higher than 6 for all chain lengths.
The chain size probability density distributions of the cis- and trans-1,4-
polybutadiene chains were compared to the Gaussian model [5, 6]. Gaussian model
predicted higher probability than simulation results at shorter and longer chain
sizes for both cis and trans chains. Simulation results predicted higher probabil-
ity than the Gaussian model at certain regions of medium size chains for cis and
trans chains while at other regions of medium size chains, simulation and Gaussian
results were in agreement.
The eigenvalues λ1, λ2, and λ3 of the radius of gyration matrix used by
Theodorou and Suter [7] indicate the extents of orthogonal principal axes that
span the region occupied by a chain in primary and secondary directions (eigen-
vectors). Ratios of eigenvalues indicate if chains are being stretched or compressed.
Two different shape comparisons were done for cis and trans chains: with increas-
ing chain length and with increasing temperature. With increasing chain length,
trans chains were slightly compressed along the principal direction while cis chains
were slightly stretched. Resultantly trans chains were slightly more spherical with
increasing chain length while cis chains were slightly less spherical. At the same
chain length, trans chains were slightly less spherical than cis chains. At long chain
54
lengths, trans and cis chains have similar spherical shapes. The extent of stretching
and compression was more along the principal direction than the secondary direc-
tions. With increasing temperature, trans chains were slightly stretched along the
principal direction, whereas cis chains showed little or no change in shape. Thus
trans chains were slightly less spherical in shape with increasing temperature while
little or no variation in shape was computed for cis chains. Most changes in shapes
arose from changes along the longest principal direction.
Ensemble averages of chain shape parameters such as asphericity (deviation
from spherical shape), acylindricity (deviation from cylindrical shape) and relative
shape anisotropy were studied based on the radius of gyration matrix for both cis
and trans chains of different chain lengths and over different temperature ranges.
Cis and trans chains showed similar asphericity behavior at longer chain lengths
i.e. an asphericity value of 0.6. An asphericity of 0.6 corresponds to a chain
with a contribution to the squared radius of gyration that is around 5.5 times
larger in the longest direction than the secondary directions. At the longer chain
lengths, the averaged ratio of the eigenvalues along the longest to the shortest
direction was around 12, while at the same chain length, the averaged ratio of
the eigenvalues along the secondary directions was around 2.5; this corroborates
55
that the contribution to the radius of gyration was around 5.5 times larger in the
longest direction than the secondary directions.
The relative shape anisotropy followed the same trends as the asphericity as
functions of both chain length and temperature. The acylindricity factor did not
show much observable deviation with chain length and temperature for both cis
and trans chains.
Joint correlation studies between chain size and shape showed that they are
mutually dependent properties. For asphericity, rod-like small size and spheri-
cal medium size cis chains showed anti-correlation between chain size and shape.
Spherical small size, near rod-like medium and large size chains showed correlation
between chain size and shape.
For acylindricity, medium size chains of flattened cross section, and small and
large size chains of round cross section showed correlation between chain size and
shape. Round cross section medium size chains showed anti-correlation between
chain size and shape. Trans chains showed similar behavior as cis chains with
correlation and anti-correlation between chain size and shape occuring to a greater
extent.
Probability densities are related to the work required to alter chain size and
56
shape. Cis- and trans-1,4-polybutadiene chains showed different probability den-
sity distributions, and thus different amounts of work would be needed to be done
on them to bring about a change in their chain conformations. This deformation
work can be quantified to determine mechanical properties, viscoelastic properties
and rolling resistance. Thus it can be seen that changes in chain conformations
directly impacts rolling resistance of vehicle tires.
4.2 Current Work
Currently I am looking at how cis- and trans-1,4-polybutadiene chain size and
shape are affected under deformation. I am using the same ensemble of single
isolated chains (100,000) under the same range of chain length and temperature,
and applying deformation on them. Instead of squared end-to-end distance (r2),
I am using end-to-end distance vectors in the x, y, and z directions (rx, ry, and
rz) to study the extent of deformation in each of those directions of the chains.
Probability density distributions of the end-to-end distance vectors help quantify
the deformation force acting on the chain ensembles. Deformation leads to changes
in chain conformations which results in entropy losses of the chains (since entropy
is related logarithmically to chain conformations [8]). These entropy losses lead to
computing irreversible work, viscoelastic losses and ultimately rolling resistance.
57
4.3 Future Work
Future work includes introducing reinforcement fillers (carbon black, silica
and their derivatives) in our system and seeing how elastomer-filler interactions
impact rolling resistance of the elastomer-filler system and to what extent [9]. The
results of deformation work and elastomer-filler interactions will be included in my
PhD dissertation.
List of References
[1] G. Moraglio, “Cistactic polybutadiene: unperturbed molecular dimensions at
various temperatures,” Eur. Polym. J., vol. 1, no. 2, pp. 103–9, 1965.
[2] M. Abe and H. Fujita, “Binary mixtures of theta-solvents,” J. Phys. Chem.,
vol. 69, no. 10, pp. 3263–7, 1965.
[3] J. E. Mark, “Random-coil configurations of cis-l,4-polybutadiene and cis-1,4-