28
A routinely exceptional year February 2017 Private Equity and Principal Investors Practice McKinsey Global Private Markets Review
A routinely exceptional year
February 2017 Private Equity and Principal Investors Practice
McKinsey Global Private Markets Review


1A routinely exceptional year McKinsey Global Private Markets Review
Private markets continue to defy expectations. But competition is getting tougher for both managers and investors.
In 2016, the most exciting news for private markets may have been what didn’t change. In these markets—mainly private equity but also closed-end funds for real estate, infrastructure, natural resources, and private debt—investors’ desire to allocate remains strong. Whether measured by fundraising (firms received $625 billion of new capital in 2016) or assets under management (AUM), now $4.7 trillion worldwide, private markets in 2016 continued an impressive cycle of expan-sion that began in 2008. The industry continues to provide a source of excess capital for investors; in 2016, distributions outstripped capital calls for the fourth year running. New entrants continue to flock to the industry, and the number of active firms is at an all-time high. (For more on the scope of our research, see sidebar, “Private markets, defined.”)
While growth in fundraising, AUM, and capital distributions to investors are trends to celebrate, growth also presents challenges. The larger number of general partners (GPs) reflects the industry’s success but also heralds increased competition, which has contributed to rising deal multiples. As GPs have grown gun-shy about today’s higher prices, deal activity has fallen, and dry powder has reached an all-time high— though our research suggests that dry powder is not nearly the problem that some have suggested. In fact, in this and other ways, the industry is overcoming its growing pains and finding new ways to deliver for its investors.
Discussions with industry leaders reveal several common themes about what to expect in 2017. All acknowledge an extraordinary number of wild cards in play, in geopolitics above all, particularly
around Brexit and in the United States around tax, trade, and infrastructure, and sectors such as healthcare, energy, defense, and industrials. While these unknowns will create opportunity for some, most GPs acknowledge that this sort of uncertainty is very difficult to price. As one CEO said, “Some of these changes in the US will raise the base case for GPs, but the tails are very fat.”
Most agree that public markets, despite their recent run-up, are becoming structurally less attractive to many limited partners (LPs), who will likely respond by further raising their alloca- tions to private markets. Creativity in fees and products will flourish, producing a range of options: we will still see full-service GPs offering closed-end funds, of course, but also more LPs in co-investments, more separate accounts, and at least a few more LPs investing directly. Finally, most executives believe emerging markets will normalize following the recent period of turbulence and will start to more closely resemble the industry in developed markets.
About this reportTo produce this report, we have developed new analyses drawn from our long-running research on private markets, based on the industry’s leading sources of data.1 We have also conducted interviews with executives at some of the world’s largest and most influential GPs and LPs. Finally, we have gathered insights from our colleagues around the world who work closely with asset owners and managers.
This report begins with a review of the industry’s capital flows in 2016. Next, we discuss the
A routinely exceptional year

2 A routinely exceptional year McKinsey Global Private Markets Review
challenges of growth and the ways the industry is already proving it can manage growth responsibly. We conclude with some ideas for even better stewardship of private assets in a time of plenty.
THE BEAT GOES ONPrivate markets are still growing. Fundraising grew slightly in 2016, as LPs’ need for stable returns to address liability and budget gaps, and their continued faith in private markets’ potential for outperformance, remains largely unchanged. Looking one level deeper, private equity and infrastructure raised more than in previous years, while closed-end funds for real estate, private debt, and natural resources raised less. The year 2016 also saw an increasing portion of new capital landing in the largest “mega-funds” of $5 billion or more, as LPs placed more capital
with fewer managers. Looking forward, this level of modest fundraising growth is likely to continue. The poor outlook for public-market returns, in conjunction with LPs’ high expectations, will likely drive an increase in target allocations to private markets.
Satisfying LP demandLPs’ desire for private market funds continued to grow in 2016. For pension funds, still the largest category of LP, this demand has been driven largely by their increasing liability gaps. In the United States, for example, the Federal Reserve estimates that the gap in pension liabilities across federal, state, local, and private pensions grew 3 percent from 2015 to 2016, reaching $4.3 trillion (Exhibit 1). For many sovereign-wealth funds (SWFs), demand has been created by the strain that lower commodity prices have put on national budgets. One CEO of a leading
Private markets, defined
We consider “private markets” to include closed- end funds investing in private equity, real estate, private debt, infrastructure, or natural resources, as well as related secondaries and funds-of-funds. We exclude hedge funds and publicly traded or open-end funds. We analyzed five asset classes:
1. private equity: buyouts, venture capital (VC), and growth equity
2. real estate: closed-end funds that invest in property, excluding direct holdings, listed real estate holdings (such as REITs), and open- ended funds
3. private debt: closed-end funds that invest in nonlisted debt issues, including bonds, notes, or loans
4. infrastructure: closed-end funds that invest in large-scale projects, excluding investments in public-infrastructure firms and listed funds
5. natural resources: closed-end funds that invest in real assets (for example, agriculture/farmland, oil and gas reserves, mines and metal-processing plants, and timberland) and other assets

3A routinely exceptional year McKinsey Global Private Markets Review
Exhibit 1 The liability gap is widening.
Private equity report 2017Exhibit 1 of 19
2015
Assets Liability gap Assets Liability gap
2016Funded ratio, 2016, %
Liability gap CAGR,5 2015–16, %
1 Federal Reserve estimates US pension assets as comprising federal government retirement funds, state and local government employee retirement funds, and private pension funds.
2 Includes defined-benefit state and local government employee retirement funds. 3 Includes defined-benefit federal government employee retirement funds. 4 Includes private defined-benefit plans. 5 Compound annual growth rate. Source: Federal Reserve Statistical Release, Dec 2016
Total assets and liability gaps in US pensions, 2015–16, $ billion
Federal3
Total1 7,986 4,150
1,822
1,512
8,187 66 3
67 3
44 4
85 2
4,276
State and local2
3,664 3,818
Private4 2,810 2,855
1,890
1,879
1,515
1,832
497 507
private equity firm remarked, “With pressure on commodity prices, SWFs are going to be in the same position as US pension funds. They are allocated 5 or 6 percent to private equity now and will go to 10 or 11 percent.” Interest in private market investing among high-net-worth individuals is also increasing, leading GPs to launch new products for retail high-net- worth investors.
LPs’ continued interest in private markets is also a function of their anxiety about the outlook for public markets. As the McKinsey Global Institute has concluded,2 LPs face the prospect of a sus-
tained low-return environment in public markets over the next 20 years (Exhibit 2). In a slow-growth scenario, US equity returns may fall by as much as 390 basis points, and fixed-income returns by as much as 590 basis points. In a growth recovery scenario, US equity returns could fall as much as 240 basis points, and fixed-income returns by 490 basis points.
In the face of these subdued returns, LPs will continue to look to private markets based on their belief in these markets’ outperformance relative to public markets. This confidence is reinforced by the positive cash flow private markets have

4 A routinely exceptional year McKinsey Global Private Markets Review
Exhibit 2 In two growth scenarios, returns over the next 20 years would be substantially lower than in the 1985–2014 period.
Private equity report 2017Exhibit 2 of 19
%
1 Time frame between 1914 and 1927, calculated using Dimson-Marsh-Staunton database, which targets a bond duration of 20 years. Bond duration for 1928 and later is 10 years.
2 Historical returns for Western European fixed-income are based on treasury bonds using data from the Dimson-Marsh-Staunton Global Returns database, which targets a bond duration of 20 years. Future returns show ranges across a set of countries and are based on 10-year bonds.
Source: McKinsey Global Institute analysis
Returns on bonds and equities, 1985–2014 Projected growth recovery, 2016–35
Projected slow growth, 2016–35 Past 100 years’ average return
US equities
5.5–6.5
Growthrecovery
Slowgrowth
7.9
1985–2014
6.5
European equities
5.0–6.0
Growthrecovery
4.5–5.0
Slowgrowth
7.9
1985–2014
4.9
US government bonds1
1.0–2.0
Growthrecovery
0–1.0
Slowgrowth
5.0
1985–2014
1.7
European government bonds2
1.0–2.0
Growthrecovery
0–1.0
Slowgrowth
5.9
1985–2014
1.6
4.0–5.0
Exhibit 3 Distributions continue to exceed capital calls.
Private equity report 2017Exhibit 3 of 19
Global private market capital, called and distributed
Volume,1 $ billion
Distribution
Capital called
Distribution in excess of capital called, %
1 Volume is shown by year of final close. Source: Preqin; McKinsey analysis
0
300
200
400
600
800
600
900
–70
0
–35
35
70
20042000 20122008 1st half of 2016

5A routinely exceptional year McKinsey Global Private Markets Review
provided to LPs over the past four years, creating a source of capital with which to meet their liabilities or reinvest. In the first half of 2016, distributions to LPs exceeded capital calls by 64 percent (about $197 billion), an increase of 36 percentage points over 2015 (Exhibit 3). Further, 2016 marks the fourth consecutive year of this trend.
Fundraising marches onMore capital was allocated to private markets in 2016, owing to LPs’ increasing need to put money to work and private markets’ continued strong performance. Annual fundraising reached nearly
$625 billion, a level last seen in 2007–08 (Exhibit 4). To be sure, fundraising growth has slowed from the hectic pace in the early years of the recovery; it grew by less than 1 percent in 2015–16. But modest year-on-year growth belies the extraordinary fact that for the last four years, fundraising has been nearly as high as in 2006–07, a period many had viewed as an aberrant boom. Thus, fundraising in private markets— in particular, private equity—has for the moment managed to maintain not just stability but even some degree of growth from a very high base.
Exhibit 4 Fundraising remains healthy.
Private equity report 2017Exhibit 4 of 14
Private market fundraising, 2003–16, $ billion
Total
Private equity
Real estate
Private debtInfrastructureNatural resources
15.1
14.4
18.3
17.67.5
15.3
0.7
7.3
–9.8
–10.640.1
–19.4
5-year CAGR,1
2010–15, %Growth,2015–16, %
1 Compound annual growth rate. Source: Preqin
0
300
400
500
100
200
600
700
20062003 2009 20162012
6 A routinely exceptional year McKinsey Global Private Markets Review
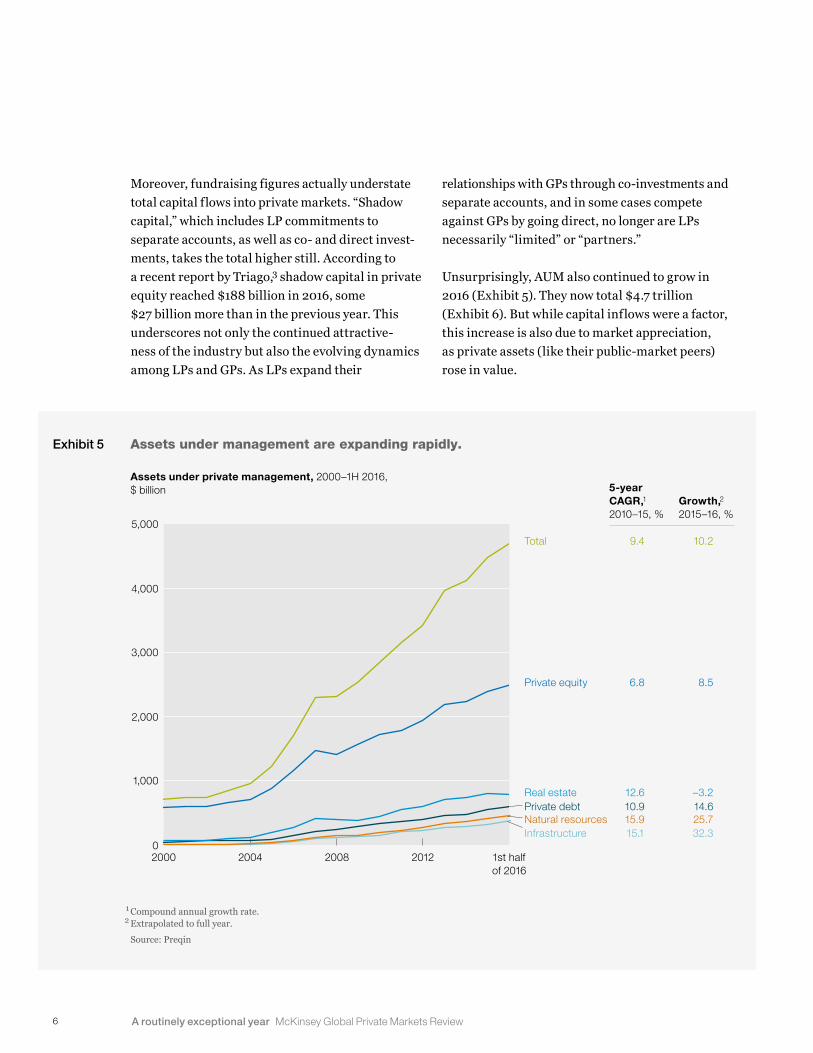
Moreover, fundraising figures actually understate total capital flows into private markets. “Shadow capital,” which includes LP commitments to separate accounts, as well as co- and direct invest-ments, takes the total higher still. According to a recent report by Triago,3 shadow capital in private equity reached $188 billion in 2016, some $27 billion more than in the previous year. This underscores not only the continued attractive- ness of the industry but also the evolving dynamics among LPs and GPs. As LPs expand their
relationships with GPs through co-investments and separate accounts, and in some cases compete against GPs by going direct, no longer are LPs necessarily “limited” or “partners.”
Unsurprisingly, AUM also continued to grow in 2016 (Exhibit 5). They now total $4.7 trillion (Exhibit 6). But while capital inflows were a factor, this increase is also due to market appreciation, as private assets (like their public-market peers) rose in value.
Exhibit 5 Assets under management are expanding rapidly.
Private equity report 2017Exhibit 5 of 19
Assets under private management, 2000–1H 2016, $ billion
Total
Private equity
Real estatePrivate debt
InfrastructureNatural resources
9.4
6.8
12.610.9
15.115.9
1 Compound annual growth rate. 2 Extrapolated to full year. Source: Preqin
Growth,2
2015–16, %
10.2
8.5
–3.214.6
32.325.7
5-year CAGR,1
2010–15, %
0
2,000
3,000
1,000
4,000
5,000
20042000 2008 1st half of 2016
2012
7A routinely exceptional year McKinsey Global Private Markets Review
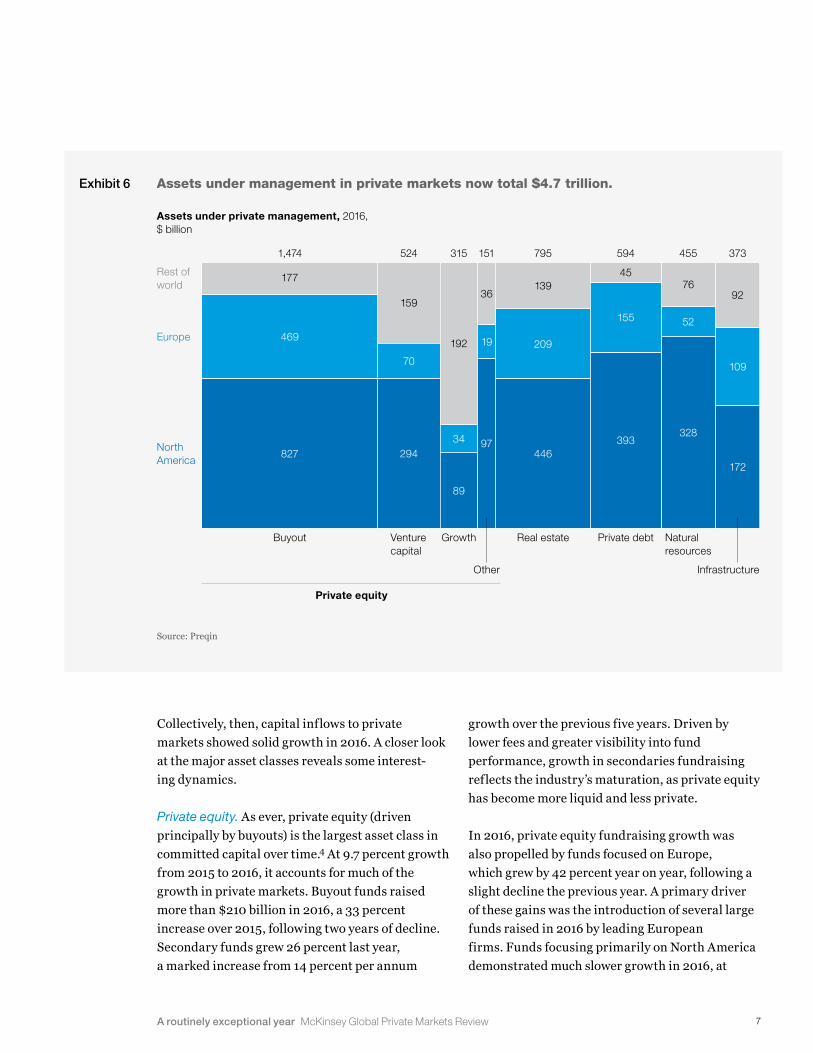
Collectively, then, capital inflows to private markets showed solid growth in 2016. A closer look at the major asset classes reveals some interest- ing dynamics.
Private equity. As ever, private equity (driven principally by buyouts) is the largest asset class in committed capital over time.4 At 9.7 percent growth from 2015 to 2016, it accounts for much of the growth in private markets. Buyout funds raised more than $210 billion in 2016, a 33 percent increase over 2015, following two years of decline. Secondary funds grew 26 percent last year, a marked increase from 14 percent per annum
growth over the previous five years. Driven by lower fees and greater visibility into fund performance, growth in secondaries fundraising reflects the industry’s maturation, as private equity has become more liquid and less private.
In 2016, private equity fundraising growth was also propelled by funds focused on Europe, which grew by 42 percent year on year, following a slight decline the previous year. A primary driver of these gains was the introduction of several large funds raised in 2016 by leading European firms. Funds focusing primarily on North America demonstrated much slower growth in 2016, at
Exhibit 6 Assets under management in private markets now total $4.7 trillion.
Private equity report 2017Exhibit 6 of 19
Assets under private management, 2016, $ billion
Source: Preqin
524
Venture capital
455
Natural resources
373
Infrastructure
Growth
Other
1,474
177
469
827
159
70
294
315
192
89
34
Buyout
Rest of world
North America
Europe
Private equity
795
Real estate
594
Private debt
13945
7692
209
446
155
109
52
393
172
328
151
36
19
97

8 A routinely exceptional year McKinsey Global Private Markets Review
6 percent, after large growth in 2013. Asia fell by 21 percent, while the rest of the world fell more dramatically, by 36 percent. For Asia, recent years of sustained fundraising growth appear to be giving way to a period of caution around over-committing and overdeploying capital. LPs in Asia have become more selective, in contrast to the “let a thousand flowers bloom” mentality of the past, during which LP investments were often spread across a broad group of 30 to 50 or more managers.
These differences in regional fundraising growth do not reflect regional economic outlooks. As one CEO noted, “If you inferred people’s opinions from their current asset allocations, you would think that Europe was fastest growing, Asia was underperforming, and the US was stable— and you would be wrong on all three counts.”
Infrastructure. Fundraising for infrastructure grew 40 percent in 2016, fastest among private asset classes (see Exhibit 4 on page 6). Much of the growth has come from LPs with long-term liabilities, which see infrastructure as an uncorre-lated substitute for traditional fixed income; infrastructure yields are typically better than fixed income, while bearing a similar risk profile. Infrastructure can also provide inflation-protected real returns, as adjustments for inflation are often built into the agreements.
In North America and Europe (which grew at 87 and 64 percent, respectively), infrastructure fundraising has now surpassed pre-crisis levels. Asia also saw a modest increase (19 percent), while the rest of the world fell dramatically by 80 percent. One factor that may explain these changes is the degree to which infrastructure growth in emerging markets has been driven by greenfield deals. Recently, emerging-market greenfield projects have faced difficulties with impaired exit valuations, which has dampened
fundraising. In North America and Europe, the fastest-growing regions, the portion of greenfield investment as a percentage of the overall total deal volume over the past decade was relatively low (36 percent and 43 percent, respectively). In Asia and the rest of the world, the rates were much higher (51 and 64 percent, respectively).
Natural resources, real estate, and private debt funds. From 2010 to 2015, fundraising expanded at a healthy rate for natural resources, real estate, and private debt funds. Then all three categories saw fundraising shrink in 2016.
Fundraising for closed-end natural resources funds has grown in recent years, as the liability profile of many LPs (such as pension funds) allows them to play long-term themes without the pressure to sell. Yet natural resources remains a small asset class.
Fundraising for closed-end real estate funds has grown at 18 percent per annum from 2009 to 2015. Fundraising fell slightly in 2016, however, in part due to “lumpiness” of large opportunistic funds; the three biggest funds of the year totaled nearly $25 billion in 2015 but just $15 billion in 2016. LPs continue to show their faith in the asset class by raising their target allocations, but deals must follow or fundraising could slow because of excess dry powder in the system.
The experience of closed-end private debt funds also varies by region. In Europe and North America, despite lower fundraising in 2016, interest in this asset class has remained strong over the past five years, as traditional private equity GPs expand their business model. In Europe (particularly Germany), demand for private debt has risen because stricter regulation and capital requirements have constrained banks’ ability to lend to midcap companies. In Asia, however, the attractiveness of private debt has been

9A routinely exceptional year McKinsey Global Private Markets Review
tempered by concerns over spreads. In countries that lack formal debt markets (such as India), investors typically bear a higher cost of capital, which makes the risk-reward calculus on private debt spreads unattractive. In more formal debt markets (such as Japan, Singapore, or South Korea), spreads are often insufficiently attrac- tive because debt is either too cheap (as in Japan’s negative-interest-rate environment) or too efficiently traded (as in Singapore or South Korea).
The biggest bounce backIn 2016, the largest funds—those with more than $5 billion—captured a bigger share of new capital (Exhibit 7). Over the past five years, larger funds have captured an increasing percentage of funds raised, to the point that, in 2016, one in every four dollars raised in private markets went to
a mega-fund of more than $5 billion, and nearly 60 percent of all fundraising went to funds larger than $1 billion. More evidence of these trends comes in the growing “ticket size” of the average LP commitment to a single fund, up 47 percent over the past five years to $50 million.5
The mega-funds’ growing prominence is due in part to LPs’ desire to consolidate their holdings with fewer GPs. The larger allocations that result are more readily absorbed by the biggest funds. Other factors might also explain the surge. Mega-funds are typically raised by larger firms with stronger marketing and investor-relations capabilities, including strong brands. Picking fund managers has always been difficult, and an LP is less likely to bear criticism for choosing a well-known name. As the CEO of a large European
Exhibit 7 Large funds have absorbed a growing proportion of funds raised.
Private equity report 2017Exhibit 7 of 19
Share of global private equity fundraising, by size of fund, %
$5 billion or more
$1 billion–$5 billion
Up to $250 million
$500 million–$1 billion
$250 million–$500 million
Source: Preqin; McKinsey analysis
0
40
20
80
60
100
2010 20162011
Vintage year
2012 2013 2014 2015

10 A routinely exceptional year McKinsey Global Private Markets Review
GP put it, “LPs want more and more of their money in safe homes—firms that have grown over time by developing high-quality, consistent processes.”
This would seem to imply a consolidation of assets in the industry, with the largest GPs absorbing more and more of LPs’ capital. Yet when considering firms, rather than funds, we see only minimal consolidation (Exhibit 8). The portion of annual fundraising that flows to the top firm has increased very slightly since 2014, from 2.2 to 2.6 percent. The portion of fundraising flow- ing to the top five and top ten firms has actually decreased since 2014, from 8.3 percent to 8.2 percent for the top five, and from 13.4 percent
to 13.1 for the top ten funds over the same period. What we are seeing, then, is consolidation of LPs’ capital to a smaller number of larger funds, but not necessarily fewer firms raising them. In other words, we are seeing growth in the number of firms capable of raising multibillion-dollar funds— an exciting development for the industry.
The biggest obstacle to further consolidation remains the industry’s strong reliance on talent. As one GP’s managing partner reminded us, “With people and culture so important in this industry, consolidation doesn’t work; you can’t just gather up a bunch of smaller players and combine them into one big one.”
Exhibit 8 There is little evidence of consolidation among firms.
Private equity report 2017Exhibit 8 of 19
Global private capital fundraising, cumulative, 2009–16
% of totalCumulative fundraising,1 $ billion
Top 20 firms
Top 10 firms
Top 5 firms
Top firm
Top 3 firms
1 Fundraising data are cumulative from 2003. Source: Preqin; McKinsey analysis
5,000
4,000
3,000
2,000
1,000
0
6,000
0
6
8
10
12
14
16
4
2
20
18
22
2009 20162012
11A routinely exceptional year McKinsey Global Private Markets Review
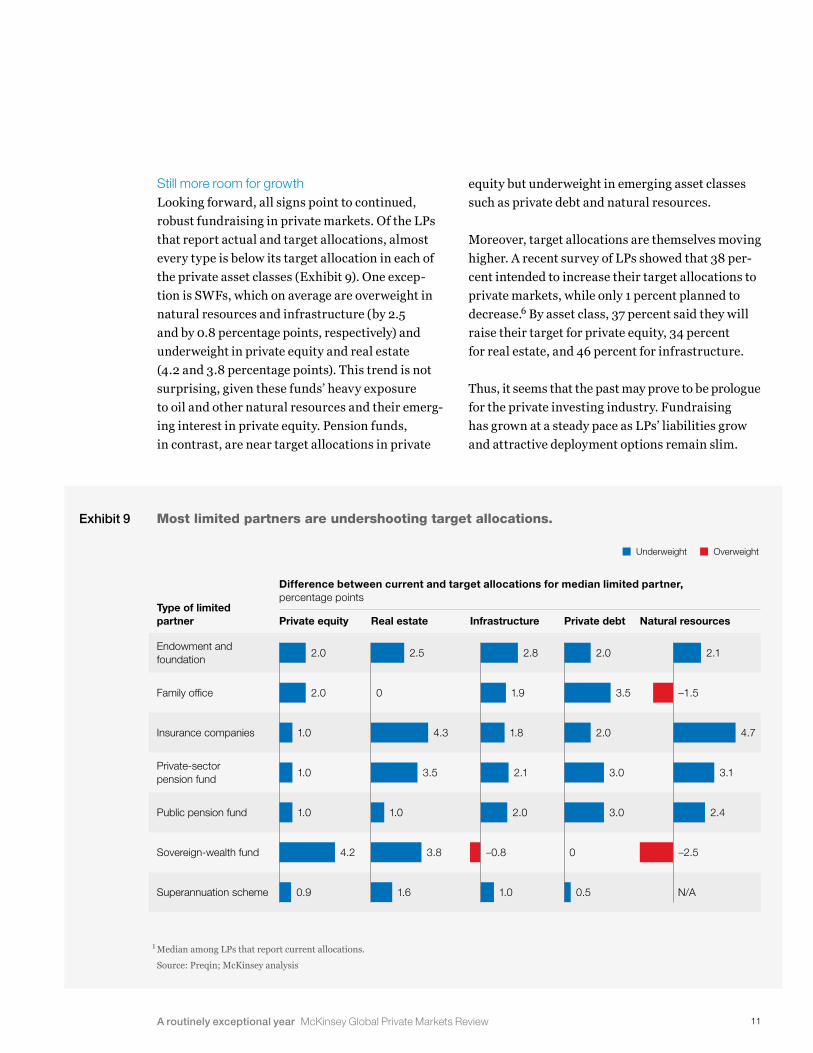
Still more room for growthLooking forward, all signs point to continued, robust fundraising in private markets. Of the LPs that report actual and target allocations, almost every type is below its target allocation in each of the private asset classes (Exhibit 9). One excep- tion is SWFs, which on average are overweight in natural resources and infrastructure (by 2.5 and by 0.8 percentage points, respectively) and underweight in private equity and real estate (4.2 and 3.8 percentage points). This trend is not surprising, given these funds’ heavy exposure to oil and other natural resources and their emerg-ing interest in private equity. Pension funds, in contrast, are near target allocations in private
equity but underweight in emerging asset classes such as private debt and natural resources.
Moreover, target allocations are themselves moving higher. A recent survey of LPs showed that 38 per- cent intended to increase their target allocations to private markets, while only 1 percent planned to decrease.6 By asset class, 37 percent said they will raise their target for private equity, 34 percent for real estate, and 46 percent for infrastructure.
Thus, it seems that the past may prove to be prologue for the private investing industry. Fundraising has grown at a steady pace as LPs’ liabilities grow and attractive deployment options remain slim.
Exhibit 9 Most limited partners are undershooting target allocations.
Private equity report 2017Exhibit 9 of 19
Difference between current and target allocations for median limited partner,percentage points
1 Median among LPs that report current allocations. Source: Preqin; McKinsey analysis
Private equityType of limited partner Real estate Infrastructure Private debt Natural resources
Endowment and foundation
2.0
Family office 2.0
Insurance companies
Private-sector pension fund
Sovereign-wealth fund
Superannuation scheme
Public pension fund
1.0
1.0
1.0
4.2
0.9
2.0
3.5
2.0
3.0
3.0
0
0.5
2.5
0
4.3
3.5
1.0
3.8
1.6
1.9
2.8
1.8
2.1
2.0
–0.8
1.0
–1.5
2.1
4.7
3.1
2.4
–2.5
N/A
Underweight Overweight

12 A routinely exceptional year McKinsey Global Private Markets Review
“Because the other options for deploying capital are looking worse and worse,” one managing partner noted, “alternative strategies will continue to get a lot of capital.” The beat of growth goes on.
GROWING PAINSMost would agree that growth is good—and that it is not always easy to manage. Growth has brought increased competition as new managers try their hand. With more firms in the game, valuations have risen, deal activity has fallen, dry powder has grown, and persistency of performance appears to have fallen. And the competition does not come
solely from other GPs; LPs, too, are finding ways to reduce the costs of deploying capital in private markets, whether through co-investment deals, separate accounts, or building their own direct capabilities.
While more competition will no doubt continue to prove a challenge for GPs, indications are that they are adapting. As mentioned, capital distributions continue to outpace capital calls. Even the growth in dry powder may not be as worrisome as it appears at first blush: private market GPs’ inventory of dry powder has
Exhibit 10 Private markets continue to attract new entrants.
Private equity report 2017Exhibit 10 of 19
Active private asset managers,1 1990–2017, number of firms
Total
Private equity
Real estate
Private debt
InfrastructureNatural resources
4.5
2.3
6.7
7.5
11.912.3
1 Firms that have raised a fund in previous 10 years. If a firm has not raised a new fund in past 10 years, it is assumed to be defunct. 2 Compound annual growth rate. Source: Preqin
3.2
3.0
2.4
2.0
6.55.3
Growth,2015–16, %
5-year CAGR,1
2010–15, %
0
2,500
5,000
7,500
20001990 2008 2016
13A routinely exceptional year McKinsey Global Private Markets Review
grown in absolute terms but has not outstripped growth in deal volumes.
More suitors, fewer targetsThe tide of capital flowing into private markets has given rise to more competition. The number of active private equity firms continues to grow (Exhibit 10). And strategic acquirers have become more active, especially in sectors where synergies are easier to collect (such as healthcare7) and those that are currently outperforming (such as consumer and technology).
With more competitors in the fray, deal multi- ples continued their recent rise, and in 2016 reached levels not seen since 2006. The median EBITDA multiple on buyout deals has risen from 8.1 times in 2015 to about 9.3 today. Multiples have likewise risen in almost every sector from 2015 to 2016: in B2C, from 8.1 to 10.3; in energy, from 6.5 to 6.8; in technology, from 13.2 to 13.4; in healthcare, from 10.1 to 12.1; and in financial services, from 8.7 to 9.3. The only sector that bucked the trend was B2B, where multiples fell from 8.8 to 6.9. Industry leaders suspect that some correction in deal multiples is on the horizon, especially as interest rates rise in the United States.
Meanwhile, attractive deal targets are harder to find. Consider the situation in the United States, where only about 25 percent of public companies in the Russell 3000 index were valued below the median buyout multiple at the end of 2016 (9.3), down from 68 percent in 2008, using the then-current median buyout multiple of 8.1 (Exhibit 11). Greater shares of investable opportunities appear in some sectors: B2C (where only about 46 percent of companies trade below the median multiple in the sector), technology (about 41 percent), healthcare (about 39 percent), and financial services (about 35 percent). In contrast, the opportunity seems quite limited in B2B (about 10 percent) and energy (about 9 percent).
High multiples and fewer investable opportunities translated to a drop in global private equity deal activity in 2016—for the first time in seven years. According to PitchBook, disclosed deal volume in private equity fell from $786 billion in 2015 to $716 billion in 2016. Global deal count fell even more sharply, from 21,800 to 17,000 (Exhibit 12).
Looking at regional deal volumes in 2016, North America was the only region that saw a meaningful increase, of 9 percent (Exhibit 13). Volumes fell in Europe by 36 percent, in Asia by 26 percent, and in the rest of world by 18 percent. The disparity is partly explained by several 2016 megadeals in the United States. In Asia, “fundamental issues with governance” held back deal making, “in addition to the difficulties of levering up businesses,” said one private equity CEO. Deal making in China has suffered from sellers’ stubbornly high price expectations, based on high public-equity market valuations, along with auction rules that lead bidders to form clubs with deep pockets.
Private equity funds in India have struggled to exit investments; of $68.8 billion deployed from 2005 to 2011, $47.7 billion remains invested. This makes firms reluctant to put more capital in play. Brazil showed some signs of life after a very challenging 2015 and ongoing political instability. For Brazilian managers (and many others), currency moves were the culprit. As one reflected, “The biggest issue of 2015 was the poor performance leading to a write-down in dollar-denominated assets, so in 2016, the key theme for us was definitely the improvement of the exchange rate.”
The slowdown in private equity was consistent across most sectors, except for healthcare and technology. Global healthcare deal volume grew 11 percent from 2015 to 2016, perhaps due to increases in sponsor-to-sponsor sales and corporate divestitures. Technology deal volume

14 A routinely exceptional year McKinsey Global Private Markets Review
Exhibit 11 The portion of the US market at investable valuations is at or near historical lows.
Private equity report 2017Exhibit 11 of 19
Russell 3000 stocks trading below median then-current buyout multiple, 2005–16, %
Below median buyout multiple
Source: PitchBook; McKinsey analysis
0
25
50
75
2005 20162011
Exhibit 12 Private equity deal activity declined in 2016.
Private equity report 2017Exhibit 12 of 19
Source: PitchBook (data accurate as of Jan 17, 2017)
2 7 13 19 31 42 61124 152 165
230
361
581
454 436 437530
609
786716
185
308
94 9973
1990
1,045
1994 1998 2002 2010 20142006 2016
Global private equity deal volume, 1990–2016, $ billion
0 0 0 0 1 1 1 24 4 4 5 6
8
1215
1821 22
17
810
3 300
1990
8
1994 1998 2002 2010 20142006 2016
Global private equity deal count, 1990–2016, thousands of deals

15A routinely exceptional year McKinsey Global Private Markets Review
grew 81 percent from 2015 to 2016, in large part fueled by megadeals. Increasing use of leverage, as more software deals are done on the back of recurring revenue streams, may also have helped increase deal volume. In Europe, deal volume fell sharply in 2016 for all sectors except healthcare, which posted a modest increase of 7 percent. Asia
was the lone bright spot for B2B: deal volume increased 27 percent in 2016. Deal volume decreased significantly in B2C globally, perhaps as a result of persistently high and increasing deal multiples.
In closed-end infrastructure funds, deal volume rose (from $361 billion in 2015 to $430 billion in 2016), as
Exhibit 13 Only North America showed a meaningful increase in private equity deal activity in 2016.
Private equity report 2017Exhibit 13 of 19
Year-on-year change in deal volume, by region and sector, 2015–16, %1
1 Includes private equity buyout, growth and expansion, and venture capital. Only includes deals with disclosed deal volume. 2 Rest-of-world deal volumes refers to global deal volume less Asia, Europe, and North America. 3 Includes commercial products, commercial services, business transportation, and other business products and services. 4 Includes apparel and accessories; consumer durables and nondurables; media; restaurants, hotels, and leisure; retail; nonfinancial
services; transportation; and other consumer products and services. 5 Includes equipment, exploration, production and refining, energy services, and utilities. 6 Includes capital markets and institutions, commercial banks, insurance, and other financial services. 7 Includes devices and supplies, healthcare services, healthcare-technology systems, pharmaceuticals, and biotechnology. 8 Includes communications and networking, hardware, semiconductors, IT services, and software. 9 Includes agriculture, chemicals and gases, nonwood construction, containers and packaging, forestry, metals, minerals and mining,
textiles, and other materials. Source: PitchBook; McKinsey analysis
Europe AsiaNorth AmericaSectors
B2B3
B2C4
Energy5
Financial services6
Materials and resources9
Total
Healthcare7
IT8
Region
Rest of world2 Global
>10%
0–10%
–10%–0
<–10%
16 A routinely exceptional year McKinsey Global Private Markets Review
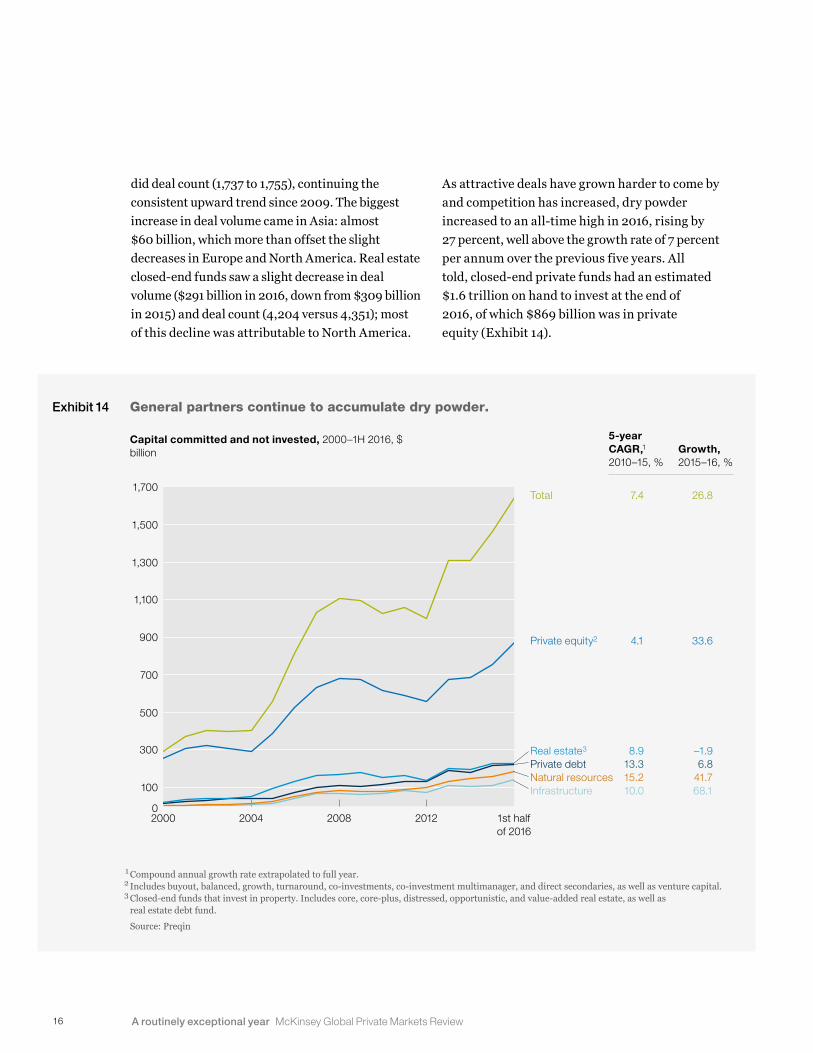
did deal count (1,737 to 1,755), continuing the consistent upward trend since 2009. The biggest increase in deal volume came in Asia: almost $60 billion, which more than offset the slight decreases in Europe and North America. Real estate closed-end funds saw a slight decrease in deal volume ($291 billion in 2016, down from $309 billion in 2015) and deal count (4,204 versus 4,351); most of this decline was attributable to North America.
As attractive deals have grown harder to come by and competition has increased, dry powder increased to an all-time high in 2016, rising by 27 percent, well above the growth rate of 7 percent per annum over the previous five years. All told, closed-end private funds had an estimated $1.6 trillion on hand to invest at the end of 2016, of which $869 billion was in private equity (Exhibit 14).
Exhibit 14 General partners continue to accumulate dry powder.
Private equity report 2017Exhibit 14 of 19
Capital committed and not invested, 2000–1H 2016, $ billion
Total
Private equity2
Real estate3
Private debt
InfrastructureNatural resources
7.4
4.1
8.913.3
10.015.2
1 Compound annual growth rate extrapolated to full year. 2 Includes buyout, balanced, growth, turnaround, co-investments, co-investment multimanager, and direct secondaries, as well as venture capital. 3 Closed-end funds that invest in property. Includes core, core-plus, distressed, opportunistic, and value-added real estate, as well as
real estate debt fund. Source: Preqin
Growth,2015–16, %
26.8
33.6
–1.96.8
68.141.7
5-year CAGR,1
2010–15, %
0
300
500
100
700
900
1,100
1,300
1,700
1,500
20042000 2008 1st half of 2016
2012

17A routinely exceptional year McKinsey Global Private Markets Review
Although dry powder has been increasing in absolute terms, it does not seem to be outstripping opportunities for deployment. Dry powder is essentially the “inventory” with which private equity firms make deals. Viewed as such, the number of “years of inventory on hand” has remained fairly constant in private equity even as dry powder has grown, because deal volume has kept pace (Exhibit 15). If we look at trailing deal volume on three-, five-, and seven-year intervals (to adjust for year-to-year fluctuations in deal volume), we see the same story.
Inconsistent resultsWith increased competition, it has become increasingly difficult for firms to achieve consistent
performance. As some academics have noted,8 persistency of private equity returns has fallen over past decades. Our own analysis shows that about 33 percent of buyout funds raised between 1995 and 2004 performed in the same quartile as their immediate predecessor—that is, the fund raised by the same manager with the same strategic and geographic mandate (Exhibit 16). This fell to only 25 percent for successor funds raised between 2005 and 2009—the same level that random chance would predict. In 2010 to 2013 (the last four years for which meaningful data are available), the persistency of funds was only 22 percent. The story is worse for top-quartile funds. From 1995 to 1999, an average of 31 percent of top-quartile funds were followed by similar successors, but
Exhibit 15 ‘Inventories’ of dry powder seem adequate to deal flow.
Private equity report 2017Exhibit 15 of 19
Years of dry powder on hand, private equity capital committed and not invested ÷ average trailing deal volume1
3-year average7-year average
5-year average
1 For example, in 3-year calculation, we used average of 3 years prior. 2 Dry powder as of June 30, 2016; deal volume reflects full-year activity. Source: Preqin; McKinsey analysis
0
1.0
2.0
3.0
2006 201622011

18 A routinely exceptional year McKinsey Global Private Markets Review
Exhibit 16 Persistency of performance is still falling.
Private equity report 2017Exhibit 16 of 19
Note: Persistency is measured with immediate successor fund (eg, Asia Buyout Partners IV would be successor to Asia Buyout Partners III). Source: Preqin; McKinsey analysis
33
1995–99
33
2000–04
22
2010–13
25
2005–09
Private equity funds in same quartile as immediate predecessor, %
Overall same-quartile persistency
3128
13 12Top-quartile persistency
Exhibit 17 Most firms have little trouble raising successor funds.
Private equity report 2017Exhibit 17 of 19
Private equity buyout funds with a successor fund,1 by quartile of performance, %
2nd quartile
Top quartile
3rd quartile
Bottom quartile
1 We identified successor funds by name (eg, Fund Partners I, Fund Partners II, Fund Partners III). Source: Preqin; McKinsey analysis
0
40
80
60
20
100
Vintage year of predecessor fund
19971995 1999 20072001 2003 2005

19A routinely exceptional year McKinsey Global Private Markets Review
by 2010–13, this average had fallen to only 12 percent.
This shift makes it quite difficult for even the most astute LPs to predict how fund managers will perform. Thus, it is perhaps not surprising that an analysis of GPs’ ability to raise subsequent funds based on prior performance shows that LPs make only limited distinction among funds in the top three quartiles (Exhibit 17). While fewer bottom- quartile funds raise successor funds than their better-performing cousins, even the worst have a long-run average fundraising persistency of approximately 50 percent (2000–07 fund vintages). This trend speaks to the continuing opacity of private market performance, as well as to LPs’ continued desire to be in private markets despite imperfect information and the challenges of accurately evaluating performance. While LPs’ challenges can help sustain low-performing GPs, their growing ability to manage costs is beginning to affect GPs’ bottom line.
More active LPsAs LPs increase their allocations to private markets—and, accordingly, their fees paid to exter-nal managers—they continue to explore ways to reduce cost. As CEM Benchmarking has shown, LPs have, on average, increased their allocation to co-investments and direct investments every year since 2012, often at the expense of allo- cations to external managers. Not every LP will approach this the same way. Strategies will vary based on LPs’ governance model, capabilities, size, and risk tolerance. LPs with more challenging governance structures, less advanced capabilities, or simply a desire to remain external and capitalize on GP performance are likely to pursue separate accounts, strategic partnerships, and potentially co-investments.
Recent academic research on co-investment has refuted previous assertions of adverse selection (the propensity of GPs to include LPs in their least attractive deals), which will further encourage

20 A routinely exceptional year McKinsey Global Private Markets Review
LPs’ pursuit of such cost-optimizing strategies.9 And, as one private equity CEO reflected, “Co-investment is a first step for LPs to get their feet in the door for eventual direct investments.” Direct investing is particularly prevalent in asset classes such as infrastructure, where the economics (lower returns, high execution risk, long duration) and fee structure (“1 and 10” on gross returns of 8 to 10 percent) lead LPs to manage them in-house.
We expect that these trends will only accelerate. In a 2016 survey of 36 leading institutional investors (all institutions that are truly transforming their ways of working), McKinsey found that over 60 percent are likely or very likely to enter into more strategic relationships with GPs in the next five years (Exhibit 18). A similar proportion of top LPs is preparing to build direct-investing capabilities. In infrastructure and real estate, for instance, more than 50 percent of leading LPs
Exhibit 18
Unlikely or very unlikely Neither likely nor unlikely Likely or very likely
Limited partners plan big changes.
Private equity report 2017Exhibit 19 of 19
38
41
How likely is your institution to do any of the following in the next 5 years?, %1
Build direct-investing capabilities
Enter into more-strategic relationships with general partners
Acquire an operating platform
Private equity
Natural resources
Infrastructure
Real estate
Private equity
Infrastructure
Real estate
Private equity
Infrastructure
Real estate
1 % of respondents to survey; figures may not sum to 100%, because of rounding. Source: McKinsey Institutional Investor Survey, August 2016, n = 36
1013 77
215 74
215 74
15 44
158 77
2313 64
1313
28
74
33
2821 51
23 18 59

21A routinely exceptional year McKinsey Global Private Markets Review
anticipate acquiring an operating platform in the next five years. GPs are getting ready for the change; one told us that GPs are now “experi-menting with slightly different models of how to work with changes in the industry such as LPs’ desire to go direct.”
It is safe to say that growth has not been an unalloyed positive for industry participants. Although funds have flowed into the industry and will likely continue to do so, delivering outsize returns is not easy in the face of increasing competition and a challenging deal environment. Investors will have to continue to adapt and evolve; many have already begun to do so. There are no magic bullets that guarantee success, but several tactics have helped industry players navigate these adversities.
PROLONGING THE RIDEThe cycle of increased capital inflows, growing competition, ever-higher multiples, and accumulating dry powder, mainly in private equity but also other private markets, will have consequences across the deal cycle that will shape GPs’ activities in 2017 and beyond. One CEO summed up the complexity this way: “Strategy, timing, and capability are being mistaken for each other.”
As the challenges grow, we see four ways for GPs to stay on top. Given the wide range of general partners’ strategies, organizations, and so on, not all of these will be meaningful to each firm. But together they outline in broad strokes a way to prolong the great ride that the 2008–16 recovery has already provided:
� Proactive and creative sourcing. As multiples rise, competition heats up, and good deals get harder to find, the GPs that pull ahead will be those that systematically develop stronger ways to source great deals. For example, think-
ing about discontinuities in micromarkets (such as how specific subsectors in financial services might change under a new regula- tory agenda) could provide more specific and actionable sourcing leads. A few firms are also looking within to tap their deep reservoirs of experience and knowledge in search of new deal ideas. Once the target is found, some firms start with a small public-equity stake and use it as a sourcing lead. In this way, they can gradually grow their ownership and keep their entrepreneurs involved in the process. Firms are also more open to pursuing a platform strategy through roll-ups. In sum, as one CEO told us, “If you had to pick one thing that everyone’s focused on, it’s differentiated sourcing. Good luck if you’re waiting on a highly differ-entiated intermediation process.”
� Conviction-based diligence. Deal partners already understand how to conduct diligence on targets using the standard tool kit of upside, downside, and base-case models that incorporate various cost-based value-creation levers. However, in assigning probabilities to scenarios, they often don’t act with conviction, particularly when considering the probability of top-line revenue volatility. In a competitive deal-making environment, having more conviction about both the upside and the downside case is critical for GPs to overcome high multiples while also derisking their portfolio. Sector specialization—or, more specifically, deal-thesis specializa- tion—has been one way for leading firms to build more conviction.
� New approaches to portfolio. Having a plan for the “day after the deal” is not new to GPs. Two-thirds of firms McKinsey surveyed in 2014 used some sort of playbook for value creation in private equity operations. Yet most of these firms do not apply these practices consistently, limiting their ability to establish high-quality

22 A routinely exceptional year McKinsey Global Private Markets Review
operations groups. Additionally, the play- book must evolve beyond the same old cost-cutting levers. As one CEO summarized, “Cost today has become table stakes. The differentiator is now growth.” Creating top-line growth is becoming more important, especially in a slow or stagnant macro environment. Leading firms take efficiency gains and reinvest them in growth areas. Also, firms that pursue growth through pricing, digitization, advanced analytics, and human capital are more likely to find an edge. As the chief talent officer for a leading GP that rigorously connects talent to value said, “Winners think bigger but also start smaller and move faster. They think about what needs to get added to the existing business, and they redeploy human capital to make those changes happen as quickly as possible.”
� Balancing the pursuit of alpha against the risk of holding. Where firms once routinely held portfolio companies for five to seven years, holding periods have since become more variable. This is likely to continue as the private asset mix increases to span not just traditional “vanilla” buyout assets but also ultra-long-term assets in areas such as infrastructure and natural resources. Winners will develop exit scenarios for different windows (for example, one year in, two years in, three to five years in) so that they can weigh their options quickly over the course of the investment or hold through the cycle—and be ready to pull the trigger at the right time to maximize returns.
Private market investors and managers are making the most of this moment in the sun. And to their credit, they seem to recognize that industry dynamics can shift quickly. That said, all GPs and LPs have opportunities to raise their game.
1 Data cited in this report were produced by McKinsey and by Cambridge Associates, Capital IQ, CEM Benchmarking, PitchBook, Preqin, and Triago.
2 Duncan Kauffman, Tim Koller, Mekala Krishnan, and Susan Lund, “Look out below: Why returns are headed lower, and what to do about it,” McKinsey on Investing, November 2016, McKinsey.com.
3 “Private equity’s all-time commitment record,” Triago Quarterly, December 2016, triago.com.
4 We assessed committed capital over a trailing seven-year period.
5 “Private equity’s all-time commitment record.”6 Coller Capital Global Private Equity Barometer Survey, Winter
2015–16 and Winter 2016–17, collercapital.com.7 See Clay Bischoff, Brian Fox, and David Quigley, “The next act
in healthcare private equity,” McKinsey on Investing, December 2016, McKinsey.com.
8 Robert S. Harris, Tim Jenkinson, Steven N. Kaplan, and Rüdiger Stueke, “Has persistence persisted in private equity? Evidence from buyout and venture capital funds,” Darden Business School working paper, number 2304808, Fama-Miller working paper, February 2014, ssrn.com.
9 See Reiner Braun, Tim Jenkinson, and Christoph Schemmerl, “Adverse selection and the performance of private equity co-investments,” November 2016, ssrn.com.

23A routinely exceptional year McKinsey Global Private Markets Review
McKinsey’s Private Equity and Principal Investors PracticeTo learn more about McKinsey & Company’s specialized expertise and capabilities related to private markets and institutional investing, or for additional information about this report, please contact:
Fredrik Dahlqvist Senior partner, Stockholm [email protected]
Aly Jeddy Senior partner, New York [email protected]
Bryce Klempner Partner, New York [email protected]
Ju-Hon Kwek Partner, New York [email protected]
Liz Lempres Senior partner, Boston [email protected]
Alex Panas Senior partner, Boston [email protected]
Vivek Pandit Senior partner, Mumbai [email protected]
Matt Portner Associate partner, Toronto [email protected]
Acknowledgments
Research and analysis Drew Clarkson-Townsend Max Kagan Nicolas Sambor Samir Saxena Tyler Yoon
Editor Mark Staples

24 A routinely exceptional year McKinsey Global Private Markets Review
Further insightsMcKinsey’s Private Equity and Principal Investors Practice publishes frequently on issues of interest to industry executives, primarily in McKinsey on Investing. All of our publications are available at McKinsey.com. To subscribe, please write to [email protected]. Recent articles and reports include:
The next act in healthcare private equity (December 2016)
Three more reasons why US education is ready
for investment (November 2016)
Look out below: Why returns are headed lower,
and what to do about it (November 2016)
How private equity adapts: A discussion with
Don Gogel (November 2016)
The private market investing revolution (November 2016)
Fine-tuning family businesses for a new era (October 2016)
How leading institutions are changing the rules
on portfolio construction (August 2016)
Inside the mind of a venture capitalist: An interview
with Steve Jurvetson (August 2016)
From big to great: The world’s leading institutional
investors forge ahead (June 2016)
Private equity in Korea: A discussion with
Scott Hahn (May 2016)


February 2017Designed by Global Editorial ServicesCopyright © McKinsey & Company


