1-31-2002 C. Pellegrini: ATF User Meeting 1 VISA A SASE-FEL Experiment or A Beam Diagnostic and Simulation Bench-mark Experiment Presented by C. Pellegrini for the BNL-LLNL-SLAC-UCLA VISA collaboration
Transcript
1-31-2002 C. Pellegrini: ATF User Meeting 1
VISA
A SASE-FEL Experimentor
A Beam Diagnostic and Simulation Bench-mark Experiment
Presented by C. Pellegrinifor the
BNL-LLNL-SLAC-UCLAVISA collaboration
1-31-2002 C. Pellegrini: ATF User Meeting 2
Outline
1. Experimental system2. Beam compression and beam measurements3. Simulations and data analysis4. Harmonics5. Conclusions
1-31-2002 C. Pellegrini: ATF User Meeting 3
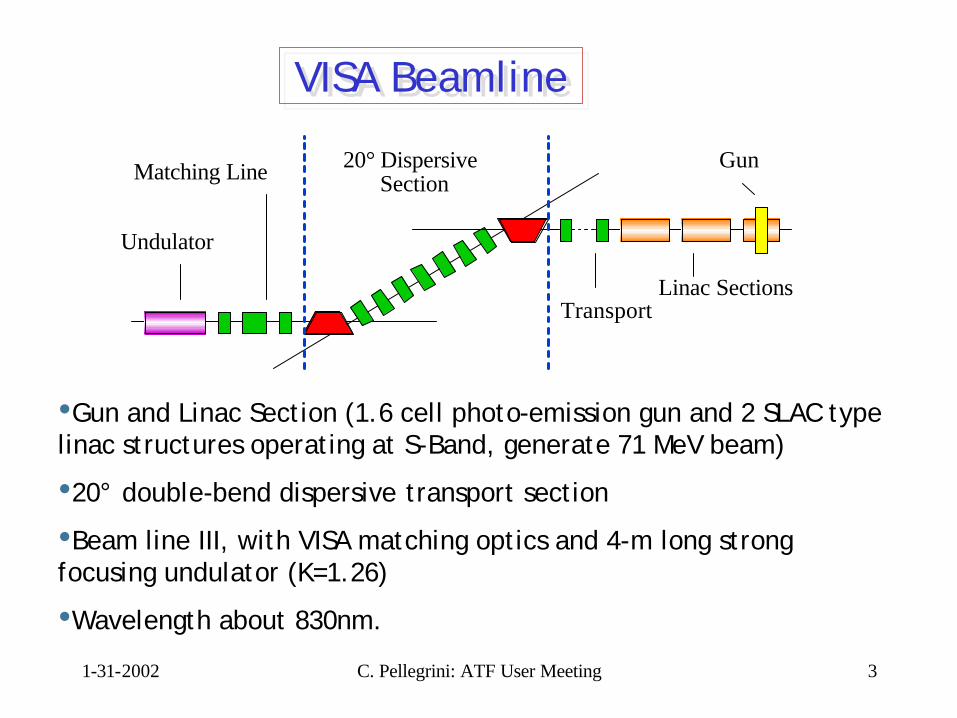
Linac Sections
Gun
Transport
20° Dispersive SectionMatching Line
Undulator
VISA BeamlineVISA Beamline
•Gun and Linac Section (1.6 cell photo-emission gun and 2 SLAC type linac structures operating at S-Band, generate 71 MeV beam)
•20° double-bend dispersive transport section
•Beam line III, with VISA matching optics and 4-m long strong focusing undulator (K=1.26)
•Wavelength about 830nm.
1-31-2002 C. Pellegrini: ATF User Meeting 4
Undulator and experimental system
1-31-2002 C. Pellegrini: ATF User Meeting 5
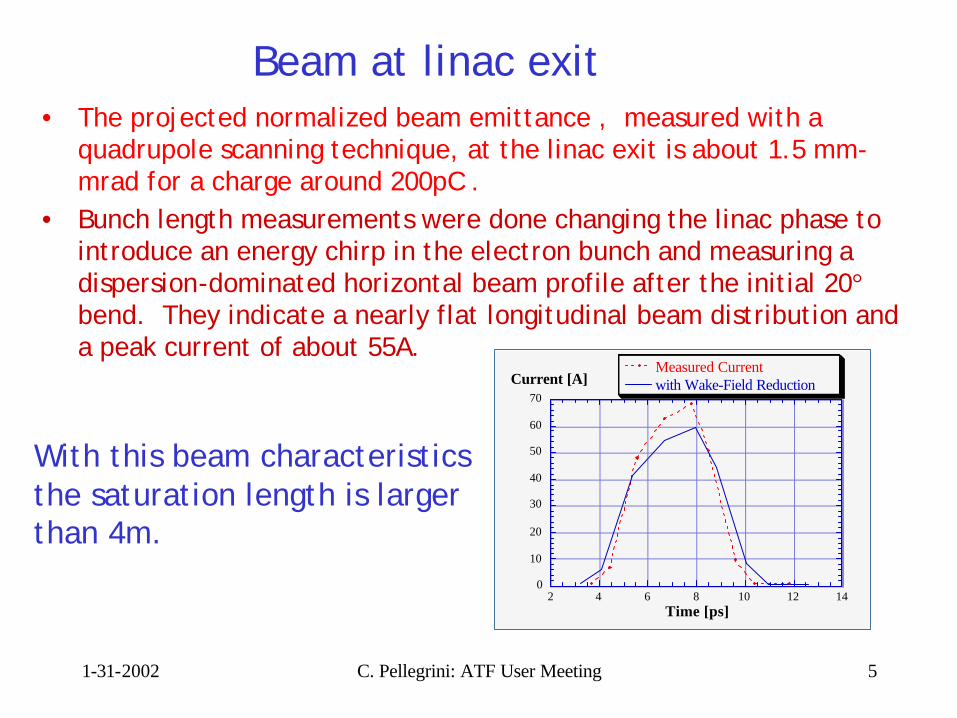
Beam at linac exit• The projected normalized beam emittance , measured with a
quadrupole scanning technique, at the linac exit is about 1.5 mm-mrad for a charge around 200pC .
• Bunch length measurements were done changing the linac phase to introduce an energy chirp in the electron bunch and measuring a dispersion-dominated horizontal beam profile after the initial 20°bend. They indicate a nearly flat longitudinal beam distribution and a peak current of about 55A.
With this beam characteristics the saturation length is larger than 4m.
1-31-2002 C. Pellegrini: ATF User Meeting 6
-300.0000
-200.0000
-100.0000
0.0000
100.0000
200.0000
300.0000
400.0000
0 5 10 15 20 25
x-beta [m]dispersion [cm]y-beta [m]
Beam functions
The “dog-leg” beam line can produce compression, increasing the peak current.
1-31-2002 C. Pellegrini: ATF User Meeting 7
Using beam compression, saturation is reached at about 3.6 m.
1-31-2002 C. Pellegrini: ATF User Meeting 8
800 820 840 860 880 900
G ~ 103
800 820 840 860 880 900
G ~ 107
Two regimes with different characteristics.Spectra and angular distributions ofFEL radiation at low and high gain.
1-31-2002 C. Pellegrini: ATF User Meeting 9
Beam compression and high gain
• The high gain is obtained by chirping and compressing the beam.
• Chirping is produced by changing the linac RF phase respect to the photo-injector.
• Compression is then obtained in the double bend.
z f = zi + R56δpp
+12
T566δpp
2T566 =
∂R56
∂ δp p( ) ≈ −7 m rad2
The compression is nonlinear. The T566 term is important.
1-31-2002 C. Pellegrini: ATF User Meeting 10
0.0
0.5
1.0
1.5
2.0
2.5
3.0
3.5
0 5 10 15 20 25
σx [mm]• The bending dipole to ATF Beamline 1, acts as a scraper with a 1.5 cm aperture.
• Charge loss at the scraper depends on the beam energy and is very sensitive to changes in the RF phase.
Measuring the charge loss at the collimator allows to1. Monitor phase drifts.2. Use the same system operating point for FEL measurements.
Beam scraping and RF phase control
1-31-2002 C. Pellegrini: ATF User Meeting 11
• The electron bunch length and the compression are measured with a single Golay cell observing the intensity of the CTR from a mirror inserted at the undulator exit. The spectral fluence of the CTR is proportional to the square of the Fourier transform of the beam longitudinal distribution, giving a signalinversely proportional to the electron beam bunch length, with a sharp cut-off at an RMS bunch length due to the diffraction and Golay cell response.
Measure of beam compression with Golay cell and CTR
1-31-2002 C. Pellegrini: ATF User Meeting 12
e-beam
Golay cell
90° polarizer
parabolicmirrors
FEL light
System allows following measurements:1. Scanning linac RF phase and observe CTR and FEL signal. Very
sensitive to phase. 2. Inserting a remote controlled low-pass filter for a quantitative
estimate of a bunch length (starting with the assumption about bunch shape).
Measure of beam compression with Golay cell and CTR
0
0.005
0.01
0.015
0.02
0.05 0.1 0.15 0.2 0.25 0.3
Linac RF phase span of 2°
Charge [nC]
Goa
ly S
igna
l [m
V]
Peaked SASE Signal
removable low-pass filter
1-31-2002 C. Pellegrini: ATF User Meeting 13
CTR data show strong compression. The CTR signal peaks sharply within a narrow (<2°) window of the linac RF phase. Inserting a low-pass filter with a known frequency roll-off allows a quantitative assessment of the high frequency CTR component. Measurements with and without filter give a signal ratio of 0.68 at the SASE operating point, providing a quantitative benchmark forthe numerical modeling of the system.
Measure of beam compression with Golay cell and CTR
The compression observed is mostly due to the large (negative) second order compression coefficient T566 in the dispersive section, which under the linac operating conditions removes the paraboliccomponent of the longitudinal phase space distribution. The effect is to compress the electron bunch by a factor near to 5, giving a peak current of about 250 A, consistent with the CTR and SASE spectral data.
1-31-2002 C. Pellegrini: ATF User Meeting 14
Beam and FEL simulationsNon-linear effects during the beam transport are important. To understand the electron beam properties in the undulator, a full cathode-to-undulator simulation of the experiment has been done:ØUCLA-PARMELA models photo-emission, acceleration and emittance compensation from the gun to the linac exit; the results match the beam properties measured after the linac. ØELEGANT models the beam dynamics and longitudinal compression in the dog-leg as a function of linac phase, including coherent synchrotron radiation (CSR); results match the Golay cell measurements of CTR;
ØNumerical simulations show that the slice emittance growth due to CSR is not significant, while the second order dispersionterm, combined with the large sliced energy spread after the linac, is important, and gives a slice emittance in the undulator of about 4 µm.
Relative Linac RF-phase [deg]Simulating CTR. The ELEGANT output fits the measurement.
Current distribution at undulator entrance. From Elegant simulations
Simulations and data
1-31-2002 C. Pellegrini: ATF User Meeting 17
Slice emittance at undulator entrance. The lasing part of the beam has
ε<slice> < 4 µm-rad.
Simulations and data
1-31-2002 C. Pellegrini: ATF User Meeting 18
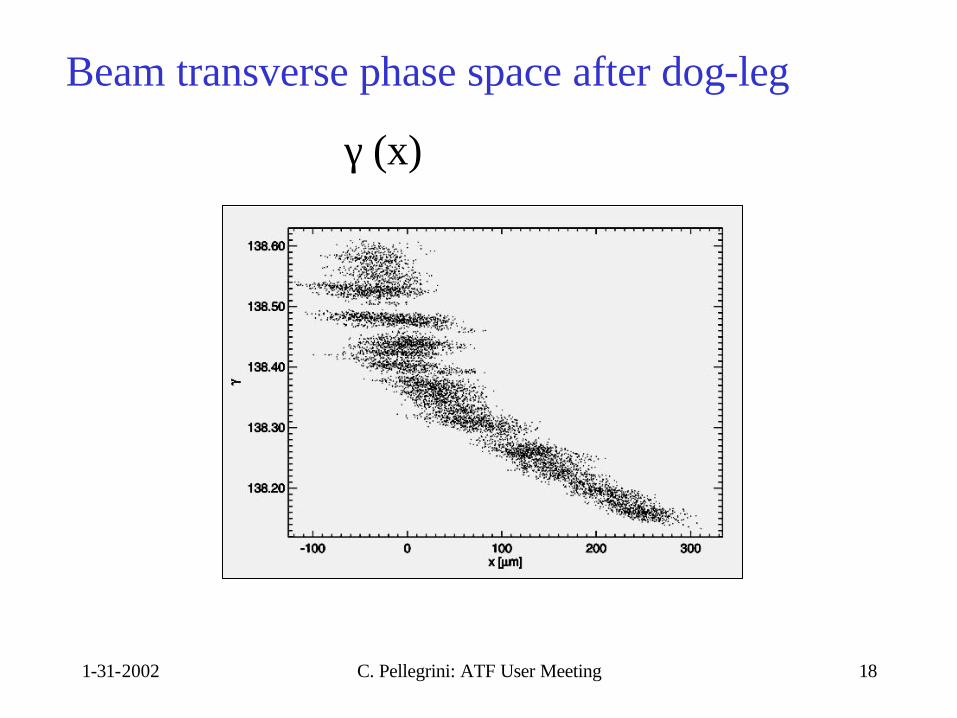
γ (x)
Beam transverse phase space after dog-leg
1-31-2002 C. Pellegrini: ATF User Meeting 19
x-distribution
Beam transverse phase space after dog-leg
1-31-2002 C. Pellegrini: ATF User Meeting 20
• Due to the strong sensitivity of the compression to small changes in the phase of the linac respect to the photo-injector, the SASE signal fluctuations are generally dominated by the system RF phase jitter.
• To enable data reduction for the FEL measurements, the collimator is used to trace the linac RF phase changes by monitoring the charge loss in the dispersive section.
FEL intensity data
1-31-2002 C. Pellegrini: ATF User Meeting 21
0.0
5.0
10.0
15.0
20.0
25.0
0.05 0.10 0.15 0.20 0.25
SASE
Ene
rgy
[µJ]
Charge [nC]
§ On the right hand side of the plot, the linac operates near nominal phase, and all the charge is transmitted through the dispersive section; however there is no compression and the gain is small.
FEL intensity data
Data window
Charge and RF phase are connected by the collimator
§ When the linac phase advances, bunch compression increases the FEL gain, while the charge loss in the collimator become significant.
§At the optimal operating point the charge loss is around 30%; the gain does not decrease because most of the scraping removes a non-lasing tail of the beam.
§ To the left of the peak the linac phase increase reduces the gain due to overcompression and charge loss at the collimator.
1-31-2002 C. Pellegrini: ATF User Meeting 22
• SASE intensity measurements along the undulator length. • The data points are the RMS value of the shots selected within the
charge window .• The lines are the Genesis results using the Parmela-Elegant output
FEL intensity data and simulations
10 -6
10 -5
10 -4
10 -3
10 -2
10 -1
10 0
10 1
10 2
0.0 0.5 1.0 1.5 2.0 2.5 3.0 3.5 4.0
simulationsmeasurements
SASE
Inte
nsity
[µJ]
z [m]
1-31-2002 C. Pellegrini: ATF User Meeting 23
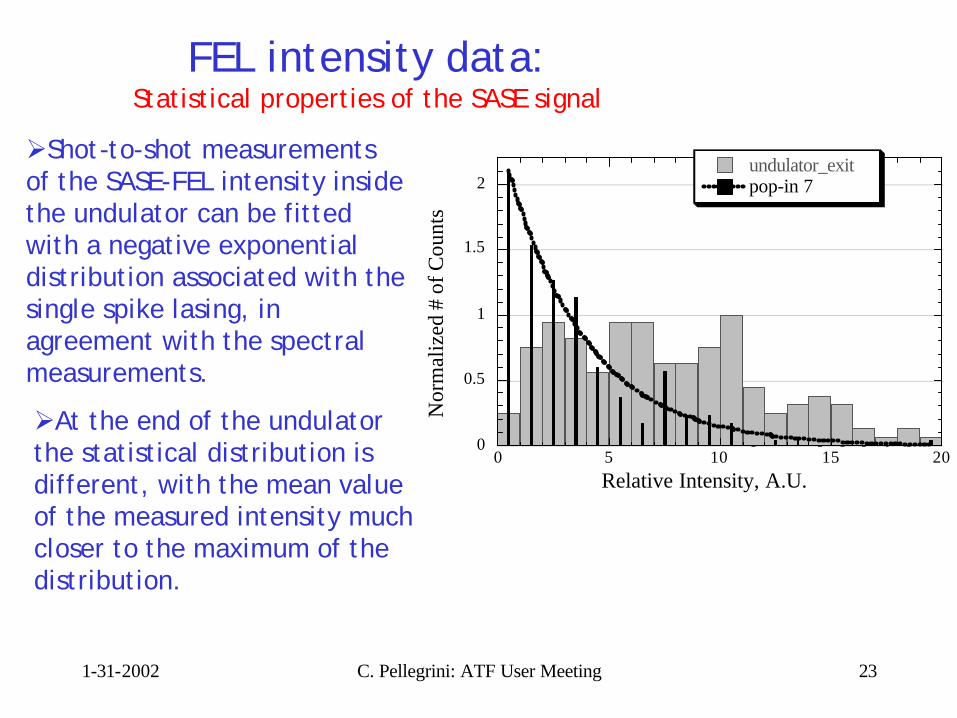
FEL intensity data: Statistical properties of the SASE signal
ØShot-to-shot measurements of the SASE-FEL intensity inside the undulator can be fitted with a negative exponential distribution associated with the single spike lasing, in agreement with the spectral measurements.
0 5 10 15 20
undulator_exitpop-in 7
0
0.5
1
1.5
2
Nor
mal
ized
# o
f Cou
nts
Relative Intensity, A.U.
ØAt the end of the undulator the statistical distribution is different, with the mean value of the measured intensity much closer to the maximum of the distribution.
1-31-2002 C. Pellegrini: ATF User Meeting 24
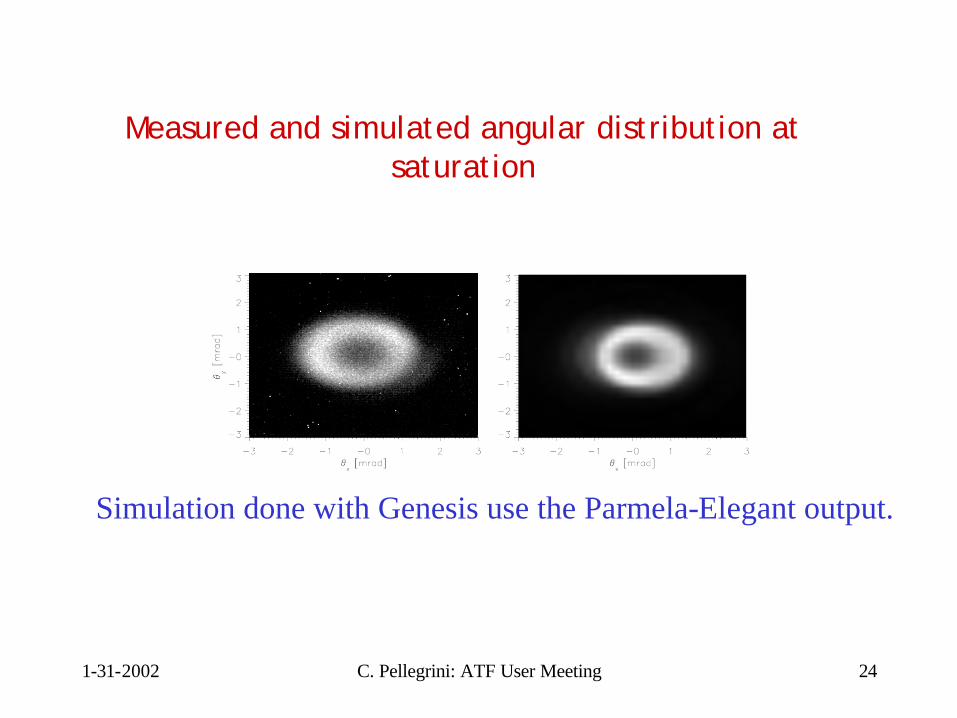
Measured and simulated angular distribution at saturation
Simulation done with Genesis use the Parmela-Elegant output.
1-31-2002 C. Pellegrini: ATF User Meeting 25
Harmonic generation
1-31-2002 C. Pellegrini: ATF User Meeting 26
Conclusions
1. VISA has reached saturation in less than 4 m using a compact, strong focusing undulator.
2. Strong harmonics have been measured, in agreement with expectations.
3. For the first time a start-to-end simulations with Parmela-Elegant-Genesis reproduces the bunch length, FEL intensity and spectral-angular measurements.
4. The separation of system and SASE intensity fluctuations has allowed for the first time to measure the statistical properties of a SASE-FEL at saturation.