A Scalable Parallel Cell-Projection Volume Rendering Algorithm for Three-Dimensional Unstructured Data Kwan-Liu Ma and Thomas W. Crockett Institute for Computer Applications in Science and Engineering" Abstract Visualizing three-dimensional unstructured data from aerodynamics calculations is challenging because the as- sociated meshes are typically large in size and irregular in both shape and resolution. The goal of this research is to develop a fast, efficient parallel volume rendering algorithm for massively parallel distributed-memory su- percomputers consisting of a large number of very pow- erful processors. We use cell-projection instead of ray- casting to provide maximum flexibility in the data dis- tribution and rendering steps. Effective static load bal- ancing is achieved with a round robin distribution of data cells among the processors. A spatial partition- ing tree is used to guide the rendering, optimize the image compositing step, and reduce memory consump tion. Communication cost is reduced by buffering mes- sages and by overlapping communication with rendering calculations as much as possible. Tests on the IBM SP2 demonstrate that these strategies provide high render- ing rates and good scalability. For a dataset containing half a million tetrahedral cells, we achieve two frames per second for a 400x400-pixel image using 128 proces- sors. Keywords: volume rendering, parallel algorithms, un- structured grids, scientific visualization, hierarchical data structures, load balancing, asynchronous commu- nication, message passing, distributed memory. 1 Introduction Three-dimensional aerodynamics calculations often use unstructured meshes to model objects with complex ge- ometry. By applying finer meshes only to regions re- 'Mail Stop 403, 6 North Dryden Street, NASA Langley Re- search Center, Hampton, Virginia 23681-0001, kmaQicase.edu, tomQicase.edu 0-8186-8265-5/97 $1 0.00 COPYRIGHT 1997 IEEE quiring high accuracy, both computing time and storage space can be reduced. This adaptive approach results in computational meshes containing data cells which are highly irregular in both size and shape. The lack of a simple indexing scheme for these complex grids makes visualization calculations on such meshes very expen- sive. Furthermore, in a distributed computing environ- ment, irregularities in cell size and shape make balanced load distribution difficult as well. The development of massively parallel rendering al- gorithms for irregular data has received comparatively little attention. Notably, Williams [23] developed a cell- projection volume rendering algorithm for finite element data running on a singlle SGI multiprocessor worksta- tion. Uselton [21] designed a volume ray-tracing algo- rithm for curvilinear gricls on a similar platform. In both cases, tests were performed with up-to eight processors and high parallel efficiency was obtained. Challinger [2] developed a parallel volume ray-tracing algorithm for nonrectilinear grids ancl implemented it on the BBN TC2000, a multiprocessor architecture with up to 128 nodes. Note that all three of these renderers used shared-memory programming paradigms. Giertsen and Petersen [8] designed a scanline vol- ume rendering algorithm for distributed-memory sys- tems based on Giertsen's previous sweep-plane ap- proach [7], and implemented it on a network of work- stations. In their approach the volume dataset is repli- cated on each workstation, and a master-slave scheme is used to dynamically baalance the load. However, tests were performed with a maximum of four workstations, so the scalability of the algorithm and its implemen- tation for massively parallel processing has yet to be demonstrated. In recent work, Silva, Michell and Kaufman [18] pre- sented a more elaborate approach for rendering general irregular grids. Evolving from Giertsen's sweep-plane algorithm, their new strategy is careful to exploit spatial coherence. The algorithm is potentially parallelizable but tests were only performed on a Sun UltraSPARC- 1. In addition, Wilhelmis et al. [22] developed a hier- archical and parallelizable volume rendering technique for irregular and multiple grids. This algorithm favors coarse-grain parallelism for a shared-memory MIMD ar- 95
Transcript
A Scalable Parallel Cell-Projection Volume Rendering Algorithm for Three-Dimensional Unstructured Data
Kwan-Liu Ma and Thomas W. Crockett Institute for Computer Applications in Science and Engineering"
Abstract
Visualizing three-dimensional unstructured data from aerodynamics calculations is challenging because the as- sociated meshes are typically large in size and irregular in both shape and resolution. The goal of this research is to develop a fast, efficient parallel volume rendering algorithm for massively parallel distributed-memory su- percomputers consisting of a large number of very pow- erful processors. We use cell-projection instead of ray- casting to provide maximum flexibility in the data dis- tribution and rendering steps. Effective static load bal- ancing is achieved with a round robin distribution of data cells among the processors. A spatial partition- ing tree is used to guide the rendering, optimize the image compositing step, and reduce memory consump tion. Communication cost is reduced by buffering mes- sages and by overlapping communication with rendering calculations as much as possible. Tests on the IBM SP2 demonstrate that these strategies provide high render- ing rates and good scalability. For a dataset containing half a million tetrahedral cells, we achieve two frames per second for a 400x400-pixel image using 128 proces- sors.
Three-dimensional aerodynamics calculations often use unstructured meshes to model objects with complex ge- ometry. By applying finer meshes only to regions re-
'Mail Stop 403, 6 North Dryden Street, NASA Langley Re- search Center, Hampton, Virginia 23681-0001, kmaQicase.edu, tomQicase.edu
0-81 86-8265-5/97 $1 0.00 COPYRIGHT 1997 IEEE
quiring high accuracy, both computing time and storage space can be reduced. This adaptive approach results in computational meshes containing data cells which are highly irregular in both size and shape. The lack of a simple indexing scheme for these complex grids makes visualization calculations on such meshes very expen- sive. Furthermore, in a distributed computing environ- ment, irregularities in cell size and shape make balanced load distribution difficult as well.
The development of massively parallel rendering al- gorithms for irregular data has received comparatively little attention. Notably, Williams [23] developed a cell- projection volume rendering algorithm for finite element data running on a singlle SGI multiprocessor worksta- tion. Uselton [21] designed a volume ray-tracing algo- rithm for curvilinear gricls on a similar platform. In both cases, tests were performed with up-to eight processors and high parallel efficiency was obtained. Challinger [2] developed a parallel volume ray-tracing algorithm for nonrectilinear grids ancl implemented it on the BBN TC2000, a multiprocessor architecture with up to 128 nodes. Note that all three of these renderers used shared-memory programming paradigms.
Giertsen and Petersen [8] designed a scanline vol- ume rendering algorithm for distributed-memory sys- tems based on Giertsen's previous sweep-plane ap- proach [7], and implemented it on a network of work- stations. In their approach the volume dataset is repli- cated on each workstation, and a master-slave scheme is used to dynamically baalance the load. However, tests were performed with a maximum of four workstations, so the scalability of the algorithm and its implemen- tation for massively parallel processing has yet to be demonstrated.
In recent work, Silva, Michell and Kaufman [18] pre- sented a more elaborate approach for rendering general irregular grids. Evolving from Giertsen's sweep-plane algorithm, their new strategy is careful to exploit spatial coherence. The algorithm is potentially parallelizable but tests were only performed on a Sun UltraSPARC- 1. In addition, Wilhelmis et al. [22] developed a hier- archical and parallelizable volume rendering technique for irregular and multiple grids. This algorithm favors coarse-grain parallelism for a shared-memory MIMD ar-
chitecture. Palmer and Taylor [16] devised a true distributed-
memory ray-casting volume renderer for unstructured grids and demonstrated it on Intel’s 512-node Touch- stone Delta system. Their algorithm incorporated an adaptive screen-space partitioning scheme designed to reduce data movement caused by changes in the view- point. Another distributed-memory unstructured-grid renderer was developed by Ma [12] for the Intel Paragon. This algorithm uses a graph-based partitioner to keep nearby cells together on the same processor, providing good locality during the ray-cast resampling process. The algorithm is somewhat tedious to use for post- processing visualization applications because it requires both a preprocessing step to derive cell-connectivity information and a pre-partitioning step whenever the number of processors changes.
Our current research is inspired by the trend to- ward larger numbers of processors in large-scale scien- tific computing platforms, as typified by the terascale architectures being installed for the U.S. Department of Energy’s ASCI program. To support applications which use these systems, we must develop visualization tools which are appropriate to the architectures. We focus on scalability and flexibility as two key design criteria. To address these issues, we propose a static load bal- ancing scheme coupled with an asynchronous c o m u - nication strategy which overlaps the rendering calcula- tions with transfer of ray segments. Our results indi- cate that this approach compares favorably with previ- ous unstructured-grid volume rendering algorithms for similar architectures.
Another problem shared by many exieting visualiza- tion algorithms for unstructured data is the need for a significant amount of preprocessing. One step extracts additional information about the mesh, such as connec- tivity, in order to speed up later visualization calcula- tions. Another step may be needed to partition the data based on the particular parallel computing configura- tion being used (number of processors, communication parameters, etc.). To reduce the user “hassle factor” as much as possible and avoid increasing the data size or replicating data, we want to eliminate these prepro- cessing steps. While this provides flexibility and conve- nience, it also means less information is available for o p timizing the rendering computations. We have elected to sacrifice a small amount of performance in favor of enhanced usability.
In the remainder of the paper, we describe the strate- gies we have developed to achieve both scalability and flexibility for volume rendering of unstructured data. We also present detailed experimental performance re- sults obtained with up to 128 nodes on an IBM SP2. We conclude with a discussion of plans for future work, in-
iuriicate xhir
processcjrs
t
Figure 1: The volume rendering pipeline. This proce- dure is replicated on each processor.
cluding opportunities for improving the algorithms pre- sented here.
2 Overview of the Algorithm
Our new parallel rendering algorithm performs a se- quence of tasks as shown in Figure 1. The volume data is distributed in round robin fashion with the intention of dispersing nearby cells as widely as possible among processors. The image space is partitioned using a sim- ple scanline interleaving scheme.
A preprocessing step then performs a parallel, syn- chronized partitioning of the volume data to produce a hierarchical representation of the data space. This spatial tree is used in the rendering step to optimize the compositing process and to reduce runtime memory consumption.
To offer maximum freedom in data distribution, a cell-projection rendering method is used. However, data cells are not pre-sorted in depth order. Instead, each processor scan converts its local cells to produce many ray segments, which are routed to their final destin& tions in image space for merging. A double-buffering scheme is used in conjunction with asynchronous send and receive operations to reduce overheads and overlap communication of ray segments with rendering compu- tations. Scan conversion of data cells and merging of ray segments proceed together in multiplexed fashion. When scan conversion and ray-segment merging are fin- ished, each processor sends its completed subimage to a host computer which assembles them for display. A detailed description of each of the steps of the algorithm is given in the following sections.
96
3 Data Distribution
Ideally, data should be distributed in such a way that ev- ery processor requires the same amount of storage space and incurs the same computational load. There are sev- eral factors which affect this. For the sake of concrete- ness, we assume meshes composed of tetrahedral cells; similar considerations apply to other types of unstruc- tured grids. First, there is some cost for scan convert- ing each cell. Variations in the number of cells assigned to each processor will produce variations in workloads. Second, cells come in different sizes and shapes. The difference in size can be as large as several orders of magnitude due to the adaptive nature of the mesh. As a result, the projected image area of a cell can vary dramatically, which produces similar variations in scan conversion costs. Furthermore, the projected area of a cell also depends on the viewing direction. Finally, voxel values are mapped to both color and opacity values. An opaque cell can terminate a ray early, thereby sav- ing further merging calculations, but introducing fur- ther variability in the workload.
If ray-cast rendering were used, we would want to as- sign groups of connected cells to each processor so that the rendering process can be optimized by exploiting cell-to-cell coherence. But connected cells are often sim- ilar in size and opacity, so that grouping them together exacerbates load imbalances, making it very difficult to obtain satisfactory partitionings. We have therefore chosen to take the opposite approach, dispersing con- nected cells as widely as possible among the processors. Thus each processor is loaded with cells taken from the whole spatial domain rather than from a small neigh- borhood as shown in Figure 2. Satisfactory scattering of the input data can generally be achieved with a simple round robin assignment policy. With sufficiently many cells, the computational requirements for each proces- sor tend to average out, producing an approximate load balance.
This approach also satisfies our requirement for flexi- bility, since the data distribution can be computed triv- ially for any number of processors, without the need for an expensive pre-processing step.
By dispersing the grid cells among processors, we also facilitate a very important visualization operation for unstructured data-zoom-in viewing. Because of the highly adaptive nature of unstructured meshes, the most important simulation results are usually associated with a relatively small portion of the overall spatial do- main. The viewer normally takes a peek at the overall domain and then immediately focuses on localized re- gions of interests, such as areas with high velocity or gra- dient values. This zooming operation introduces chal- lenges for efficient visualization in a distributed comput-
Figure 2: Local load imb(a1ances are reduced by process- ing cells from throughout the spatial domain.
ing environment. First, locating all of the cells which reside within the viewing region can be an expensive operation. Our solution, described in the next section, is to employ a spatial partitioning tree to speed up this cell searching. Second, if data cells are distributed to processors as connected components, zooming in on a local region will result in severe load imbalances, as a few processors are left with all of the rendering calcula- tions while others go idle (Figure 3).
An alternative approach is to distribute clusters of connected cells to each ]processor and hope that some data can be shared and some ray segments can be merged locally. This approach has several drawbacks. First, an appropriate heuristic must be found for de- termining the optimal cluster size. Second, the data must be preprocessed to compute cell connectivity in- formation. Finally, the (data must be partitioned in a way which preserves loca,lity and maintains a relatively balanced load across processors. The cost and inconve- nience of these additional steps can make this approach unattractive.
Although the round-robin distribution discourages data sharing, our rendering algorithm only requires min- imum data-the cell and node information. No connec- tivity data are needed. Each cell takes 16 bytes to store four node indices and each node takes 16 bytes to store three coordinates and a scalar value. As a result, in the worst case of no sharing of any node information, 80n bytes of data must be transferred in order to distribute n cells to a processor. By way of example, distributing a dataset of 1 million cells across 128 processors requires an average of 640,000 bytes of data to be transferred to and stored at each processor.
97
Figure 3: Zoomed-in viewing results in severe load im- balances when connected cells are grouped together.
In addition to the object space operations on mesh cells, we also need to evenly distribute the pixel-oriented ray-merging computations. Local variations in cell sizes within the mesh lead directly to variations in depth com- plexity in image space. Therefore we need an image partitioning strategy which disperses the ray-merging operations as well. In our current implementation, we assign successive scanlines to processors in round-robin fashion, a technique often known as scanline interleav- ing. This works reasonably well as long as the vertical resolution of the image is several times larger than the number of processors. With more processors, we conjec- ture that a finer-grained pixel interleave may be advan- tageous. At each pixel location, we maintain a linked list of ray segments, which are merged to form the final pixel value. The pixel merging process is described in more detail in subsequent sections.
4 Space Partitioning Tree
As described in the previous section, our round-robin data distribution scheme helps to achieve flexibility and produces an approximate static load balance. However, it totally destroys the spatial relationship between mesh cells, making an unstructured dataset even more irregu- lar. We would like to restore some ordering so that the rendering step may be performed more efficiently.
The central idea ia to have all processors render the cells in the same neighborhood at about the same time. Ray segments generated for a particular region will consequently arrive at their image-space destina- tions within a relatively short window of time, allowing them to be merged early. This early merging tends to limit the length of the ray-segment list maintained by
Figure 4: A global spatial partitioning assigns cells to subregions for rendering.
each processor, which benefits the rendering process in two ways: first, a shorter list reduces the cost of insert- ing a ray segment in its proper position within the list; and second, the memory needed to store unmerged ray segments is reduced.
To provide the desired ordering, data cells can be grouped into local regions using a hierarchical spatial data structure such as an octree [lo] or k-d tree [l]. We prefer the k-d tree since it supports adaptive par- titioning along orthogonal coordinate planes and allows straightforward determination of the depth ordering of the resulting regions. Figure 4 shows rendering of a region within such a partitioning, where the different colored cells are stored and scan converted by different processors.
The tree should be constructed cooperatively so that the resulting spatial partitioning is exactly the same on every processor. After the data cells are initially dis- tributed, all processors participate in a synchronized parallel partitioning process. The algorithm works as follows:
0 Each processor examines its local collection of cells and establishes a cutting position such that the two resulting sub-regions contain about the same number of cells. The direction of the cut is the same on each processor and alternates at each level of the partitioning.
0 The proposed local cutting positions are commu- nicated to a designated host node which averages them together to obtain a global cutting position. This information is then broadcast to each pro- cessor, along with the host’s choice of the next subregion to be partitioned. A cell which inter- sects the cut boundary is assigned to the region containing its centroid.
98
image plane
a ray segment
apixel I
Figure 5: Cell projection rendering.
The procedure repeats until the desired number of regions have been generated.
At the end of the partitioning process, each processor has an identical list of regions, with each region repre- senting approximately the same rendering load as the corresponding region on every other processor. If all processors render their local regions in the same order, loose synchronization will be achieved due to the simi- lar workloads, allowing early ray-merging to take place within the local neighborhoods. The k-d tree also al- lows for fast searching of cells within a spatial region specified by a zoom-in view. Note that our current im- plementation does not guarantee a well-balanced tree, but the extra searching overhead is insignificant com- pared to the time required for the rendering calcula- tions. We also observe that the spatial regions can also serve as workload units should we ever need to perform dynamic load balancing.
5 Rendering
Direct volume rendering algorithms can be classified into either ray-casting [6, 11, 12, 201 or projection meth- ods [15, 171. Projection methods may be further cat- egorized as cell-projected [22], slice-projected [24], or vertex-projected [14]. We have chosen a cell-projection method similar to [15] because it offers more flexibility in data distribution and is more accurate.
During rendering, processors follow the same path through the spatial partitioning tree, processing all of the cells at each leaf node of the tree. Each cell is scan- converted independently, and the resulting ray segments are routed to the processor which owns the correspond- ing image scanline. As adjacent ray segments are re- ceived, they are merged using the standard Porter-Duff over operator. Figure 5 illustrates the process.
Since the ray segments which contribute to a given pixel arrive in unpredictable order, each ray segment
must contain not only a sample value and pixel coordi- nates, but also starting and ending depth values which are used for sorting and merging within the pixel’s ray segment list. For the types of applications currently en- visioned, we expect from lo6 to 10’ ray segments to be generated for each image; at 16 bytes per segment, ag- gregate communication requirements are on the order of lo7 to lo9 bytes per frame. Clearly, efficient manage- ment of the communication is essential to the viability of our approach. The next section presents our solution to this problem.
6 Task Management with Asynchronous Communication
Good scalability and parallel efficiency can only be achieved if the parallelization penalty and communica- tion cost are kept low. As described above, our design reduces computational overheads due to parallelization by eliminating the need it0 pre-sort the cells and by low- ering the post-sorting cost and memory consumption.
To manage communication costs, we adopt an asyn- chronous communication strategy which was originally developed for a parallel polygon renderer [5] and later improved for use in the PGL rendering system [3,4]. In the current context, the key features of this approach include:
asynchronous operation, which allows processors to proceed independently of each other during the rendering computations;
multiplexing of the object-space cell computations with the image-space ray merging computations;
overlapped computation and communication, which hides data transfer overheads and spreads the communication load over time; and
buffering of intermediate results to amortize com- munication overheads.
During the course of rendering, there are two main tasks to be performed: scan conversion and image composit- ing. High efficiency is attained if we can keep all pro- cessors busy doing either of these two tasks. Logically, the scan conversion and merging operations represent separate threads of contiro1, operating in different com- putational spaces and using different data structures. For the sake of efficiency and portability, however, we have chosen to interleave these two operations using a polling strategy. Figure 6 illustrates at a high level the management of the two tasks and the accompanying communication. Each processor starts by scan convert- ing one or more data cells. Periodically the processor checks to see if incoming ray segments are available; if
99
Figure 6: Task management with asynchronous com- munication.
so, it switches to the merging task, sorting and merging incoming rays until no more input is pending.
Due to the large number of ray segments generated, the overhead for communicating each of them individu- ally would be prohibitive in most architectures. Instead, it is better to buffer them up l’ocally and send many ray segments together in one operation. To supplement this, we employ asynchronous send and receive operations, which allow us to overlap communication and computa- tion, reduce data copying overheads in message-passing systems, and decouple the sending and receiving tasks. We have found that this strategy is most effective when two or more ray segment buffers are provided for each destination. While a send operation is pending for a full buffer, the scan conversion process can be placing additional ray segments in its companion buffer. In the event that both buffers for a particular destination fill up before the first send completes, we can switch to the ray merging task and process incoming segments while we wait for the outbound congestion to clear (in fact, this is essential to prevent deadlock).
There are two parameters that the user may specify to control the frequency of task switching and commu- nication. The first parameter is the polling interval, i.e., the number of cells to be processed before checking for incoming ray segments. If polling is too frequent, excessive overheads will be introduced; if it isn’t often enough, the asynchronous communication scheme will perform poorly as outbound buffers clog up due to pend- ing send operations. The second parameter is the buffer depth, which indicates how many ray segments should be accumulated before an asynchronous send is posted. If the buffer size is too small, the overheads for initiating send and receive operations will be excessive, resulting in lowered efficiency. On the other hand, buffers that are too large can introduce delays for processors which have
finished their scan conversion work and are waiting for ray segments to merge. Large buffers are also less effec- tive at spreading the communication load across time, resulting in contention delays in bandwidth-limited sys- tems.
The most effective choice of buffer size depends on the number of processors in use, the number of ray segments to be communicated, and the characteristics of the tar- get architecture. As one may suspect, the polling fre- quency should be selected in accordance with the buffer size. As a general rule, polling should be performed more frequently with smaller buffer sizes or larger num- bers of processors. We present empirical results illus- trating this relationship in the next section.
The asynchronous nature of the communication algo- rithm makes it impossible for a processor to determine by itself whether rendering is complete. Care must be taken to avoid deadlock or loss of ray segments. We sug- gest a procedure similar to that described in [ 5 ] , in which a designated node coordinates the termination process by collecting local termination messages and broadcast- ing a global termination signal. A final global synchro- nization operation ends the overall rendering process.
7 Test Results
For convenience, we have used a small unstructured grid dataset containing about 0.5 million tetrahedral cells for our initial experiments. The dataset represents flow over an aircraft wing with an attached missile. All test results are based on the average time of rendering this dataset into a 400x400 pixel image for six differ- ent viewing directions. The surface mesh of the wing dataset is displayed in Figure 7, illustrating the large variations in cell size and density which often arise in unstructured grids. Plate 1 shows a volume-rendered view of the overall data domain, in which the area of the wing is relatively small. Plate 2 shows a zoomed-in view of the flow surrounding the wing. Feature lines [13] have been added to assist in relating the shocks to the structure of the wing. We plan to conduct further tests using a larger dataset with several million cells.
We implemented our volume renderer in the C lan- guage using the MPI message passing interface [19] for interprocessor communication. All tests were run on IBM SP2 systems located at NASA’s Ames and Langley Research Centers. The SP2 [9] is a distributed-memory architecture which employs a switch-based processor in- terconnect. The NASA SP2s are populated with “wide” nodes based on a 66.7 MHz POWER2 chip set and in- corporate a second-generation switch with a peak node- to-node bandwidth of about 34 MB/s.
Figure 8 plots rendering time in seconds vs. the num- ber of processors. With 128 nodes we can render our
100
Figure 7: Surface mesh structure of the aircraft wing dataset.
test dataset at two frames per second (excluding dis- play time). The annotations to the right of the data points indicate the buffer depth (in number of ray seg- ments) and polling frequency (high, medium, or low). Our experiments indicate that with large numbers of processors (32 and above), two different strategies for setting the buffer depth and polling frequency provide equivalent performance. The reasons for this are not completely clear; however our previous experience with parallel polygon renderers indicates that the polling fre- quency is not a critical parameter. Furthermore, the communication algorithm has a built-in feedback mech- anism: if sending becomes blocked due to full buffers, the processor switches to the ray merging task and be- gins receiving, regardless of the value of the polling in- terval.
A better picture of the parallel performance is ob- tained from Figure 9, which shows the speedups and parallel efficiencies obtained as the number of processors varies from 1 to 128. With 128 processors, we achieve a speedup of 90, for a parallel efficiency of 70%. Some of this degradation is due to load imbalance, as shown in Figure 10. However, the static load balancing scheme employed here compares favorably with our earlier algo- rithm [12] for the Intel Paragon, particularly for smaller numbers of processors. To obtain a better understand- ing of the remaining load imbalance and other parallel overheads, we need to examine the performance charac-
Figure 8: Rendering time.
teristics of the renderer in more detail. Plates 3 and 4 show the per-processor contribu-
tions of various execution time components. These are measured by inserting calls to a high-resolution, low- overhead assembly language event timer at strategic lo-
Figure 9: Speedup and parallel efficiency.
101
2.7%
15%
5% %
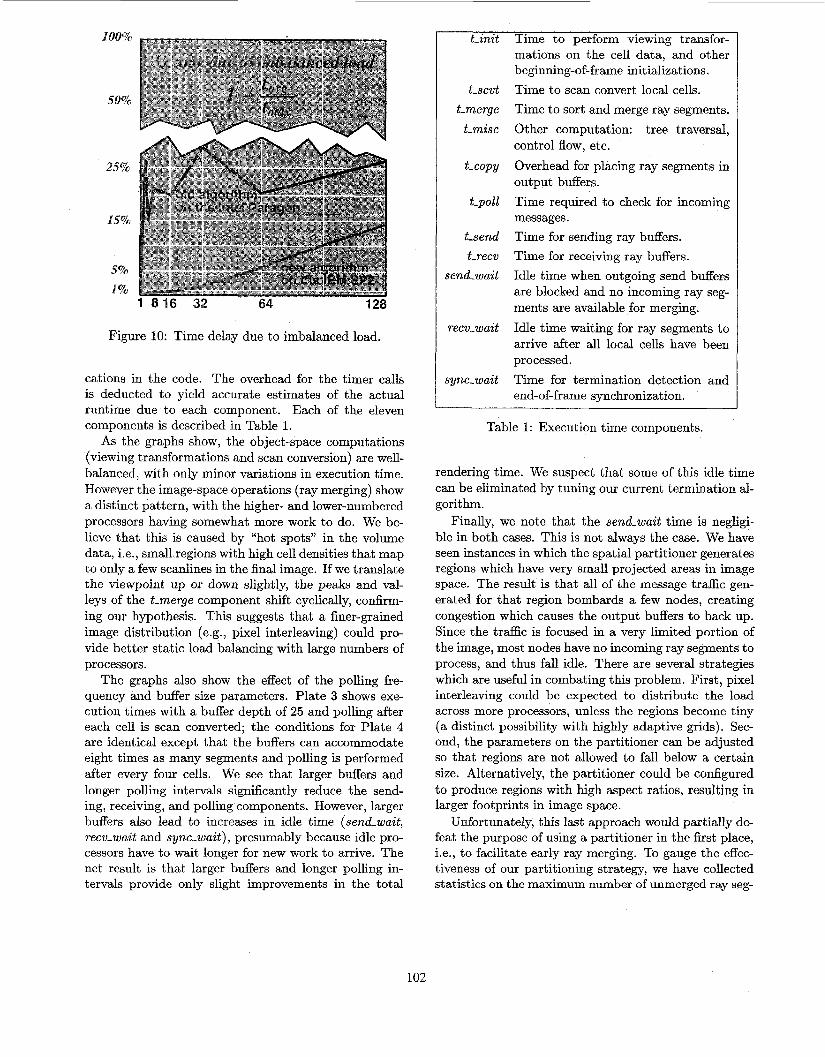
Figure 10: Time delay due to imbalanced load.
cations in the code. The overhead for the timer calls is deducted to yield accurate estimates of the actual runtime due to each component. Each of the eleven components is described in Table 1.
As the graphs show, the object-space computations (viewing transformations and scan conversion) are well- balanced, with only minor variations in execution time. However the image-space operations (ray merging) show a distinct pattern, with the higher- and lower-numbered processors having somewhat more work to do. We be- lieve that this is caused by “hot spots” in the volume data, i.e., small regions with high cell densities that map to only a few scanlines in the final image. If we translate the viewpoint up or down slightly, the peaks and val- leys of the t-merge component shift cyclically, confirm- ing our hypothesis. This suggests that a finer-grained image distribution (e.g., pixel interleaving) could p r e vide better static load balancing with large numbers of processors.
The graphs also show the effect of the polling fie- quency and buffer size parameters. Plate 3 shows exe- cution times with a buffer depth of 25 and polling after each cell is scan converted; the conditions for Plate 4 are identical except that the buffers can accommodate eight times as many segments and polling is performed after every four cells. We see that larger buffers and longer polling intervals significantly reduce the send- ing, receiving, and polling components. However, larger buffers also lead to increases in idle time (send-wait, recv-wait and sync-wait), presumably because idle pro- cessors have to wait longer for new work to arrive. The net result is that larger buffers and longer polling in- tervals provide only slight improvements in the total
t-init Time to perform viewing transfor-
t-scvt t-merge
t-mise
t-copy
t-poll
t-send t-recv
send-wait
recv-wait
sync-wait
mations on the cell data, and other beginning-of-frame initializations. Time to scan convert local cells. Time to sort and merge ray segments. Other computation: tree traversal, control flow, etc. Overhead for placing ray segments in output buffers. Time required to check for incoming messages. Time for sending ray buffers. Time for receiving ray buffers. Idle time when outgoing send buffers are blocked and no incoming ray seg- ments are available for merging. Idle time waiting for ray segments to arrive after all local cells have been processed. Time for termination detection and end-of-frame synchronization.
Table 1: Execution time components.
rendering time. We suspect that some of this idle time can be eliminated by tuning our current termination al- gorit hm .
Finally, we note that the send-wait time is negligi- ble in both cases. This is not always the case. We have seen instances in which the spatial partitioner generates regions which have very small projected areas in image space. The result is that all of the message t r f i c gen- erated for that region bombards a few nodes, creating congestion which causes the output buffers to back up. Since the traffic is focused in a very limited portion of the image, most nodes have no incoming ray segments to process, and thus fall idle. There are several strategies which are useful in combating this problem. First, pixel interleaving could be expected to distribute the load across more processors, unless the regions become tiny (a distinct possibility with highly adaptive grids). Sec- ond, the parameters on the partitioner can be adjusted so that regions are not allowed to fall below a certain size. Alternatively, the partitioner could be configured to produce regions with high aspect ratios, resulting in larger footprints in image space.
Unfortunately, this last approach would partially de- feat the purpose of using a partitioner in the first place, i.e., to facilitate early ray merging. To gauge the effec- tiveness of our partitioning strategy, we have collected statistics on the maximum number of unmerged ray seg-
102
ments which must be stored on any processor during the rendering process. Our experiments indicate that with 64 regions, the number of unmerged segments on any given processor is at most 15-20% of the total number received.
8 Conclusions
By combining a spatial partitioning scheme with tech- niques which were originally developed for parallel poly- gon rendering, we have produced a volume renderer for unstructured meshes which employs inexpensive static load balancing to achieve high performance and reason- able efficiency with modest memory consumption. We believe that our algorithm is currently the most effec- tive one available for rendering complex unstructured grids on distributed-memory message-passing architec- tures. Detailed performance experiments with up to 128 processors lead us to believe that further improvements are possible.
We plan to conduct additional tests with larger datasets, different image sizes, more processors, and other architectures. With larger datasets, the number of ray segments generated may increase significantly, and we need to assess the impact of this additional commu- nication load on overall performance. We also want to investigate the potential for finer-grained image parti- tionings and improved termination strategies to improve the parallel efficiency of our approach. The ultimate goal is a fast, scalable volume renderer which can han- dle tens of millions of grid cells using a large number of high-performance processors.
Acknowledgements
This research was supported by the National Aero- nautics and Space Administration under NASA con- tract NAS1-19480 while the authors were in residence at ICASE. All tests were performed using parallel sys- tems provided by NASA's Computational Aerosciences project under the auspices of the national High Perfor- mance Computing and Communications Program.
References
J.L. Bentley. Multidimensional Binary Search Trees Used for Associative Searching. Communica- tions of the ACM, 18(8):509-517, September 1975.
Judy Challinger. Scalable Parallel Volume Ray- casting for Nonrectilinear Computational Grids. In Proceedings of Parallel Rendering Symposium, pages 81-88, 1993. San Jose, October 25-26.
[3] T. W. Crockett. Design Considerations for Par- allel Graphics Libraries. In Proc. Intel Super- computer Users Group 1994 Ann. North Amer- ica Users Conf., pages 3-14. Intel Supercomputer Users Group, June 1994.
[4] T. W. Crockett. PGL: A Parallel Graphics Library for Distributed Memory Applications. Interim Report No. 29, ICASE, NASA Lang- ley Res. Ctr., Hampton, VA, February 1997. http://www.icase.edu/reports/interim/29/.
T. W. Crockett and T. Orloff. Parallel Poly- gon Rendering for Message-Passing Architectures. IEEE Parallel and Distributed Technology, 2(2):17- 28, Summer 1994.
Michael P. Garrity. Raytracing Irregular Volume Data. Proceedings of 1990 Workshop on Volume Visualization (San Diego, December 10-1 1, 1990). Special issue of Computer Graphics, ACM SIG- GRAPH, 24(5):35-40, November 1990.
Christopher Giertsen. Volume Visualization of Sparse Irregular Meshes. IEEE Computer Graphics t4 Applications, 12(%):40-48, March 1992.
Christopher Giertsen and Johnny Petersen. Par- allel Volume Rendering on a Network of Worksta- tions. IEEE CG&A, 13(6):16-23, November 1993.
IBM RS/6000 SP System, Large Scale Servers. http://www.rs6000.ibm. com/hardware/largescale.
C. L. Jackins and S. L. Tanimoto. Octrees and Their Use in Representing Three-Dimensional Ob- jects. Computer GTaphics and Image Processing, 14(3) :24%270, September 1980.
M. Levoy. Efficient Ray Tracing of Volume Data. ACM Transactions on Graphics, 9(3):245- 261, July 1990.
Kwan-Liu Ma. Parallel Volume Ray-Casting For Unstructured-Grid Data on Distributed-Memory Architectures. In Proceedings of the 1995 Paral- lel Rendering Symposium, pages 23-30. ACM SIG- GRAPH, October 1995.
Kwan-Liu Ma and Victoria Interrante. Extracting Feature Lines from 3D Unstructured Grids. In Pro- ceedings of Visualization '97' Conference, October 1997 (to appear).
Xiaoyang Mao. Splatting of Non-Rectilinear Vol- umes Through Stochastic Resampling. IEEE Transactions on Visualization and Computer Graphics, 2(2):156-170, June 1996.
[15] Nelson Max, Pat Hanrahan, and Roger Crawfis. Area and Volume Coherence for Efficient Visualiza- tion of 3D Scalar Functions. Computer Graphics, 24(5):27-33, November 1990.
[16] M.E. Palmer and S. Taylor. Rotation Invariant Partitioning for Concurrent Scientific Visualiza- tion. In Proceedings of the Parallel Computational Fluid Dynamics '94 Conference. Elsevier Science Publishers B.V., 1994.
[17] Peter Shirley and Allan Tuchman. A Polygon Ap- proximation to Direct Scalar Volume Rendering. Proceedings of 1990 Workshop on volume Visulaza- tion (San Diego, December 10-11, 1990). Computer Graphics, 24(5):63-70, November 1990.
[18] Claudio Silva, J . Michell, and A. Kaufman. Fast Rendering of Irregular Volume Data. In Proceed- ings of the 1996 Volume Visualization Symposium, pages 15-22. ACM SIGGRAPH, October 1996.
[19] M. Snir, S. W. Otto, S. Huss-Lederman, D. W. Walker, and J . Dongarra. MPI: The Complete Ref- erence. MIT Press, 1995.
1201 L. M. Sobierajski and A. E. Kaufman. Volume Ray Tracing. In Proceedings of the 1994 Volume Visualization Symposium, pages 11-18. ACM SIG- GRAPH, October 1994.
[21] Sam Uselton. Volume Rendering on Curvilinear Grids for CFD. AIAA Paper 94-0322, 1994. 32nd Aerospace Sciences Meeting & Exhibit.
[22] Jane Wilhelms, Allen Van Gelder, Paul Tarantino, and Jonathan Gibbs. Hierarchical and Paralleliz- able Diret Volume Rendering. In Proceedings of the Visualization '96 Conference, pages 57-64, Oc- tober 1996.
(231 Peter L. Williams. Parallel Volume Render- ing Finite Element Data. In Proceedings Com- puter Graphics International '93, 1993. Lausanne, Switzerland, June.
[24] R. Yagel, D. M. Reed, A. Law, P. Shih, andN. Sha- reef. Hardware Assisted Volume Rendering of Un- structured Grids by Incremental Slicing. In Pro- ceedings of the 1996 Volume Visualization Sym- posium, pages 55-62. ACM SIGGRAPH, October 1996.


![VOLUME RENDERING OF LARGE DATA FOR SCALABLE …The most prevalently used technique for parallel volume rendering is the use of sort-last [4] methods. The volume is statically partitioned](https://static.documents.pub/doc/80x56/5f49cb43b1bfd721822c1245/volume-rendering-of-large-data-for-scalable-the-most-prevalently-used-technique.jpg)


