5
Working Paper 2008-13 A Scalable Tile Map Service for Distributing Dynamic Choropleth Maps Charles R. Schmidt and Boris Dev
| Date post: | 28-May-2018 |
| Category: |
Documents |
| Upload: | trinhkhanh |
| View: | 223 times |
| Download: | 0 times |

Working Paper 2008-13
A Scalable Tile Map Service for Distributing Dynamic Choropleth Maps
Charles R. Schmidt and Boris Dev
A Scalable Tile Map Service for Distributing Dynamic Choropleth Maps
Charles R. Schmidt∗
GeoDa CenterSchool of Geographical Sciences
Arizona State [email protected]
Boris DevDepartment of GeographySan Diego State University
Abstract
In this paper we propose a solution to several key lim-itations of current web based mapping systems: slow ren-dering speeds and the restriction of online map viewing toa small number of areal units as well as a limited num-ber of users. Our approach is implemented as a Scal-able Tile Map Service that distributes dynamic choroplethmaps in real-time through a new caching methodology.This new Map Service lays the foundation for advances inweb based applications reliant on dynamic map renderingsuch as emergency management systems and interactive ex-ploratory spatial data analysis. We present the results ofan empirical illustration in which this new methodology isused to facilitate collaborative decision making by visualiz-ing spatial outcomes of simulation results on the fly.
1. Introduction
One of the most frequently used features of a commercialGeographic Information System (GIS) is its ability to effi-ciently generate a choropleth map that the user can interactwith to explore her data by changing the variates mapped,zooming to different geographic scales, and panning acrosslocations. Web based mapping approaches translate thisfunctionality to the distributed networks of the Internet.However, several key limitations remain, notably a lack ofspeed in map display and interaction, as well as being ableto only display maps with a small number of areal units (e.g.under 1,000), and for small numbers of users.
Overcoming these limitations is essential as the founda-tion for a variety of sophisticated time- and scale-sensitiveapplications. For example, speed is a crucial factor in the
∗This material is based upon work supported by the National ScienceFoundation under Grant No. SES-0345945, Decision Center for a DesertCity (DCDC). Any opinions, findings and conclusions or recommendationexpressed in this material are those of the author(s) and do not necessarilyreflect the views of the National Science Foundation (NSF).
delivery of Internet maps based on real-time shared geo-graphic disaster assessment data used in relief efforts. Re-searchers have identified real-time mapping applicationsand more user-friendly interfaces as limitations of existinggeospatial technologies to applications in disaster and emer-gency management [1, 3].
Addressing these limitations will help to advance wide-spread adoption of geospatial technologies as effective toolsfor disaster and emergency management. For instance,[2] highlights the importance of Community VulnerabilityMaps to all levels of disaster and hazard mitigation andmanagement. Enabling the linkage of real-time data to thesemaps could prove to be an important tool in this context.Further, integration of simulation results with maps couldenable real-time exploration of different planning or disas-ter scenarios, allowing stake holders to identify areas proneto risk. We present an empirical illustration of this notioninvolving the simulation of water demand and supply laterin this paper.
Further, the rapid success of products such as GoogleEarth and Google Maps (including its choropleth mappingcapabilities) may be an indicator of future demand for moresophisticated exploratory spatial analysis visualization toolsover the Internet. However, the limitations with existingchoropleth mapping rendering currently present an obstacleto such advances. In particular, our efforts are motivatedby the emerging field of interactive exploratory spatial dataanalysis (ESDA), including our work with the open sourcesoftware STARS (Space Time Analysis of Regional Sys-tems) [5].
A major feature of interactive ESDA software is the link-ing of statistical plots to choropleth maps. For instance,in STARS a user can travel through a time-series plot ofa spatially aggregate variable (e.g., income in U.S. states)while simultaneously observing a choropleth map of thedisaggregated variable (e.g., income in U.S. counties) as itevolves over time. Improvements in choropleth map render-ing speeds is essential for such interactive ESDA analysis:In order for users to be able to experiment with alternative
scales, variates, and plots in an interactive context, mapsneed to be rendered on the fly. This is currently not possiblewith existing applications.
One of the objectives of this research is to introducethe speed and ease of basic GIS visualization capabilitiesfor coloring objects on a map based on membership in apredefined classification from the PC to the web browser.What distinguishes our Scalable Tile Map Service from ex-isting web based mapping applications is that interestingdata structure designs and visualizations can be shared andextended dynamically in a timely manner over the Internetwith all interested parties. This is not possible with a staticJPEG map saved from a Google Earth type product. Sec-ond, we propose an open source approach to mapping devel-opment technology. Finally, we require no software otherthan a web browser to be installed on the internet client de-vice.
Our approach to improving choropleth map renderingover the Internet lays the groundwork for advances in fu-ture web based geovisualization tools and geographic datarepository projects. It is a tool that reflects the spirit of opensource and object oriented code development. After out-lining the research problems associated with current webbased mapping, this paper details our proposed solution tothese problems. We illustrate the implementation of ourScalable Tiled Map Service with an empirical example be-fore concluding with future extensions.
2. Research Problem
The performance of any new method for achieving thisgoal can be broadly understood using three parameters: 1)the speed at which the choropleth maps are drawn to abrowser after a new variable or new location has been se-lected for viewing by a user 2) the size of the number ofareal units that is capable of being drawn to the browserin a reasonable time and 3) the simplicity of the code tobe understood by new open source developers so that on-going performance is improved and new geovisualizationtools can be more quickly developed and tested to extendthe value of such Internet web data mapping projects.
Traditional web based mapping uses a client-serverbased process in which the client makes a request to theserver, the server renders the request and returns an imagewhich is displayed to the user. This process is highly in-efficient and a typical small server can only handle a fewsimultaneous clients before it becomes noticeably less re-sponsive. On the client side this process introduces verylimiting usability issues. Each time the user pans the map anew request is made and the client must wait for the serverto respond with the new image. To overcome these limi-tations current web based mapping systems pre-render themaps into tiles within a set of fixed scales. With all the
necessary information cached the servers are able to handlelarger volumes of users.
With knowledge of this tiling scheme the client can re-quest only the tiles it needs to display in response to theuser’s request. This also enables the user to pan the mapmore dynamically as only the edges of the existing displayneed to be loaded from the server. Further, this system en-ables a distributed server architecture as the client can ob-tain tiles from a number of different servers. This greatlyincreases the ability to distribute load across servers.
This method, however, imposes two primary limitations:fixed scales and static content. The tiles exist in a hierarchyof several layers, each layer represents a fixed scale at whichthe map can be viewed. To enable caching the content ofthese tiles must not change frequently, as each change re-quires the tile to be re-rendered. The tiling scheme may alsobe used without the cache, which would enable more dy-namic content. However, rendering tiles is very CPU inten-sive and building a scalable infrastructure to handle a largevolume of requests would be costly.
3. Methods
To overcome these limitations we propose a hybrid ap-proach, in which map tiles are only partially cached. Ourapproach, a Scalable Tile Map Service, enables a specificcategory of maps to be served dynamically. These are mapsin which the geometric content remains static, but the in-formational content changes, namely choropleth maps. Ourmethod for rendering choropleth maps over the web in real-time essentially represents a new caching methododology.Our approach has some features in common with the ap-proach taken by [6], with several key differences; our ap-proach doesn’t not render quantitative information into theraster, the final render is done on the server side, enablingaccess by thin-clients such as mobile phones.
In the traditional Web Mapping Service (WMS) a classi-fication is given in the initial specification of the map. Thisclassification generally specifies the number of classes, arange of values and associated color for each class and thefield containing the value. The rendered map is essentiallya raster, with a limited number of values (the number ofclasses + background + border). The rendered image issaved into a common image format such as JPEG, PNG, orGIF. The PNG (Portable Network Graphics) specificationallows the raster to be separated from the color specifica-tion. The reasoning for this is to reduce file size. A 24-bitcolor is comprised of a red, green and blue value of 8-bitseach. A type tile size is 256x256 pixels. Storing 24-bits ateach location would require 256x256x24 bits of storage.
Alternatively, an indexed PNG stores the colors in a colorpalette. Each color is given a unique index and the indexis stored in the raster. One 8-bit value can represent 256

different indexed colors, reducing the size of the raster to256x256x8 bits. One can easily rewrite to the color paletteto recolor the map. However, the rendered map remains tiedto one classification. At this point one cannot move regionA from class 1 to class 5 but one could change the color ofclass 1 from blue to green.
Expanding on this, we remove this initial classificationfrom the map specification and instead render each region’sunique ID into an integer raster. This integer raster repre-sents the geometry of our map at a particular scale. Ren-dering this geometry is a CPU intensive process. Using theaforementioned tiling schemes we can cache these integerrasters into a ”tile set.” Each tile in the tile set is identi-fied with an X coordinate, Y coordinate, and zoom level.In the case of a choropleth map this tile set will only needto change if the underlying geometry changes. The integerrasters are highly compressible and do not require any morestorage space than a fully rendered tile.
The logical next step is to reclassify these integer rastersin a meaningful way. To accomplish this we redefine ourclassification specification from ranges and associated col-ors to a mapping from region ID to class ID. A second map-ping from class ID to color is used to enable frequent re-coloring of the map. This classification system requires rel-atively little storage space. When the map is derived froman interactive process this classification only needs to bestored for a short period of time. This abstraction of themap classification from the map rendering allows any exter-nal process with knowledge of the application programminginterface (API) to submit new classifications to the server.
The parameters necessary to visualize a map areencoded in the map URL, the base level (follow-ing the host) is the tile set ID, followed by theclassification ID and color set ID. For example,”http://example.com/TileSet/MapID/ColorSet” is theURL for a map using the ”TileSet” tile site, the ”MapID”classification and the ”ColorSet” color scheme. Finally, atile ID, in the form of ”X+Y+Z.png” is appended to theend of the URL. This request is handled by a light weight”TileEngine” that implements the final render of each tilebefore it is sent to the client.
The TileEngine reads in the integer raster, classificationand color scheme, as specified in the URL. The integerraster is filtered through the region ID to the class ID map.The color scheme is saved to the palette portion of the PNG.The process does add some additional processing time whencompared to a simple tile map service, which merely returnsa fully rendered image. However, the overhead is negligiblecompared to network transfer speeds. Further, each requestis handled by a separate process and in our implementationthese processes are distributed using Google’s AppEngine.This allows the system to scale to a very large number ofrequests.
Figure 1. Dynamic Web Mapping Service
Figure 1 illustrates the layout of our implementation.The initial render of our map takes place in a traditionalbatch job cluster or on a local computer system. The par-tially rendered tiles are loaded into the cloud and stored inGoogle’s BigTable distributed storage system. In more dy-namic environments a classification request will send pa-rameters to the Map Classifier, which loads relevant quanti-tative data from the distributed storage system and saves theclassification for future use. When a name is provided withthe incoming parameters the classification will be stored in-definitely under that name. When a name is not provided themap classifier returns a temporary name which is valid for24 hours. Any client capable of displaying a Tiled WMSlayer can not request the tiles from the cloud. Our imple-mentation uses the Google Map API, which allows us tooverlay our tiles onto existing imagery and street networks.
The Map Classifier and Map Tile Engine are imple-mented as separate web services, each independent of theother. This allows classification to take on more complexforms and/or be removed from the cloud and brought to thelocal computing environment. In the empirical example thatfollows a custom classification module is designed to en-able tight integration with a simulation toolkit designed toexamine water planning in the face of climate uncertaintyand other factors.
4 Empirical Illustration
We implement our approach in a proof-of-concept casestudy in collaboration with the Decision Center for a DesertCity (DCDC) at Arizona State University. The objectiveof the case study is to dynamically integrate results fromDCDC’s water simulation model WaterSim with our Scal-able Tile Map Service. Watersim dynamically simulates
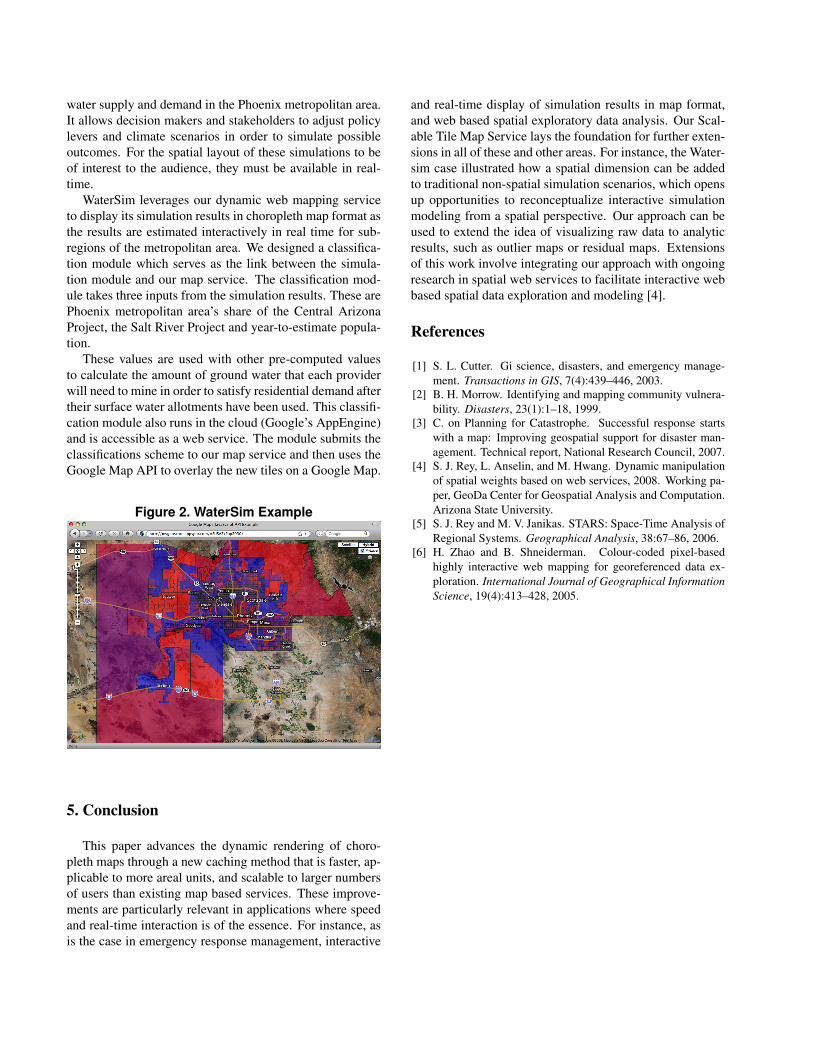
water supply and demand in the Phoenix metropolitan area.It allows decision makers and stakeholders to adjust policylevers and climate scenarios in order to simulate possibleoutcomes. For the spatial layout of these simulations to beof interest to the audience, they must be available in real-time.
WaterSim leverages our dynamic web mapping serviceto display its simulation results in choropleth map format asthe results are estimated interactively in real time for sub-regions of the metropolitan area. We designed a classifica-tion module which serves as the link between the simula-tion module and our map service. The classification mod-ule takes three inputs from the simulation results. These arePhoenix metropolitan area’s share of the Central ArizonaProject, the Salt River Project and year-to-estimate popula-tion.
These values are used with other pre-computed valuesto calculate the amount of ground water that each providerwill need to mine in order to satisfy residential demand aftertheir surface water allotments have been used. This classifi-cation module also runs in the cloud (Google’s AppEngine)and is accessible as a web service. The module submits theclassifications scheme to our map service and then uses theGoogle Map API to overlay the new tiles on a Google Map.
Figure 2. WaterSim Example
5. Conclusion
This paper advances the dynamic rendering of choro-pleth maps through a new caching method that is faster, ap-plicable to more areal units, and scalable to larger numbersof users than existing map based services. These improve-ments are particularly relevant in applications where speedand real-time interaction is of the essence. For instance, asis the case in emergency response management, interactive
and real-time display of simulation results in map format,and web based spatial exploratory data analysis. Our Scal-able Tile Map Service lays the foundation for further exten-sions in all of these and other areas. For instance, the Water-sim case illustrated how a spatial dimension can be addedto traditional non-spatial simulation scenarios, which opensup opportunities to reconceptualize interactive simulationmodeling from a spatial perspective. Our approach can beused to extend the idea of visualizing raw data to analyticresults, such as outlier maps or residual maps. Extensionsof this work involve integrating our approach with ongoingresearch in spatial web services to facilitate interactive webbased spatial data exploration and modeling [4].
References
[1] S. L. Cutter. Gi science, disasters, and emergency manage-ment. Transactions in GIS, 7(4):439–446, 2003.
[2] B. H. Morrow. Identifying and mapping community vulnera-bility. Disasters, 23(1):1–18, 1999.
[3] C. on Planning for Catastrophe. Successful response startswith a map: Improving geospatial support for disaster man-agement. Technical report, National Research Council, 2007.
[4] S. J. Rey, L. Anselin, and M. Hwang. Dynamic manipulationof spatial weights based on web services, 2008. Working pa-per, GeoDa Center for Geospatial Analysis and Computation.Arizona State University.
[5] S. J. Rey and M. V. Janikas. STARS: Space-Time Analysis ofRegional Systems. Geographical Analysis, 38:67–86, 2006.
[6] H. Zhao and B. Shneiderman. Colour-coded pixel-basedhighly interactive web mapping for georeferenced data ex-ploration. International Journal of Geographical InformationScience, 19(4):413–428, 2005.


