Volume 99, Number 2, March-April 1994 Journal of Research of the National Institute of Standards and Technology [J. Res. Nat). Inst. Stand. Technol. 99, 121 (1994)] A Sealed Water Calorimeter for Measuring Absorbed Dose Volume 99 Number 2 March-April 1994 Steve R. Domen National Institute of Standards and Technology, Gaithersburg, MD 20899-0001 The NIST sealed water calorimeter is intended for direct measurement of ab- sorbed dose to water. This calorimeter was used for a series of approximately 3700 measurements to investigate the so-called heat defect, that is, anomalous endothermic or exothermic effects caused by dissolved gases. The three systems investigated were "high-purity" water saturated with N2, H2, and mix- tures of H2/O2. The repeatability of the measurements of absorbed dose rates for the '*"Co teletherapy beam was studied with different water fillings and accumulated absorbed dose. Measure- ments with the H2/O2 system varied with accumulated absorbed dose. Based on the measurements and theoretical considerations, it appears that the H2- saturated system is the best choice for eliminating the heat defect. Measure- ments with both the N2- and H2-satu- rated systems are in good agreement with those determined with a graphite and graphite-water calorimeter (for which there is no heat defect). Key words: absorbed dose; calorimeter; convective barrier; heat defect; thermis- tor; water. Accepted: December 2, 1993 1. Introduction Absorbed dose' is widely used to quantify the medical or biological use of ionizing radiation. The output of a radiation therapy accelerator is cali- brated by determining the absorbed dose rate in water, which has been chosen as the standard ref- erence material [1] because it has absorption and scattering properties similar to tissue. Tradition- ally, absorbed dose is determined from measure- ments with an ionization chamber and using a protocol [2], which gives the procedure along with numerous correction factors for determining the absorbed dose to water. It has been shown [3-5] that the most nearly direct approach is with a water calorimeter. In principle (when the heat defect is ' Absorbed dose is the energy per unit mass imparted to matter at a point by ionizing radiation. The SI unit of absorbed dose is the gray (symbol Gy). 1 Gy=l J/kg ( = 100 rad). negligible), the absorbed dose at the measurement position is simply the product of the temperature rise and the specific heat capacity of water. Yet this direct approach was not considered possible be- cause of technical difficulties [1]. The possible success of the water calorimeter was viewed mainly as involving two investigative phases [4] as to whether: (1) an accurate small temperature rise could be measured with a suffi- ciently good signal-to-noise ratio, and (2) the heat defect could be dealt with by its elimination or a correction applied for its effect. In the present work, these effects were investigated in three sys- tems of "high-purity" water saturated with high- purity gases of (1) nitrogen, (2) hydrogen, and (3) mixtures of hydrogen and oxygen. They were inves- tigated as a function of accumulated absorbed dose 121
Transcript
Volume 99, Number 2, March-April 1994
Journal of Research of the National Institute of Standards and Technology
A Sealed Water Calorimeter for Measuring Absorbed Dose
Volume 99 Number 2 March-April 1994
Steve R. Domen
National Institute of Standards and Technology, Gaithersburg, MD 20899-0001
The NIST sealed water calorimeter is intended for direct measurement of ab- sorbed dose to water. This calorimeter was used for a series of approximately 3700 measurements to investigate the so-called heat defect, that is, anomalous endothermic or exothermic effects caused by dissolved gases. The three systems investigated were "high-purity" water saturated with N2, H2, and mix- tures of H2/O2. The repeatability of the measurements of absorbed dose rates for the '*"Co teletherapy beam was studied with different water fillings and accumulated absorbed dose. Measure- ments with the H2/O2 system varied
with accumulated absorbed dose. Based on the measurements and theoretical considerations, it appears that the H2- saturated system is the best choice for eliminating the heat defect. Measure- ments with both the N2- and H2-satu- rated systems are in good agreement with those determined with a graphite and graphite-water calorimeter (for which there is no heat defect).
Absorbed dose' is widely used to quantify the medical or biological use of ionizing radiation. The output of a radiation therapy accelerator is cali- brated by determining the absorbed dose rate in water, which has been chosen as the standard ref- erence material [1] because it has absorption and scattering properties similar to tissue. Tradition- ally, absorbed dose is determined from measure- ments with an ionization chamber and using a protocol [2], which gives the procedure along with numerous correction factors for determining the absorbed dose to water. It has been shown [3-5] that the most nearly direct approach is with a water calorimeter. In principle (when the heat defect is
' Absorbed dose is the energy per unit mass imparted to matter at a point by ionizing radiation. The SI unit of absorbed dose is the gray (symbol Gy). 1 Gy=l J/kg ( = 100 rad).
negligible), the absorbed dose at the measurement position is simply the product of the temperature rise and the specific heat capacity of water. Yet this direct approach was not considered possible be- cause of technical difficulties [1].
The possible success of the water calorimeter was viewed mainly as involving two investigative phases [4] as to whether: (1) an accurate small temperature rise could be measured with a suffi- ciently good signal-to-noise ratio, and (2) the heat defect could be dealt with by its elimination or a correction applied for its effect. In the present work, these effects were investigated in three sys- tems of "high-purity" water saturated with high- purity gases of (1) nitrogen, (2) hydrogen, and (3) mixtures of hydrogen and oxygen. They were inves- tigated as a function of accumulated absorbed dose
121
Volume 99, Number 2, March-April 1994
Journal of Research of the National Institute of Standards and Technology
over long periods of time and with different water fillings.
The temperature rise was measured with two calibrated thermistors in opposite arms of a Wheatstone bridge to double the output signal. For negligible heat defects and changes in thermistor power, the absorbed dose D is:
D = (1/2) iAR/R)\S-Hc, (1)
where D is the absorbed dose, 1/2 is the result of using two thermistors to mea-
sure a temperature rise, AR/R is the measured fractional change in the
Wheatstone bridge balancing resistor, 15 ~'l is the absolute value of the reciprocal of the
mean sensitivity of the thermistors determined from the calibration data, and
c is the specific heat capacity of water at the calorimeter operating temperature.
The product 1/2 (AR/R) IS'H is the temperature rise.
2. The Calorimeter 2.1 Design
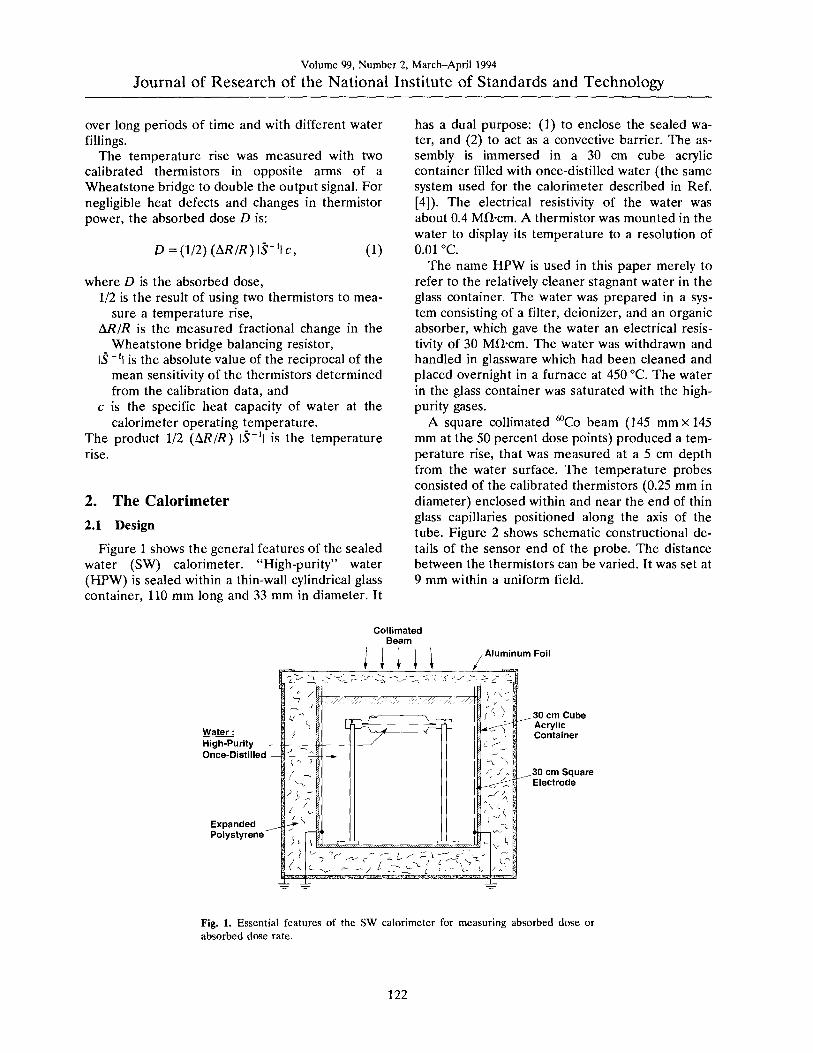
Figure 1 shows the general features of the sealed water (SW) calorimeter. "High-purity" water (HPW) is sealed within a thin-wall cylindrical glass container, 110 mm long and 33 mm in diameter. It
has a dual purpose: (1) to enclose the sealed wa- ter, and (2) to act as a convective barrier. The as- sembly is immersed in a 30 cm cube acrylic container filled with once-distilled water (the same system used for the calorimeter described in Ref. [4]). The electrical resistivity of the water was about 0.4 Mfl-cm. A thermistor was mounted in the water to display its temperature to a resolution of 0.01 °C.
The name HPW is used in this paper merely to refer to the relatively cleaner stagnant water in the glass container. The water was prepared in a sys- tem consisting of a filter, deionizer, and an organic absorber, which gave the water an electrical resis- tivity of 30 MH-cm. The water was withdrawn and handled in glassware which had been cleaned and placed overnight in a furnace at 450 °C. The water in the glass container was saturated with the high- purity gases.
A square collimated '^Co beam (145 mm x 145 mm at the 50 percent dose points) produced a tem- perature rise, that was measured at a 5 cm depth from the water surface. The temperature probes consisted of the calibrated thermistors (0.25 mm in diameter) enclosed within and near the end of thin glass capillaries positioned along the axis of the tube. Figure 2 shows schematic constructional de- tails of the sensor end of the probe. The distance between the thermistors can be varied. It was set at 9 mm within a uniform field.
Water: High-Purity Once-Distilled
Expanded Polystyrene
Aluminum Foil
30 cm Cube Acrylic Container
30 cm Square Electrode
Fig. 1. Essential features of the SW calorimeter for measuring absorbed dose or absorbed dose rate.
122
Volume 99, Number 2, March-April 1994
Journal of Research of the National Institute of Standards and Technology
Fig. 2. Schematic diagram showing the essential constructional details of the temperature probe consisting of an embedded thermistor near the end of a long thin capillary. The dimensions are in millimeters.
Figure 3 is a photograph showing some construc- tional details of the mounted detector assembly. The entire length of the glass structure is 175 mm. The outside diameter around the mid-plane is 33 mm, and the wall thickness varies from about 0.25
mm to 0.33 mm. The volume of the enclosed water is 90 cm^. Shown at the upper left within the tube (and indicated in Fig. 1) is a bubble of the saturat- ing gas. Its purpose is to expand or contract, to prevent the tube from fracturing when the assem- bly is subject to large room temperature variations. The bubble is entrapped at that position by the cir- cumferential depression in the tube, which pre- vents the bubble from migrating to the beam axis directly in front of the sensing thermistors. Shown at the lower right of the tube in Fig. 3 (and indi- cated in Fig. 1) is a platinum lead. It was in contact with the HPW and the once-distilled water, which was electrically grounded. The platinum lead was included as a precaution against possible charge buildup within the HPW, which could cause large disturbances in the small temperature signals that were to be measured. The large diameter portions (7 mm) of the temperature probes passed through snugly fitting holes in bushings of low density
Fig. 3. Photograph showing some details of the mounted thin-wall glass tube enclosing the HPW and temperature probes connected to external waterproof leads.
123
Volume 99, Number 2, March-April 1994
Journal of Research of the National Institute of Standards and Technology
[(0.91-0.93) g/cm^] polyethylene, which is relatively elastic. High density [(0.94-0.97) g/cm^] poly- ethylene should not be used, because it is relatively rigid and stiff. The low density polyethylene, ac- cording to preliminary helium-leak tests, helped to make vacuum-tight seals between the polyethylene and glass when the bushings were screwed into po- sition against glass apertures (shown below). This sealed the water from exposure to the atmosphere containing oxygen, which would otherwise be re- absorbed in the water to cause a heat defect. The total area of polyethylene in contact with the water was about 5 mm^. Small holes were drilled through the electrical sockets so that the air within the cap- illaries would vary with atmospheric pressure. If troublesome moisture condensed within the probes, it could be evacuated through the holes by placing the probes in a vacuum chamber.
2.2 Measurement and Drift Balancing Circuit
The upper part of Fig. 4 is a Wheatstone bridge circuit containing thermistors 1 and 2 in the tem- perature probes. It is used for calibrating the ther- mistors and measuring the irradiation temperature response. The resistor R' is preset so that K'=n (the resistance of thermistor 2), when V2 = VR'.
When the bridge is balanced, the resistances of the four arms are approximately equal. These condi- tions will give near minimal corrections for changes in thermistor power during irradiation [4]. The re- sistor R] is preset to give a desired average electri- cal power dissipation in the thermistors. Irradiation causes the bridge to be unbalanced, but is restored near the balance position by adjusting the bridge balancing resistor, R. A computer program ana- lyzed the runs and calculated slight variable correc- tions (< 0.03 percent for powers up to 30 |JLW) for effects of slight changes in thermistor powers dur- ing a run. This correction is included in the value A/?//? [in Eq. (1)], the fractional change in the bridge balancing arm.
The lower part of Fig. 4 is a resistance-capaci- tance (RC) circuit. Its function was described pre- viously in detail [5-7]. Briefly, its purpose is to balance out small initial drifts in signal across PP' caused by temperature gradients in the vicinity of the thermistors. This is done by moving R2 in such a direction as to produce a change in drift signal across PP' from the RC circuit, which is opposite to that caused by the internal temperature gradi- ents. When used for the measurements described in this paper, R3 was set on 0.5 GO to give a 33 min time constant, large in comparison to the radiation
Fig. 4. Wheatstone bridge circuit for detecting temperature changes and a resistance-capacitance circuit (temperature drift balancer) to counteract drifts in signal across PP' as a result of temperature gradients in the vicinity of the thermistors.
time. Irradiation times were varied and were nomi- nally 1 min and 1.5 min.
2.3 Thermistor Calibration
The thermistor resistance value (r) at a given ab- solute temperature {T) is given by the well-known empirical expression:
124
Volume 99, Number 2, March-April 1994
Journal of Research of the National Institute of Standards and Technology
r=roe' miT-vTo) (2)
where ro is the resistance at temperature To. /3 is the "material constant," which has the dimension of temperature (K).
The sensitivity of a thermistor (5) is defined as (l/r)(dr/dr), which gives
S=\-p/T\ (3)
Equation (2) can be reduced to Hnear form:
y=^ + 9, (4)
where y = lnr,x = l/T, and 0 = In ro - p/To, a con- stant. Least-squares fits of the data are applied to Eq. (4).
Calibration of a thermistor is the determination of 5, which is its fractional change in resistance per degree change in temperature. The temperature was measured with a calibrated mercury ther- mometer (0.01 °C per division) and a quartz ther- mometer. The thermistors used had a resistance of about 3.3 kn at 22 °C with a negative coefficient of resistance of about 3.7%/K. The temperature probes were removed from the glass container and placed in the once-distilled water (Fig. 1) so that they would rapidly change with the water tempera- ture which was varied at intervals of 1 °C from 15 °C to 29 °C. The temperature of the water was raised with four immersion heaters (total 100 W), and the water was circulated to attain uniform tem- perature. Then the water was allowed to become stagnant before measuring the thermistor resis- tances. Their resistances as a function of tempera- ture are shown in Fig. 5. The bridge was balanced at each temperature. The thermistor resistances (n and ri) plus the external lead resistances, which were about 0.6 percent of n or r2, could be deter- mined from the known resistances (i? and i?') and the four measured potentials across the bridge arms as indicated in Fig. 4. The thermistors, how- ever, were calibrated one at a time (for the sake of safety in handling), which required replacing a thermistor with a known resistance. This then gave two methods of determining a thermistor resis- tance, from (1) two measured potentials and a known resistance, and (2) three known resistances.
The effects of the external lead resistances de- crease the sensitivity of the Wheatstone bridge arms containing the thermistors. This decreases the observed calorimetric signal. These are nullifying effects that lead to negligible measurement errors.
a
o B
DC
o
CD
20 25
Temperature, °C 30
Fig. 5. Calibration data of thermistor resistances as a function of temperature.
The latter effect appears in the numerator of Eq. (1), and the former appears in the denominator. Therefore, small lead resistances can effectively be considered as an integral part of r, if no correction is applied to the observed signal. Otherwise, essen- tially the same correction factor must be applied to determine the true thermistor sensitivity and the calorimetric signal.
Figure 6 shows interesting calibration results measured eight times over a period of 184 weeks. They were first measured soon after their construc- tion. The second calibration was done 62 weeks later (in preparation for irradiation measurements described below). Although they received no irra- diation during this period, the /3 and r values had average increases of 0.45 percent and 3.5 percent, respectively. During the first phase of the experi- ment (5.6 kGy accumulated absorbed dose in N2- saturated water), they increased again by 0.03 percent and 0.34 percent, respectively. With no fur- ther increase in absorbed dose and 53 weeks later, the increases were 0.22 percent and 0.21 percent, respectively. Over the next 55 week period [(5.6- 17.8) kGy accumulated absorbed dose in H2- and H2/02-saturated water] the increases were 0.20 per- cent and 0.14 percent, respectively.
125
Volume 99, Number 2, March-April 1994
Journal of Research of the National Institute of Standards and Technology
Accumulated Absorbed Dose, kGy
13.0 5.6 8.09.2 I 17.i
3210 -
3200
3190
3180
50 100
Time, Weeks 150
3240
3230 01
O
3220 S
3210
Fig. 6. Thermistor "constants," p, as a function of accumulated absorbed dose and time.
The changes appear not to have been caused by irradiation. This is consistent with other reported results of accumulated absorbed dose up to 620 kGy [8]. In another investigation [9] an accumu-
lated absorbed dose of 4.3 MGy at a rate of 25 kOy/min from 3 MeV electrons produced a resis- tance change of only about 0.01 percent. A possible cause may have been a gradual release of strains within the thermistors as a result of their manufac- ture or handling their delicate leads during the fab- rication of the temperature probes.
The above points out the precautions that must be taken to assure that the /3 values remain essen- tially constant during an extended experimental pe- riod. If they change significantly, it must be detected immediately and recalibrated. The method used was the observation that a change in P was accompanied by a change in r. The resis- tances were routinely measured before and after a daily set of measurements from the known poten- tial and resistance values of the Wheatstone bridge arms as described above. The /3-value changes be- tween the dates of calibration were assumed to be linear for determining slight corrections to the date of absorbed dose measurements.
Table 1 lists a set of measured /3 values deter- mined from different temperature ranges, which
Journal of Research of the National Institute of Standards and Technology
vary from three to six degrees above and below mid-temperature ranges from 21 °C to 25 °C. The average values are listed at each set of mid-range temperature and the experimental standard devia- tions of the mean, which average about 0.01 per- cent. The average values are plotted in Fig. 7. From all sets of measurements, the average in- crease in the /3 values was 0.11%/°C increase in mid-temperature calibration. The temperature of the thermistors was known during the measure- ments of absorbed dose (near 22 °C or 23 °C). Small corrections were made to the (3 values be- cause the temperatures differed from those nomi- nal values.
3220 -
c CO
-I—' (0 c o O
i 3210
3250
CO.
« 03 C o p
3240 o OJ
21 22 23 24 25
Midrange Temperature, °C
Fig. 7. Thermistor "constants," /3, as a function of mid-range temperature calibration.
3. Heat Flow Calculations
Ideally, the temperature rise at a point in water would be made with a massless sensor. But this is not realizable in practice. Thermistors are made of metallic oxides, which are covered with glass beads in the manufacturing process. The thermistor and its bare leads are then embedded in a thin glass capillary' to electrically insulate it from the grounded water. Temperature rises, therefore, are measured primarily in glass.
The immediate rate of temperature rise of the irradiated glass, over a wide range of photon and electron energies, is about four times that of the
surrounding water. Reference [10] gives useful in- formation on the temperature rises of various ma- terials in the form of a foil, wire, or small sphere, such as a thermistor.
Irradiation causes excess heat to be generated in the temperature probe. The amount of this heat is proportional to the mass of glass, which therefore must be made as small as possible. If measure- ments are to be accurate, the excess heat must be rapidly conducted away during irradiation and re- duced to negligible amounts within a few seconds after irradiation. This is the start of the calorimet- ric afterdrift, which is used in the analysis for de- termining the temperature rise. Some excess heat will remain during this period. Heat-flow calcula- tions must be made to determine if the non-water materials can be made small enough, so that the effects of the remaining excess heat do not signifi- cantly affect the accuracy of measurements.
With reference to Fig. 1, there are three sources of excess heat if the assumption is made that the HPW within the glass container has a zero heat defect with a relative absorbed dose rate of 1. These are convenient assumptions for the sake of carrying out the calculations described below. The sources of excess heat are the (1) once-distilled wa- ter, (2) thin glass wall, and (3) glass capillaries. Calculations were performed by use of the well- known Schmidt numerical method described in many publications as, for example, in Ref. [5]. The water was imagined to consist of concentric cylin- drical shells (0.25 mm thick) with a common axis along the axis of the temperature probes.
3.1 Effect of Once-Distilled Water
The once-distilled water was found to have an exothermic effect of 3.5 percent [4]. Therefore, the relative absorbed dose rate in this water is 1.035. This will cause excess heat to be conducted cylin- drically toward the thermistors. Figure 8 shows the excess temperature rise (in percent) of the thermis- tors as a function of time after a 60 s irradiation run. The effect is greatly reduced when the tube diameter is increased from 25 mm to 30 mm.
3.2 Effects of Glass Wall
The glass wall is an effective barrier against con- vection, which can occur relatively easily in the large external volume of water at room tempera- ture [11,12]. Its diameter (d) must not be too small, because significant excess heat from it may arrive at the thermistors before the irradiation run is
127
Volume 99, Number 2, March-April 1994
Journal of Research of the National Institute of Standards and Technology
0.20
0.15
0.10 -
0.05
1 \ 1 1
Tube Dia. /
1
(mm) /
25/
^ ^ 30^^^^
i ' 1 1 1 10 20 30 40
Time After Irradiation, s
60
Fig. 8. Excess thermistor temperature rise caused by heat con- duction from once-distilled water outside a tube (25 mm and 30 mm in diameter) as a function of time after a 60 s irradiation run.
completed. It must not be too large, because condi- tions will eventually occur when the onset of con- vection will take place (when the Rayleigh number ^1000) [4,13,14]. Results from the previous and following numerical calculations were valuable in deciding on an appropriate diameter.
A uniform glass wall thickness of 0.25 mm was assumed for the calculations. A further simplifica- tion was made to facilitate the calculations. Con- sidering the mass energy-absorption coefficients of glass and water, their densities, and specific heat capacities, it can be shown that the glass can be imagined as being replaced with water where the relative absorbed dose rate is about 2.4 for the case of '^Co irradiation. Excess heat will be conducted cylindrically away and toward the thermistors. Fig- ure 9 gives the excess temperature rise (in percent) of the thermistors as a function of time after a 30 s, 45 s, and 60 s irradiation run. The results show that the tube diameter should be 30 mm or somewhat greater. The constructed tube shown in Fig. 3 has an outside diameter of 33 mm in the region of the thermistors. It appears that the diameter should not be larger than 35 mm. At that diameter the calculated excess temperature rise is 0.09 percent, at 60 s after a 60 s irradiation run. In practice, ex- trapolation of the final drift to the mid-run will tend to correct for the variable increase of the small amount of excess heat sensed by the thermistors; or
0.8
0.6
0.4
0.2
-
1 1 1 1 1
- Irradiation / /~ Time (s) / /
60/ / /
- Tube Dia.
(mm) /
/ 45/ /
- 25 30 / / 30/ 7
/ / /
- / / / / -^ /- / 60/^ /
- ^__..—-""'^ -r— "" 1 1 OF-—^
10 20 30 40
Time After Irradiation, s
50 60
Fig. 9. Excess thermistor temperature rise caused by heat con- duction from a 0.25 mm thick glass wall tube (25 mm and 30 mm in diameter) as a function of time after irradiation.
the calculated curves shown in Figs. 8 and 9 could be included in a computer program and subtracted from a measured post-irradiation drift.
3.3 Maximum Effect of Temperature Probe
The basic detailed construction of the tempera- ture probe is illustrated in Fig. 2. The thermistor is located near the end of the probe and embedded in epoxy. The excess heat is conducted cylindrically and spherically away from the region near the end of the probe; and while this is happening, heat is conducted axially along the capillary toward the end of the probe. The combined effect of this ge- ometry and of the densities and thermal conductiv- ities of the glass and epoxy is a complex situation that is under detailed study at the time of this writ- ing. However, a maximum effect (greater by a fac- tor of about 7) was determined by calculating the excess temperature rise at the center of a long solid glass rod 0.5 mm in diameter. There is then only cylindrical flow of heat. This is easily solved by the numerical method mentioned above. The results are shown in Fig. 10. Note that if significant excess heat remains at the end of the irradiation period, there will be a noticeable sharp drop in signal
128
9>
o a. E
Volume 99, Number 2, March-April 1994
Journal of Research of the National Institute of Standards and Technology
4. Probe Fabrication
4.1 Capillary Formation
The temperature sensing probes were fabricated from commercially available pyrex pipets. Figure 11 illustrates the first step. Weight A (about 3 g) was attached near the lower end, which had nomi- nal inside and outside diameters of 1 mm and 1.5 mm, respectively. These dimensions are too large. The inside diameter was to be formed by a high- melting-point wire, 0.30 mm in diameter. This would barely allow the thermistor to be inserted into the completed capillary. Weight B (about 300 g) was attached to the lower end of the wire, to keep it straight. The guide hole held the assembly in a vertical position. The flame shield offered
3.0 1 1 1
2.0 h \
\ \ \ Irradiation \ \ X,^ Tlme(s)
1.0
60 -^
0 1 1 1 5 10
Time After irradiation, s
15
Fig. 10. Excess temperature rise at the axis of a long solid glass rod (0.25 mm radius) immersed in water as a function of time after irradiation.
within 5 s after irradiation. During actual measure- ments (shown below) this was too small to be ob- servable.
3.4 Orientation of Probes
To avoid concerns and possible errors in mea- surement, it appears that positioning the axes of the temperature probes perpendicular to the beam (as shown in Fig. 1) is better than positioning a pair of probes parallel to the beam [11]. The concerns and errors would depend on the absorbed dose (temperature) profile along the probe, its geome- try, and the thermal diffusivity of the pyrex glass probe which is about four times that of water. Mea- surements are commonly made at the peak of the absorbed dose curve, where the radial temperature gradients are usually much smaller than the axial gradients. This might cause a component of heat to flow along the temperature probes (parallel to the beam) significantly different from that through wa- ter.
Weight
Flame Shield
Flame
0.30 mm Dia. Wire
Fig. 11. Illustrative method of reducing the diameter and wall thickness of a pipet to desirably small dimensions.
129
Volume 99, Number 2, March-April 1994
Journal of Research of the National Institute of Standards and Technology
some protection from distortion of the enclosed glass surface, which was to be part of the sealing surface for enclosing the HPW. Two torches were used to direct flames along opposite sides of the pipet. When the glass softened, weight A caused the pipet to stretch and collapse around the wire. The formed capillary and enclosed wire were cut. This shattered a small section of the capillary and blunted the end of the wire, which was filed to a point to permit its removal. It was successfully re- moved, roughly about 75 percent of the time with- out breaking the thin-wall capillary. The glass did not fuse to the wire, because it was pre-blackened over a candle flame. It was also pre-strained to re- move its curvature, which would otherwise cause a force against the thin capillary and possibly cause it to break when weight B was removed. Although the capillary diameters over a distance of at least 1 cm from the end ranged only 0.38 mm to 0.44 mm (measured with a graduated microscope disk), they were sufficiently sturdy. Capillaries with larger di- ameters were rejected.
4.2 Grinding
Figure 12 shows the method used for grinding the end of the capillary. The shattered end rested on a microscope slide containing a mixture of fine grinding powder and water. After the shattered end was ground off, the unit was heated in a fur- nace at 565 °C for several minutes to remove possi- ble strains in the glass.
Guides
\/
Microscope Slide
4.3 Aligning
Figure 13(a) indicates that the XX' axis of the probe large diameter (7 mm) did not necessarily coincide with the axis of the small capillary. This happened even though (as illustrated in Fig. 11) the assembly was held in a vertical position. The angle of offset was random. A significant offset would cause the thermistor to be unnecessarily too close to the glass wall when it was screwed into the assembly as shown in Fig. 3. This would cause the excess heat from the wall to arrive sooner at the thermistor. The most important part of the offset (toward the thermistor) was removed by the method illustrated in Fig. 13(b). The large diame- ter end was held in a lathe collet. The long thin capillary was flexible enough so that part of it was made to pass through a hole in a guide held with the lathe chuck. The lathe was turned at a slow speed ( — 25 rpm) while a flame was directed on the capillary as shown. When the glass softened, the strain along the capillary was relieved and then the flame was removed. This caused the thermistor to be aligned close to the XX' axis.
X-
(b)
Lathe: ^Collet Chuck
Ufll Flame
Guide
Fig. 12. Illustrative method of grinding the end of a capillary.
Fig. 13. Illustrative method of making the sensor end of the capillary axis coincide with the larger tube axis.
4.4 Encapsulation
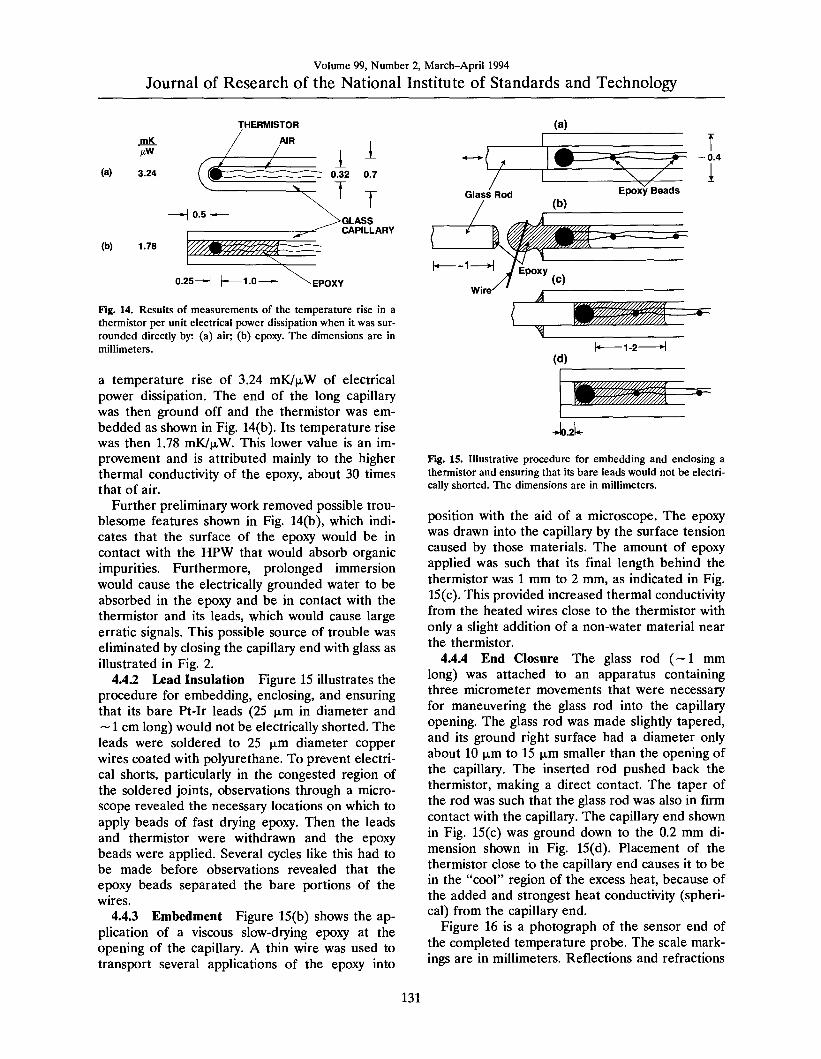
4.4.1 Thermal Coupling A desirable charac- teristic of a temperature probe is to have good thermal coupling between the thermistor and its surroundings. Figures 14(a) and 14(b) show the re- sults of preliminary work to determine the method to be used and its effectiveness in enclosing a ther- mistor [15]. When enclosed and surrounded by air as indicated in Fig. 14(a), the immersed probe had
130
Volume 99, Number 2, March-April 1994
Journal of Research of the National Institute of Standards and Technology
(a)
(b)
mK
3.24
1.78
EPOXY
Fig. 14. Results of measurements of the temperature rise in a thermistor per unit electrical power dissipation when it was sur- rounded directly by: (a) air; (b) epoxy. The dimensions are in millimeters.
a temperature rise of 3.24 mK/p-W of electrical power dissipation. The end of the long capillary was then ground off and the thermistor was em- bedded as shown in Fig. 14(b). Its temperature rise was then 1.78 mK/jjiW. This lower value is an im- provement and is attributed mainly to the higher thermal conductivity of the epoxy, about 30 times that of air.
Further preliminary work removed possible trou- blesome features shown in Fig. 14(b), which indi- cates that the surface of the epoxy would be in contact with the HPW that would absorb organic impurities. Furthermore, prolonged immersion would cause the electrically grounded water to be absorbed in the epoxy and be in contact with the thermistor and its leads, which would cause large erratic signals. This possible source of trouble was eliminated by closing the capillary end with glass as illustrated in Fig. 2.
4.4.2 Lead Insulation Figure 15 illustrates the procedure for embedding, enclosing, and ensuring that its bare Pt-Ir leads (25 |xm in diameter and ~ 1 cm long) would not be electrically shorted. The leads were soldered to 25 p-m diameter copper wires coated with polyurethane. To prevent electri- cal shorts, particularly in the congested region of the soldered joints, observations through a micro- scope revealed the necessary locations on which to apply beads of fast drying epoxy. Then the leads and thermistor were withdrawn and the epoxy beads were applied. Several cycles like this had to be made before observations revealed that the epoxy beads separated the bare portions of the wires.
4.4.3 Embedment Figure 15(b) shows the ap- plication of a viscous slow-drying epoxy at the opening of the capillary. A thin wire was used to transport several applications of the epoxy into
Fig. 15. Illustrative procedure for embedding and enclosing a thermistor and ensuring that its bare leads would not be electri- cally shorted. The dimensions are in millimeters.
position with the aid of a microscope. The epoxy was drawn into the capillary by the surface tension caused by those materials. The amount of epoxy applied was such that its final length behind the thermistor was 1 mm to 2 mm, as indicated in Fig. 15(c). This provided increased thermal conductivity from the heated wires close to the thermistor with only a slight addition of a non-water material near the thermistor.
4.4.4 End Closure The glass rod (~1 mm long) was attached to an apparatus containing three micrometer movements that were necessary for maneuvering the glass rod into the capillary opening. The glass rod was made slightly tapered, and its ground right surface had a diameter only about 10 |jL,m to 15 \i.m smaller than the opening of the capillary. The inserted rod pushed back the thermistor, making a direct contact. The taper of the rod was such that the glass rod was also in firm contact with the capillary. The capillary end shown in Fig. 15(c) was ground down to the 0.2 mm di- mension shown in Fig. 15(d). Placement of the thermistor close to the capillary end causes it to be in the "cool" region of the excess heat, because of the added and strongest heat conductivity (spheri- cal) from the capillary end.
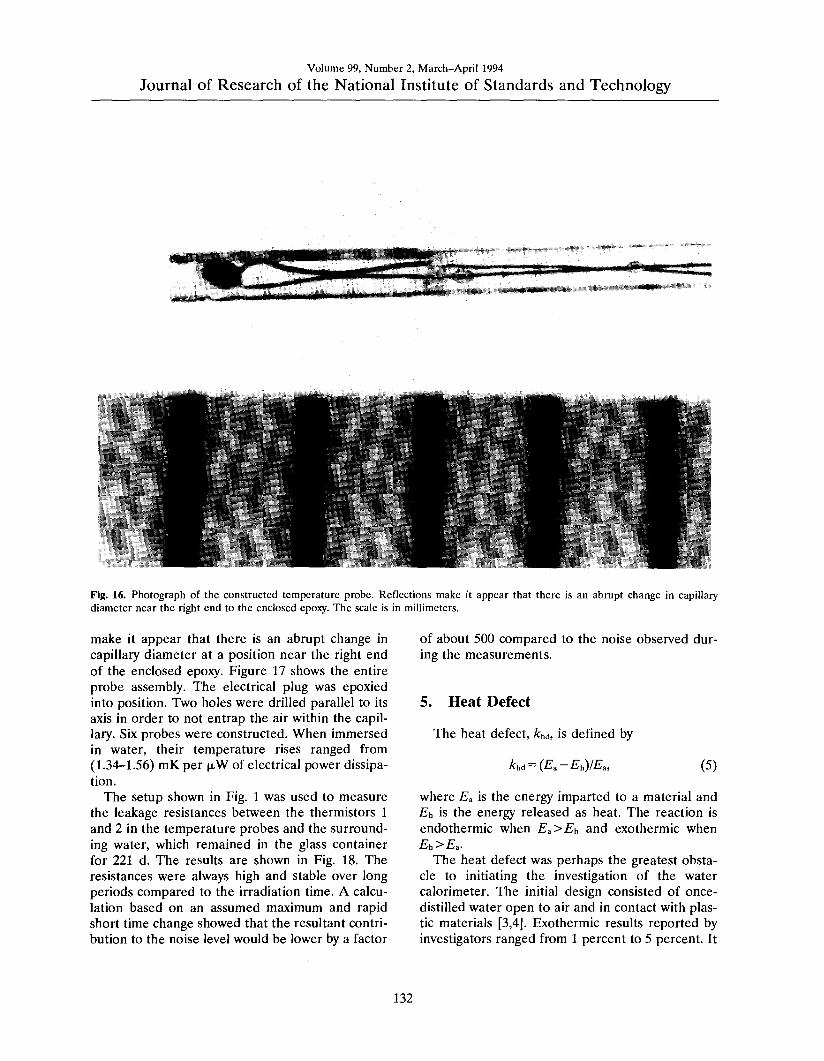
Figure 16 is a photograph of the sensor end of the completed temperature probe. The scale mark- ings are in millimeters. Reflections and refractions
131
Volume 99, Number 2, March-April 1994
Journal of Research of the National Institute of Standards and Technology
Fig. 16. Photograph of the constructed temperature probe. Reflections make it appear that there is an abrupt change in capillary diameter near the right end to the enclosed epoxy. The scale is in millimeters.
make it appear that there is an abrupt change in capillary diameter at a position near the right end of the enclosed epoxy. Figure 17 shows the entire probe assembly. The electrical plug was epoxied into position. Two holes were drilled parallel to its axis in order to not entrap the air within the capil- lary. Six probes were constructed. When immersed in water, their temperature rises ranged from (1.34-1.56) mK per jtW of electrical power dissipa- tion.
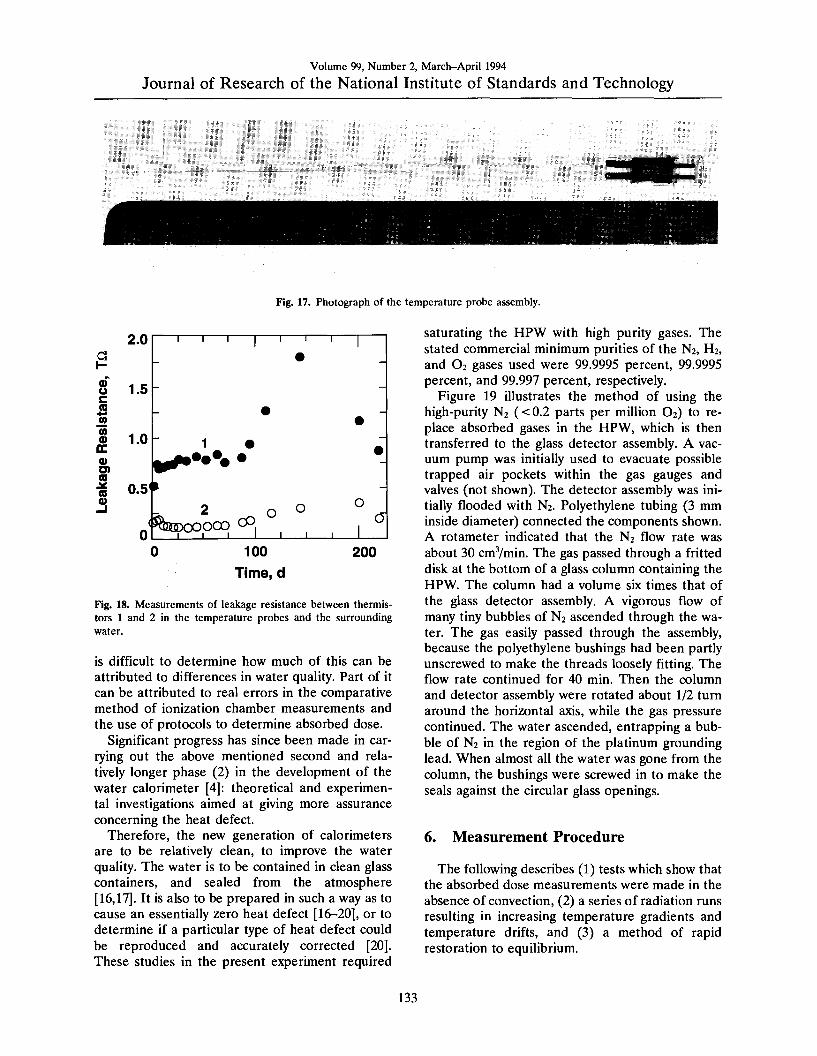
The setup shown in Fig. 1 was used to measure the leakage resistances between the thermistors 1 and 2 in the temperature probes and the surround- ing water, which remained in the glass container for 221 d. The results are shown in Fig. 18. The resistances were always high and stable over long periods compared to the irradiation time. A calcu- lation based on an assumed maximum and rapid short time change showed that the resultant contri- bution to the noise level would be lower by a factor
of about 500 compared to the noise observed dur- ing the measurements.
5. Heat Defect
The heat defect, A:hd, is defined by
(5)
where E^ is the energy imparted to a material and Eh is the energy released as heat. The reaction is endothermic when E^>Eh and exothermic when Eh>Ea.
The heat defect was perhaps the greatest obsta- cle to initiating the investigation of the water calorimeter. The initial design consisted of once- distilled water open to air and in contact with plas- tic materials [3,4]. Exothermic results reported by investigators ranged from 1 percent to 5 percent. It
132
Volume 99, Number 2, March-April 1994
Journal of Research of the National Institute of Standards and Technology
Fig. 17. Photograph of the temperature probe assembly.
a
0) u c (0 (0 w
oc 0) O) (D
« 0)
Fig. 18. Measurements of leakage resistance between thermis- tors 1 and 2 in the temperature probes and the surrounding water.
is difficult to determine how much of this can be attributed to differences in water quahty. Part of it can be attributed to real errors in the comparative method of ionization chamber measurements and the use of protocols to determine absorbed dose.
Significant progress has since been made in car- rying out the above mentioned second and rela- tively longer phase (2) in the development of the water calorimeter [4]: theoretical and experimen- tal investigations aimed at giving more assurance concerning the heat defect.
Therefore, the new generation of calorimeters are to be relatively clean, to improve the water quality. The water is to be contained in clean glass containers, and sealed from the atmosphere [16,17]. It is also to be prepared in such a way as to cause an essentially zero heat defect [16-20], or to determine if a particular type of heat defect could be reproduced and accurately corrected [20]. These studies in the present experiment required
saturating the HPW with high purity gases. The stated commercial minimum purities of the N2, H2, and O2 gases used were 99.9995 percent, 99.9995 percent, and 99.997 percent, respectively.
Figure 19 illustrates the method of using the high-purity N2 (<0.2 parts per million O2) to re- place absorbed gases in the HPW, which is then transferred to the glass detector assembly. A vac- uum pump was initially used to evacuate possible trapped air pockets within the gas gauges and valves (not shown). The detector assembly was ini- tially flooded with N2. Polyethylene tubing (3 mm inside diameter) connected the components shown. A rotameter indicated that the N2 flow rate was about 30 cmVmin. The gas passed through a fritted disk at the bottom of a glass column containing the HPW. The column had a volume six times that of the glass detector assembly. A vigorous flow of many tiny bubbles of N2 ascended through the wa- ter. The gas easily passed through the assembly, because the polyethylene bushings had been partly unscrewed to make the threads loosely fitting. The flow rate continued for 40 min. Then the column and detector assembly were rotated about 1/2 turn around the horizontal axis, while the gas pressure continued. The water ascended, entrapping a bub- ble of N2 in the region of the platinum grounding lead. When almost all the water was gone from the column, the bushings were screwed in to make the seals against the circular glass openings.
6. Measurement Procedure
The following describes (1) tests which show that the absorbed dose measurements were made in the absence of convection, (2) a series of radiation runs resulting in increasing temperature gradients and temperature drifts, and (3) a method of rapid restoration to equilibrium.
133
Volume 99, Number 2, March-April 1994
Journal of Research of the National Institute of Standards and Technology
Polyethylene
Platinum Grounding Lead
Fig. 19. Illustrative method of gas saturating the HPW, which was then transferred to and sealed in the shown thin-wall glass tube. The drawing is not to scale.
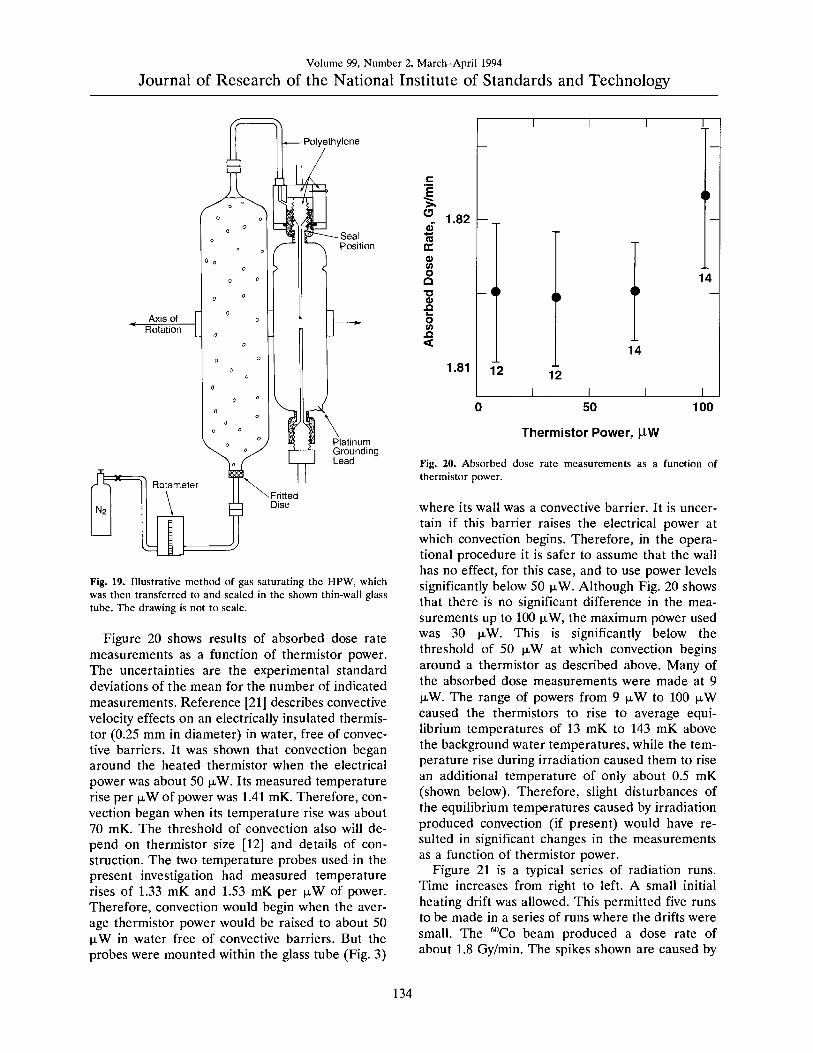
Figure 20 shows results of absorbed dose rate measurements as a function of thermistor power. The uncertainties are the experimental standard deviations of the mean for the number of indicated measurements. Reference [21] describes convective velocity effects on an electrically insulated thermis- tor (0.25 mm in diameter) in water, free of convec- tive barriers. It was shown that convection began around the heated thermistor when the electrical power was about 50 |xW. Its measured temperature rise per IJLW of power was 1.41 mK. Therefore, con- vection began when its temperature rise was about 70 mK. The threshold of convection also will de- pend on thermistor size [12] and details of con- struction. The two temperature probes used in the present investigation had measured temperature rises of 1.33 mK and 1.53 mK per JJLW of power. Therefore, convection would begin when the aver- age thermistor power would be raised to about 50 |JLW in water free of convective barriers. But the probes were mounted within the glass tube (Fig. 3)
E
O
re cc w o Q T3 9) n o (0
<
—
1 1 1
—
'' 1.82 —. r
r
T
—
14 -O o
14 1.81
-L
"12 1 12
1 i 1 50
Thermistor Power, )iW
100
Fig. 20. Absorbed dose rate measurements as a function of thermistor power.
where its wall was a convective barrier. It is uncer- tain if this barrier raises the electrical power at which convection begins. Therefore, in the opera- tional procedure it is safer to assume that the wall has no effect, for this case, and to use power levels significantly below 50 (xW. Although Fig. 20 shows that there is no significant difference in the mea- surements up to 100 (xW, the maximum power used was 30 |xW. This is significantly below the threshold of 50 |i,W at which convection begins around a thermistor as described above. Many of the absorbed dose measurements were made at 9 JJLW. The range of powers from 9 |i,W to 100 |jiW caused the thermistors to rise to average equi- librium temperatures of 13 mK to 143 mK above the background water temperatures, while the tem- perature rise during irradiation caused them to rise an additional temperature of only about 0.5 mK (shown below). Therefore, slight disturbances of the equilibrium temperatures caused by irradiation produced convection (if present) would have re- sulted in significant changes in the measurements as a function of thermistor power.
Figure 21 is a typical series of radiation runs. Time increases from right to left. A small initial heating drift was allowed. This permitted five runs to be made in a series of runs where the drifts were small. The *Co beam produced a dose rate of about 1.8 Gy/min. The spikes shown are caused by
134
Volume 99, Number 2, March-April 1994
Journal of Research of the National Institute of Standards and Technology
Heating
Beam on (1.8Gy/min)
SOmGy 12|JLK
T 0.1 |XV
Off at 70s
(0.50 mK)
Pi = P2 = 30 |JLW
ATi = 40 mK AT2 = 46 mK
Time
Fig. 21. Typical consecutive runs showing measurement parameters and changes in tem- perature drifts as a result of heat conduction caused by coUimated beam irradiation. Time increases from right to left.
the heating and manual adjustments in the bridge balancing resistor, R. The duration of the runs was varied around 70 s to produce a temperature rise of only about 0.5 mK. The runs were analyzed in the usual way by extrapolating the initial and final drift to the mid-run, and determining the offset by cali- brating the chart deflection from a known resis- tance change in R. A computer calculated the resistance value of R that would rebalance the bridge.
The first three temperature drifts are essentially unchanged. The fourth drift shows a small but sig- nificant change. The fifth drift shows a slight cool- ing, followed by the sixth drift, which shows significant cooling. This typical behavior is a result of outward conduction of heat from the penumbra of the collimated square beam, approximately 145 mm at the 50 percent dose level. Initially, the ther- mistors did not sense the outward flow of heat. Each thermistor had an electrical power dissipa- tion of 30 JJLW, which caused an equilibrium tem- perature rise of 40 mK in thermistor 1 and 46 mK in thermistor 2. Superimposed on these tempera- ture rises were the 0.5 mK temperature rises as a result of beam irradiation. The results shown in Fig. 20 and the predictable behavior of the succes-
sive drifts shown in Fig. 21 are indications that the glass wall is an effective convective barrier against external convection and that it is unnecessary to operate the calorimeter at 4°C [11].
The drift balancer circuit shown in Fig. 4 can balance out large drifts. But generally, large tem- perature gradients within the calorimeter should be removed and equilibrium restored. Equilibrium was restored after eliminating the temperature gra- dients by circulating the once-distilled water shown in Fig. 1 (in most cases this circulating procedure was done after only two consecutive runs). The wa- ter was slightly heated with the immersion heaters and circulated with an aquarium pump, which forced air to rise along the four vertical corners of the acrylic container. After several minutes the pump was turned off and the water gradually be- came stagnant. The drift continued because of a temperature difference between the circulated wa- ter and that within the glass container. The heating or cooling drift gradually became smaller as con- duction continued, and within approximately 20 min (depending of the initial temperature differ- ence) the drifts were small enough to continue an- other series of runs. Approximately 40 runs could be made in a period of 5.5 h.
135
Volume 99, Number 2, March-April 1994
Journal of Research of the National Institute of Standards and Technology
7. Results of Absorbed Dose Measurements
7.1 Na-Saturated Results
All measurements refer to a linear depth of 5 cm and were normalized to a particular date to correct for ""Co decay. Slight corrections normalized the measurements to a calorimeter operating tempera- ture of 22.0 °C, where the density of water is 0.9978 g/cm^. The specific heat capacity of water at this temperature was taken to be 4.1808 J/(g-°C) [22], which is assumed to be the same for air-saturated and air-free water [23]. A small estimated correc- tion (mentioned below) was made for the effect of the thin glass wall.
Figure 22 shows the number of daily measure- ments with the first water filling irradiated with an accumulated absorbed dose of 2.9 kGy. Measure- ments were made on 14 d over a time period of 58 d. The vertical and horizontal bars indicate, respec- tively, the standard deviations of the mean and the accumulated absorbed dose. It is assumed that the variations shown are statistical. On the first day there was an initial variation, which was not notice- able on subsequent days. The first measurement was about 6.5 percent higher than those after the 7th run (accumulated absorbed dose of about 20 Gy), where the measurements thereafter appeared to show statistical variations. This was the same general type of behavior observed on the first day of measurement after other water fillings, de- scribed below. The initial measurements showed exothermicity, which rapidly vanished and were ig- nored, as discussed below.
On some days, measurements began with a group of measurements followed by continuous un- recorded irradiation from 30 min to 3 h and then
0.5 1.0 1.5 2.0 2.5
Accumulated Absorbed Dose, kGy
3.0
Fig. 22. Results of 14 d of measurements of absorbed dose rate vs accumulated absorbed dose in the first N2-saturated water filling. The numbers indicate the number of measurements made on a day. There were 58 elapsed days from the first to the last day of measurement.
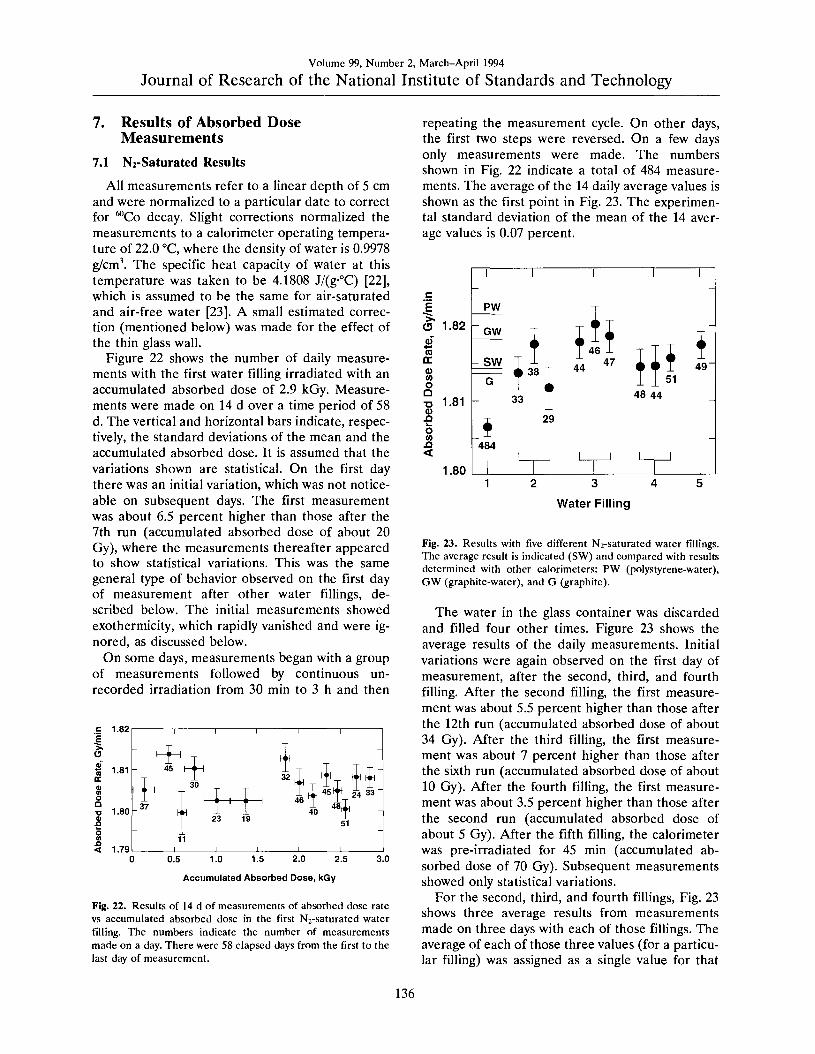
repeating the measurement cycle. On other days, the first two steps were reversed. On a few days only measurements were made. The numbers shown in Fig. 22 indicate a total of 484 measure- ments. The average of the 14 daily average values is shown as the first point in Fig. 23. The experimen- tal standard deviation of the mean of the 14 aver- age values is 0.07 percent.
O 1.82
(S cc
tn o Q T3 1.81 V .Q O (0 n <
1.80
I r T I r
PW
GW
SW
\ 33
j 44
48 44
i 49"
484
29
J L_ I
1 2 4 5
Water Filling
Fig. 23. Results with five different N2-saturated water fillings. The average result is indicated (SW) and compared with results determined with other calorimeters: PW (polystyrene-water), GW (graphite-water), and G (graphite).
The water in the glass container was discarded and filled four other times. Figure 23 shows the average results of the daily measurements. Initial variations were again observed on the first day of measurement, after the second, third, and fourth filling. After the second filling, the first measure- ment was about 5.5 percent higher than those after the 12th run (accumulated absorbed dose of about 34 Gy). After the third filling, the first measure- ment was about 7 percent higher than those after the sixth run (accumulated absorbed dose of about 10 Gy). After the fourth filling, the first measure- ment was about 3.5 percent higher than those after the second run (accumulated absorbed dose of about 5 Gy). After the fifth filling, the calorimeter was pre-irradiated for 45 min (accumulated ab- sorbed dose of 70 Gy). Subsequent measurements showed only statistical variations.
For the second, third, and fourth fillings. Fig. 23 shows three average results from measurements made on three days with each of those fillings. The average of each of those three values (for a particu- lar filling) was assigned as a single value for that
136
Volume 99, Number 2, March-April 1994
Journal of Research of the National Institute of Standards and Technology
filling. The average of the five values is 1.814 Gy/ min, which is indicated as SW. The standard devia- tion of the five averages is 0.27 percent, which indicates the reproducibility of measurements with the water fillings. This is in good agreement with the 0.25 percent standard deviation determined by Schulz et al. [17], who used a similar water purify- ing system and saturated the water with high-purity nitrogen.
Figure 23 shows results of comparable absorbed dose determinations converted to water as mea- sured with a polystyrene-water (PW) calorimeter [7] shown in Fig. 24, a graphite-water (GW) calorimeter where the schematic detector details are shown in Fig. 25, and a graphite (G) calorime- ter [24] shown in Fig. 26. Measurements with the PW and GW calorimeters were converted to ab- sorbed dose to water by use of the mass energy- absorption coefficients. Conversion of the G calorimeter measurements is described by Pruitt et al. [25]. The estimated combined standard uncer- tainties of the measurements with the PW, GW, and G calorimeters are 1.1 percent, 0.7 percent, and 0.6 percent, respectively.
The PW result is based on the specific heat ca- pacity of polystyrene, which was calculated from an empirical equation [26]:
c =(104.15)-'(7.7551-10'T-^
+ 0.53447 T - 41.58) J/(g-K), (6)
where T is the absolute temperature. One mole of polystyrene = 104.15 g.
THERMISTORS IN POLYSTYRENE
EXPANDED POLYSTYRENE
ALUMINUM FOIL
WATER LEVEL
30cm CUBE ACRYLIC CONTAINER
30 cm SQUARE ELECTRODE
i-r;S ADIABATIC POWER
CONTROLLER
Fig. 24. Essential features of the absorbed dose polystyrene-wa- ter calorimeter. The "adiabatic" power controller permits a fxj- tential to be applied across the electrodes so that in the vicinity of the 10 mm thick polystyrene disks the rate of temperature rise of the water, as a result of electrical power and beam irradia- tion, is as nearly as possible the same as that of the disks.
Fig. 25. Essential features of the detector assembly for the ab- sorbed dose graphite-water (GW) calorimeter.
Recently, accurate measurements were made of the specific heat capacity of polystyrene [27] of sample pieces cut from a different slab, 50 mm thick. The result was 2.0 percent higher [8,27] than that calculated by the use of Eq. (6). The result determined with the GW and the G calorimeter do not depend on knowing the specific heat capacity of graphite, because the temperature responses of those calorimeters are electrically calibrated. Therefore, these two results are considered to have less uncertainty than that determined with the PW calorimeter; and although this latter result is in reasonably good agreement with the three others shown, it is not included with the calorimetric cali- bration of the '^Co source.
Other comparisons of absorbed dose to water standards (calorimetric, Fricke dosimetry, and ionometric) are generally in agreement to about 1 percent. These are reported in Refs. [28-31].
7.2 H2-Saturated Results
Figure 27 shows the results obtained with five fillings of water saturated with hydrogen. In nearly all cases, each point is the average of 32 measure- ments made in a day. The uncertainties are experimental standard deviations of the mean. Measurements for the first filling were made on 14 d. Measurements for the second, third, fourth, and fifth fillings were made on 8 d. The accumulated absorbed dose for each filling was about 1.25 kGy. Daily measurements began with or without a 30 min, 45 min, or 90 min pre-irradiation. On some days, a continuous irradiation period of 45 min or 90 min was applied after measurement No. 16 (midway of a daily set of measurements). In con- trast to the N2-saturated water, the initial measure- ments in the H2-saturated water showed little or no initial exothermic effect.
137
Volume 99, Number 2, March-April 1994
Journal of Research of the National Institute of Standards and Technology
^ T.Ml.TiFn) X
SHIELD HEATER-
■^ACRYLIC VACUUM CONTAINER
CALORII SUPPORT
UUM AND DUCT
Fig. 26. Side-view cross section of the graphite (G) absorbed dose calorimeter.
1.815
Filling
Fig. 27. Daily averages of absorbed dose rate measurements with five fillings of water saturated with H2.
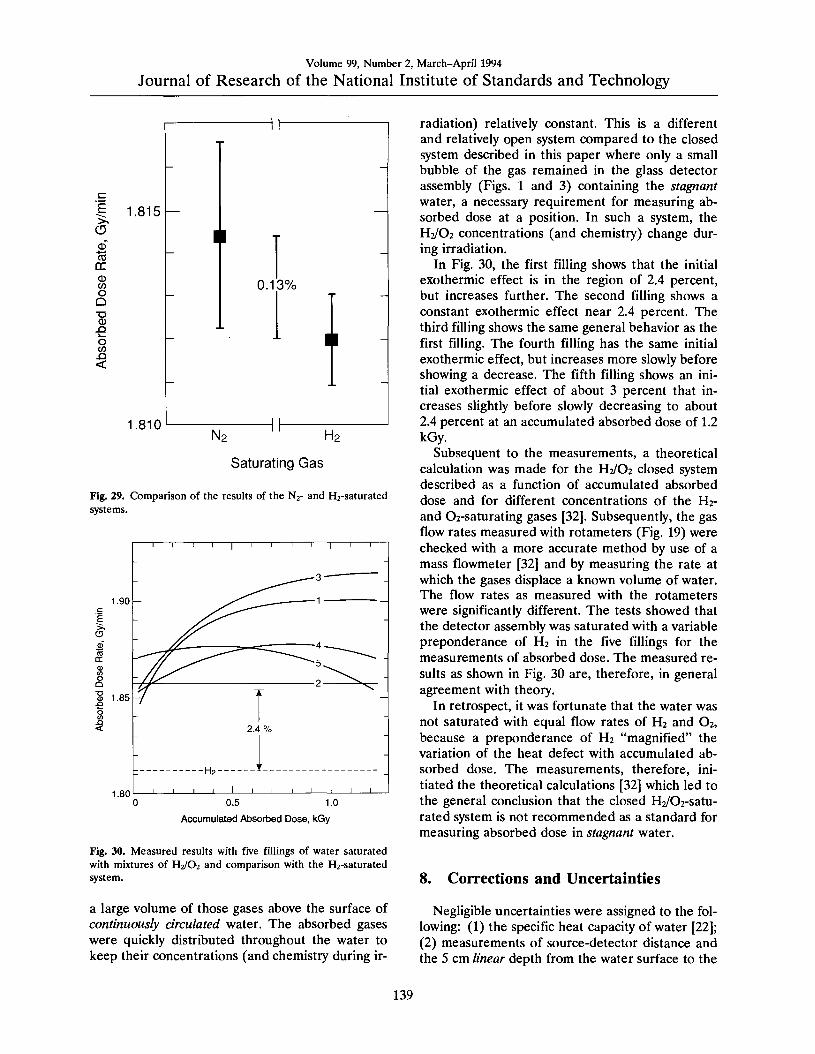
A single value for each filling was calculated as the average of the points shown for that filling in Fig. 27. The results are shown in Fig. 28. The aver- age value and the experimental standard deviation of the mean was calculated for those five points and are shown in Fig. 29. The results with the H2- and Nz-saturated water are in good agreement and within the uncertainties. The 0.13 percent differ- ence is in good agreement with, and in the same direction as the 0.3 percent difference reported by Klassen and Ross [20].
1.805
Fig. 28. Average results of the five fillings saturated with H2.
7.3 H2/02-Saturated Results
Figure 30 shows the results with mixtures of H2/O2 and compared with the H2 result (from Fig. 29). The 2.4 percent exothermic effect is that re- ported [20] for saturating "high-purity" water with equal flow rates of H2 and O2, and where there was
138
Volume 99, Number 2, March-April 1994
Journal of Research of the National Institute of Standards and Technology
1.810 N2 H2
Saturating Gas
Fig. 29. Comparison of the results of the N2- and H2-saturated systems.
1.90
O
1.80
1 1 1 1 1 1 1 1 1
- ^^- _^3 -
- •^ ^"^"^
^.^; ?- '''"^''^ ""^■^5
-/J^ ^^- ( I
- 2.' % -
1
H2--
1 1 1
5
1 1 1 1 1 1
0.5 1.0
Accumulated Absorbed Dose, kGy
Fig. 30. Measured results with five fillings of water saturated with mixtures of H2/O2 and comparison with the H2-saturated system.
a large volume of those gases above the surface of continuously circulated water. The absorbed gases were quickly distributed throughout the water to keep their concentrations (and chemistry during ir-
radiation) relatively constant. This is a different and relatively open system compared to the closed system described in this paper where only a small bubble of the gas remained in the glass detector assembly (Figs. 1 and 3) containing the stagnant water, a necessary requirement for measuring ab- sorbed dose at a position. In such a system, the H2/O2 concentrations (and chemistry) change dur- ing irradiation.
In Fig. 30, the first filling shows that the initial exothermic effect is in the region of 2.4 percent, but increases further. The second filling shows a constant exothermic effect near 2.4 percent. The third filling shows the same general behavior as the first filling. The fourth filling has the same initial exothermic effect, but increases more slowly before showing a decrease. The fifth filling shows an ini- tial exothermic effect of about 3 percent that in- creases slightly before slowly decreasing to about 2.4 percent at an accumulated absorbed dose of 1.2 kGy.
Subsequent to the measurements, a theoretical calculation was made for the H2/O2 closed system described as a function of accumulated absorbed dose and for different concentrations of the H2- and 02-saturating gases [32]. Subsequently, the gas flow rates measured with rotameters (Fig. 19) were checked with a more accurate method by use of a mass flowmeter [32] and by measuring the rate at which the gases displace a known volume of water. The flow rates as measured with the rotameters were significantly different. The tests showed that the detector assembly was saturated with a variable preponderance of H2 in the five fillings for the measurements of absorbed dose. The measured re- sults as shown in Fig. 30 are, therefore, in general agreement with theory.
In retrospect, it was fortunate that the water was not saturated with equal flow rates of H2 and O2, because a preponderance of H2 "magnified" the variation of the heat defect with accumulated ab- sorbed dose. The measurements, therefore, ini- tiated the theoretical calculations [32] which led to the general conclusion that the closed H2/02-satu- rated system is not recommended as a standard for measuring absorbed dose in stagnant water.
8. Corrections and Uncertainties
Negligible uncertainties were assigned to the fol- lowing: (1) the specific heat capacity of water [22]; (2) measurements of source-detector distance and the 5 cm linear depth from the water surface to the
139
Volume 99, Number 2, March-April 1994
Journal of Research of the National Institute of Standards and Technology
horizontal plane where the thermistors were lo- cated, because of the uncertainty ( — 0.02 percent) in the optical sighting and the micrometer mea- surements; (3) measurements of the thermistor sensitivities; because of the reproducibility of their values before and after the experiment (from Table 1) and because the average of those values were used in the analysis; (4) beam exposure timing; and (5) excess heat generated in the temperature probes, because of the calculated heat flow analy- sis.
lonization measurements in a water phantom showed that the aluminum foil and expanded polystyrene of the calorimeter lid decreased the measurements by 0.34 percent. This correction was made and a 0.05 percent uncertainty of one stan- dard deviation was assigned. The effect of the thin glass wall was to cause the measurement depth to be slightly greater than if the wall had been "water equivalent." A rough estimate based on ionization measurements and a simple geometry showed that the absorbed dose measurements had to be cor- rected by an increase of about 0.14 percent. A 0.1 percent estimated uncertainty was assigned.
The most difficult correction and uncertainty to assign is that related to the heat defect, if any. Fig- ure 29 indicates that the difference of 0.13 percent is not significant for the N2 system, even though the measurements and theoretical calculations show that the H2 system is cleaner. The N2 system showed significant initial exothermic effects after a filling, which was not observed or relatively small for the H2 system. Also, there is good agreement with measurements made with the G and GW calorimeters, which have no heat defect. No cor- rection is applied to the H2 system, but a 0.3 per- cent heat defect uncertainty is assigned. Table 2 lists the standard uncertainties with the H2 system. The combined standard uncertainty is 0.4 percent.
9. Conclusions and Future Plans
Based on the measurements and theoretical cal- culations, it appears that the H2-saturated system is the best practical choice in eliminating the heat de- fect in water. The flow rate of the gas need not be accurately known so long as there is an abundant supply (roughly about 30 cmVmin) bubbling through the water column such as shown in Fig. 19 for about 40 min. Measurements and tests indicate that the design of the calorimeter is sufficient for operation at room temperature.
Future plans are to significantly improve the op- erational efficiency by increasing the rapidity of making successive irradiation runs. This can be done by decreasing the time from the moment the water circulation is turned off to the time that the temperature drift is sufficiently small to start an- other irradiation run.
The motion and variation in temperature of the water in the region of the detector assembly was studied during the calibration of a thermistor re- moved from the glass container. Therefore, its re- sponse to the motion and temperature of the water was essentially instantaneous. About 10 min was required for the motion to subside. During this pe- riod there was a heat exchange between the water and its surroundings. This caused the water to be not strictly uniform in temperature. The variations in temperature could be significant compared to the small temperature rises during irradiation. It is required that the glass container be surrounded by motionless water so that if there is a temperature difference between that water and that within the container, heat conduction will take place to re- duce the drifts to sufficiently small and predictable values during the irradiation period.
The above would require (1) a means for quickly stopping the motion of the water around the detec-
Table 2. Uncertainties with the H2 system
Source
Estimated standard uncertainty (%)
Statistical, Si Other, ;x, (degrees of freedom, v,)
Heat defect Reproducibility of measurement groups (Fig. 28) Beam attenuation from glass wall Beam attenuation of calorimeter lid
0.15 (4)
0.05 (5)
0.3
0.1
Combined standard uncertainty = V2i/^ + 2/x/ = 0.4%
140
Volume 99, Number 2, March-April 1994
Journal of Research of the National Institute of Standards and Technology
tor assembly after circulation, and (2) that the cir- culated water (immediately after power turn off) is essentially at the same temperature as that of the stagnant water in the detector assembly. The means for (1) would simply be a thin horizontal baffle positioned at some distance below the detec- tor assembly and attached to its two supports (Fig. 1) and to investigate if the baffle does not signifi- cantly interfere with the water circulation. The means for accomplishing (2) is by making a slight modification in the Wheatstone bridge shown in Fig. 4. During circulation, a switch would replace R' with a thermistor (not shown) in the circulated water, and replace thermistor 1 with a resistor. The bridge would then respond to temperature differ- ences between the two bodies of water. This would indicate if the circulation needed to be continued or the water slightly heated with the immersed heaters (not shown) to produce a bridge null condi- tion. This would reduce the time for the final drift to subside to small values.
10. Recommendation
A recommendation pointed out in Ref. [4] needs to be repeated concerning protection against signif- icant variations in ambient temperature. Although this was not the case during the measurements, a structure was built for that purpose. It is a four- sided acrylic structure having an expanded polystyrene lid with a polyethylene film covering the beam entrance window. A temperature sensor, heater, and fan were mounted on an inside wall. The circulated air was controlled to about 0.02 °C and set to match that of the water in the calorimeter.
11. References
[1] ICRU Report No. 14, Radiation Dosimetry: X-Rays and Gamma Rays with Maximum Photon Energies Between 0.6 and 50 MeV, International Commission on Radiation Units and Measurements, Washington, D.C. (1969).
[2] Task Group 21, Radiation Therapy Committee, AAPM, A Protocol for the Determination of Absorbed Dose from High-Energy Photon and Electron Beams, Med. Phys. 10, 741 (1983).
[3] S. R. Domen, Med. Phys. 7, 157 (1980). [4] S. R. Domen, J. Res. Natl. Bur. Stand. (U.S.) 87, 211
(1982). [5] S. R. Domen, in The Dosimetry for Ionizing Radiation,
Vol. II, K. R. Kase, B. E. Bjarngard, and F. H. Attix, eds.. Academic Press, New York (1987) p. 245.
[6] S. R. Domen, Int. J. Appl. Radiat. Isot. 34, 927 (1983). [7] S. R. Domen, J. Res. Natl. Bur. Stand. (U.S.) 88, 373
(1983).
[8] S. R. Domen and W. Z. Ba, Nucl. Instr. Meth. B24/25, 1054 (1987).
[9] B. Petree and P. J. Lamperti, unpublished data. 10] ICRU Report No. 34, The Dosimetry of Pulsed Radiation,
International Commission on Radiation Units and Mea- surements, Washington, D.C. (1982) p. 22.
11] R. J. Schulz and M. S. Weinhous, Phys. Med. Bid. 30,1093 (1985).
12] R. B. Barnett, Water calorimetry for radiation dosimetry, Ph.D. Thesis, Univ. of Calgary, Calgary, Alberta, Canada (1986).
13] E. McLaughlin, Chem. Rev. 64, 389 (1964). 14] M. G. Velarde and C. Normand, Sci. Am. 243(1), 93
(1980). 15] S. R. Domen, in Proc. NRC Workshop on Water
Calorimetry, C. K. Ross and N. V. Klassen, eds.. National Research Council of Canada, Ottawa, (1988) p. 85.
16] C. K. Ross, N. V. Klassen, and G. D. Smith, Med. Phys. 11, 653 (1984).
17] R. J. Schulz, C. S. Wuu, and M. S. Weinhous, Med. Phys. 14, 790 (1987).
18] H. J. Selbach, K. Hohlfeld, and H. M. Kramer, An experi- mental method for measuring the heat defect of water us- ing total absorption of soft x-rays, Metrologia 29, 341-347 (1992).
19] M. Roos, B. Grosswendt, and K. Hohlfeld, An experimen- tal method for determining the heat defect of water using total absorption of high-energy electrons, Metrologia 29, 59-65 (1992).
20] N. V. Klassen and C. K. Ross, Radiat. Phys. Chem. 38, 95 (1991).
21] S. R. Domen, J. Res. Natl. Bur. Stand. (U.S.) 93, 603 (1988).
22] N. S. Osborne, H. F. Stimson, and D. C. Ginnings, Values listed in the familiar Handbook of Chemistry and Physics, Chemical Rubber Publishing Co.
23] T. H. Laby and E. O. Hercus, Proc. Phys. Soc. (London) 47, 1003 (1935).
24] S. R. Domen and P. J. Lamperti, J. Res. Natl. Bur. Stand. (U.S.) 78, 595 (1974).
25] J. S. Pruitt, S. R. Domen, and R. Loevinger, J. Res. Natl. Bur. Stand. (U.S.) 86, 495 (1981).
26] U. Gaur and B. Wunderlich, J. Phys. Chem. Ref. Data, 11, 313 (1982).
27] R. A. Robie, private communication. 28] C. K. Ross, N. V. Klassen, K. R. Shortt, and G. D. Smith,
in NRC Workshop on Water calorimetry, C. K. Ross and N. V. Klassen, eds. National Research Council of Canada, Ottawa (1988) p. 69.
29] O. Mattsson, H. Svensson, G. Wickman, S. R. Domen, J. S. Pruitt, and R. Loevinger, Acta Oncologica 29, 235 (1989).
30] J. S. Pruitt, Absorbed-dose calibration of ionization cham- bers in a ™Co gamma-ray beam, NIST Special Publication 250-40 (1990) p. 44.
31] K. R. Shortt, S. R. Domen, and D. L. Bensen, Comparison of Dosimetric Measurement Standards of the NRCC and the NIST, manuscript in preparation.
32] N. V. Klassen, manuscript in preparation.
About the author: Steve R. Domen is a Guest Re- searcher in the Ionizing Radiation Division of the Na- tional Institute of Standards and Technology. The National Institute of Standards and Technology is an agency of the Technology Administration, U.S. De- partment of Commerce.