+ All Categories
Home > Documents > A Sediment Study of Little Leading Creek - Meigs Soil and ... · PDF fileA Sediment Study of...

A Sediment Study of Little Leading Creek - Meigs Soil and ... · PDF fileA Sediment Study of...

Date post: 06-Mar-2018
Category:
Upload: trinhmien
View: 215 times
Download: 1 times
Share this document with a friend
38
A Sediment Study of Little Leading Creek Guy Riefler 1 , Ben Stuart 1 , Tiao Chang 1 , Barbara Flowers 2 , Jennifer Chapman- Kleski 3 , Yanhui Fang 1 1 Department of Civil Engineering 2 Ohio Dept of Natural Resources 3 Environmental Studies
Transcript

A Sediment Study of LittleLeading Creek

Guy Riefler1, Ben Stuart1, Tiao Chang1,Barbara Flowers2, Jennifer Chapman-Kleski3, Yanhui Fang1

1Department of Civil Engineering2Ohio Dept of Natural Resources3Environmental Studies

2Ohio University

Little Leading Creek

Appalachian Plateau Region ofSoutheast Ohio

5th Order Perennial Tributary toLeading Creek a Tributary of theOhio River

Watershed Size 25.6 Mi2Main Stem Length 9.1 Miles

3Ohio University

Impairment of Creek

• fails to meet warm water habitatcriteria because of excessivesand

• filled pools results in poorbreeding and few hiding places

• fish assemblages diverse but ofvery small size

• history of frequent flooding

4Ohio University

Sand

• deeplyentrenchedchannels

• highlyerodiblebanks

• poor habitatin channel forfish

5Ohio University

And More Sand

• deep sanddeposits inchannel

• during lowflow, surfacewater drainsthrough thesanddeposits

6Ohio University

Mining History

• majority of the active surface miningtook place between 1950 and 1964

• reclaimed AML = 1.1 Mi2

• unreclaimed AML = 1.2 Mi2

• 9% of watershed

• over $4 million spent on AMLreclamation in Little Leading Creekwatershed from 1979-1990

7Ohio University

Mining Erosion

• potential erosion ratefrom strip mining =200+ ton/acre (USDA,1985)

• translates in LittleLeading CreekWatershed to annualerosion of possibly423,000+ tons for 15-40 years

8Ohio University

Study Objectives

• Characterize Sediment Within Stream Bed• Measure Sediment Load and Transport Rate• Identify Sediment Sources• Propose Restoration Alternatives

9Ohio University

Estimating Sediment Transport

Continuous StageReadings

Velocity Measurementsto Estimate Discharge

Bed Load andSuspended

Load Measurements

10Ohio University

Peterson Study SegmentVelocity Measurements

Velocity Measurements recordedusing an Electromagnetic Flow Meter

Velocity Profile Plot of Cross Section

-1.5

-1.0

-0.5

0.0

0.5

1.0

1.5

2.0

2.5

3.0

0 5 10 15 20 25 30

Distance (Ft)

Dis

tance fro

m W

ate

r S

urf

ace (

Feet)

-1.5

-1.0

-0.5

0.0

0.5

1.0

1.5

2.0

2.5

3.0

0 5 10 15 20 25 30

Velo

city (

ft/s

)

Distance from Water Surface Velocity

Average Velocity .89 ft/s

Total Discharge 11.09 CFS

Water Surface ?

11Ohio University

Discharge Rating Curve

• stage dischargemeasurements overrange of inbank flows

• two distinct curves• transition at 29.1 cfs

represents shift fromsection control tochannel control

• sediment onlytransported out ofsection during higherflow events

12Ohio University

Bedload Transport Observations

• after high flow events, poolsand riffles evident

– floods scour sand out ofchannel

• during low flows, bedloadtransport still high as sand isredistributed

– between storm events poolsfill with sand

13Ohio University

Suspended Sediment Collection

Non-wadable Flows• US DH-59

Wadable Flows• Depth Integrated

• Hand Held Sampler ModelNumber USDH-48

14Ohio University

Suspended Sediment Rating Curve

15Ohio University

Bed Load Collection

Helley Smith Hand Held SamplerModel No. 8015

16Ohio University

Sieved Bedload

% FinerThan Particle Size

D16 0.36

D50 0.50

D84 1.80

poorly graded coarse sand

0

10

20

30

40

50

60

70

80

90

100

0.01 0.10 1.00 10.00 100.00

Particle Size (mm)

Cum

ula

tive (

% F

iner

Than)

0

20

40

60

80

100

120

140

160

180

We

igh

t P

as

sin

g S

iev

e (

g)

Cumulative % Less Than Weight

17Ohio University

Bedload Transport Rates

• higher bedloadobserved thansuspended sediment

• at higher flowssuspended sedimentmay exceed bedload

• estimated sectiontransport– SS = 10 ton/yr– BL = 18 ton/yr

• estimated channeltransport– SS = 7 ton/yr– BL = 8 ton/yr

Suspended Sediment Rating Curve

Bedload Rating Curve

y =

8.46x0.86

R2 = 0.95

y =

44.35x0.54

R2 = 0.74

1

10

100

1,000

10,000

1 10 100 1000

Discharge (cfs)

Lo

ad

(lb

/d)

18Ohio University

Assessment of AML Reclamation

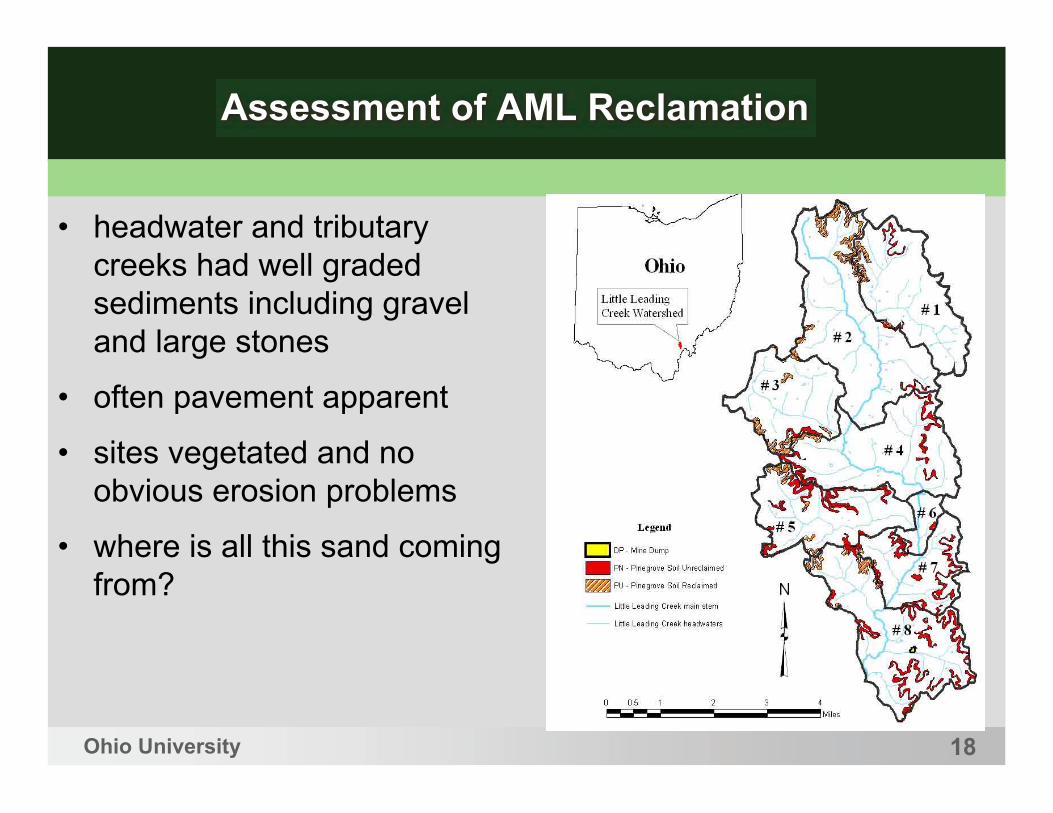
• headwater and tributarycreeks had well gradedsediments including graveland large stones

• often pavement apparent

• sites vegetated and noobvious erosion problems

• where is all this sand comingfrom?

19Ohio University

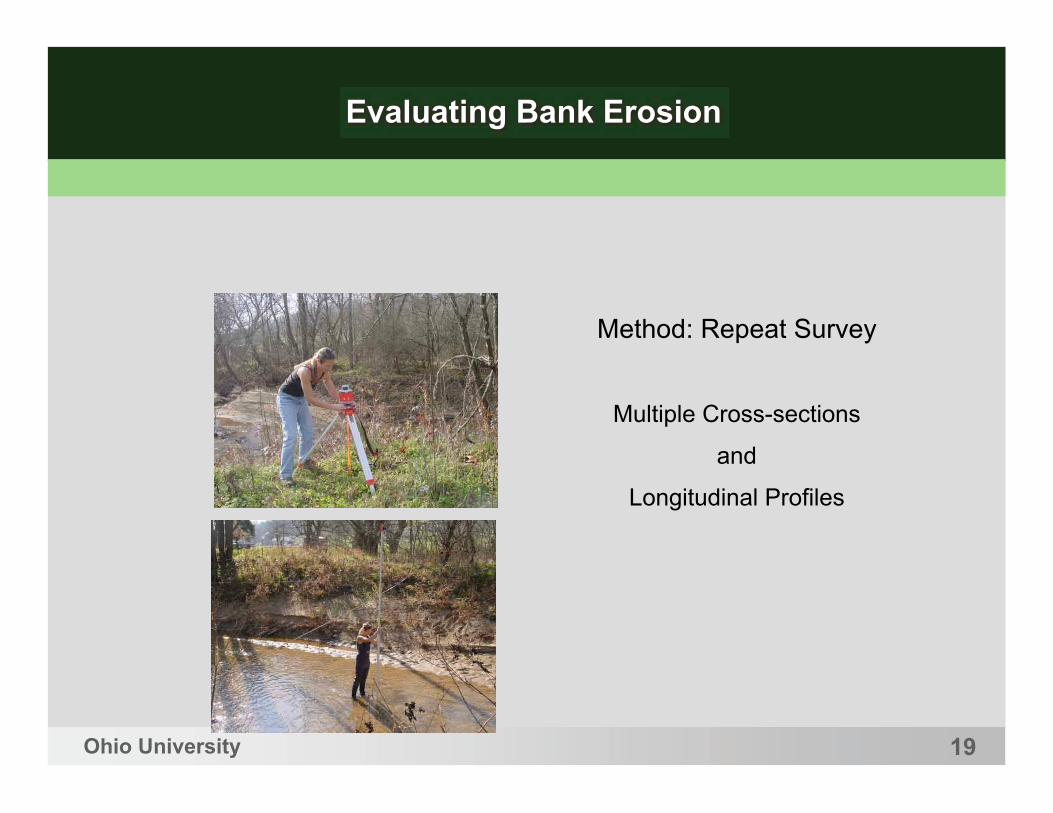
Evaluating Bank Erosion

Method: Repeat Survey

Multiple Cross-sections

and

Longitudinal Profiles

20Ohio University

Study Segments

Main Stem Study SegmentsRail Road Bridge .05Rutland Bridge 1.9 River MiPeterson Bridge 3.1 River MiSoil and Water 4.6 River MiPriddy Bridge 7.0 River MiAdkins 8.2 River Mi

Tributary Study SegmentsCremean 3.6 River MiSide Road 6.65 River MiHarrisonville 9.3 River Mi

21Ohio University

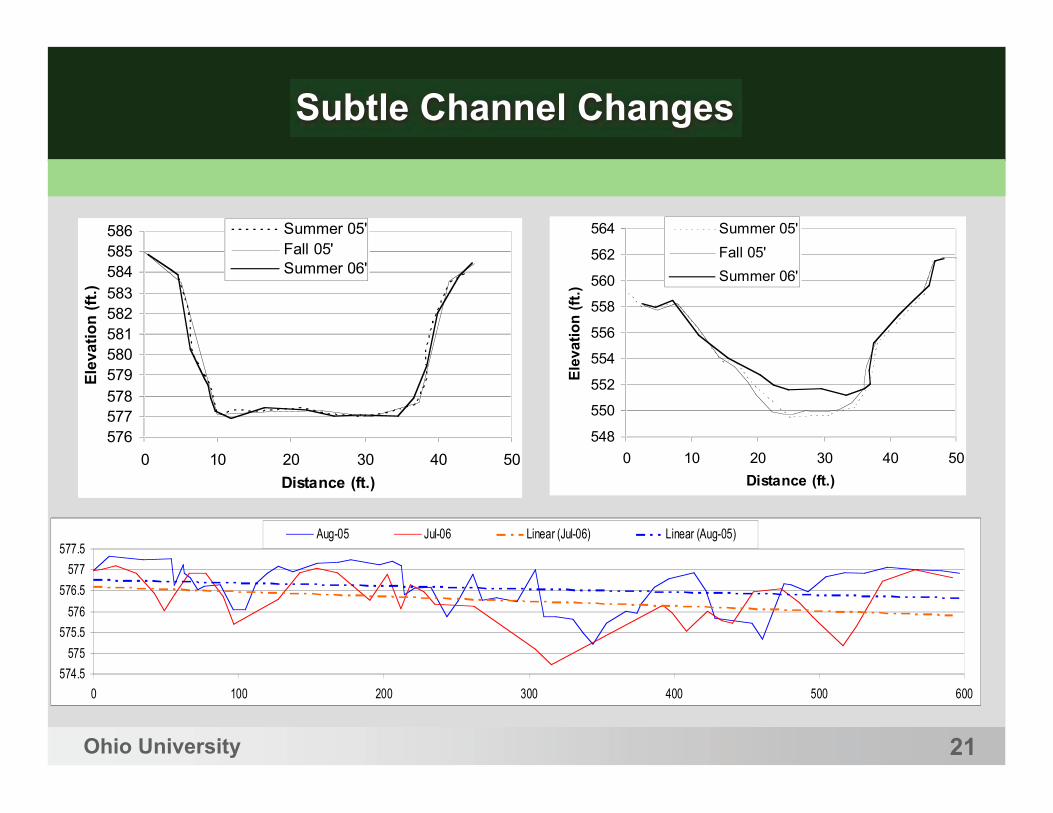
Subtle Channel Changes

576

577

578

579

580

581

582

583

584

585

586

0 10 20 30 40 50

Distance (ft.)

Ele

va

tio

n (

ft.)

Summer 05'

Fall 05'

Summer 06'

548

550

552

554

556

558

560

562

564

0 10 20 30 40 50

Distance (ft.)

Ele

va

tio

n (

ft.)

Summer 05'

Fall 05'

Summer 06'

574.5

575

575.5

576

576.5

577

577.5

0 100 200 300 400 500 600

Aug-05 Jul-06 Linear (Jul-06) Linear (Aug-05)

22Ohio University

Peterson Cross-section

576

577

578

579

580

581

582

583

584

585

586

-20 0 20 40 60

Aug-05 Jul-06 Oct-06

DimensionChange %

Yr 1 Yr 2 Cumulative

Area (Ft2) 3.2 0.8 4.0

Width (Ft) 4.2 1.0 5.3

Dmean (Ft) 0.0 0.0 0.0

Dmax (Ft) 1.4 4.1 5.5

23Ohio University

Bank Erosion Common on Mainstem

• deeply entrenchedchannel

• poorly vegetatedand easily erodablebanks

• in many locationscattle have accessto creek

• bank erosion likelyprimary sedimentsource

24Ohio University

Sediment Origin

• borings to revealdepths of sedimentin floodplain

• presence of largeamounts of coal andorange stainingmay be goodindicators for miningrelated erosion

25Ohio University

Soil Borings

• sets of soil boringswere drilled at twocreek cross-sections

• continuous splitspoon sampling 4-14’

• cores collected inplastic sleeves forextraction andanalysis in lab

26Ohio University

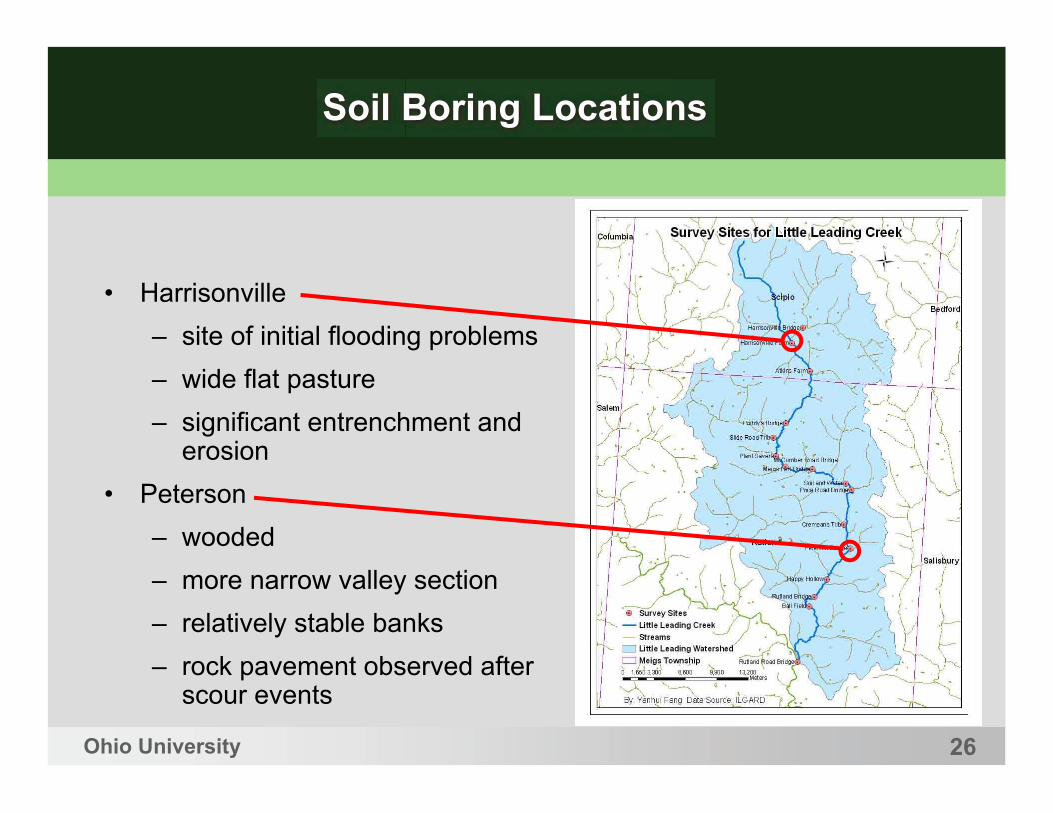
Soil Boring Locations

• Harrisonville– site of initial flooding problems– wide flat pasture– significant entrenchment and

erosion• Peterson

– wooded– more narrow valley section– relatively stable banks– rock pavement observed after

scour events

27Ohio University

Typical Cores

• mostly poorlygraded sandwith betweenclay layers

• coal chips andfines spreadthrough soil

• some layerswith lots of coal

• significantorange stainingoften adjacentto heavy coallayer

28Ohio University

Deeper Cores

• at 6-10 feet mostsoils turned fromtan or brown togrey or black

• occasionally atdepth severalinches ofcarbonized,recentlydeposited leaves,sticks, logs, andgrass present

29Ohio University

Coal?

• coal chips difficult to distinguish from other blackdeposits (particularly when wet)

• need to closely inspect each fragment• coal fines need to be identified with a microscope

slag coal bark basalt

30Ohio University

Harrisonville Stratigraphy

• sand andclay foundup to 14 ftdeep andover 200 ftfromchannel

• old riverbeds foundover 100feet fromchannel

31Ohio University

Coal in Harrisonville Cores

• coal chipsand finesfoundthroughout

• valleyinundatedwithsedimentfrom thestrip miningover 14feet deep

32Ohio University

Peterson Stratigraphy

• sand andclay found upto 10 ft deepand over 100ft fromchannel

• old riverbeds andthick layersof recentlydepositedorganicmatter found

clay found up

and over 100

33Ohio University

Coal in Peterson Cores

• coal foundas deep as12 feet

• no coalfound in orbelowwetlandsediments

• possiblyoriginalfloodplainbeforeinundatedwith sand

34Ohio University

Likely History of Little Leading Creek

• during and after strip mining very large sediment loadsinundated the watershed forming valley plugs

• during this period Little Leading Creek resembled a braidedstream that filled the hollows and valleys with sand and clay

• after AML reclamation, the sediment source was removed andthe channel began to cut downward through the easily erodablematerial

• the result is deeply entrenched banks with persistant sedimentsource to the creek from the valley and floodplain deposits

• low gradient areas act as sediment traps, locking sediments inthe system except during high flow

35Ohio University

Conclusions

• large quantities of sand transported within the systemprimarily as bedload

• uniform sand the dominant deposit

• sand trapped in channel, only leaves the system duringhigh flow events

• major source of sediment currently from bank erosion

• floodplain deposits highly erodable and a direct result ofstrip mining

36

Restoration Recommendations

• limit primary sediment source to thecreek

• stabilize 2.75 miles of the mostdegradable stream banks

– reconnect channel to floodplain

– raparian revegitation

– proper channel design

• coexist with cattle

– exclusion from channel

– drill wells to provide alternatewater source

– established crossings

1. Bank StabilizationFailing Banks River Mile Total

Howard/Clark Property 9.1 through 9.4 0.3

Jewell Property 7.8 through 8.4 0.6

Johnson/Priddy Property 6.9 through 7.0 0.1

Wm Sterns Property 6.3 through 6.9 0.6

Fort Meigs 5.3 through 5.5 0.2

Soil and Water Property 4.8 through 4.95 0.15

Soil and Water Property 4.55 through 4.65 0.1

Colman Property 4.1 through 4.4 0.3

Barrett Property 3.6 through 3.7 0.1

Peterson Property 3.1 through 3.2 0.1

Casto Property 2.5through 2.6 0.1

Rutland BaseBall Fields 1.65 through 1.75 0.1

Total 2.75

37

Restoration Recommendations

• remove existing sediment fromchannel

• during bankfull or greater flow collecttransported sand in a pair of ponds

• will require periodic sand removal

• install downstream of sediment trap

• generate enough velocity to maintainpools

• log vanes, vortex weirs, ...

2. Sediment Trap

primary settlingpond

secondarysettling pond

hard ramp tolimit entry flow

3. Habitat ImprovementStructures

funded by

Ohio Department of NaturalResources, Division of Mineral

Resources Management

and

Meigs County Soil and WaterConservation District

www.ohio.edu/engineering


Recommended