journa l homepage: www.e lsev ier .com/ locate / jpowsour
segmented model for studying water transport in a PEMFC
ong-Song Chen, Huei Peng ∗
epartment of Mechanical Engineering, University of Michigan, 1231 Beal Avenue, Ann Arbor, MI 48109-2121, USA
r t i c l e i n f o
rticle history:eceived 31 May 2008eceived in revised form 2 July 2008ccepted 3 July 2008
a b s t r a c t
Water management plays an important role in the durability and efficiency of a proton exchange mem-brane fuel cell (PEMFC). In this study, a single cell is modeled as a lumped model consisting of 15interconnected segments, which are linked according to the flow field patterns of the anode and cathodebut they are treated as lumped elements individually. Parameters of this model were calibrated based on
vailable online 19 July 2008
eywords:EM fuel cellater managementumidityodel
neutron radiography experimental results obtained at the NIST Center for Neutron Research (NCNR). Themodel can be used to predict distributions of current density, water content in the membrane, relativehumidity (RH) in the flow channels, and water accumulation in the gas diffusion layer (GDL).
Many factors influence the performance of proton exchangeembrane fuel cells (PEMFCs), including membrane material and
hickness, platinum loading, flow field designs, temperature, reac-ant partial pressure, etc. In addition, a critical issue that haseverely limited the application of PEMFCs is its poor reliabilitynder cyclic temperature and humidity operations. An important
actor that influences both the nominal performance and life underransient loading is the water accumulation and distribution in aEMFC. When the fuel cell has too little or too much water, botherformance and reliability suffers. Water accumulation also influ-nces the warm-up and shutdown procedure for PEMFCs that needo work in below-freezing temperature. It is fair to say that inddition to the cost issue, water management is one of the mostmportant remaining issues for the adoption of PEMFCs. Many
odels have been developed over the past several years for theater/humidity behavior inside a PEMFC.
Bernardi and Verbrugge [1,2] developed one of the earlyteady-state, one-dimensional mathematical models. Their modelescribes reactant transport in the GDLs and water transport in a
EMFC. The membrane was assumed to be fully hydrated, which isifferent from practical working conditions of PEMFCs, especiallyor the anode side. Springer et al. [3] empirically related membraneonductivity to water content of the Nafion membrane. Many of
he subsequently developed models used this empirical relation-hip to determine the conductivity of the Nafion membrane, evenor membranes with different thickness. Fuller and Newman [4]eveloped a two-dimensional model to discuss water management,hermal management and fuel utilization in a PEMFC. Gurau et al.5] developed a two-dimensional model, which discussed reactantoncentrations in the through-MEA direction and along the flowhannel direction. Um et al. [6] and Wang et al. [7] developed mod-ls based on computational fluid dynamics (CFD) and solved thequations numerically. Um et al. [8] also extended their work to ahree-dimensional model to study the performance of an interdig-tated flow field design. Their results show that forced convectionf gases through GDL helps to improve performance at high cur-ent densities. None of the models discussed above considered theffect of water accumulation on cell performance.
Starting from around the turn of the century, models thatnclude the water/humidity behavior start to appear in the litera-ure. Baschuk et al. [9] developed a model with the effect of variableegree of water flooding in the cathode catalyst layer and cathodeDL on cell performance. Wang et al. [10] of the Pennsylvania Stateniversity developed a model which handles the situation where
wo-phase flow exists in the cathode. Pasaogullari and Wang [11]pplied the two-phase flow model in the cathode GDL and investi-ated the effect of liquid saturation on cell performance. Wang et al.
10] and Pasaogullari and Wang [11] related capillary pressure withhe Leverett’s function. The two-phase flow model successfullyescribed water vapor distribution and liquid water accumulation
n the GDL and in the flow channel. However, most of these modelsocus on water accumulation in the GDL under the channel and the
1180 Y.-S. Chen, H. Peng / Journal of Power Sources 185 (2008) 1179–1192
Nomenclature
a water vapor activityA area (m2)c concentration (mol m−3)d hydraulic diameter (m)Di–j diffusivity of gas pair i–j in a mixture (m2 s−1)F Faraday’s constant (96485 ◦C equiv.−1)H channel depth (m)i current density (A m−2)I current (A)Kosmotic electro-osmotic drag coefficientKdiff back diffusion coefficient (mol s m−2)Kconv coefficient of convective mass transfer (mol s m−2)L channel length (m)M equivalent weight of a dry membrane (kg mol−1)N molar flow rate (mol s−1)P pressure (Pa)Q gas volume flow rate (m3 s−1)R universal gas constant (8.314 J mol−1 K−1)Rj resistance of component j (�)Sh Sherwood numbert thickness (m)T temperature (K)V voltage (V)W channel or rib width (m)xj molar fraction of species jyO2 percentage of oxygen in the airZ channel number in a segment
Greek letters˛c transfer coefficientε porosity of gas diffusion layerϕ relative humidity� water content� dynamic viscosity (kg m−1 s−1)� density (kg m−3)� electrical conductivity (�−1 m−1) stoichiometry of gas
Subscriptsan anodeact activationavg averagec criticalca cathodecap capillaryc/g channel and gas diffusion layer interfacech channelcontact contactconc concentrationgdl gas diffusion layerg/m gas diffusion layer and membrane interfaceH2 hydrogenH2O waterin inletlimit limitN2 nitrogenohm ohmicout outletO2 oxygenp pore
eveloped formula do not apply readily to the subspace under theib.
Natarajan and Nguyen [12] from the University of Kansas pro-osed a model that included the effect of water accumulation in theDL under the rib and under the channel on cell performance. In
heir model, instead of using the Leverett’s function, they suggestednother empirical equation to describe the capillary pressure. Later,he same group [13,14] further simplified capillary pressure gradi-nt in their models as a constant. Their results showed significantifference with studies using the Leverett’s function. Thus, exper-
mental data that clearly describe water accumulation in the GDL,or both along the flow direction and across the GDL directions needed. Recently, several studies used neutron radiography toetect liquid water distribution in PEMFCs [15–17]. Neutron imageesults showed that significant amount of liquid water could accu-ulate in the GDL under the ribs. Therefore, it is important to
evelop a model that predicts water distribution in GDL under theib as well as under the flow channel.
Because the reactant concentration varies along the flow chan-els, it causes variations in current density, water content, andemperature [18–20]. Therefore, the water generation and distri-ution in a PEMFC are not uniform. In addition, different anode andathode flow field patterns were designed for different applicationsr working conditions [21–23]. Many CFD models have difficultiesimulating PEMFCs with complex flow fields due to requirement ofeavy numerical computation load. Currently published CFD mod-ls simulate the reaction either in a straight flow channel or in aimple flow field. Lumped models [24–26] commonly assume aniform reaction within fuel cells and do not consider the spa-ial distribution of reactants. Therefore, pure CFD models or pureumped models may not be the best modeling choice.
In this study, a steady-state, segmented mathematical modelas developed to describe distributions of liquid water accumula-
ion, current density, and relative humidity (RH) in the flow channelf a PEMFC. This model was calibrated by using neutron radiogra-hy experiments to quantify liquid water in a PEMFC with the sameow field pattern. Water transport in the MEA and the influence ofH of cathode inlet is also discussed in this study.
. Mathematical model
To capture distributed characteristics of a PEMFC, the activerea is divided into 15 segments that are connected according toow fields, as shown in Fig. 1. Each segment is viewed as a small
umped model, i.e. reactant/membrane properties and reaction inach segment are assumed to be uniform. The segments are con-ected together based on the flow direction of the reactants. Sinceach is regarded as a lumped model, it cannot account for the ribffects on gas transport. However, we will introduce semi-empiricalorrelation to describe the rib effects on water accumulation.
The inputs of a segment are the outputs of the preceding seg-ents. For the overall cell, input variables are stoichiometry value,
H, and temperatures of the inflow gas and cell temperature.ccording to the experiment of Wang et al. [27], temperature differ-nce between upper stream and down stream is less than 2 ◦C when
Y.-S. Chen, H. Peng / Journal of Power Sources 185 (2008) 1179–1192 1181
l mode
caao
2345
me
N
N
wcc
r
N
wcm
x
x
wof
P
N
N
Ei
bs
iatf
2
asopqosc
mi
Nan,H2,react =2F
(9)
Nca,O2,react = Iseg
4F(10)
Fig. 1. Schematic of a single cel
ell current density is 0.74 A cm−2. The study of Chen and Peng [28]lso shows uniformly distributed temperature in a single cell; thus,ll segment temperatures are assumed the same and constant asperating temperature. The assumptions are summarized below:
1. The model describes steady-state conditions.. The ideal gas law was employed for gas mixture.. Temperature throughout the single cell is uniformly distributed.. Chemical reaction throughout the segment is uniform.. Rib effects on gas transport and gas transport in the flow chan-
nel direction are neglected. Only gas transport through the MEAdirection is considered in each segment.
Based on the desired cell current and operating conditions, theolar flow rates of inflow hydrogen and oxygen for a single cell are
valuated as
an,H2,in = Icell
2Fan (1)
ca,O2,in = Icell
4Fca (2)
here N is the molar flow rate in mol s−1, an and ca are stoi-hiometry of anode and cathode, respectively, and F is the Faradayonstant.
If air is used as the cathode reactant, the nitrogen molar flowate is calculated from
ca,N2,in = Nca,O2,in1 − yO2
yO2
(3)
here yO2 is the percentage of oxygen in the air. For an operatingondition at selected inlet relative humidity ϕ and pressure P, theolar fraction of inlet vapor can be calculated from
an,v,in = ϕan,inPv,sat
Pan,in(4)
ca,v,in = ϕca,inPv,sat
Pca,in(5)
here Pv,sat is the saturated vapor pressure, which is a functionf working temperature. The value of Pv,sat is calculated from theollowing equation, given in Ref. [3]:
The inlet water molar flow rate can then be calculated from
an,w,in = xan,v,in
1 − xan,v,inNan,H2,in (7)
ca,w,in = xca,v,in
1 − xca,v,in(Nca,O2,in + Nca,N2,in) (8)
qs. (1)–(8) describe required amount of inflow species. After fednto the first segment of a fuel cell, gases flow through each segment
led as several small segments.
ased on the flow fields of anode and cathode to the subsequentegment.
Species flow in each segment is shown in Fig. 2. Each segmenttself consists of six interacting sub-models: cathode flow channel,node flow channel, cathode GDL, anode GDL, membrane hydra-ion, and segment voltage. Theses models will be described in theollowing sections.
.1. Anode/cathode channel model
The channel model describes the reactant behavior inside thenode and cathode of a segment. The model uses the molar con-ervation principle and fluid dynamic properties to calculate theutflow properties and pressure drop along the flow channels. Theressure drop of the gas mixture in the flow channels was fre-uently ignored in earlier models; however, in practice it is onef the key parameters in designing a fuel cell and is related to theelection of the air pump and the calculation of efficiency of a fuelell system.
The segment current, Iseg, is an input based on which the seg-ent model can be simulated. The amount of consumed reactants
n the segment can be determined by
Iseg
Fig. 2. Species transport in a segment of this model.
1 ower
c
N
N
N
N
N
TEm
n[
wA�c
�
Q
wip
�
wflt
Q
ib
P
Tp
P
pa
2
edtt
kompaw
tsctdtht
ocf
∇
wtm[
P
wicM
P
Nwc
2
tS
T
f
x
mG(
182 Y.-S. Chen, H. Peng / Journal of P
The amount of water generation at the cathode catalyst layeran be expressed as
ca,w,gen = Iseg
2F(11)
Then the molar outflow rate can be calculated from
an,H2,out = Nan,H2,in − Nan,H2,react (12)
ca,O2,out = Nca,O2,in − Nca,O2,react (13)
an,w,out = Nan,w,in − Nan,w,gdl (14)
ca,w,out = Nca,w,in − Nca,w,gdl (15)
he water molar flow rates Nan,w,gdl and Nca,w,gdl through GDL inqs. (14) and (15) are calculated by the gas diffusion layer (GDL)odel.The pressure drop due to friction for a continuous, straight chan-
el with length L can be calculated from the following equation29]:
P = 32
∫ L
0
�(y)Q (y)
ZAchd2ch
dy (16)
here the reactant is consumed along the flow channel direction y.s a first-order approximation, we assume that dynamic viscosity(y) and flow rate Q(y) of gas mixtures vary linearly along the flow
hannel:
(y) = �in − y
L(�in − �out) (17)
(y) = Qin − y
L(Qin − Qout) (18)
here �in and �out are the dynamic viscosities of the mixture at thenlet and outlet, respectively, and can be calculated by the mixtureroperties
=∑
i
xi�i (19)
here xi is the molar fraction of species i. Similarly, the mixtureow rates at inlet Qin and outlet Qout can be expressed in terms ofhe ideal gas law:
= RT
P
∑i
Ni (20)
After substituting Eq. (17) and Eq. (18) into Eq. (16), and integrat-ng the equation, the pressure drop along the channel was found toe
in − Pout = 16L
3ZAchd2ch
[Qin(2�in + �out) + Qout(�in + 2�out)] (21)
he outflow pressure can be determined by Eq. (21), and the averageressure in a segment can be calculated by
avg = 12
(Pin + Pout) (22)
From discussion above, molar flow rates of every species andressure at the segment outlet are determined. These propertiesre used as inflow properties for the subsequent segment.
.2. Anode/cathode gas diffusion layer model
Because GDLs are made of porous media, we need to consider theffect of porous media on diffusion of gas mixtures. Each species hasifferent diffusivity, so the molar fraction of species will vary alonghe diffusion path. The purpose of the GDL model is to calculatehe molar fraction at the GDL/membrane interface. Furthermore, by
B
B
Sources 185 (2008) 1179–1192
nowing average pressure, we can determine the partial pressuresf hydrogen (using the anode GDL model) and oxygen (cathode GDLodel) as well as water activity for either. The hydrogen and oxygen
artial pressures are used in the segment voltage model. Waterctivity is used in the membrane hydration model to determineater transport through the membrane.
Water transport from the membrane to the channel via GDL inwo forms: gas and liquid; therefore, we need to consider under-aturated and saturated conditions separately. At under-saturatedonditions, water vapor transport direction depends on the RH inhe channel and at the membrane/GDL interface. At saturated con-ition, water generated in the catalyst layer will transport throughhe GDL in liquid form. The liquid water in the GDL not only inducesigher resistance to gas diffusion but also covers part of the activa-ion sites on the catalyst layer and results in reduced cell voltage.
The Stefan–Maxwell equation is used to describe diffusionf multi-component gas mixtures through the GDL [30]. For n-omponent gas diffusion through a porous medium, the molarraction gradient of species i, is in the form:
xi = RT
n∑j
xiNj − xjNi
PDeffi−j
(23)
here Ni and Nj are molar flux of species i and j. PDeffi−j
is the effec-ive pressure diffusivity product of the mixture i–j in the porous
edium, and it is related to that in a nonporous system PDi–j by31]
Deffi−j = PDi−jε
1.5 (24)
here ε is the porosity of the GDL. The pressure diffusivity PDi–js dependent only on temperature T, and can be estimated fromritical temperature Tc, critical pressure Pc and molecular weight
of components i and j with the following equation [30]:
Di−j = a
(T√TciTcj
)b
(PciPcj)1/3(TciTcj)
5/12
(1
Mi+ 1
Mj
)1/2
(25)
i and Nj in Eq. (23) can be the molar flux of hydrogen, oxygen, orater vapor through the GDL, and are calculated from the segment
urrent and the membrane hydration model.
.2.1. Under-saturated conditionIn the anode GDL, which contains hydrogen and water vapor,
he water vapor molar fraction gradient is expressed by thetefan–Maxwell equation:
dxv,gdl
dz′ = RTseg
Pan,avgDH2−v(xv,gdlNH2,gdl − xH2,gdlNv,gdl) (26)
he direction z′ is defined in Fig. 2.Since the sum of the molar fractions of all species is equal to 1,
or anode we have
v,gdl + xH2,gdl = 1 (27)
In Eq. (26), Nv,gdl is the molar water transport determined by theembrane hydration model, and hydrogen molar flux through theDL is equal to the reacted hydrogen rate and is calculated by Eq.
9). Eq. (26) can be simplified by defining
1 ≡ − RTseg
Pan,avgDv−H2
(NH2,gdl + Nv,gdl), (28)
2 ≡ RTseg
Pan,avgDv−H2
Nv,gdl (29)
ower
m
x
Tfflv
x
i
a
id
P
GTo
N
wt
K
wflS
mS
wr
B
B
E
o
E
�
a
x
x
ics
2
tvft
x
Sc
x
P
ft
o
x
Gtt
Gm
xN2,gdl N2,c/g 5
Y.-S. Chen, H. Peng / Journal of P
Given the boundary condition x = xv,c/g at z′ = 0, the water vaporolar fraction profile in the GDL is
v,gdl(z′) = B2
B1+ exp(−B1z′)
(xv,c/g − B2
B1
)(30)
he above equation describes the distribution of water vapor molarraction across the anode GDL due to water vapor flux and hydrogenux. At the GDL/membrane interface, z′ = tgdl, the value of the waterapor molar fraction is
v,g/m = B2
B1+ exp(−B1tgdl)
(xv,c/g − B2
B1
)(31)
Given the water vapor molar fraction at the GDL/membranenterface, we can calculate water activity at the same location:
an,v,g/m = xv,g/mPan,avg
Pv,sat(32)
The hydrogen partial pressure at the GDL/membrane interfaces an important parameter to calculate segment voltage and it isetermined from
an,H2,g/m = Pan,avg(1 − xv,g/m) (33)
If the RH of gas flow in the channel is different from that at theDL/channel interface, there will be water vapor flux in between.he molar flux of water vapor at the GDL/channel interface dependsn the inflow RH and is obtained from
v,conv = Kconv(xc/g − xin)Aseg,conv (34)
here the convective mass transfer coefficient Kconv is defined byhe Sherwood number.
conv = Sh c Dij dch (35)
here Dij is the diffusivity of species i in the flow gas j. For laminarow and constant surface temperature conditions in a fuel cell, theherwood number Sh is constant and is equal to 3.21 [32].
In the cathode, three species are flowing in the channel and theirolar fraction gradients across the GDL are calculated from the
tefan–Maxwell equation:
dxO2,gdl
dz= RTseg
Pca,avg
(xO2,gdlNv,gdl − xv,gdlNO2,gdl
DO2−v
+ xO2,gdlNN2,gdl − xN2,gdlNO2,gdl
DO2−N2
)(36)
dxv,gdl
dz= RTseg
Pca,avg
(xv,gdlNO2,gdl − xO2,gdlNv,gdl
DO2−v
+ xv,gdlNN2,gdl − xN2,gdlNv,gdl
Dv−N2
)(37)
dxN2,gdl
dz= RTseg
Pca,avg
(xN2,gdlNv,gdl − xv,gdlNN2,gdl
Dv−N2
+ xN2,gdlNO2,gdl − xO2,gdlNN2,gdl
DO2−N2
)(38)
here the direction z is defined in Fig. 2. Since nitrogen does noteact, NN2,gdl = 0. Define
RTseg Nv,gdl RTseg NO2,gdl RTseg NO2,gdl
3 ≡
Pca,avg DO2−v, B4 ≡
Pca,avg DO2−v, B5 ≡
Pca,avg DO2−N2
,
6 ≡ RTseg
Pca,avg
Nv,gdl
Dv−N2
(39)
Ai
x
Sources 185 (2008) 1179–1192 1183
qs. (36) to (38) can then be expressed in the matrix form
ddz
[xO2,gdlxv,gdlxN2,gdl
]=[
B3 −B4 −B5−B3 B4 −B60 0 (B5 + B6)
][xO2,gdlxv,gdlxN2,gdl
](40)
r
dxdz
= B · x (41)
q. (41) can be solved by finding the state transition matrix
(z) = exp(B · z) (42)
nd the boundary condition at z = 0:
(0) =[
xO2,c/gxv,c/gxN2,c/g
](43)
The molar fraction at the GDL/membrane interface is then
(tgdl) = �(tgdl) · x(0) (44)
Once the molar fractions of reactants at the GDL/membranenterface are determined, the partial pressures of reactants can bealculated and used in the segment voltage model to determine theegment voltage.
.2.2. Saturated conditionWhen the anode is saturated, we assume the vapor pressures in
he channel and in the GDL are both equal to the saturated waterapor pressure. The vapor pressure is proportional to the molarraction, so the water vapor molar fraction in the anode GDL is equalo the saturated vapor molar fraction and is constant:
v,gdl(z′) = xv,sat = Pv,sat
Pan,avg(45)
ince the vapor gradient is zero, the hydrogen molar fraction is alsoonstant and is
H2,gdl(z′) = 1 − xv,sat (46)
Hence the hydrogen partial pressure is
H2,g/m = xH2,gdl(z′) Pan,avg (47)
Similarly, when the cathode is saturated, water vapor molarraction is equal to the saturated molar fraction and is constant,herefore:
dxv,gdl
dz= 0 (48)
In addition the sum of molar fractions of all species is equal tone
O2,gdl + xv,gdl + xN2,gdl = 1 (49)
iven that xv,gdl is constant, if we know the nitrogen molar fraction,he oxygen molar fraction can be determined. Then we use Eq. (38)o calculate the nitrogen molar fraction from the linear equation:
dxN2,gdl
dz= B5xN2,gdl (50)
iven the boundary condition, xN2,gdl = xN2,c/g at z = 0, the nitrogenolar fraction in the cathode GDL can be expressed as
(z) = x exp(B z) (51)
t z = tgdl, the molar fraction of nitrogen at the GDL/membranenterface is calculated as
N2,g/m = xN2,c/g exp(B5tgdl) (52)
1184 Y.-S. Chen, H. Peng / Journal of Power
P
fp
D
T
s
o
f
G
g
I
ttttufgidirlrl(
t
wir
c
s
wp
f
N
AtT
wtttao
N
ctpal
mct
2
mftftf
N
ws
K
w
�
c
a
Fig. 3. Schematic of liquid water accumulation in the GDL.
The partial pressure of oxygen at the same interface is then
ca,O2,g/m = Pca,avg(1 − xv,sat − xN2,g/m) (53)
The presence of liquid water in the GDL will influence the dif-usivity of gas. The effective diffusivity Deff
iis dependent on the
orosity ε and saturation s by
effi = Dif (ε)g(s) (54)
he saturation s is the ratio of liquid water volume to pore volume
= Vw
Vp(55)
Earlier studies [5,10,15,33–35] suggest the influence of porosityn diffusivity to be approximated by a polynomial relationship:
(ε) = ε1.5 (56)
The presence of liquid water reduces the diffusion area in theDL and its effect is commonly modeled by a polynomial function
(s) = (1 − s)m (57)
n this study m = 2 is used according to Nam and Kavinay [36].It is clear that liquid water accumulation is an important factor
hat influences diffusivities of gas and cell performance. From neu-ron radiography experiments [15–17], water could accumulate inhe GDL under the rib. Thus, we propose a hypothesis that due tohe gas flow in the channels, liquid water tends to move to the GDLnder the rib and accumulates close to the graphite plate/GDL inter-
ace. When the GDL cannot hold any more water, additional waterenerated at the membrane will push part of the water under the ribnto the channel, as depicted in Fig. 3 [28]. In Ref. [28], a method toifferentiate liquid water between anode and cathode in the GDL
s developed based on neutron experimental data. From the testesults, we observed a maximum water thickness tw,max accumu-ated in the cathode GDL under the rib. In addition, large gas flowate in the channel is also a factor that influences water accumu-ation in the GDL under the rib. Thus, the average water thicknesstca,gdl,rib) in the GDL under the rib in a segment is approximated by
ca,gdl,rib = tw,max
(1 − exp
(˛Nca,w,gdl,rib
(Nca,gas,ch)�
))(58)
here tw,max is the maximum water thickness that accumulatesn the GDL under the rib. This value was determined by neutronadiography experiments [28], which is approximately 50 �m.
The average liquid saturation in the GDL under the rib can bealculated from
ca,gdl,rib = tca,gdl,rib Aseg
tgdl Aseg ε= tca,gdl,rib
tgdl ε(59)
I
N
Sources 185 (2008) 1179–1192
here tgdl is the GDL thickness, A is the segment area, and ε is theorosity of GDL.
The liquid saturation in the GDL under the channel is calculatedrom Refs. [11,36]:
ca,w,gdl,ch = −�wKKrw
Mw�w
(dPcap
ds
)ds
dz(60)
t steady-state, Nca,w,gdl,ch is equal to the net water flux from anodeo cathode and is determined by the membrane hydration model.hen saturation s can be obtained by solving Eq. (60).
In this model, we need to determine the amount of liquidater transport through the GDL under the channel Nca,w,gdl,ch and
hrough the GDL under the rib Nca,w,gdl,rib. We assume the waterransport through the GDL under the channel is inversely propor-ional to the gas flow rate in the channel, which is similar to ournalysis of water accumulation in the GDL under the channel inur former study; i.e. Cgc = ˛/Nca [28].
ca,w,gdl,ch = ˇ
Nca,react,ch(61)
Once we determine the water transport in the GDL under thehannel, we can calculate the distribution of liquid saturation inhe GDL by using Eq. (60). To simplify the problem, the capillaryressure gradient with respect to liquid saturation in Eq. (60) isssumed to be constant and equal to 22.95 N m−2 [35]. Then theiquid saturation in the catalyst layer can be obtained.
˛, ˇ, and � in Eqs. (58) and (61) are calibrated based on experi-ental results. We calculate liquid saturations in the GDL under the
hannel and under the rib separately. The average value betweenhese two variables is then used in the segment voltage model.
.3. Membrane hydration model
The water transport within membranes is represented by theembrane hydration model shown in Fig. 2. There are three causes
or water flux in the membrane: electro-osmotic drag from anodeo cathode; back diffusion due to the concentration potential dif-erence between the anode and cathode; and water generation athe cathode catalyst layer. These three factors are explained in theollowing.
The electro-osmotic drag is defined as
w,osmotic = KosmoticIseg
F(62)
here Kosmotic is the osmotic drag coefficient [3,37–40]. In thistudy, we use Springer’s result [3]:
osmotic = 2.5�pem
22(63)
The water content in the membrane �pem, is calculated from theater activity of membrane apem:
pem=0.043+17.81apem−39.85a2pem+36.0a3
pem, 0 < apem ≤ 1
(64)
The average water activity of anode and cathode is used to cal-ulate the water content in the membrane:
pem = aan + aca
2(65)
n Eq. (65), aan and aca are the RH of anode and cathode.The water transport by back diffusion is expressed as
w,diff = Kdiffcw,ca − cw,an
tpem(66)
Y.-S. Chen, H. Peng / Journal of Power Sources 185 (2008) 1179–1192 1185
odels
wic
c
c
wa
�
�
o
K
w
K
be
N
w
N
wccam
2
a
Fig. 4. Connection of six sub-m
here cw is the water concentration of the membrane as definedn Fuller’s study [4], and tpem is the membrane thickness. Wateroncentration is calculated as
w,an = �pem
Mpem�an (67)
w,ca = �pem
Mpem�ca (68)
here �an and �ca are calculated from the water activity in anodend cathode:
an = 0.043 + 17.81aan − 39.85a2an + 36.0a3
an, 0 < aan ≤ 1 (69)
ca = 0.043 + 17.81aca − 39.85a2ca + 36.0a3
ca, 0 < aca ≤ 1 (70)
In Eq. (66), Kdiff is the back diffusion coefficient and is a functionf temperature and water content in the membrane [3,41]:
1 The value 1.167 is used instead of 1.67. If 1.67 is used in this equation, there wille a “discontinuity” when calculating K� at �pem=4.5 by using the 3rd and the 4thquations.
am
V
wac
in the SIMULINK environment.
The net water flux through the anode GDL is
an,w,gdl = Nw,diff − Nw,osmotic (73)
hereas that through the cathode GDL is
ca,w,gdl = Nw,osmotic − Nw,diff + Iseg
2F(74)
here the last term of Eq. (74) is the water generation at the cathodeatalyst layer. The water content is used to calculate the membraneonductivity in the segment voltage model, and water fluxes innode and cathode are used in the GDL models and the flow channelodels.
.4. Segment voltage model
The segment voltage model calculates voltage of each segmentt specific current according to the partial pressures of hydrogennd oxygen, membrane water content, and temperature. The seg-ent voltage can be expressed as
seg = Vrev − Vact − Vohm − Vconc (75)
here Vrev, Vact, Vohm and Vconc are the theoretical reversible volt-ge, the activation overpotential, the ohmic overpotential, and theoncentration overpotential, respectively.
1 ower Sources 185 (2008) 1179–1192
Tc
tais
V
w
s
V
wtrp
R
ltri
R
wtf
�
wi
tcmbsat
V
wt
iare
cb
2
msecally not uniform throughout the active area of the cell. The cellvoltage is determined iteratively by the process shown in Fig. 5. Atthe beginning, we guess an inlet gas pressure Pin and a cell currentIcell. The initial guess for segment currents Iseg,i, is set to be one 15th
Table 1Specification of the single cell used in this study
Parameter Value
Cell active area (Acell) 100 cm2
Channel depth (Hch) 1 mmChannel width (Wch) 1.6 mmRib width (Wrib) 1.7 mmAnode channel number in a segment (Zan) 6Cathode channel number in a segment (Zca) 10Anode channel length in a segment (Lan) 3.33 cmCathode channel length in a segment (L ) 2 cm
186 Y.-S. Chen, H. Peng / Journal of P
The theoretical reversible voltage is calculated from Ref. [42]:
Vrev = −G
2F
= −G0
2F+ RTseg
2Fln
(PH2 P0.5
O2
PH2O
)
= 1.229 − 0.85 × 10⁻³(Tseg − 298.15)
+ 4.3085 × 10⁻⁵Tseg
[ln(Pan,H2,g/m) + 1
2ln(Pca,O2,g/m)
](76)
he partial pressures of hydrogen Pan,H2,g/m and oxygen Pca,O2,g/mome from the anode/cathode GDL models.
The activation overpotential arises from the kinetic reaction athe anode and cathode. Due to slower kinetics of oxygen reductiont the cathode side, the voltage drop due to activation overpotentials dominated by the cathode. The overpotential is modified from thetudy in Ref. [25] as
act = 0.2 + 0.1[1 − exp(−20iseg)] (77)
here iseg is the current density of a segment.The ohmic overpotential is due to the internal resistance of a
egment and is expressed as
ohm = IsegRseg (78)
here Iseg is the segment current. The resistance of the segment ishe sum of all components through which current flows and contactesistance. These components are membrane, GDLs, and flow fieldlates:
seg = Rpem + Rgdl + Rplate + Rcontact (79)
The conductivities of GDL and graphite plates are typically mucharger than that of the membrane, so it is not necessary to considerheir resistances. Thus only the membrane resistance and contactesistance are considered in this model. The membrane resistances obtained from
pem = tpem
�pemAseg(80)
here the membrane conductivity �pem is a function of tempera-ure and water content in the membrane, and is expressed in theorm [3]:
pem = (b11�pem − b12)exp
[b13
(1
303− 1
Tseg
)](81)
here b11, b12, and b13 are empirically determined from our exper-mental results.
Concentration overpotential results from the change in concen-ration of the reactants as they are consumed in the reaction. Theoncentration overpotential derived from the Nernst equation isodified from Ref. [43]. In addition, the flooding effect should also
e considered, which reduces the activation area of the catalyst,o the maximum current density is reduced when liquid waterppears in the catalyst layer. The modified concentration overpo-ential is expressed as
conc = b21ib22seg ln
(1 − iseg
ilimit(1 − s)
)(82)
here b21 and b22 are coefficients to be determined by experimen-al data.
In the above calculations, the current density in each segments assumed to be known and the same. However, the cell voltage ofll segments should be the same, and the difference in humidity,eactant pressure, etc. resulted in different current density. Afterach segment voltage model calculates its voltage, actual segment
GGDDD
Fig. 5. Flow diagram of solving cell voltage.
urrent can be corrected by enforcing all the segment voltages toe the same.
.5. Cell voltage calculation
The models presented in the previous sub-sections are imple-ented in the SIMULINK environment. The block diagrams of six
ub-models of a segment are shown in Fig. 4. Given the inflow prop-rties and (initial guess of) segment current, the segment modelalculates the segment voltage. Since the current density is actu-
ca
DL thickness (tgdl) 184 �mDL porosity (ε) 0.725ry membrane thickness (tpem) 25 �mry membrane density (�pem) 2000 kg m−3
ry membrane equivalent weight (Mpem) 1.1 kg mol−1
Y.-S. Chen, H. Peng / Journal of Power Sources 185 (2008) 1179–1192 1187
Table 2Parameter values that obtained from literature
Parameter Value
Absolute permeability of GDL(K)
1 × 10⁻⁸ m−2 [11]
Relative permeability of GDL(Krw)
S [12]
Dynamic viscosity of hydrogen(�H2 )
9.5493 × 10⁻⁶ N s m−2 [29]
Dynamic viscosity of oxygen(�O2 )
2.2379 × 10⁻⁵ N s m−2 [29]
Dynamic viscosity of nitrogen(�N2 )
1.9260 × 10⁻⁵ N s m−2 [29]
Dynamic viscosity of watervapor (�v)
4.6657 × 10⁻⁴ N s m−2 [29]
Pressure-diffusivity product ofwater vapor and hydrogenpair (PDH2−v)
16.6801 Pa m2 s−1 [30]
Pressure-diffusivity product ofwater vapor and oxygen pair(PDO2−v)
3.2890 Pa m2 s−1 [30]
Pressure-diffusivity product ofwater vapor and nitrogenpair (PDv−N2 )
3.4400 Pa m2 s−1 [30]
Pressure-diffusivity product ofoxygen and nitrogen pair(PDO2−N2 )
2.5504 Pa m2 s−1 [30]
Diffusivity of water vapor in 9.3940 × 10⁻³ m2 s−1 [30]
D
ot
vnfritcct
2
efTll
m
TP
P
R˛ˇ�bbbbbi
Fo
irItbibaI
3
twpfcpfc
Tbi
hydrogen (Dv−H2 )iffusivity of water vapor in air(Dv-air)
2.6560 × 10⁻³ m2 s−1 [30]
f the cell current, Icell. The segment voltage Vseg,i is determined byhe segment model described in the previous section.
If the difference between the maximum and minimum segmentoltages is not within an acceptable range, the segment currentseed to be corrected. Based on the typical polarization curve of a
uel cell, the segment with higher voltage should increase its cur-ent, and that with lower voltage should decrease its current. Toncrease the iteration speed, the increase in segment current is seto be proportional to the voltage difference while keeping the cellurrent constant. In addition, the inlet pressures of the anode andathode are also adjusted to keep the outlet pressure the same ashe ambient pressure.
.6. Tuning parameters
We designed a single cell and conducted neutron radiographyxperiments to adjust water related parameters in this model. Theuel cell specification and corresponding parameters are listed inable 1. Those parameter values obtained from the literature are
isted in Table 2. The parameters that are adjusted in this paper areisted in Table 3.
In the ohmic overpotential region, membrane conductivity isainly affected by water content in the membrane, as shown
able 3arameters that tuned based on experimental data
ig. 6. Comparison of experimental results and modeling results for different cath-de inlet RH.
n Eq. (81). Thus, b11, b12, and b13 in Eq. (81) and the contactesistance Rcontact in Eq. (79) were tuned to match the calculated–V curve to with experimental data in the ohmic overpoten-ial region. ˛ and � in Eq. (58) and ˇ in Eq. (61) were adjustedased on water thickness obtained by neutron radiography exper-
ments. Once ˛, ˇ, and � were determined, liquid saturation cane determined. Subsequently, b21, b22, and ilimit in Eq. (82) aredjusted according to the concentration overpotential region of–V curve.
. Results and discussions
In practical applications, due to space and cost considera-ions, it is common to humidify only the cathode reactant. Thus,e will focus on the influence of RH of cathode inlet on cellerformance and water transport. Fig. 6 compares the cell per-ormance curves obtained by this model and by experiments. Theell operating at low cathode inlet RH of 50% shows lower cellerformance. This is because the under-saturated air takes waterrom the membrane, resulting in low membrane hydration andonductivity.
In this study, each segment is regarded as a lumped model.hus, at the end of iteration procedure, only average values wille obtained. For visual aids, colorful pictures are created through
nterpolation and extrapolation of these values, which are markedt the center of each segment.
.1. Distribution of current density and water content in theembrane
Membrane dehydration increases ohmic overpotential, andould even cause irreversible damage to the membrane. Sincehe membrane conductivity dominates (conductivity of mem-rane: ∼2.75 �−1 m−1; GDL: ∼1250 �−1 m−1; graphite plate:
able 4ist of selected operating conditions
Case 1 Case 2 Case 3 Case 4
node/cathode inlet RH (%) 0/100 0/50 0/100 0/50node/cathode stoichiometry value 1.2/3 1.2/3 1.2/3 1.2/3node/cathode outlet pressure (atm) 1/1 1/1 1/1 1/1ell current density (A cm−2) 0.7 0.6 0.1 0.1ell temperature (◦C) 70 70 70 70
1188 Y.-S. Chen, H. Peng / Journal of Power Sources 185 (2008) 1179–1192
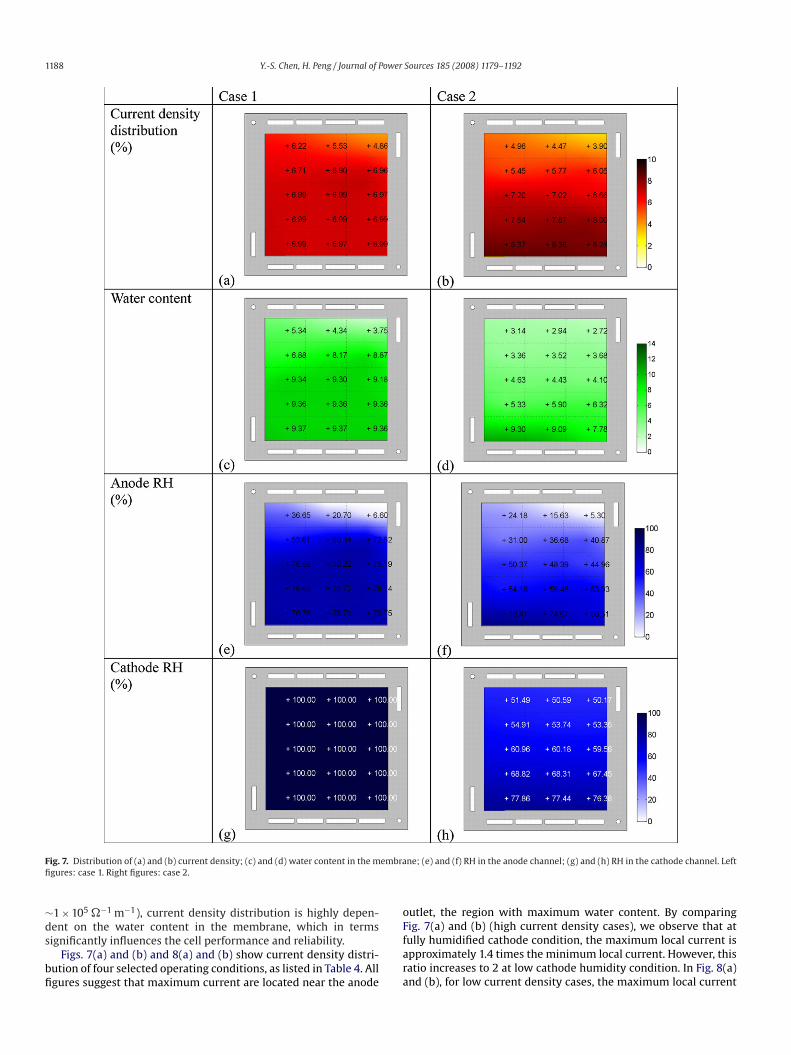
F embrafi
∼ds
bfi
o
ig. 7. Distribution of (a) and (b) current density; (c) and (d) water content in the mgures: case 1. Right figures: case 2.
1 × 10⁵ �−1 m−1), current density distribution is highly depen-
ent on the water content in the membrane, which in termsignificantly influences the cell performance and reliability.
Figs. 7(a) and (b) and 8(a) and (b) show current density distri-ution of four selected operating conditions, as listed in Table 4. Allgures suggest that maximum current are located near the anode
Ffara
ne; (e) and (f) RH in the anode channel; (g) and (h) RH in the cathode channel. Left
utlet, the region with maximum water content. By comparing
ig. 7(a) and (b) (high current density cases), we observe that atully humidified cathode condition, the maximum local current ispproximately 1.4 times the minimum local current. However, thisatio increases to 2 at low cathode humidity condition. In Fig. 8(a)nd (b), for low current density cases, the maximum local current
Y.-S. Chen, H. Peng / Journal of Power Sources 185 (2008) 1179–1192 1189
F embrafi
igow
d
c
ig. 8. Distribution of (a) and (b) current density; (c) and (d) water content in the mgures: case 3. Right figures: case 4.
s 1.5 and 1.6 times of the minimum, respectively. The result sug-
ests that at low current density, cathode inlet RH has less influencen current density distribution. Low cathode humidity causes lowater content, as shown in Fig. 8(d).
A few methods to measure current density distribution wereeveloped in the literature [44–47]. For example, divided current
aiido
ne; (e) and (f) RH in the anode channel; (g) and (h) RH in the cathode channel. Left
ollectors can be used to measure local current flow. Yoshioka et
l. [44] compared the distribution of current densities at differentnlet gas RH levels. Their results show that the region close to airnlet has lower current density. The trend is more significant withry inlet air. Liu et al. [45] measured current density distributionf a fuel cell with one serpentine flow channel. Their findings are
1190 Y.-S. Chen, H. Peng / Journal of Power Sources 185 (2008) 1179–1192
ss the
tcoohrw
3t
Fig. 9. Quantity of water transport (mol s−1) acro
he same as [44] qualitatively, except that with fully humidified air,urrent density of the area near outlet is lower due to flooding. In
ur study, the effect of flooding on reducing current density nearutlet is not obvious. A possible reason is that anode reactant is notumidified so the excess water transports to the anode. Anothereason is that we use straight parallel cathode channels so liquidater is quickly removed from channels.
tdc
MEA. (a) Case 1; (b) case 2; (c) case 3; (d) case 4.
.2. Distribution of RH in the flow channel and water transport inhe MEA
Figs. 7(e) and (f) and 8(e) and (f) show the RH distribution inhe anode flow channel. For all cases, RH increases along the flowirection because dry hydrogen gradually uptakes water vapor thatomes from the cathode by back diffusion. Fig. 9 compares water
Y.-S. Chen, H. Peng / Journal of Power Sources 185 (2008) 1179–1192 1191
F liquido ) distr( et RH =
toaAtsdtftagvt
maici
ci
nrdwctmt
3
blutfla
ig. 10. Comparison of modeling results and experimental data. (a) Distribution off liquid saturation in the GDL under the channel when cathode inlet RH = 100%; (cd) distribution of liquid saturation in the GDL under the channel when cathode inl
ransport through the membrane and through both anode and cath-de GDLs. The magnitude indicates the quantity of water transportnd positive represents the direction from the anode to the cathode.t high current density, water transport from the anode channel to
he membrane through the anode GDL was observed in the down-tream segments, as shown in Fig. 9(a) and (b). The high currentensity in those segments results in high electro-osmotic drag fromhe anode to the cathode, which is stronger than the back diffusionrom the cathode to the anode; hence, water in the anode reac-ant supplies for the difference. However, as shown in Fig. 7(a), thenode RH does not decrease along flow channel. Because of hydro-en consumption along flow channel, the molar fraction of waterapor increases along flow channel. That also explains why RH inhe anode downstream segments barely increased.
Fig. 9(c) and (d) shows that the electro-osmotic drag of the seg-ents near outlet in case 3 is significantly higher than that in case 4,
lthough current densities of both cases are quite similar, as shownn Fig. 8(a) and (b). According to Eq. (63), the electro-osmotic drag
oefficient is a function of water content. Thus, high water contentn the membrane is attributed to humidified cathode reactant.
Figs. 7(g) and 8(g) show fully saturated reactant in the cathodehannel throughout the active area. Since cathode inlet reactants fully humidified, the generated water transports to the chan-
circ(
saturation in the GDL under the rib when cathode inlet RH = 100%; (b) distributionibution of liquid saturation in the GDL under the rib when cathode inlet RH = 50%;50%.
el in liquid form. In the cases of under-saturated cathode inleteactant, the cathode RH gradually increases along the gas flowirection, as shown in Figs. 7(h) and 8(h). The increase is due toater generation and also oxygen consumption along the flow
hannel, resulting in increased molar fraction of water vapor. Waterransports through GDLs influences diffusivities of reactant and
ay also form liquid water in the GDL, which increases concen-ration overpotential.
.3. Distribution of water accumulation
Cathode liquid saturation in the GDL affects cell performanceecause liquid water may cover the reaction sites in the catalyst
ayer or block the pathway of gas flow through the GDL. The liq-id saturation in the cathode GDL is affected by many factors: cellemperature, permeability and hydrophobicity of GDL, net waterux through the GDL, and cathode flow RH. In this model, temper-ture, permeability and hydrophobicity of GDL are assumed to be
onstant. Under-saturated condition, net water flux through GDLs determined by operating current density. Higher current densityesults in higher electro-osmotic drag and water generation, whichauses higher net water flux through GDL, as shown in Fig. 9(a) andb).
1 ower
ostfnitlsFwwb
4
sadacuitt
icmcfiTa
slceip
puMnd
lcod
A
Na
fs
R
[[[[[[
[
[
[
[
[[[[
[
[
[[[
[
[
[
[[[[[[[
[[
[
[[
[
[
[
192 Y.-S. Chen, H. Peng / Journal of P
Fig. 10 compares average liquid saturation in the cathode GDLf modeling results and experimental data. The 15 subplots corre-pond to 15 segments of the active area. Fig. 10(a) and (c) suggestshat liquid water accumulate in the GDL under the rib. Resultsrom other neutron radiography experiments also show this phe-omenon [48,49]. Slight liquid saturation in the GDL under the rib
s observed at the segment near cathode inlet and increases towardhe outlet. Maximum liquid saturation is approximately 0.4. Theow water accumulation in the cathode GDL at high current den-ity is likely due to the high gas flow rate at high current density.ig. 10(c) shows some liquid saturation in the GDL under the ribhen cathode inlet RH is 50%. However, there is almost no liquidater in the GDL under the channel, as shown in Fig. 10(d). This isecause the gas flow in the flow channel is under-saturated.
. Conclusions
In this study a segmented fuel cell model was developed. Eachegment is viewed as a lumped model, which consists of six inter-cting sub-models, and is connected based on the reactant flowirections. This model is calibrated based on experimental resultsnd is able to describe liquid water saturation in the GDL under thehannel and in the GDL under the rib. The calibrated model wassed to investigate distributions of current density, water content
n the membrane, RH in the anode/cathode, and water accumula-ion in the GDL under the channel/rib as well as water transport inhe MEA.
Modeling results show that cathode inlet RH has significantnfluence on the uniformity of water content in the membrane andurrent density. At low cathode inlet humidity and high load, theaximum local current density is twice that of the minimum local
urrent density. Cathode humidity has less influence on the uni-ormity of current density at low current load. In this study, thenfluence of water accumulation on current density is not obvious.hat could be due to un-humidified hydrogen, short flow channels,nd operating current density.
Water transport mechanisms across the MEA were demon-trated in this study. The amount of water transport in differentocation was predicted by this segmented model. The results showurrent density and the amount of water transport influence withach other. This result also provides useful information in plac-ng the inlet/oulet of anode/cathode when we design flow fieldatterns.
A model describing water accumulation in the GDL was pro-osed in this study. Liquid water tends to accumulate in the GDLnder the rib due to the suppression of gas flow in the channel.aximum liquid saturation in the GDL under the rib is observed
ear the outlet and the value is approximately 0.4 in this flow fieldesign.
This study investigated the water content in the membrane andiquid water accumulation in the GDL for a specific designed singleell. For the future study, the concept of modeling will be appliedn different flow field designs to study the influence of flow fieldesign on water distribution in a fuel cell.
cknowledgements
The authors would like to acknowledge the support fromational Science Foundation (NSF0408664) for this study. Theuthors also would like to express their gratitude to the NIST Center
[
[
[
Sources 185 (2008) 1179–1192
or Neutron Research where neutron radiography and fuel cell testtation were supported for experiments.
eferences
[1] D.M. Bernardi, M.W. Verbrugge, AIChE J. 37 (1991) 1151–1163.[2] D.M. Bernardi, M.W. Verbrugge, J. Electrochem. Soc. 139 (1992) 2477–2491.[3] T.E. Springer, T.A. Zawodzinski, S. Gottesfeld, J. Electrochem. Soc. 138 (1991)
2334–2342.[4] T.F. Fuller, J. Newman, J. Electrochem. Soc. 140 (1993) 1218–1225.[5] V. Gurau, H. Liu, S. Kakac, AIChE J. 44 (1998) 2410–2422.[6] S. Um, C.Y. Wang, K.S. Chen, J. Electrochem. Soc. 147 (2000) 4485–4493.[7] C.Y. Wang, W.B. Gu, B.Y. Liaw, J. Electrochem. Soc. 145 (1998) 3407–3417.[8] S. Um, C.Y. Wang, K.S. Chen, J. Power Sources 125 (2004) 40–51.[9] J.J. Baschuk, X. Li, J. Power Sources 86 (2000) 181–196.10] Z.H. Wang, C.Y. Wang, K.S. Chen, J. Power Sources 94 (2001) 40–50.11] U. Pasaogullari, C.Y. Wang, J. Electrochem. Soc. 151 (2004) A399–A406.12] D. Natarajan, T.V. Nguyen, J. Electrochem. Soc. 148 (2001) A1324–A1335.13] D. Natarajan, T.V. Nguyen, J. Power Sources 115 (2003) 66–80.14] G. Lin, T.V. Nguyen, J. Electrochem. Soc. 153 (2006) A372–A382.15] A. Turhan, K. Heller, J.S. Brenizer, M.M. Mench, J. Power Sources 160 (2006)
1195–1203.16] J. Zhang, D. Kramer, R. Shimoi, Y. Ono, E. Lehmann, A. Wokaun, K. Shinohara,
G.G. Scherer, Electrochim. Acta 51 (2006) 2715–2727.17] Y.-S. Chen, H. Peng, D.S. Hussey, D.L. Jacobson, D.T. Tran, T. Abdel-Baset, M.
Biernacki, J. Power Sources 170 (2007) 376–386.18] S. Maharudrayya, S. Jayanti, A.P. Deshpande, J. Power Sources 157 (2006)
358–367.19] S. Shimpalee, S. Greenway, J.W. Van Zee, J. Power Sources 160 (2006)
398–406.20] X. Liu, H. Guo, F. Ye, C.F. Ma, Electrochim. Acta 52 (2007) 3607–3614.21] US Patent: 5,981,098 (1999).22] US Patent: 6,893,708B2 (2005).23] W. Ying, T.-H. Yang, W.-Y. Lee, J. Ke, C.-S. Kim, J. Power Sources 145 (2005)
572–581.24] J.C. Amphlett, R.F. Mann, B.A. Peppley, P.R. Roberge, A. Rodrigues, J. Power
Sources 61 (1996) 183–188.25] J.T. Pukrushpan, A.G. Stefanopoulou, H. Peng, IEEE Control Syst. Magazine 24
(2004) 30–46.26] Y. Shan, S.Y. Choe, J. Power Sources 145 (2005) 30–39.27] M. Wang, H. Guo, C. Ma, J. Power Sources 157 (2006) 181–187.28] Y.-S. Chen, H. Peng, ASME, The Fifth International Conference on Fuel Cell Sci-
ence, Engineering and Technology, 2007.29] R.W. Fox, A.T. McDonald, Introduction to Fluid Mechanics, John Wiley & Sons,
Inc., New York, USA, 1994.30] J. Benitez, Principles and Modern Applications of Mass Transfer Operations,
John Wiley & Sons, Inc., New York, USA, 2002.31] T.E. Springer, M.S. Wilson, S. Gottesfeld, J. Electrochem. Soc. 140 (1993)
3513–3526.32] Rohsenow, Handbook of Heat Transfer, 3rd, McGraw-Hill, New York, 1998.33] J.S. Yi, T.V. Nguyen, J. Electrochem. Soc. 146 (1999) 38–45.34] W.H. He, J.S. Yi, T.V. Nguyen, AIChE J. 46 (2000) 2053–2064.35] G. Lin, W. He, T.V. Nguyen, J. Electrochem. Soc. 151 (2004) A1999–A2006.36] J.H. Nam, M. Kavinay, Int. J. Heat Mass Transfer 46 (2003) 4595–4661.37] T.F. Fuller, J. Newman, J. Electrochem. Soc. 139 (1992) 1332–1339.38] Th.A. Zawodzinski, S. Radzinski, R.J. Sherman, V.T. Smith, T.E. Springer, S. Gottes-
feld, J. Electrochem. Soc. 140 (1993) 1041–1047.39] G. Xie, T. Okada, J. Electrochem. Soc. 142 (1995) 3057–3062.40] T.A. Zawodzinski, J. Davey, J. Valerio, S. Gottesfeld, Electrochim. Acta 40 (1995)
297–302.41] S. Dutta, S. Shimpalee, J.W. Van Zee, Int. J. Heat Mass Transfer 44 (2001)
2029–2042.42] J. Larminie, A. Dicks, Fuel Cell Systems Explained, Wiley, 2003.43] G. Squadrito, G. Maggio, E. Passalacqua, F. Lufrano, A. Patti, J. Appl. Electrochem.
29 (1999) 1449–1455.44] S. Yoshioka, A. Yoshimura, H. Fukumoto, O. Hiroi, H. Yoshiyasu, J. Power Sources
144 (2005) 146–151.45] Z. Liu, Z. Mao, B. Wu, L. Wang, V.M. Schmidt, J. Power Sources 141 (2005)
205–210.46] P.C. Ghosh, T. Wüster, H. Dohle, N. Kimiaie, J. Mergel, D. Stolten, J. Power Sources
154 (2006) 184–191.
47] N. Rajalakshmi, M. Raja, K.S. Dhathathreyan, J. Power Sources 112 (2002)
331–336.48] R. Mukundan, J.R. Davey, T. Rockward, J.S. Spendelow, B.S. Pivovar, D.S. Hussey,
D.L. Jacobson, M. Arif, R.L. Borup, ECS Trans. 11 (2007) 411–422.49] A. Turhan, K. Heller, J.S. Brenizer, M.M. Mench, J. Power Sources 180 (2008)