Abstract In last decades, Bioinformatics has become an emerging field of science with awide variety of applications in many research areas. The primary goal of bioinformatics is todetect useful biological knowledge hidden under the large volumes of DNA/RNA sequencesand structures, literature and other biological and biomedical data, to gain a greater insightinto their relationships and, therefore, to enhance the discovery and the comprehension ofbiological processes. In order to fully exploit the new opportunities that emerge, novel dataand text mining techniques have to be developed to effectively address the fundamentalbiological issue of managing and uncovering meaningful patterns and correlations fromthese large biological and biomedical data repositories. In this work, we propose an effectivedata mining technique for analysing biological and biomedical data. The proposed miningprocess is efficient enough to be applied to various types of biological and biomedical data. Toprove the concept, we experiment with applying the data mining technique into two distinctareas, including biomedical text documents and data. In addition, based on the proposed
Author names appear in alphabetical order.
Z.-M. Ioannou · C. MakrisDepartment of Computer Engineering and Informatics, Faculty of Engineering, University of Patras,Patras, Greecee-mail: [email protected]
G. P. PatrinosDepartment of Pharmacy, School of Health Sciences, University of Patras, Patras, Greecee-mail: [email protected]
G. Tzimas (B)Department of Applied Informatics in Management and Economy,Faculty of Management and Economics, Technological EducationalInstitute of Messolonghi, Messolonghi, Greecee-mail: [email protected]
123
Z.-M. Ioannou et al.
approach, we develop two mining tools, namely the Bio Search Engine and the Genome-Based Population Clustering.
Keywords Bioinformatics · Data mining · Text mining · Clustering algorithm · Documentclustering · Visualization tools
1 Introduction
Data Mining (Han and Kamber 2006) is the process of data analysis to identify interestingand useful information and knowledge from huge collections of data. In a more generalsense, data mining is the field of research in Computer Science that employs a wide spectrumof well-established statistical and machine learning techniques such as neural networks,and other advanced algorithms and computational techniques to derive hidden meaningfulcorrelations, patterns and trends. Today, a wide variety of data mining algorithms exist, aswell as methodologies to facilitate the process of knowledge discovery with wide applicationsin several domains of science.
In recent years, modern biology and medicine has entered a data-intensive era. The mass ofbiological and biomedical data being accumulated in large repositories continues to expandat extraordinary rates and biomedical researchers face the fundamental issue of making effec-tive use of a tremendous amount of complex and heterogeneous data in order to improve andenhance their understanding and productivity. As a result, data mining plays an essential rolein Bioinformatics (Wang et al. 2005) since having efficient and sophisticated computationalmethods and tools that automate the exploration procedure of enormous biomedical datarepositories is of critical importance to the advancement of research. Also, an alternativedifficult and challenging task in the domain of Bioinformatics is automatically extracting ormining valuable information from huge quantity of unstructured biomedical text documentsthat is referred to as Biomedical Text Mining (Ananiadou and Mcnaught 2006). Mining bio-medical literature is nowadays of significant importance due to the rapidly increasing numberof biomedical research publications that are electronically available and, therefore, the expan-sion of the hidden underlying biomedical knowledge. Typical Biomedical Text Mining tasksinclude automatic extraction of protein-protein interactions, named entity recognition, textclassification and terminology extraction.
In this article, we propose and analyze in depth an effective data mining technique fordetecting valuable knowledge from biological and biomedical data. More specifically, wehave designed an automatic and efficient clustering approach that performs well on multipletypes of biological and biomedical data. To prove the concept we have applied the pro-posed clustering technique in two distinct areas and based on it we have implemented twoapplications, namely the Bio Search Engine and the Genome-Based Population Clustering.
Bio Search Engine is a biomedical text mining tool working with biomedical literatureacquired from PubMed (http://www.ncbi.nlm.nih.gov/pubmed/), the most widely used bio-medical bibliographic text database. Focusing on the most recent publications, which arereturned from PubMed based on user queries, the tool via the clustering-based proceduredetects clusters of the article abstracts and ranks the retrieval results according to their rel-evance to the given query as well as their Impact Factor. Additionally, the tool identifiessignificant terms in the article clusters (Ioannou et al. 2011).
In Genome-Based Population Clustering tool (Ioannou et al. 2012) we experiment withdata acquired from FINDbase (Viennas et al. 2012; Georgitsi et al. 2011a,b; Van Baal et al.2007). FINDbase is an online resource (http://www.findbase.org) documenting frequencies
of pathogenic genetic variations leading to inherited disorders in various populations world-wide. In particular, we are envisaging and applying the clustering technique on the exist-ing FINDbase population genomic data collection aiming to explore hidden meaning-ful and useful genetic correlations among populations and their potential dependencyon the geographic distance of populations. In addition, we experiment with combin-ing the automated data mining process with novel visualization techniques for achiev-ing more effective inspecting, understanding and interacting with these huge and complexdata.
The remainder of this article is organized as follows. Section 2 gives account of previouswork relevant to the problem of mining biomedical data and literature. Section 3 provides adetailed description of the proposed data mining process, while Sect. 4 presents the applicationof the cluster-based approach for analyzing the two different types of data. Finally, Sect. 5points out our conclusions along with ideas for future work regarding this area.
2 Related work
2.1 Biomedical text mining
Biomedical Text Mining or BioNLP is the field of research that deals with the automaticprocessing, retrieval and analysis of scientific texts and more generally literature from the bio-medical domain by applying text mining techniques aimed at uncovering previously unknownknowledge. Currently, there has been significant research advances in the area of biomedicaltext mining, including named entity recognition, text classification, terminology extraction,relationship extraction and hypothesis generation (Cohen and Herch 2005).
Text Document clustering, unlike text document classification, is an unsupervised learningprocess that does not depend on prior knowledge or domain expertise. In particular, documentclustering is the task where similar documents are grouped into clusters. Existing biomedicaltext mining systems that cluster results into topics (Lu 2011) include GOPubMed1, Clus-terMed2 and XplorMed3. GOPubMed uses both Medical Subject Headings (MeSH) termsand Gene Ontology (GO) in order to organize the search results and, thus, to enhance theuser navigation and the search possibilities. It is also capable of sorting results into fourcategories: “what”, “who”, “where” and “when”. Another prominent example is ClusterMedthat also employs clustering in six different ways: (i) Title, Abstract and MeSH terms, (ii)Title and Abstract, (iii) MeSH terms only, (iv) Author names, (v) Affiliations, (vi) Date ofpublication. XplorMed organizes results by MeSH categories, extracts topic keywords andtheir co-occurrences and furthermore it provides an interactive navigation through abstracts.
For a comprehensive survey of such biomedical text mining systems along with theirvarious characteristics and features, one can consult (Cohen and Herch 2005; Dai et al. 2008;Lu 2011; Manconi et al. 2012).
It should be noted that besides clustering there are a handful of other fruitful techniquesthat have been applied to mine biological text data that either deviate apart from the bag-of-words model and the TF–IDF representation or employ other learning techniques differentfrom clustering. From these approaches worth to be mentioned are approaches based on theincorporation of semantic information and ontologies in order to correctly disambiguate the
meaning of various terms. We could also refer to the employment of second order n-gramMarkov models, probabilistic suffix analysis, and named entity recognition. Furthermorespecial mentioning deserves automatic term recognition techniques that recognize domainconcepts and using automatic term restructuring technique permit the text content organi-zation into knowledge structures (terminologies). More details for these techniques can befound in Ananiadou and Mcnaught (2006).
Moreover besides clustering another data mining technique that has been employed inorder to mine genome or protein data, is classification. For example in Guyon et al. (2002)Support Vector Machines based on Recursive Feature Elimination (RFE) were employed forthe problem of selection of a small subset of genes from broad patterns of gene expressiondata, recorded on DNA micro-array and it was verified experimentally that they succeededin better classification performance being biologically relevant to cancer. Moreover in Geor-gara et al. (2012) three Feature Selection Algorithms combined with the Support VectorMachine machinery were employed and evaluated on a protein classification task, whereprotein sequences were to be assigned on functional families based on binary features. Thethree Feature Selection Algorithms that were tested, were Recursive Feature Elimination(RFE), Discriminative Function Pruning Analysis (DFPA), and Prediction-risk-based FeatureSelection (SBS) and their application proved that careful feature selection before applyingSupport Vector Machines can produce better classification.
2.2 Genetic and mutation databases
In last decades, Genetic and Mutation databases concerning human genes have becomeincreasingly important in many fields of biology and medicine. The completion of the humangenome sequence, as well as the development of new experimental methods for the determi-nation of point mutations, have recently led to a tremendous increase of mutations identifi-cation, in a growing number of genes. Consequently, it is obvious that the organization andmanagement of these alteration data is of great importance to the scientists and researchersin genetic and genomic research.
Mutation databases are large mutation data repositories that provide valuable genomicinsights and genotype–phenotype correlations pertaining to monogenic inherited disorders.Currently, the complex research area of Disease Genetics involves three main types of geneticdatabases, general or core mutation databases (GMDs), locus-specific databases (LSDBs),and National/Ethnic Mutation databases (NEMDBs). GMDs are databases that collect alldescribed mutations in all genes; LSDBs are repositories for just one or few genes usuallyrelated to a single gene disorder, while NEMDBs describe the genetic composition and theallele frequencies of a population or ethnic group. Among the most prevalent examples ofmutation databases are the Human Gene Mutation Database (HGMD) (http://www.hgmd.cf.ac.uk/ac/index.php) and Online Mendelian Inheritance in Man (OMIM) (http://www.omim.org).
Although considerable progress has been made recently in this area, dealing with genomicinformation still remains a difficult and challenging task, as data are heterogeneous, huge inquantity and geographically distributed. Until now all work was focused on collecting dataand making efficient search on the various data sets. To our knowledge, there is no otherpublished work on applying mining techniques on such data. As a result, there is an urgentneed for developing advanced and efficient computational methods and tools to facilitate theprocess of managing and discovering useful hidden patterns and knowledge from these largeand complex biomedical data repositories.
In what follows we present in detail every step of the proposed data mining methodology. Theproposed clustering method consists of a combination of two different clustering techniques:Hierarchical Algorithm (Steinbach et al. 2000) and spherical k-means algorithm (Dhillonet al. 2002; Kogan 2007). The combination of Hierarchical and Non-Hierarchical (such ask-means) clustering techniques is a well-studied clustering method in data mining. It hasbeen shown that the utilization of the both clustering techniques improves the efficiency andaccuracy of clustering (Chen et al. 2005; Zhang and Xia 2009).
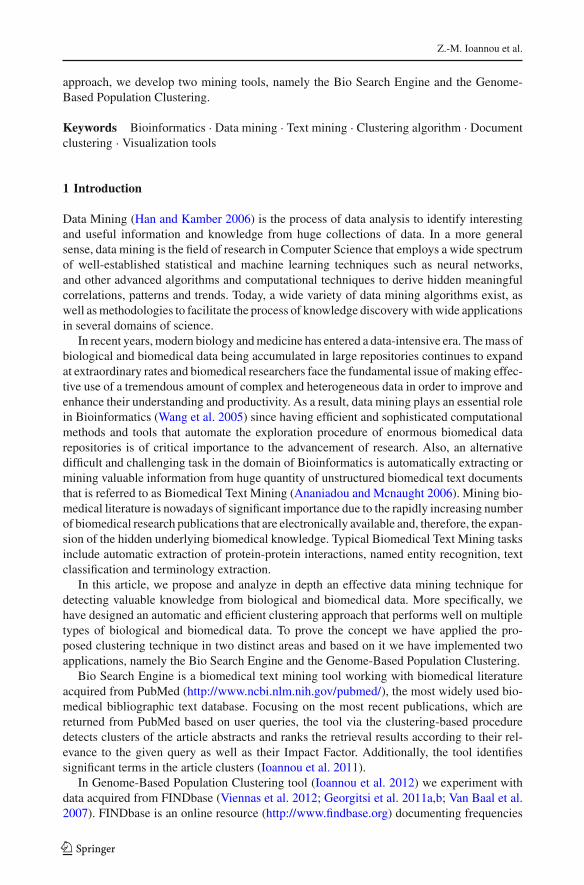
The basic steps of the algorithm are: Preprocessing of data collection in order to representthem in a more processable structure, Latent Semantic Indexing and Coarse Clustering inan attempt to generate an initial partition of data, Agglomerative Hierarchical Clustering inorder to reduce the number of the initial clusters (in case that the number is relatively large)and finally spherical k-means algorithm in order to enhance the quality of the producedclustering. The overall structure of the process employing the proposed method is depictedin Fig. 1.
3.1 Preprocessing the data collection
Data preprocessing is an essential step in the data mining process including feature selectionand representation of data. The data elements have to be transformed into a representationsuitable for computational use. For this purpose, we propose two alternative representationmethods for preprocessing two different types of data, including textual data (PubMed Doc-ument Collection) and numerical data (FINDbase Data Collection).
3.1.1 PubMed document collection
The bag-of-words model is the most widely used document representation adopted in textclustering algorithms. According to the bag-of-words model each document is represented asa sequence of terms/words. To this end, initially each document is divided into a set of lexicalunits that cannot be further divided and are called tokens. After document parsing, usuallytwo kinds of feature reduction (or term pruning) are performed. The first one removes thestopwords. A stopword is defined as a term which is not thought to convey any meaning as adimension of vector space. Typically, a compilation of stopwords consists of very common
Fig. 1 The proposed clustering process
123
Z.-M. Ioannou et al.
words such as articles, prepositions, conjunctions etc. By applying stopword removal, wemanage to reduce the dimensionality of the index by 20–30 %. The second one involvesPart-Of-Speech Tagging (POS Tagging) and lemmatization. POS Tagging is the process ofassigning a particular part of speech (e.g. noun, verb, adjective etc.) to each term of a documentwhile lemmatization is the process of reducing the words to their basic form (lemma). Finally,only the unique lemmas of noun words are retained.
Subsequently, according to the vector space model (Baeza-Yates and Ribeiro-Neto 2011),each document is represented as a vector of m dimensions, where m is the number of uniquelemmas. For each document the contribution of each lemma in its content representation iscomputed by using the TF–IDF (Term Frequency–Inverse Document Frequency) weightingscheme. The lemma frequency is simply the number of times a lemma appears in a document,whereas the Inverse Document Frequency is a measure of the general importance of the lemmaobtained by dividing the total number of documents by the number of documents containingthe term.
TF−IDF(t, d, D) = TF(t, d) ∗ IDF(t, D) (1)
IDF(t, D) = log
( |D||{d ∈ D : t ∈ d}|
)(2)
Consequently, a high weight in the TF–IDF weighting scheme is reached by a high lemmafrequency in the given document and a low document frequency of the lemma in the wholecollection of documents.
As a product of this representation, a matrix A of dimension m × n is produced, where mis the number of unique lemmas and n is the number of documents.
3.1.2 FINDbase data collection
The vector space model is one of the most popular in ad-hoc information retrieval, bearingmany uses in various kinds of operations. According to the vector space model each objectis represented as a vector of features.
In the case of FINDbase Data Collection, we utilize the vector space model in order torepresent each population as a feature vector (Eq. 3).
d = { f1, f2, . . . , fm} (3)
The vector d represents the causative mutations of a specific population. More specifically,d is an m-dimensional vector, where m is the number of unique causative mutations. Fora specific population the contribution of each mutation in its content representation is thegenetic variation allele frequency. The vector d takes part in the first level of populationclustering, i.e. in clustering based on mutation similarity (see Sect. 4.2).
According to the Spatial Representation, each population is also represented by a singlepoint in the geographic space (Eq. 4).
P = (x, y) (4)
The point P represents the Geographic coordinates of a specific population. Particularly, Pis a point in the two dimensional geographic space where x and y are the geographic latitudeand longitude respectively and takes part in the second level of population clustering, i.e. inthe clustering based on geographic location similarity (see Sect. 4.2).
Finally, as a product of the vector representation, a matrix A is produced of m × n dimen-sion, where m is the number of unique causative mutations and n is the number of uniquepopulations of FINDbase data set.
123
Novel mining tools
3.2 Latent Semantic Indexing
Latent Semantic Indexing (LSI) (Baeza-Yates and Ribeiro-Neto 2011) is a well-establishedindexing and retrieval method for extracting hidden relationships between terms and conceptscontained in large, unstructured collections of documents. The basic idea of the method laysin the projection of the documents vectors in a new, low-dimensional space obtained by theSingular Value Decomposition (SVD) of the term-document matrix A. The Singular ValueDecomposition of an m × n matrix A of rank r expresses A as a product of three simplermatrices,
A = U SV T (5)
where S = diag(σ1, . . . , σr ) is a diagonal matrix containing the set of singular values,U = (u1, . . . , ur ) is an m ×r matrix whose columns are orthonormal, and V = (v1, . . . , vr )
is an n × r matrix which is also column-orthonormal. The columns of U are the associatedeigenvectors of AAT and are referred to as the left singular vectors, while the columns of Vare the associated eigenvectors of AT A and are called the right singular vectors. LSI omits allbut the k largest singular values in the above decomposition, for some appropriate k which willbe the dimension of the low-dimensional space referred to in the description above. It shouldbe small enough to enable fast retrieval and large enough to adequately capture the structureof the corpus. Let Sk = diag(σ1, . . . , σk), Uk = (u1, . . . , uk), and Vk = (v1, . . . , vk). Then,
Ak = Uk Sk V Tk (6)
It has been experimentally validated in various publications (Berry et al. 1995; Deerwesteret al. 1990) and theoretically proved (Papadimitriou et al. 1998) that the aforementionedprocedure captures the inherent semantic structure of the corpus.
In case of the textual data collection, the Latent Semantic Indexing is performed in orderto capture in a more efficient and precise way the underlying semantic structure of term todocument associations.
Additionally, the successful performance of LSI in textual information retrieval has led toits application on numerical data too. In this case, the Latent Semantic Indexing is performedin order to capture the underlying structure of data associations and to discover hidden patternsin a more efficient way.
3.3 Coarse (initial) clustering
Fuzzy Clustering (Inoue and Urahama 2001) has been widely used in the area of informationretrieval and data mining. In traditional Fuzzy Clustering methods data elements can belongto more than one cluster, and each data element is associated to every cluster based on amembership function, that differentiates on the specific cluster.
In our clustering approach, we interpret the results of the LSI transformation of the initialA matrix as a form of fuzzy clustering and then we transform the fuzzy clustering to ahard-crisp clustering by assigning each data element to exactly one cluster, the cluster wherethe data element has the highest degree of participation. In this way, we produce an initialrough clustering of data. Later these initial clusters are going to be reduced (AgglomerativeHierarchical Clustering) and furthermore re-organized (spherical k-means algorithm) in orderto enhance their quality.
In particular, based on the n×k matrix Vk Sk , produced by SVD, we interpret the k columnsof the Vk Sk matrix as a set of k clusters and the n rows as the data elements. Each element (i, j)of the Vk Sk matrix, where i is the row and j is the column, defines the data element’s i degree
123
Z.-M. Ioannou et al.
of participation to the cluster j. This fuzzy clustering is transformed to a crisp clustering byassigning each data element to exactly one cluster, where the data element has the highestdegree of participation according to the values of the Vk Sk matrix.
Since the produced clustering, is based on an heuristic interpretation of the LSI machinery,we consider it to be an initial grouping of data elements that is used as the preprocessingphase that feeds the remaining components of the clustering phase. In particular note that theproduced number of clusters is equal to the LSI dimension which is generally high, hencethe clusters need to be reduced (this is accomplished with an agglomerative hierarchicalclustering algorithm) and redefined (this takes place with calls of the spherical k-meansprocedure).
Finally, following similar representations (Steinbach et al. 2000) each initial cluster isrepresented as a central vector called centroid c.
c = 1
|S|∑x∈S
x (7)
The centroid c is a central vector obtained by averaging the weights of the various featurespresent in the data elements x belonging to this cluster.
3.4 Hierarchical clustering
Hierarchical Clustering (Steinbach et al. 2000) is a widely used data analysis method foridentifying relatively homogeneous clusters of experimental data items based on selectedmeasured characteristics. Commonly, Hierarchical clustering techniques produce a set ofnested sequences of clusters, with a single all-inclusive cluster at the top and single pointclusters at the bottom. The result of a hierarchical clustering algorithm can be graphicallydisplayed as tree, called a dendrogram.
Typically, hierarchical clustering algorithms can be divided into two basic approaches:agglomerative (merging) and divisive (splitting). The agglomerative approach also calledbottom-up approach starts with all the data elements as individual clusters and at each stepthe algorithm merges the most similar or closest pair of clusters, based on a cluster similarityor distance measure. These steps can be repeated until the desired number of clusters isobtained or the distance between two closest clusters is above a certain threshold distance.The divisive approach or top-down hierarchical clustering starts with one, all-inclusive clusterand, at each step, the algorithm splits a cluster until only singleton clusters of individual pointsremain. In this case, we need to decide, at each step, which cluster to split and how to performthe split.
In the proposed clustering method, an agglomerative hierarchical clustering algorithm(Steinbach et al. 2000) is employed in an attempt to reduce the number of the initial clustersproduced by the LSI and Fuzzy Clustering in the previous steps. To this end, the agglomerativehierarchical clustering algorithm starts assuming as initial clusters, the set of k clusters, wherek is equal to the LSI dimension. At each step, the algorithm merges the two most similarclusters based on the UPGMA (Unweighted Pair Group Method with Arithmetic Mean)scheme (Steinbach et al. 2000).
similarity(cluster1, cluster2) =∑
x ∈ cluster1,y ∈ cluster2 cosine(x, y)
size(cluster1) ∗ size(cluster2)(8)
According to UPGMA, the similarity between any two clusters 1 and 2 is defined as theaverage of all similarities between pairs of data elements x in cluster 1 and y in cluster 2, thatis, the mean similarity between elements of each cluster. Finally, the cosine similarity is used
123
Novel mining tools
to measure the similarity between pairs of data elements, i.e. the cosine of the angle betweenthe associated vectors of data elements. Experimental results by Steinbach et al. (2000)indicate that the UPGMA is the best performing agglomerative hierarchical technique.
These steps need to be repeated until the desired number of clusters is obtained, i.e., untilT (with T ≤ k) clusters are obtained, where T is a user defined parameter determining thefinal number of clusters produced by the algorithm.
3.5 Spherical k-means algorithm
The k-means algorithm is a well known method used in many applications for clustering largecollections of data. Typically, the k-means procedure determines the distance or similaritybetween a data element in a cluster and its cluster centroid by using the squared Euclideandistance measure. The spherical k-means algorithm (Kogan 2007) is a well-studied variantof classical k-means algorithm with cosine similarity as the selected distance measure.
The motivation for applying the spherical k-means algorithm as the final step of ourclustering approach is in order to enhance the quality and the precision of the clusteringproduced by the Agglomerative Hierarchical Algorithm and the previous steps.
Furthermore, one of the major disadvantages of k-means and spherical k-means algorithmis that their clustering results are sensitive to the selection of the initial centroids, since thecentroids are randomly selected. For this reason, to overcome this drawback in the proposedclustering approach we define as initial centroids, the centroids of clusters generated by theAgglomerative Hierarchical Algorithm.
Specifically, we utilize a refinement algorithm (Dhillon et al. 2002; Kogan 2007) that useslocal search in order to refine the clusters generated by spherical k-means. The refinementalgorithm alternates between two steps: (a) first variation and (b) spherical k-means. Thefirst variation step moves a single data element from one cluster to another increasing in thisway the value of the objective function of the clustering. A sequence of first variation movesallows an escape from a local maximum, so that fresh iterations of spherical k-means can beapplied to further increase the objective function value. The combination of the enhanced firstvariation and spherical k-means yields a powerful refinement algorithm called as “ping-pong”that often improves in quality k-means clustering and a computationally efficient procedure.
4 Tools: proof of concept
Based on the aforementioned mining technique, we have developed two distinct applications:(a) Bio Search Engine and (b) Genome-Based Population Clustering.
4.1 Bio Search Engine
Bio Search Engine is a biomedical text mining tool that extracts reliable information fromelectronically available biomedical literature stored in PubMed database providing a simple,easy-to-use and user-friendly interface for querying and displaying the searching results.The source code is available for free access at the following address: http://biodata.gr/bse/download/BioSearchEngine.rar.
Bio Search Engine uses the National Center for Biotechnology Information (NCBI) EntrezUtilities Web Service4 in order to retrieve the top N (where N is a user-defined parameter)articles returned by PubMed database according to the given user query. By default, PubMed
returns the searching results in reverse chronological order. As a result, by selecting the topN returned articles we retrieve the most recent publications.
Also, using the Journal Citation Reports (JCR) of ISI Web of knowledge5, a Web-basedresearch tool providing journals with an impact factor and other metrics based on the numberof times their articles are cited in other works, the application extracts for each journal of anarticle the 5-Year Journal Impact Factor, that is, the average number of times articles froma journal published in the past five years have been cited in the JCR year, according to theISSN of the specific journal.
Subsequently, it stores the searching results, i.e. the top N returned PubMed article entriesas well as their associated publication information, including article title, title of journal,Impact Factor of the journal, article abstract, authors, etc., in the local database of the appli-cation in order to be accessible later. Then, the application applies the proposed clusteringalgorithm, as it is presented in Sect. 3, with the purpose of identifying clusters of the articleentries returned by PubMed according to their abstract content similarity. After clusteringmethod has been performed, the application attempts (a) to identify the most relevant articledocuments for the given query and furthermore (b) to discover the most significant termsfrom article clusters.
For the purpose of identifying the most relevant article documents, the most similar clusteris selected based on the given user query. The similarity between the given query and thecluster is calculated by using the cosine similarity measure which computes the cosine of theangle between the query vector and the centroid vector of the cluster. Moreover, the articledocuments belonging to the best selected cluster are ranked according to their similarity tothe given query (Query Ranking). The similarity between the given query and the articledocument is computed by using the cosine similarity measure of the angle between the queryand all the article document vectors. As a final step, the application employs a further rankingof the article documents according to their Journal Impact Factor (Impact Factor Ranking) asfollows: Using the aforementioned similarities between the documents and the given query(from Query Ranking step), we calculate the difference of similarity score between twodocuments and the query and if it is lower than a threshold, i.e. both the documents arehighly similar to each other, we move the document with the highest Journal Impact Factorin a higher position.
For the purpose of discovering significant terms from all the generated article clusters, weemploy the highly weighted terms of the cluster centroids. Experiment results by Karypis andHan (2000) indicate that cluster centroids can be used in order to summarize the content of acluster. They also state that the most important terms in a cluster centroid are the terms withthe highest weight. For this reason, we extract as significant terms, the highly weighted termsof the article cluster centroids, i.e. all the terms having a weight above a given threshold.
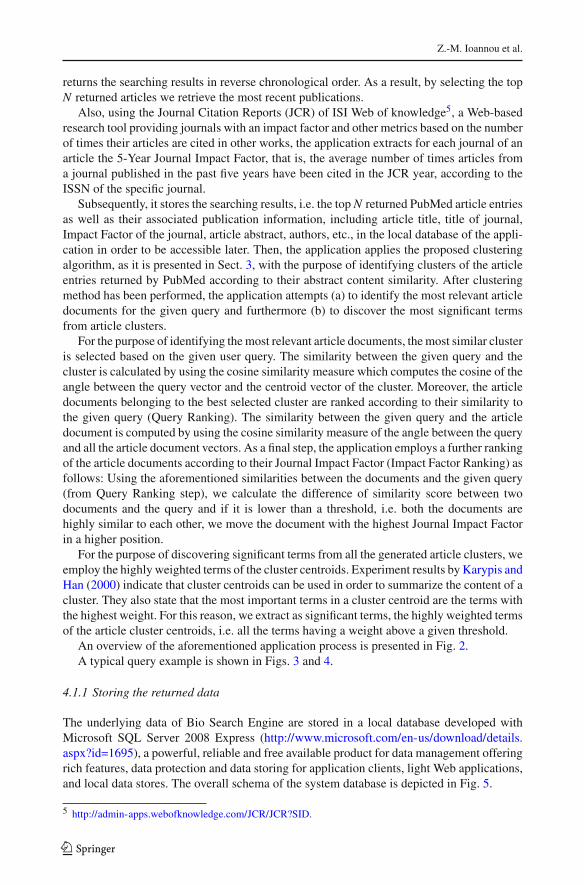
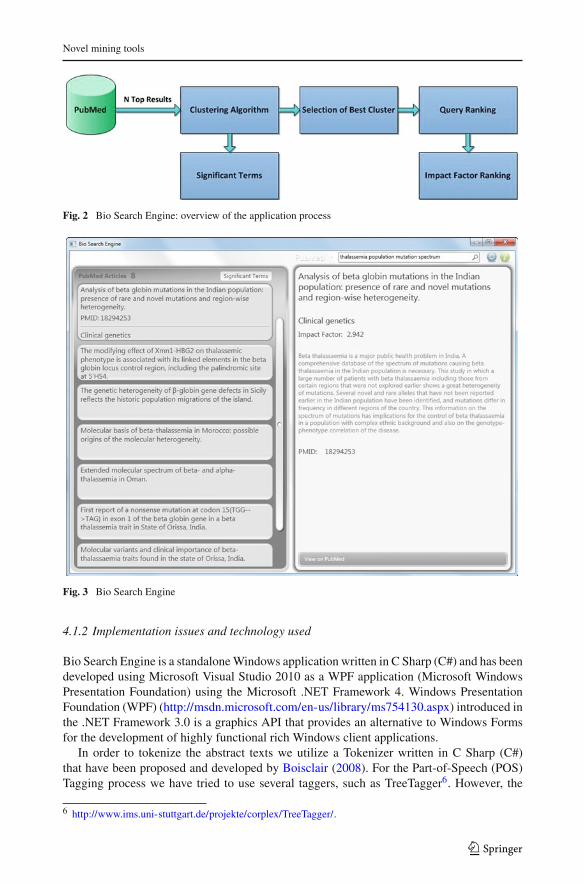
An overview of the aforementioned application process is presented in Fig. 2.A typical query example is shown in Figs. 3 and 4.
4.1.1 Storing the returned data
The underlying data of Bio Search Engine are stored in a local database developed withMicrosoft SQL Server 2008 Express (http://www.microsoft.com/en-us/download/details.aspx?id=1695), a powerful, reliable and free available product for data management offeringrich features, data protection and data storing for application clients, light Web applications,and local data stores. The overall schema of the system database is depicted in Fig. 5.
Fig. 2 Bio Search Engine: overview of the application process
Fig. 3 Bio Search Engine
4.1.2 Implementation issues and technology used
Bio Search Engine is a standalone Windows application written in C Sharp (C#) and has beendeveloped using Microsoft Visual Studio 2010 as a WPF application (Microsoft WindowsPresentation Foundation) using the Microsoft .NET Framework 4. Windows PresentationFoundation (WPF) (http://msdn.microsoft.com/en-us/library/ms754130.aspx) introduced inthe .NET Framework 3.0 is a graphics API that provides an alternative to Windows Formsfor the development of highly functional rich Windows client applications.
In order to tokenize the abstract texts we utilize a Tokenizer written in C Sharp (C#)that have been proposed and developed by Boisclair (2008). For the Part-of-Speech (POS)Tagging process we have tried to use several taggers, such as TreeTagger6. However, the
results were not efficient since the documents of our collection contain mainly biologicaland biomedical terms. For this reason, we preferred to utilize the GENIA tagger, which isspecifically tuned for biomedical texts such as MEDLINE abstracts. The GENIA tagger7
analyzes English sentences and outputs the base forms, part-of-speech tags, chunk tags, andnamed entity tags. Html Agility Pack (HAP)8 is a .NET code library allowing to parse HTMLfiles. In our application, we use the Html Agility Pack in order to extract the Impact Factorvalue from the web page of Journal Citation Reports (JCR). Smart Math Library9 providesscientific computing to the .NET platform. Using Smart Math Library we represent vectors,matrixes and we calculate Singular Value Decomposition and other arithmetic operationsbetween vectors and matrixes.
4.1.3 Experimental results
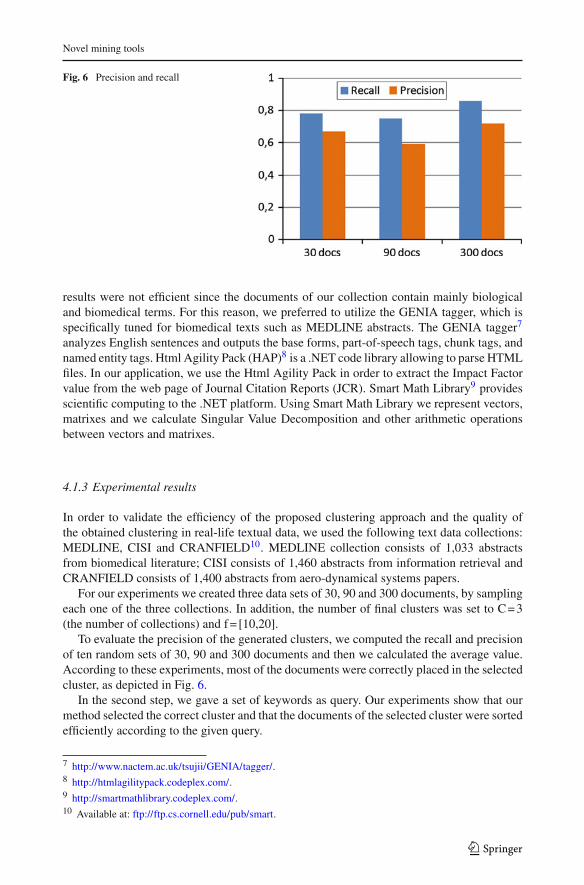
In order to validate the efficiency of the proposed clustering approach and the quality ofthe obtained clustering in real-life textual data, we used the following text data collections:MEDLINE, CISI and CRANFIELD10. MEDLINE collection consists of 1,033 abstractsfrom biomedical literature; CISI consists of 1,460 abstracts from information retrieval andCRANFIELD consists of 1,400 abstracts from aero-dynamical systems papers.
For our experiments we created three data sets of 30, 90 and 300 documents, by samplingeach one of the three collections. In addition, the number of final clusters was set to C = 3(the number of collections) and f = [10,20].
To evaluate the precision of the generated clusters, we computed the recall and precisionof ten random sets of 30, 90 and 300 documents and then we calculated the average value.According to these experiments, most of the documents were correctly placed in the selectedcluster, as depicted in Fig. 6.
In the second step, we gave a set of keywords as query. Our experiments show that ourmethod selected the correct cluster and that the documents of the selected cluster were sortedefficiently according to the given query.
7 http://www.nactem.ac.uk/tsujii/GENIA/tagger/.8 http://htmlagilitypack.codeplex.com/.9 http://smartmathlibrary.codeplex.com/.10 Available at: ftp://ftp.cs.cornell.edu/pub/smart.
Fig. 7 Genome-based population clustering: overview of the application process
As a general conclusion our technique seems to have satisfying performance and webelieve that the set of functionalities provided to the final user, makes the whole approachattractive in real data use.
4.2 Genome-based population clustering
4.2.1 The process
The proposed clustering process aims at the identification of population clusters based ontheir mutation’s allele frequency similarity and further sub-clusters regarding their geographiclocation similarity. The whole data mining process involves two levels of clustering.
The first level of the clustering process is based on the proposed clustering algorithm andit aims to identify population clusters based on their mutations allele frequency similarity.As a first step, we preprocess the initial FINDbase dataset in order to convert the underlyingdata to a more processable structure. Particularly, we represent each population as a vectorbased on its relative mutations (Eq. 3). Subsequently, applying Latent Semantic Indexing(LSI) and Coarse Clustering we generate an initial partition of populations. In the case thatthe number of the initial clusters is relatively large, we reduce the number of these clustersby applying an agglomerative hierarchical clustering algorithm. Finally, we refine the resultof clustering utilizing the spherical k-means algorithm.
The main goal of the second level of the data mining process is to generate sub-clusterswithin the clusters already identified in the first level of clustering method. Firstly, we rep-resent each population using the spatial representation (Eq. 4) according to the geographicalcoordinates as they exist in the original FINDbase dataset. Then, for each cluster we apply anAgglomerative Hierarchical Algorithm in order to create sub-clusters containing populationswith similar geographic location.
The basic steps of the whole process are depicted in Fig. 7.
4.2.2 The application
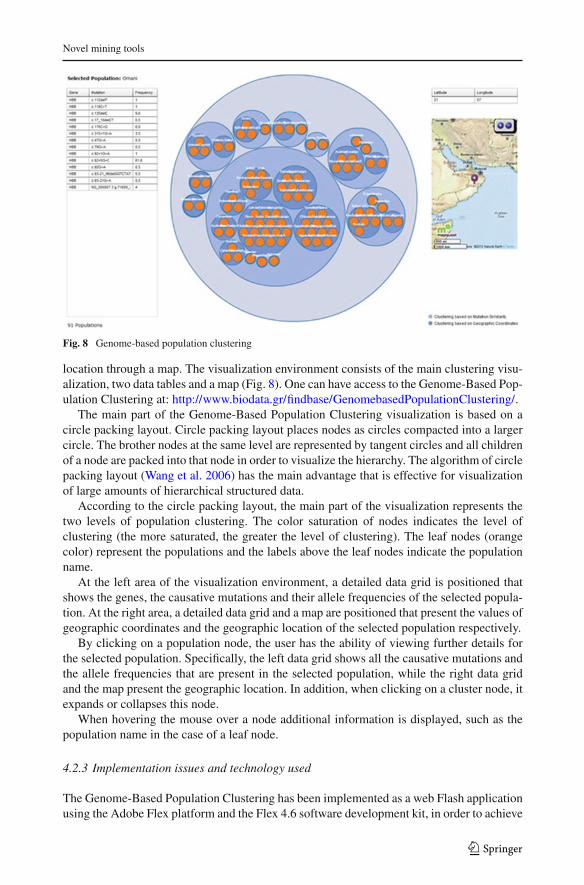
FINDbase Genome-Based Population Clustering is a web-based tool that lets users to exploregenetic relationships between various populations through an interactive visualization envi-ronment. It represents the results of our clustering method in a more effective, understandableand intuitive way. Additionally, it allows users to view additional information for a specificpopulation, such as causative mutations and their allele frequencies, as well as its geographic
123
Novel mining tools
Fig. 8 Genome-based population clustering
location through a map. The visualization environment consists of the main clustering visu-alization, two data tables and a map (Fig. 8). One can have access to the Genome-Based Pop-ulation Clustering at: http://www.biodata.gr/findbase/GenomebasedPopulationClustering/.
The main part of the Genome-Based Population Clustering visualization is based on acircle packing layout. Circle packing layout places nodes as circles compacted into a largercircle. The brother nodes at the same level are represented by tangent circles and all childrenof a node are packed into that node in order to visualize the hierarchy. The algorithm of circlepacking layout (Wang et al. 2006) has the main advantage that is effective for visualizationof large amounts of hierarchical structured data.
According to the circle packing layout, the main part of the visualization represents thetwo levels of population clustering. The color saturation of nodes indicates the level ofclustering (the more saturated, the greater the level of clustering). The leaf nodes (orangecolor) represent the populations and the labels above the leaf nodes indicate the populationname.
At the left area of the visualization environment, a detailed data grid is positioned thatshows the genes, the causative mutations and their allele frequencies of the selected popula-tion. At the right area, a detailed data grid and a map are positioned that present the values ofgeographic coordinates and the geographic location of the selected population respectively.
By clicking on a population node, the user has the ability of viewing further details forthe selected population. Specifically, the left data grid shows all the causative mutations andthe allele frequencies that are present in the selected population, while the right data gridand the map present the geographic location. In addition, when clicking on a cluster node, itexpands or collapses this node.
When hovering the mouse over a node additional information is displayed, such as thepopulation name in the case of a leaf node.
4.2.3 Implementation issues and technology used
The Genome-Based Population Clustering has been implemented as a web Flash applicationusing the Adobe Flex platform and the Flex 4.6 software development kit, in order to achieve
a high level of compatibility with a wide variety of operating systems and browsers. Theunderlying data structures and functionalities have been implemented in ActionScript 3 andthe Flex component library has been used in order to exploit its advanced capabilities. Fur-thermore, we have utilized the Open Flash Maps API version 7.1.1_OSM11 for representingthe geographic location of a selected population. Our decision to use Flash as our visualiza-tion platform was due to the fact that it is nearly ubiquitous on a variety of internet-enableddesktop as well as mobile operating systems.
The main visualization area of the Genome-Based Population Clustering has been devel-oped using the Flare Visualization Toolkit12. Flare is an open-source library written in Action-Script 3,13 an object-oriented programming language, for creating data visualizations thatrun in the Adobe Flash Player. Including a wide variety of features, ranging from basic chartsto complex interactive graphs, it supports data management, visual encoding, animation, andinteraction techniques. Flare is a Flash version of its predecessor Prefuse14, a visualizationtoolkit for Java. Instead of creating Java applications with complex visualizations, Flare offersthe ability of developing thin-client, web-based and rich interactive experience environments.It has already been used in many well-known web-based visualization applications such asthe Many-Eyes website15, build by the IBM Visual Communication Lab, for user-contributeddata visualization as well as the BBC SuperPower website16 for mapping the top 100 siteson the Internet.
5 Conclusions and future work
In this article we present a novel data mining technique for gaining insight into biological andbiomedical data and literature. The proposed data mining process is based on a cluster-basedapproach incorporating well-known clustering algorithms such as Spherical k-means andHierarchical Algorithm and is suitable for mining a wide variety of biological and biomedicaldata. To prove the concept, we have applied it into two distinct areas and we have furtherdeveloped two alternative mining tools, Bio Search Engine and Genome-Based PopulationClustering.
In the near future, we are planning to experiment with more innovative data miningapproaches. Specifically, we intend to integrate into our data mining technique the BIRCH(Balanced Iterative Reducing and Clustering using Hierarchies) algorithm (Zhang et al. 1996,1997; Kogan 2007) that is especially suitable for mining very large databases. This algorithmcould possibly be applied in the step of reducing the number of the initial clusters (after LSIand Coarse Clustering and before Hierarchical Algorithm) as follows: The BIRCH algorithm,which employs a hierarchical data structure called CF-tree in order to separate the incomingdata points, could be applied on the initial cluster centers have been defined from the LSItechnique and Coarse Clustering. In this case, the data points are the centers of the initialclusters. Subsequently, the Agglomerative Hierarchical Algorithm could be employed, whereeach cluster is the merge of other clusters.
Our future work in the area of biomedical text mining includes the expansion of the currentbiomedical text mining tool with more advanced capabilities by integrating user profilingtechniques. In particular, we are planning to implement user profiling in two different ways:(i) Each user will have the ability of selecting as “interesting” any of the returned searcharticle results. (ii) The user will also have a profile of keyword terms that describe hisresearch interests. This user profile will be enriched either directly, by filling in a relevantform, or indirectly, by recording his search history regarding which articles of biomedicalliterature had attracted his attention in the past, as well as by extracting the most dominantkeyword terms occurring in these articles. Furthermore, the users could be organized intogroups (user clustering) according to the article texts of their interest. After user clustering,the user’s profile will be expanded with the profiles of users belonging to the same group.
The Bio Search Engine as a standalone windows application is a first version of our tool.In our future work we will also focus on its implementation as a web application aiming atproviding the service in a cross-platform manner.
Our future work in the area of Genome-Based Population Clustering includes furtherexperimenting with applying more alternative data mining analysis techniques. In addition,we are going to combine the two different representations of populations in a more sophisti-cated way aiming to improve the effectiveness of the clustering method.
References
Ananiadou S, Mcnaught J (2006) Text mining for biology and biomedicine. Artech House, LondonBaeza-Yates R, Ribeiro-Neto B (2011) Modern information retrieval: the concepts and technology behind
search, 2nd edn. ACM Press, New YorkBerry MW, Dumais ST, O’Brien GW (1995) Using linear algebra for intelligent information retrieval. SIAM
Rev 37(4):573–595Boisclair C (2008) Developing a tokenizer and morphological parser for English text in C#. In: Proceedings
of the 46th annual southeast regional conference, Auburn, Alabama, USA. ACM, pp 288–293Chen B, Harrison R, Pan Y, Tai P (2005) Novel Hybrid hierarchical-K-means clustering method (H-K-
means) for microarray analysis. In: Proceedings of the (2005) IEEE computational systems bioinformaticsconference—workshops (CSBW ’05). IEEE Computer Society, Washington, DC, USA, pp 105–108
Cohen AM, Herch WR (2005) A survey of current work in biomedical text mining. Brief Bioinform 6(1):57–71.doi:10.1093/bib/6.1.57
Dai HJ, Lin JYW, Huang CH, Chou PH, Tsai RTH, Hsu WL (2008) A survey of state of the art biomedical textmining techniques for semantic analysis. In: Proceedings of the IEEE international conference on sensornetworks, ubiquitous and trustworthy computing (SUTC ’08), pp 410–417
Deerwester SC, Dumais ST, Landauer TK, Furnas GW, Harshman RA (1990) Indexing by latent semanticanalysis. J Am Soc Inf Sci 41(6):391–407
Dhillon IS, Guan Y, Kogan J (2002) Iterative clustering of high dimensional text data augmented by localsearch. In: Proceedings of the 2002 IEEE international conference on data mining, pp 131–138
Georgara D, Kermanidis K, Mariolis I (2012), Support vector machine classification of protein sequences tofunctional families based on motif selection. In: Proceedings of the 8th artificial intelligence applicationsand innovations conference (AIAI 2012), pp 28–36
Georgitsi M, Viennas E, Gkantouna V, Christodoulopoulou E, Zagoriti Z, Tafrali C, Ntellos F, GiannakopoulouO, Boulakou A, Vlahopoulou P, Kyriacou E, Tsaknakis J, Tsakalidis A, Poulas K, Tzimas G, Patrinos GP(2011a) Population-specific documentation of pharmacogenomic markers and their allelic frequencies inFINDbase. Pharmacogenomics 12(1):49–58. doi:10.2217/pgs.10.169
Georgitsi M, Viennas E, Gkantouna V, van Baal S, Petricoin EF, Poulas K, Tzimas G, Patrinos GP (2011b)FINDbase: a worldwide database for genetic variation allele frequencies updated. Nucleic Acids Res39:D926–D932
Guyon I, Weston J, Barnhill S, Vapnik V (2002) Gene selection for cancer classification using support vectormachines. Mach Learn 4:389–422
Han J, Kamber M (2006) Data mining: concepts and techniques, 2nd edn. Morgan Kaufmann Publishers, SanFrancisco
Ioannou M, Makris C, Tzimas G, Viennas E (2011) A text mining approach for biomedical documents. In:Proceedings of the 6th conference of the Hellenic Society for computational biology and bioinformatics(HSCBB11), Patras, Greece
Ioannou M, Patrinos G, Tzimas G (2012) Genome-based population clustering: Nuggets of truth buried in a pileof numbers? In: Proceedings of the 1st workshop on algorithms for data and text mining in bioinformatics(WADTMB (2012) organized in the 8th artificial intelligence applications and innovations conference(AIAI 2012), September 27–30, 2012. Halkidiki, Greece
Inoue K, Urahama K (2001) Fuzzy clustering based on cooccurence matrix and its application to data retrieval.Electron Commun Jpn Pt. II 84(8):10–19. doi:10.1002/ecjb.1045
Karypis G, Han EH (2000) Fast supervised dimensionality reduction algorithm with applications to documentcategorization and retrieval. In: Proceedings of the 9th ACM international conference on information and,knowledge management, pp 12–19
Kogan J (2007) Introduction to clustering large and high-dimensional data. Cambridge University Press, NewYork
Lu Z (2011) Pubmed and beyond: a survey of web tools for searching biomedical literature. Database (Oxford).doi:10.1093/database/baq036
Manconi A, Vargiu E, Armano G, Milanesi L (2012) Literature retrieval and mining in bioinformatics: stateof the art and challenges. Adv Bioinform 2012:573846. doi:10.1155/2012/573846
Papadimitriou CH, Tamaki H, Raghavan P, Vempala S (1998) Latent semantic indexing: a probabilistic analy-sis. In: Proceedings of the 17th ACM SIGACT-SIGMOD-SIGART symposium on principles of databasesystems. ACM Press, New York, pp 159–168
Steinbach M, Karypis G, Kumar V (2000) A comparison of document clustering techniques. In: Proceedings ofthe KDD workshop on text mining, 6th ACM SIGKDD international conference on data mining (KDD’00)
Van Baal S, Kaimakis P, Phommarinh M, Koumbi D, Cuppens H, Riccardino F, Macek M Jr, Scriver CR,Patrinos GP (2007) FINDbase: a relational database recording frequencies of genetic defects leading toinherited disorders worldwide. Nucleic Acids Res 35(Database issue):D690–D695
Viennas E, Gkantouna V, Ioannou M, Georgitsi M, Rigou M, Poulas K, Patrinos GP, Tzimas G (2012)Population-ethnic group specific genome variation allele frequency data: a querying and visualizationjourney. Genomics 100(2):93–101. doi:10.1016/j.ygeno.2012.05.009
Wang JTL, Zaki MJ, Toivonen HTT, Shasha D (2005) Data mining in bioinformatics. In: Wang JTL, ZakiMJ, Toivonen HTT, Shasha D (eds) Advanced information and knowledge processing, Springer-Verlag,London, UK
Wang W, Wang H, Dai G, Wang H (2006) Visualization of large hierarchical data by circle packing. In:Proceedings of the SIGCHI conference on human factors in computing systems, pp 517–520
Zhang C, Xia S (2009) K-means clustering algorithm with improved initial center, knowledge discovery anddata mining, 2009. WKDD 2009, pp 790–792. doi:10.1109/WKDD.2009.210
Zhang T, Ramakrishnan R, Livny M (1996) BIRCH: an efficient data clustering method for very large databases.In: Proceedings of the 1996 ACM SIGMOD international conference on management of data, June 04–06,1996. Montreal, Quebec, Canada, pp 103–114. doi:10.1145/235968.233324
Zhang T, Ramakrishnan R, Livny M (1997) BIRCH: a new data clustering algorithm and its aApplications.J Data Min Knowl Discov 1(2):141–182