INDONESIAN MINING JOURNAL Vol. 23, No. 1, April 2020 : 31 - 42 A SHEAR TEST OF DEBRIS ROCK AT LABORATORY SCALE UJI KUAT GESER BATUAN HANCURAN PADA SKALA LABORATORIUM SAVIQRI SURYAPUTRA 1,2 , MADE A. RAI 2 , NUHINDRO P. WIDODO 2 and BOB A. LINGGA 2 1 Mine Inspector, Ministry of Energy and Mineral Resources Jalan Prof. Dr. Soepomo, S.H. No. 10 Jakarta Selatan 12870 e-mail: [email protected]2 Mining Engineering, Bandung Institute Technology Jalan Ganesha No. 10, Lb. Siliwangi, Kecamatan Coblong, Bandung, Jawa Barat 40132 ABSTRACT As one of rock’s mechanical properties, the shear strength is one of the most significant factors that affect rock-dump slope stability. On previous research, one of the tests that needs to be conducted for shear strength characteristic estimation is the field-scale tilt test that requires a lot of expense and material. In this research, a direct shear test was conducted to 3 different mudstone specimens for modeling the Barton and Kjaernsli shear strength at laboratory-scale, using the fragment size of coarse (50 mm - 1 mm), medium (<1 mm – 0.25 mm), and fine (<0.25mm). Then, the results was compared to the shear strength of the debris rock that was come from the value of the equivalent roughness (R) both derived from back-calculated and empirical calculation. This research delivers the estimated shear strength that is more representative because the specimens were controllable in regards to its fragment size and composition. The more predominant big rock fragment in a composition, the bigger its back- calculated R-value. The obtained crushed rock shear strength with empirical R was lower in value compared to the one with back-calculated R. Keywords: Barton and Kjaernsli criterion, debris rock shear strength, equivalent roughness, mudstone, shear strength test. ABSTRAK Salah satu sifat mekanik batuan yang paling berpengaruh dalam kestabilan lereng timbunan adalah kekuatan geser batuan. Pada penelitian sebelumnya, salah satu uji yang perlu dilakukan untuk menentukan karakteristik kekuatan geser batuan hancuran adalah uji tilt dalam skala lapangan yang membutuhkan biaya dan material dalam jumlah besar. Dalam penelitian ini dilakukan uji kuat geser langsung batuan hancuran skala laboratorium terhadap 3 jenis mudstone untuk memodelkan kekuatan geser dengan kriteria Barton dan Kjaernsli, dengan ukuran fragmen material penyusun coarse (50 mm - 1 mm), medium (<1 mm – 0,25 mm), dan fine (<0,25mm). Selanjutnya, dibandingkan kekuatan geser batuan hancuran yang dibentuk oleh nilai equivalent roughness (R) secara perhitungan balik dan secara empiris. Dari hasil penelitian, diperoleh estimasi kekuatan geser batuan hancuran yang lebih representatif karena ukuran fragmen dan komposisi sampel uji yang digunakan dapat dikontrol. Semakin banyak jumlah batuan dengan fragmen berukuran besar dalam suatu komposisi maka nilai R dari perhitungan balik akan semakin besar. Karakteristik kekuatan geser batuan hancuran menggunakan R empiris menghasilkan kekuatan geser yang lebih kecil dibandingkan dengan menggunakan R perhitungan balik. Kata kunci: kriteria Barton dan Kjaernsli, kuat geser batuan hancuran, equivalent roughness, mudstone, uji kuat geser. Received: 26 February 2020, first revision: 14 April 2020, second revision: 18 April 2020, accepted: 21 April 2020. 31 DOI: 10.30556/imj.Vol23.No1.2020.1090 This work is licensed under a CC BY-NC (http://creativecommons.org/licenses/by-nc/4.0/)
Transcript
INDONESIAN MINING JOURNAL Vol. 23, No. 1, April 2020 : 31 - 42
A SHEAR TEST OF DEBRIS ROCK AT LABORATORY SCALE
UJI KUAT GESER BATUAN HANCURAN PADA SKALA
LABORATORIUM SAVIQRI SURYAPUTRA1,2, MADE A. RAI2, NUHINDRO P. WIDODO2 and BOB A. LINGGA2
1 Mine Inspector, Ministry of Energy and Mineral Resources Jalan Prof. Dr. Soepomo, S.H. No. 10
2 Mining Engineering, Bandung Institute Technology Jalan Ganesha No. 10, Lb. Siliwangi, Kecamatan Coblong,
Bandung, Jawa Barat 40132
ABSTRACT As one of rock’s mechanical properties, the shear strength is one of the most significant factors that affect rock-dump slope stability. On previous research, one of the tests that needs to be conducted for shear strength characteristic estimation is the field-scale tilt test that requires a lot of expense and material. In this research, a direct shear test was conducted to 3 different mudstone specimens for modeling the Barton and Kjaernsli shear strength at laboratory-scale, using the fragment size of coarse (50 mm - 1 mm), medium (<1 mm – 0.25 mm), and fine (<0.25mm). Then, the results was compared to the shear strength of the debris rock that was come from the value of the equivalent roughness (R) both derived from back-calculated and empirical calculation. This research delivers the estimated shear strength that is more representative because the specimens were controllable in regards to its fragment size and composition. The more predominant big rock fragment in a composition, the bigger its back-calculated R-value. The obtained crushed rock shear strength with empirical R was lower in value compared to the one with back-calculated R.
Keywords: Barton and Kjaernsli criterion, debris rock shear strength, equivalent roughness, mudstone, shear strength test.
ABSTRAK Salah satu sifat mekanik batuan yang paling berpengaruh dalam kestabilan lereng timbunan adalah kekuatan geser batuan. Pada penelitian sebelumnya, salah satu uji yang perlu dilakukan untuk menentukan karakteristik kekuatan geser batuan hancuran adalah uji tilt dalam skala lapangan yang membutuhkan biaya dan material dalam jumlah besar. Dalam penelitian ini dilakukan uji kuat geser langsung batuan hancuran skala laboratorium terhadap 3 jenis mudstone untuk memodelkan kekuatan geser dengan kriteria Barton dan Kjaernsli, dengan ukuran fragmen material penyusun coarse (50 mm - 1 mm), medium (<1 mm – 0,25 mm), dan fine (<0,25mm). Selanjutnya, dibandingkan kekuatan geser batuan hancuran yang dibentuk oleh nilai equivalent roughness (R) secara perhitungan balik dan secara empiris. Dari hasil penelitian, diperoleh estimasi kekuatan geser batuan hancuran yang lebih representatif karena ukuran fragmen dan komposisi sampel uji yang digunakan dapat dikontrol. Semakin banyak jumlah batuan dengan fragmen berukuran besar dalam suatu komposisi maka nilai R dari perhitungan balik akan semakin besar. Karakteristik kekuatan geser batuan hancuran menggunakan R empiris menghasilkan kekuatan geser yang lebih kecil dibandingkan dengan menggunakan R perhitungan balik.
Kata kunci: kriteria Barton dan Kjaernsli, kuat geser batuan hancuran, equivalent roughness, mudstone, uji kuat geser.
Received: 26 February 2020, first revision: 14 April 2020, second revision: 18 April 2020, accepted: 21 April 2020. 31 DOI: 10.30556/imj.Vol23.No1.2020.1090 This work is licensed under a CC BY-NC (http://creativecommons.org/licenses/by-nc/4.0/)
INDONESIAN MINING JOURNAL Vol. 23, No. 1, April 2020 : 31 - 42
INTRODUCTION Slope stabilities of dumping or rock fill area are important in the mining activity plan (Wicaksana et al., 2013; Wei et al., 2018; Zevgolis, Deliveris and Koukouzas, 2019). A rock dump in mining activities can be composed of over-burden, stockpile, and/or processing waste materials. In analyzing the stability of the rock-dump slope, data on the physical and mechanical properties of the rock are needed (Lingga et al., 2019). One of the most important mechanical properties of debris rocks in slope or regenerated rock mass structure stability is the shear strength features of it (Ma and Wang, 2019), yet the geotechnical engineering aspect is complex when dealing with this type of material (Xu et al., 2017). Number of studies on shear strength of granular materials showed some bias in resulting the strength properties based on Mohr-Coulomb criterion (Suits et al., 2008; Skuodis et al., 2013), due to the dilative behavior of particle interlocking in the shear zone (Li and Aydin, 2010; Mohapatra et al., 2019). Consequently, the difficulty of assessing the shear strength of granular materials such as broken rocks, especially in mining, is best approached using Barton and Kjaernsli criterion. Rock dumps in mining activities can be assumed as jointed materials that are not filled by other minerals (unfilled joints) or broken materials (debris rock) because it has undergone the excavation process from in-situ conditions. In this case, based on Barton earlier research, the most influential in the rock-shear strength with unfilled joints is the peak friction angle (ϕ') of the joint in which the magnitude is determined by the roughness and compressive strength of the joint walls (Barton, 1973; Barton and Choubey, 1977). The next study had explained that the uniaxial compressive strength of the rock and the particle size of the d50 determined the equivalent strength (S) of the joint, while the degree of the rock particle roundedness and the compacted rock porosity (n%) determined the equivalent roughness (R) of the joint (Barton and Kjaernsli, 1981). The S and R parameters then formed a component structure of the crushed-rock shear strength which is very dependent on the stress experienced. Furthermore, the component
structure was added with the value of basic friction angle (Φb) of the dry, flat, and non-dilatant joint surface (i.e. sawn surfaces) to obtain Φ’. In the case of a preliminary study for designing a crushed-rock-pile, the estimated value of S and R are suggested to be calculated using the empirical approach. However, if the value is used to investigate rock-shear strength in more details, it is generally prompted to estimate the value of the R using the back calculation from a large-scale crushed-rock tilt tests in the field with the assistance of the S data, as well as the ϕb value which is obtained from the approach in the preliminary study (Barton and Kjaernsli, 1981). The tilt test of a large-scale debris rock in the field requires a large amount of expense and material. Therefore, a direct shear-strength test of a debris rock was conducted on a laboratory scale instead of a field-scale tilt test to estimate the value of back-calculated R efficiently in this research. This study refers to the shear-strength criteria for rockfill (Barton and Kjaernsli, 1981). The direct shear-strength test of the debris rock in a laboratory scale was performed to the samples of the rock fragment with different material compositions that consist of fragment size variations adjusted to the reject-material specifications of the Coal Processing Plant which will be placed in the waste dump of the coal mine. This study focuses on the comparison of R values obtained from the back calculation and empirical study, as well as the comparison of shear-strength envelopes which were formed from each R value in the three predetermined compositions. METHOD Sample Preparation The tests were carried out at the Geo-mechanics and Mining Equipment Laboratory and the Mining Material Processing Laboratory (PBG), Faculty of Mining and Petroleum Engineering, Institute of Technology Bandung (ITB). A series of tests includes the tests of debris rock physical properties he, uniaxial compressive strength (UCS), direct shear-strength with zero value
32
A Shear Test of Debris Rock at Laboratory Scale, Saviqri Suryaputra et al.
of joint roughness coefficient (JRC = 0), Schmidt hammer, sieve analysis d50, roundness, and direct shear-strength. The core mudstone samples from the field needs to be prepared into the required shape and sample size for each test. The samples had an average diameter of ± 60.5 mm. For testing the uniaxial compressive strength, the direct shear-strength of sawn surface at which the JRC = 0, and Schmidt hammer, the core samples were cut into length of approximately ± 131 mm for the UCS test and ± 70 mm for the others. Specifically, the samples used for direct shear-strength test of the sawn surface, the center of the samples was pre-cut to get a flat discontinuous plane. To test the physical properties of the debris rock, the sieve analysis d50, the roundness t, and the direct shear-strength of the debris rock requires the samples in the form of crushed rock. The formation of the crushed sample was carried out to the Mining Material Processing Laboratory (PBG) to get the sample size and composition according to the determined specifications (Table 1). In this research, a series of tests were conducted in order to estimate the shear strength of the broken rock in the laboratory in accordance with Barton and Kjaernsli method with substituting the field-scale tilt test to a direct shear-strength test of crushed-rock (Figure 1). Basic Friction Angle (ϕb) and Residual Friction Angle (ϕr) The value of the basic friction angle was generated from the direct shear-strength test of the sawn surface. Conservatively in a construction design which needs to consider the design with long-term strength, the Φb value could be changed using the Φr value (Barton, 2008; Lingga and Apel, 2018). Therefore, the value of Φr was estimated using the value of weathered rebound number (r5) through the Schmidt hammer test and using the value of unweathered rebound number (R5) through the uniaxial compressive strength (UCS) test. The Schmidt hammer graph used in this process was Proceq N-34 (Figure 2).
Figure 1. Index Testing for Estimating Shear Strength of Broken Rock in Laboratory
From the value of the basic friction angle, unweathered rebound number, and weathered rebound number (r5), the residual friction angle values were estimated using equation (1). Φr = (Φb – 20o) + 20o (r5/R5) ....................... (1)
INDEX TESTING FOR ESTIMATING SHEAR STRENGTH OF BROKEN ROCKS Based on Barton & Kjaernsli, Rockfill Shear Strength Criteria
33
INDONESIAN MINING JOURNAL Vol. 23, No. 1, April 2020 : 31 - 42
Table 1. Fragment size, compositions, and required amount of crushed-rock material
Fragment Size Composition I Composition II Composition III Kg % Kg % Kg %
50 mm - mm 20.06 75 16.05 60 21.41 80 <1 mm - 0.25 mm (#16) 3.48 13 4.01 15 2.67 10
<0.25 mm (#60) 3.21 12 6.69 25 2.67 10 Total 26.75 100 26.75 100 26.75 100
Figure 2. Schmidt hammer Proceq N-34 graph (Proceq, 2017) Equivalent Strength S The S value was obtained from the sieve analysis d50 and UCS tests. The sieve analysis d50 was carried out to determine the size of the sieve in which it could divide the sample in 50:50 ratios. From the size of the sieve d50, which was obtained, as well as the value of the uniaxial compressive strength (σc), the S value could be estimated using an empirical graph of S/σc reduction factors for estimating S (Figure 3).
Equivalent Roughness The value of R could be obtained using two methods: back calculation and empirical approach. However, if the value is used to investigate rock-shear strength more confidently, it is generally recommended to estimate the R-value from back-calculation (Barton and Kjaernsli, 1981). In this study, the two methods were performed to compare the obtained shear-strength results of the debris rock.
Figure 3. Empirical S/σc reduction factors for estimating the S graph (Barton and Kjaernsli, 1981)
34
A Shear Test of Debris Rock at Laboratory Scale, Saviqri Suryaputra et al.
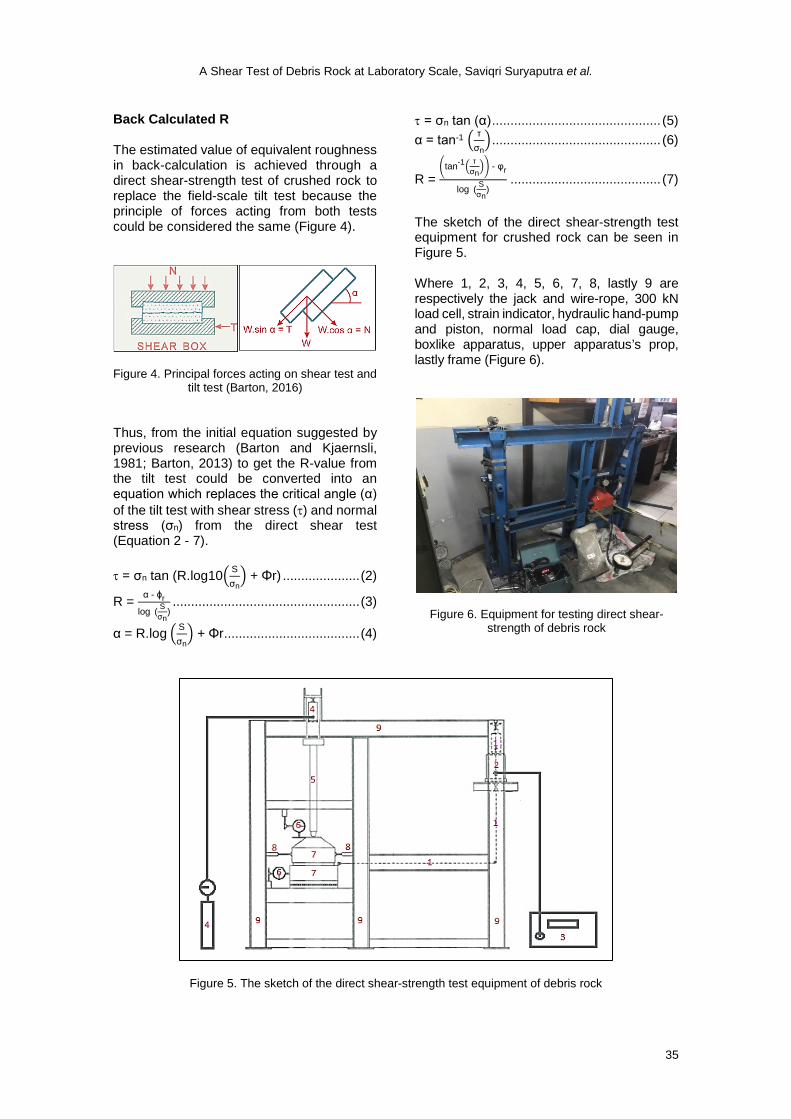
Back Calculated R The estimated value of equivalent roughness in back-calculation is achieved through a direct shear-strength test of crushed rock to replace the field-scale tilt test because the principle of forces acting from both tests could be considered the same (Figure 4).
Figure 4. Principal forces acting on shear test and tilt test (Barton, 2016)
Thus, from the initial equation suggested by previous research (Barton and Kjaernsli, 1981; Barton, 2013) to get the R-value from the tilt test could be converted into an equation which replaces the critical angle (α) of the tilt test with shear stress (τ) and normal stress (σn) from the direct shear test (Equation 2 - 7). τ = σn tan (R.log10� S
The sketch of the direct shear-strength test equipment for crushed rock can be seen in Figure 5. Where 1, 2, 3, 4, 5, 6, 7, 8, lastly 9 are respectively the jack and wire-rope, 300 kN load cell, strain indicator, hydraulic hand-pump and piston, normal load cap, dial gauge, boxlike apparatus, upper apparatus’s prop, lastly frame (Figure 6).
Figure 6. Equipment for testing direct shear-strength of debris rock
Figure 5. The sketch of the direct shear-strength test equipment of debris rock
35
INDONESIAN MINING JOURNAL Vol. 23, No. 1, April 2020 : 31 - 42
The values obtained from τ and σn were used in equation (7), along with the value of S and Φr to acquire the value of back-calculated R. Empirical R The estimated empirical R-value was performed based on the degree of roundedness from the roundness test and n% of the physical property test. The roundness test was carried out by referring to the Power’s Scale of Roundness (Powers, 1953) with the calculation of the Roundness Grade suggested by Wadell (1932) (Figure 7). RII is the radius of the largest inscribed sphere where ri is the radius of curvature of
particle corners, and n is the number of particle corners measured (Figure 8), the roundness grade was calculated as follow:
Roundness Grade = ∑ �
riRII�n
i=1
n ....................... (8)
From the degree of roundedness value, as well as the porosity value (n%) of the debris rock that was generated from the physical properties test of the debris rock, the R-value can be estimated using the empirical porosity and the roundedness for estimating the R graph (Figure 9).
Figure 7. Chart for estimating the roundness and sphericity of particles based upon comparison with particles of known sphericity and roundness (Powers, 1953)
Figure 8. The sketch of 2 dimensional particles showing definitions for the radii of individual (r1, r2, etc.) and the maximum inscribed circle (R) (Krumbein, 1940)
36
A Shear Test of Debris Rock at Laboratory Scale, Saviqri Suryaputra et al.
Figure 9. Empirical porosity and roundedness for estimating the R graph (Barton and Kjaernsli, 1981) RESULTS AND DISCUSSION Comparison of the Debris Rock Shear Strength from All Three Compositions From all conducted tests, a shear-strength curve of the crushed rock can be formed based on the Barton and Kjaernsli criteria for the three compositions with each back-calculated R and empirical R (Table 2). From Figure 10, it is known that each shear-strength envelope which is formed from the Barton & Kjaernsli equation comes near to
the points of maximum shear stress magnitude (τ) for each normal stress (σn). This stress acts on the direct shear-strength test of crushed rock in terms of verification as in the index of shear strength test of rock joints (Barton and Choubey, 1977). In addition, composition III had the highest shear strength among other compositions, while composition II had the lowest shear strength. The magnitude of back calculated R in the strength characteristics of crushed rock appears to have a large role in the crushed-rock shear strength variation.
Table 2. Normal stress and shear stress values from debris-rock direct shear tests; S, back calculated R, and ϕr that formed debris-rock shear strength equation
INDONESIAN MINING JOURNAL Vol. 23, No. 1, April 2020 : 31 - 42
Figure 10. Comparison of the crushed-rock shear strength envelopes between the three compositions using back calculated R.
The magnitude of R obtained by back calculation appears to be influenced greatly by the specific rock fragment sizes that predominates the composition. The larger the fragment size that was predominant in a composition, the greater the back calculated R-value obtained will be; and vice versa at the smaller fragment size (Table 3). Figure 11 shows that composition II had the lowest shear strength. Meanwhile, composition I and composition III had higher shear strength. This relationship was similar to that shown by
the envelope of rock-strength characteristics which was generated from the back-calculated R (Figure 10), but the difference in the shear strength between compositions, in this case, was much smaller or arguably very similar. Eventually, the orders of the shear-strength characteristics between compositions I and III began to differentiate when the normal stress which was applied reaches 0.02 MPa. There were 2 important parameters influencing the process of estimating R values empirically, namely the degree of roundedness and the porosity of the crushed rock.
Table 3. Normal stress and shear stress values from crushed-rock direct shear tests; S, empirical R, and ϕr that formed crushed-rock shear strength equation
τ = σn tan (15.273 log10 (3.192/σn)+33.273)(Barton & Kjaernsli)
τ = σn tan (13.938 log10 (3.510/σn)+33.273)(Barton & Kjaernsli)
τ = σn tan (11.770 log10 (3.836/σn)+33.273)(Barton & Kjaernsli)
38
A Shear Test of Debris Rock at Laboratory Scale, Saviqri Suryaputra et al.
Figure 11. Comparison of the crushed-rock shear strength envelopes between the three compositions using empirical R
In the roundness test which had been carried out to determine the degree of roundedness, the rock that allowed testing to be done towards each composition was material in the coarse category (50 mm - 1 mm in size). This was primarily because the material in medium category (<1 mm - 0.25 mm in size) and fine category (<0.25 mm in size) had a very small size so that the macroscopic degree of roundedness cannot be calculated. Thus, the results on the degree of roundedness from testing the three compositions with a total of 60 samples for each composition had very similar results. Since 1 of the 2 parameters that influences the process of estimating R value empirically had very similar values, the empirical R-values obtained also had very similar values. With the empirical R-values that were identical and the R magnitude itself as one of the characteristics of crushed-rock strength appeared to have a significant role in the variety of shear strength of the rock produced, thus the shear strength of the rock produced did not have much difference. Consequently, these deficiencies in determining empirical R-value were likely to lead the previous research to recommend the determination of this type of R could only be used for preliminary studies. In conducting more detailed investigations on the shear strength of crushed rock for a design of construction, the R-value obtained from back
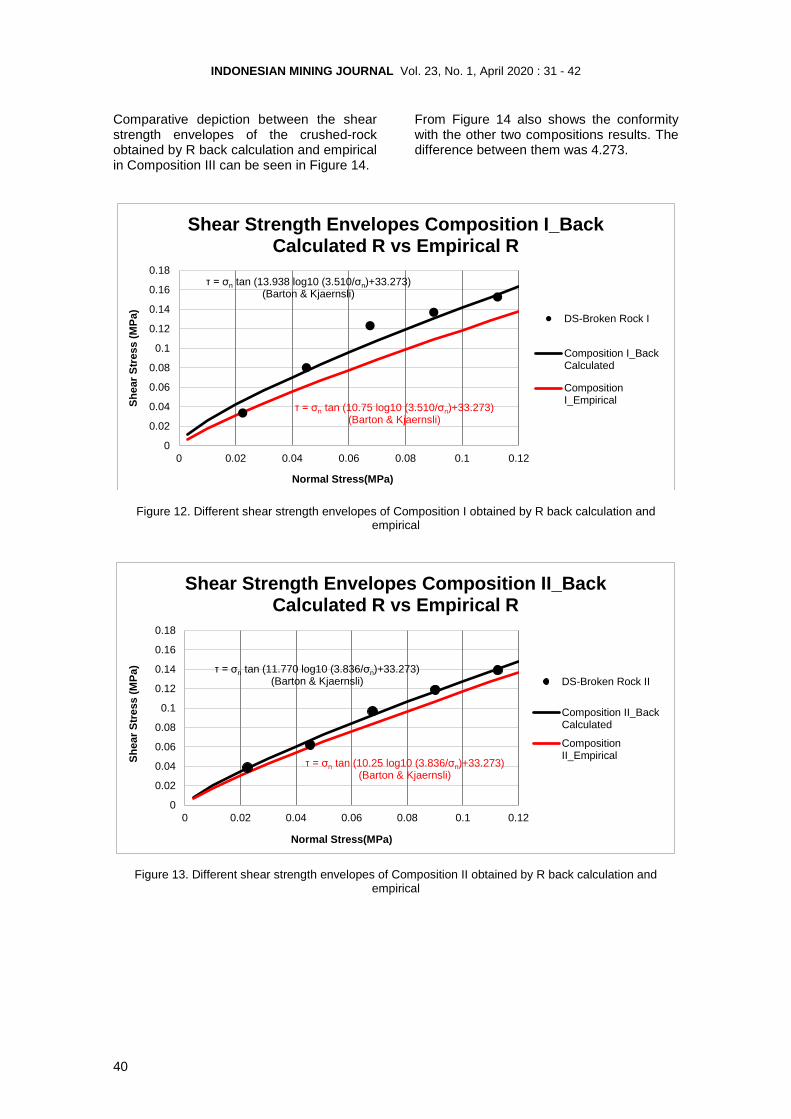
calculation is used (Barton and Kjaernsli, 1981). Comparison of the Shear Strength of Crushed Rock with Back Calculated R and Empirical R Visualization of the comparison between the shear strength envelopes of the crushed rock obtained by R back-calculation and empirical in Composition I can be seen in Figure 12. From Figure 12, it is known that the characteristics of the rock’s shear strength in Composition I obtained by using the back-calculated R had a higher value compared to those using the empirical one. This was because the R-value obtained through back calculation was higher than the R-value obtained empirically. The difference between them was 3.188. Comparative visualization between the shear strength envelopes of the crushed rock obtained by R back calculation and empirical in Composition II can be seen in Figure 13. From Figure 13, it is shown that the characteristics of the rock’s shear strength in Composition II have a similarity with the Composition I where the back calculated R produced higher values than the empirical R. The difference between them was 1.52.
0
0.02
0.04
0.06
0.08
0.1
0.12
0.14
0.16
0.18
0 0.02 0.04 0.06 0.08 0.1 0.12
Shea
r Str
ess
(MPa
)
Normal Stress(MPa)
Shear Strength Envelope_Empirical R
DS-Broken Rock I
Composition I
DS-Broken Rock II
Composition II
DS-Broken Rock III
Composition IIIτ = σn tan (10.75 log10 (3.510/σn)+33.273)
(Barton & Kjaernsli)
τ = σn tan (10.25 log10 (3.836/σn)+33.273)(Barton & Kjaernsli)
τ = σn tan (11 log10 (3.192/σn)+33.273)(Barton & Kjaernsli)
39
INDONESIAN MINING JOURNAL Vol. 23, No. 1, April 2020 : 31 - 42
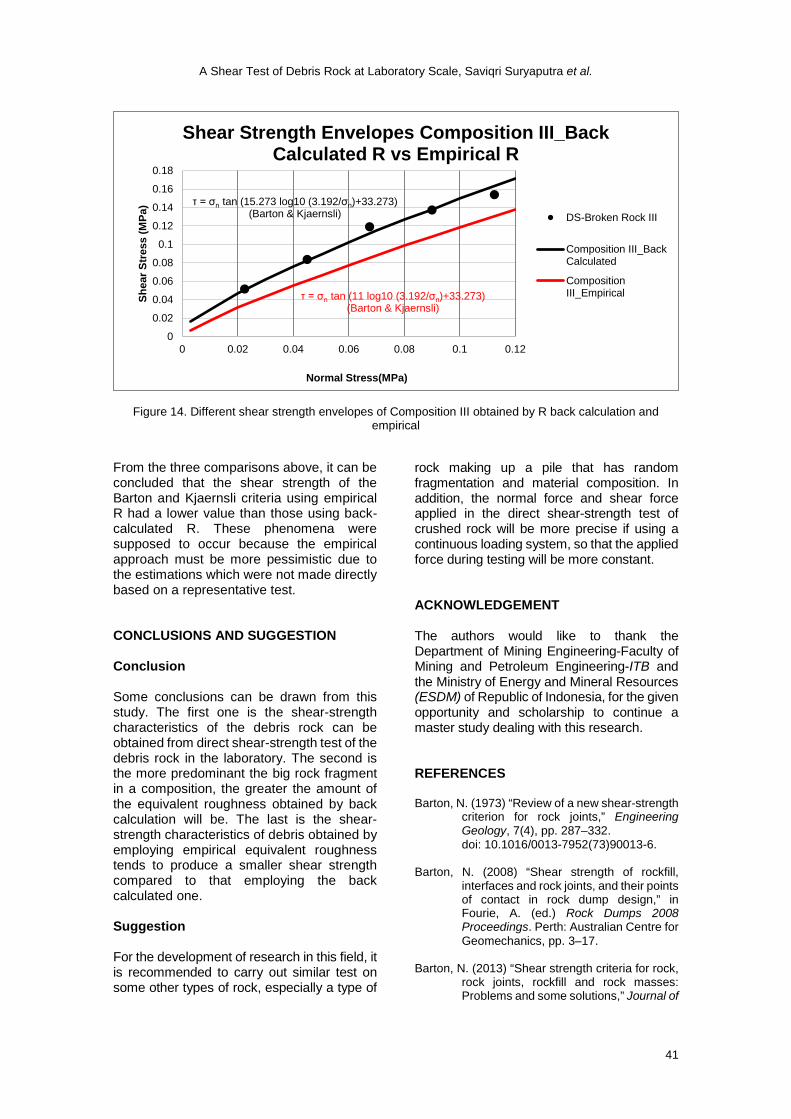
Comparative depiction between the shear strength envelopes of the crushed-rock obtained by R back calculation and empirical in Composition III can be seen in Figure 14.
From Figure 14 also shows the conformity with the other two compositions results. The difference between them was 4.273.
Figure 12. Different shear strength envelopes of Composition I obtained by R back calculation and empirical
Figure 13. Different shear strength envelopes of Composition II obtained by R back calculation and empirical
0
0.02
0.04
0.06
0.08
0.1
0.12
0.14
0.16
0.18
0 0.02 0.04 0.06 0.08 0.1 0.12
Shea
r Str
ess
(MPa
)
Normal Stress(MPa)
Shear Strength Envelopes Composition I_Back Calculated R vs Empirical R
DS-Broken Rock I
Composition I_BackCalculated
CompositionI_Empirical
τ = σn tan (13.938 log10 (3.510/σn)+33.273)(Barton & Kjaernsli)
τ = σn tan (10.75 log10 (3.510/σn)+33.273)(Barton & Kjaernsli)
0
0.02
0.04
0.06
0.08
0.1
0.12
0.14
0.16
0.18
0 0.02 0.04 0.06 0.08 0.1 0.12
Shea
r Str
ess
(MPa
)
Normal Stress(MPa)
Shear Strength Envelopes Composition II_Back Calculated R vs Empirical R
DS-Broken Rock II
Composition II_BackCalculated
CompositionII_Empirical
τ = σn tan (11.770 log10 (3.836/σn)+33.273)(Barton & Kjaernsli)
τ = σn tan (10.25 log10 (3.836/σn)+33.273)(Barton & Kjaernsli)
40
A Shear Test of Debris Rock at Laboratory Scale, Saviqri Suryaputra et al.
Figure 14. Different shear strength envelopes of Composition III obtained by R back calculation and empirical
From the three comparisons above, it can be concluded that the shear strength of the Barton and Kjaernsli criteria using empirical R had a lower value than those using back-calculated R. These phenomena were supposed to occur because the empirical approach must be more pessimistic due to the estimations which were not made directly based on a representative test. CONCLUSIONS AND SUGGESTION Conclusion Some conclusions can be drawn from this study. The first one is the shear-strength characteristics of the debris rock can be obtained from direct shear-strength test of the debris rock in the laboratory. The second is the more predominant the big rock fragment in a composition, the greater the amount of the equivalent roughness obtained by back calculation will be. The last is the shear-strength characteristics of debris obtained by employing empirical equivalent roughness tends to produce a smaller shear strength compared to that employing the back calculated one. Suggestion For the development of research in this field, it is recommended to carry out similar test on some other types of rock, especially a type of
rock making up a pile that has random fragmentation and material composition. In addition, the normal force and shear force applied in the direct shear-strength test of crushed rock will be more precise if using a continuous loading system, so that the applied force during testing will be more constant. ACKNOWLEDGEMENT The authors would like to thank the Department of Mining Engineering-Faculty of Mining and Petroleum Engineering-ITB and the Ministry of Energy and Mineral Resources (ESDM) of Republic of Indonesia, for the given opportunity and scholarship to continue a master study dealing with this research. REFERENCES Barton, N. (1973) “Review of a new shear-strength
criterion for rock joints,” Engineering Geology, 7(4), pp. 287–332. doi: 10.1016/0013-7952(73)90013-6.
Barton, N. (2008) “Shear strength of rockfill, interfaces and rock joints, and their points of contact in rock dump design,” in Fourie, A. (ed.) Rock Dumps 2008 Proceedings. Perth: Australian Centre for Geomechanics, pp. 3–17.
Barton, N. (2013) “Shear strength criteria for rock,
rock joints, rockfill and rock masses: Problems and some solutions,” Journal of
0
0.02
0.04
0.06
0.08
0.1
0.12
0.14
0.16
0.18
0 0.02 0.04 0.06 0.08 0.1 0.12
Shea
r Str
ess
(MPa
)
Normal Stress(MPa)
Shear Strength Envelopes Composition III_Back Calculated R vs Empirical R
DS-Broken Rock III
Composition III_BackCalculated
CompositionIII_Empirical
τ = σn tan (15.273 log10 (3.192/σn)+33.273)(Barton & Kjaernsli)
τ = σn tan (11 log10 (3.192/σn)+33.273)(Barton & Kjaernsli)
41
INDONESIAN MINING JOURNAL Vol. 23, No. 1, April 2020 : 31 - 42
Rock Mechanics and Geotechnical Engineering. Taibah University, 5(4), pp. 249–261. doi: 10.1016/j.jrmge.2013.05.008.
Barton, N. (2016) “Non-linear shear strength for rock, rock joints, rockfill and interfaces,” Innovative Infrastructure Solutions, 1(1), p. 30. doi: 10.1007/s41062-016-0011-1.
Barton, N. and Choubey, V. (1977) “The shear
strength of rock joints in theory and practice,” Rock Mechanics Felsmechanik Mecanique des Roches, 10(1–2), pp. 1–54. doi: 10.1007/BF01261801.
Barton, N. and Kjaernsli, B. (1981) “Shear strength
of rockfill,” Journal of the Geotechnical Egnineering Division, 107(GT7), pp. 873–891.
Krumbein, W. C. (1940) “Flood gravel of San
Gabriel Canyon, California,” Geological Society of America Bulletin, 51(5), pp. 639–676. doi: 10.1130/GSAB-51-639.
Li, Y. R. and Aydin, A. (2010) “Behavior of rounded
granular materials in direct shear: Mechanisms and quantification of fluctuations,” Engineering Geology, 115(1–2), pp. 96–104. doi: 10.1016/j.enggeo.2010.06.008.
Lingga, B. A., Apel, D. B., Sepehri, M. and Pu, Y.
(2019) “Assessment of digital image correlation method in determining large scale cemented rockfill strains,” International Journal of Mining Science and Technology, 29(5), pp. 771–776. doi: 10.1016/j.ijmst.2018.12.002.
Lingga, B. A. and Apel, D. B. (2018) “Shear
properties of cemented rockfills,” Journal of Rock Mechanics and Geotechnical Engineering, 10(4), pp. 635–644. doi: 10.1016/j.jrmge.2018.03.005.
Ma, W. and Wang, T. (2019) “Experimental study
of shear strength features of regenerated rock mass compacted and consolidated by broken soft rocks,” KSCE Journal of Civil Engineering, 23(4), pp. 1839–1848. doi: 10.1007/s12205-019-1831-2.
Mohapatra, S. R., Mishra, S. R., Nithin, S.,
Rajagopal, K. and Sharma, J. (2019) “Effect of box size on dilative behaviour of sand in direct shear test,” in Stalin, V. K. and Muttharam, M. (eds.) Geotechnical Characterisation and Geoenvironmental Engineering. Springer, pp. 111–118. doi: 10.1007/978-981-13-0899-4_14.
Powers, M. C. (1953) “A new roundness scale for sedimentary particles,” SEPM Journal of Sedimentary Research, Vol. 23(2), pp. 117–119. doi: 10.1306/D4269567-2B26-11D7-8648000102C1865D.
Proceq (2017) Betonprüfhammer Concrete Test
Hammer Scléromètre à béton. Schwerzenbach: Proceq.
Skuodis, Š., Norkus, A., Dirgeliene, N. and
Šlečkuviene, A. (2013) “Sand shearing peculiarities using direct shear device,” Procedia Engineering, 57, pp. 1052–1059. doi: 10.1016/j.proeng.2013.04.133.
Suits, L. D., Sheahan, T. C., Bareither, C. A.,
Benson, C. H. and Edil, T. B. (2008) “Reproducibility of direct shear tests conducted on granular backfill materials,” Geotechnical Testing Journal, 31(1), p. 100878. doi: 10.1520/GTJ100878.
Wadell, H. (1932) “Volume, shape, and roundness
of rock particles,” The Journal of Geology, 40(5), pp. 443–451. doi: 10.1086/623964.
Wei, L., Zhang, Y., Zhao, Z., Zhong, X., Liu, S.,
Mao, Y. and Li, J. (2018) “Analysis of mining waste dump site stability based on multiple remote sensing technologies,” Remote Sensing, 10(12), p. 2025. doi: 10.3390/rs10122025.
Wicaksana, Y., Kramadibrata, S., Wattimena, R.
K., Ahmad, M. and Lingga, B. A. (2013) “Simulasi keruntuhan lereng akibat percepatan sentrifugal dengan pemodelan Fisik,” in Proceeding Seminar Geomekanika II. Bandung: Indonesian Rock Mechanics Society, pp. 133–137.
Xu, H., Geng, H., Chen, F., Chen, X. and Qi, L.
(2017) “Strength assessment of broken rock postgrouting reinforcement based on initial broken rock quality and grouting quality,” Mathematical Problems in Engineering, 2017, pp. 1–14. doi: 10.1155/2017/3651765.
Zevgolis, I. E., Deliveris, A. V. and Koukouzas, N.
C. (2019) “Slope failure incidents and other stability concerns in surface lignite mines in Greece,” Journal of Sustainable Mining, 18(4), pp. 182–197. doi: 10.1016/j.jsm.2019.07.001.


![IS 12608 (1989): rock joints-direct shear strength ...IS 12608 (1989): rock joints-direct shear strength-laboratory method of determination [CED 48: Rock Mechanics] METHODFOR ... 3.1.1](https://static.documents.pub/doc/80x56/5e6de58548a3964b42128b08/is-12608-1989-rock-joints-direct-shear-strength-is-12608-1989-rock-joints-direct.jpg)


