158
| Date post: | 09-Mar-2018 |
| Category: |
Documents |
| Upload: | nguyentuong |
| View: | 220 times |
| Download: | 2 times |

Overview Do Voters A�ect or Elect Policies? The Value of School Facility Investments Media Bias and In�uence Momentum and Social Learning in Presidential Primaries
A Short Course in Political Economy
Brian Knight1
1Brown University
November 15, 2014

Overview Do Voters A�ect or Elect Policies? The Value of School Facility Investments Media Bias and In�uence Momentum and Social Learning in Presidential Primaries
Outline
1 Overview
2 Do Voters A�ect or Elect Policies?
3 The Value of School Facility Investments
4 Media Bias and In�uence
5 Momentum and Social Learning in Presidential Primaries
2/60

Overview Do Voters A�ect or Elect Policies? The Value of School Facility Investments Media Bias and In�uence Momentum and Social Learning in Presidential Primaries
Political economy tradition
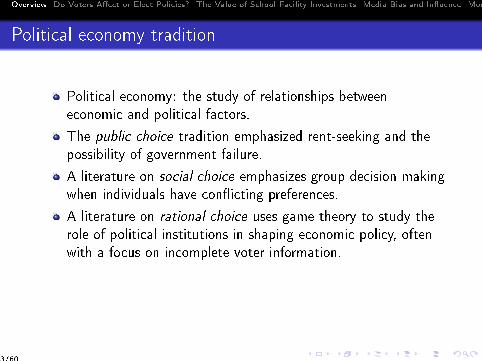
Political economy: the study of relationships between
economic and political factors.
The public choice tradition emphasized rent-seeking and the
possibility of government failure.
A literature on social choice emphasizes group decision making
when individuals have con�icting preferences.
A literature on rational choice uses game theory to study the
role of political institutions in shaping economic policy, often
with a focus on incomplete voter information.
While these theoretical contributions have continued, the
literature has also recently gained an empirical focus, and my
course provides a selective overview of these contributions.
3/60

Overview Do Voters A�ect or Elect Policies? The Value of School Facility Investments Media Bias and In�uence Momentum and Social Learning in Presidential Primaries
Political economy tradition
Political economy: the study of relationships between
economic and political factors.
The public choice tradition emphasized rent-seeking and the
possibility of government failure.
A literature on social choice emphasizes group decision making
when individuals have con�icting preferences.
A literature on rational choice uses game theory to study the
role of political institutions in shaping economic policy, often
with a focus on incomplete voter information.
While these theoretical contributions have continued, the
literature has also recently gained an empirical focus, and my
course provides a selective overview of these contributions.
3/60

Overview Do Voters A�ect or Elect Policies? The Value of School Facility Investments Media Bias and In�uence Momentum and Social Learning in Presidential Primaries
What can political economy learn from public economics?
The tradition of normative analysis in public economics,
focused on characterizing optimal policies, can be extended to
political economy.
In particular, political economists have characterized optimal
institutions, the constitution that leads to the implementation
of optimal policies.
For example, Maskin and Tirole (2004) study whether o�cials
should to accountable (�politicians�) or nonaccountable
("judges") in a model in which elections allow voters to
monitor o�cials but also provide incentive for o�cials to
�pander� to public opinion.
Hummel and Knight (2014) investigate whether sequential
elections or simultaneous elections are better for voter welfare.
4/60

Overview Do Voters A�ect or Elect Policies? The Value of School Facility Investments Media Bias and In�uence Momentum and Social Learning in Presidential Primaries
What can public economics learn from political economy?
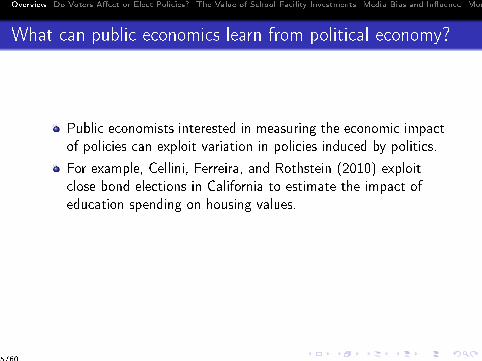
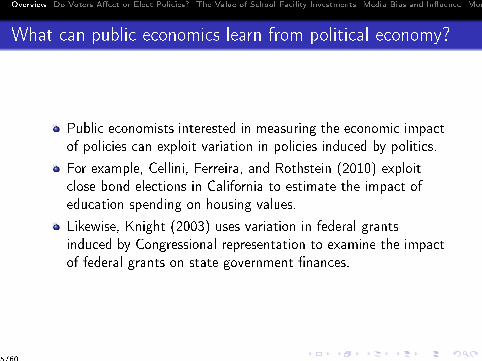
Public economists interested in measuring the economic impact
of policies can exploit variation in policies induced by politics.
For example, Cellini, Ferreira, and Rothstein (2010) exploit
close bond elections in California to estimate the impact of
education spending on housing values.
Likewise, Knight (2003) uses variation in federal grants
induced by Congressional representation to examine the impact
of federal grants on state government �nances.
5/60
Overview Do Voters A�ect or Elect Policies? The Value of School Facility Investments Media Bias and In�uence Momentum and Social Learning in Presidential Primaries
What can public economics learn from political economy?
Public economists interested in measuring the economic impact
of policies can exploit variation in policies induced by politics.
For example, Cellini, Ferreira, and Rothstein (2010) exploit
close bond elections in California to estimate the impact of
education spending on housing values.
Likewise, Knight (2003) uses variation in federal grants
induced by Congressional representation to examine the impact
of federal grants on state government �nances.
5/60

Overview Do Voters A�ect or Elect Policies? The Value of School Facility Investments Media Bias and In�uence Momentum and Social Learning in Presidential Primaries
Outline
Today I will focus on two areas of recent research activity.
Voting and Regression Discontinuity
Lee, Moretti, and Butler (2004)Cellini, Ferreira, and Rothstein (2010)
Voter Learning, the Media, and Sequential Elections
Chiang and Knight (2010)Knight and Schi� (2010) and Knight and Hummel (2014)
6/60

Overview Do Voters A�ect or Elect Policies? The Value of School Facility Investments Media Bias and In�uence Momentum and Social Learning in Presidential Primaries
Outline
1 Overview
2 Do Voters A�ect or Elect Policies?
3 The Value of School Facility Investments
4 Media Bias and In�uence
5 Momentum and Social Learning in Presidential Primaries
7/60

Overview Do Voters A�ect or Elect Policies? The Value of School Facility Investments Media Bias and In�uence Momentum and Social Learning in Presidential Primaries
Introduction
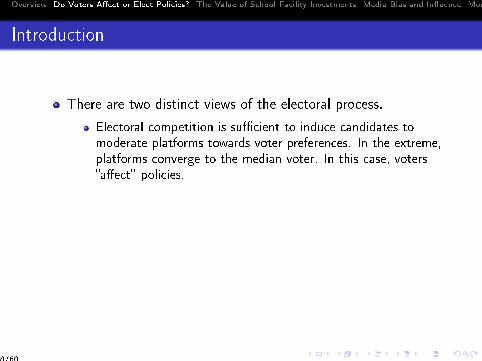
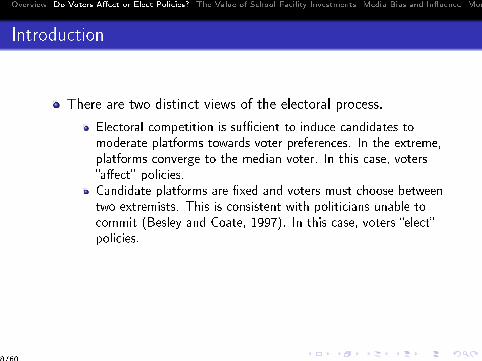
There are two distinct views of the electoral process.
Electoral competition is su�cient to induce candidates tomoderate platforms towards voter preferences. In the extreme,platforms converge to the median voter. In this case, voters�a�ect� policies.Candidate platforms are �xed and voters must choose betweentwo extremists. This is consistent with politicians unable tocommit (Besley and Coate, 1997). In this case, voters �elect�policies.
Whether voters �a�ect� or �elect� policies has important
implications for voter welfare, redistricting, and political
polarization.
8/60
Overview Do Voters A�ect or Elect Policies? The Value of School Facility Investments Media Bias and In�uence Momentum and Social Learning in Presidential Primaries
Introduction
There are two distinct views of the electoral process.
Electoral competition is su�cient to induce candidates tomoderate platforms towards voter preferences. In the extreme,platforms converge to the median voter. In this case, voters�a�ect� policies.
Candidate platforms are �xed and voters must choose betweentwo extremists. This is consistent with politicians unable tocommit (Besley and Coate, 1997). In this case, voters �elect�policies.
Whether voters �a�ect� or �elect� policies has important
implications for voter welfare, redistricting, and political
polarization.
8/60
Overview Do Voters A�ect or Elect Policies? The Value of School Facility Investments Media Bias and In�uence Momentum and Social Learning in Presidential Primaries
Introduction
There are two distinct views of the electoral process.
Electoral competition is su�cient to induce candidates tomoderate platforms towards voter preferences. In the extreme,platforms converge to the median voter. In this case, voters�a�ect� policies.Candidate platforms are �xed and voters must choose betweentwo extremists. This is consistent with politicians unable tocommit (Besley and Coate, 1997). In this case, voters �elect�policies.
Whether voters �a�ect� or �elect� policies has important
implications for voter welfare, redistricting, and political
polarization.
8/60
Overview Do Voters A�ect or Elect Policies? The Value of School Facility Investments Media Bias and In�uence Momentum and Social Learning in Presidential Primaries
Overview
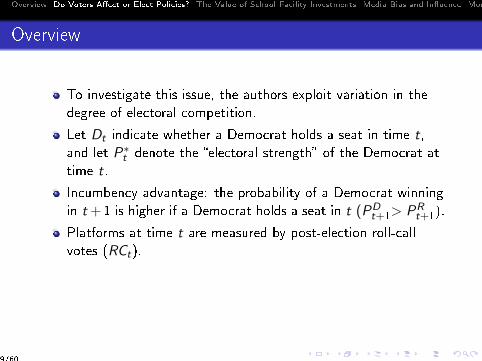
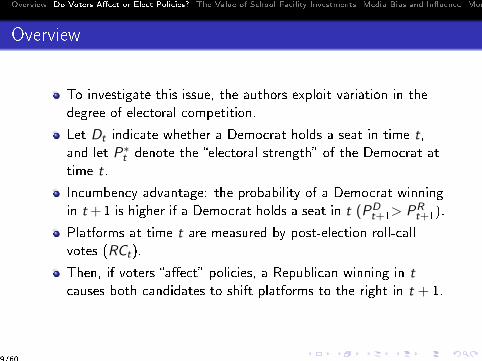
To investigate this issue, the authors exploit variation in the
degree of electoral competition.
Let Dt indicate whether a Democrat holds a seat in time t,and let P∗
t denote the �electoral strength� of the Democrat at
time t.
Incumbency advantage: the probability of a Democrat winning
in t+1 is higher if a Democrat holds a seat in t (PDt+1> PR
t+1).
Platforms at time t are measured by post-election roll-call
votes (RCt).
Then, if voters �a�ect� policies, a Republican winning in tcauses both candidates to shift platforms to the right in t + 1.
If voters �elect� policies, candidate platforms are unchanged.
9/60

Overview Do Voters A�ect or Elect Policies? The Value of School Facility Investments Media Bias and In�uence Momentum and Social Learning in Presidential Primaries
Overview
To investigate this issue, the authors exploit variation in the
degree of electoral competition.
Let Dt indicate whether a Democrat holds a seat in time t,and let P∗
t denote the �electoral strength� of the Democrat at
time t.
Incumbency advantage: the probability of a Democrat winning
in t+1 is higher if a Democrat holds a seat in t (PDt+1> PR
t+1).
Platforms at time t are measured by post-election roll-call
votes (RCt).
Then, if voters �a�ect� policies, a Republican winning in tcauses both candidates to shift platforms to the right in t + 1.
If voters �elect� policies, candidate platforms are unchanged.
9/60

Overview Do Voters A�ect or Elect Policies? The Value of School Facility Investments Media Bias and In�uence Momentum and Social Learning in Presidential Primaries
Voters �elect� policies
D R
D R
D R
D R
Dt=1 Dt=0
RCt
RCt+1
10/60

Overview Do Voters A�ect or Elect Policies? The Value of School Facility Investments Media Bias and In�uence Momentum and Social Learning in Presidential Primaries
Voters �a�ect� policies
D R
Dt=1 Dt=0
RCt
RCt+1D R
D R
D R
11/60

Overview Do Voters A�ect or Elect Policies? The Value of School Facility Investments Media Bias and In�uence Momentum and Social Learning in Presidential Primaries
Statistical framework
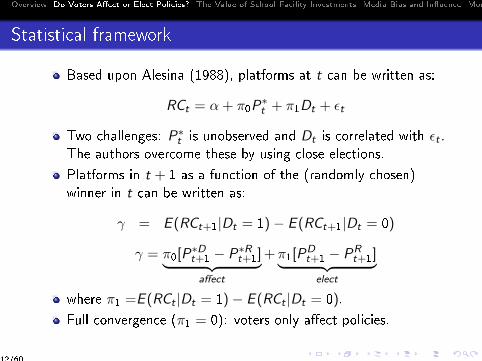
Based upon Alesina (1988), platforms at t can be written as:
RCt = α+ π0P∗t + π1Dt + εt
Two challenges: P∗t is unobserved and Dt is correlated with εt .
The authors overcome these by using close elections.
Platforms in t + 1 as a function of the (randomly chosen)
winner in t can be written as:
γ = E (RCt+1|Dt = 1)− E (RCt+1|Dt = 0)
γ = π0[P∗Dt+1 − P∗R
t+1]︸ ︷︷ ︸affect
+π1[PDt+1 − PR
t+1]︸ ︷︷ ︸elect
where π1 =E (RCt |Dt = 1)− E (RCt |Dt = 0).
Full convergence (π1 = 0): voters only a�ect policies.
Full divergence (π0 = 0): voters only elect policies.
12/60

Overview Do Voters A�ect or Elect Policies? The Value of School Facility Investments Media Bias and In�uence Momentum and Social Learning in Presidential Primaries
Statistical framework
Based upon Alesina (1988), platforms at t can be written as:
RCt = α+ π0P∗t + π1Dt + εt
Two challenges: P∗t is unobserved and Dt is correlated with εt .
The authors overcome these by using close elections.
Platforms in t + 1 as a function of the (randomly chosen)
winner in t can be written as:
γ = E (RCt+1|Dt = 1)− E (RCt+1|Dt = 0)
γ = π0[P∗Dt+1 − P∗R
t+1]︸ ︷︷ ︸affect
+π1[PDt+1 − PR
t+1]︸ ︷︷ ︸elect
where π1 =E (RCt |Dt = 1)− E (RCt |Dt = 0).
Full convergence (π1 = 0): voters only a�ect policies.
Full divergence (π0 = 0): voters only elect policies.
12/60

Overview Do Voters A�ect or Elect Policies? The Value of School Facility Investments Media Bias and In�uence Momentum and Social Learning in Presidential Primaries
Statistical framework
Based upon Alesina (1988), platforms at t can be written as:
RCt = α+ π0P∗t + π1Dt + εt
Two challenges: P∗t is unobserved and Dt is correlated with εt .
The authors overcome these by using close elections.
Platforms in t + 1 as a function of the (randomly chosen)
winner in t can be written as:
γ = E (RCt+1|Dt = 1)− E (RCt+1|Dt = 0)
γ = π0[P∗Dt+1 − P∗R
t+1]︸ ︷︷ ︸affect
+π1[PDt+1 − PR
t+1]︸ ︷︷ ︸elect
where π1 =E (RCt |Dt = 1)− E (RCt |Dt = 0).
Full convergence (π1 = 0): voters only a�ect policies.
Full divergence (π0 = 0): voters only elect policies.12/60

Overview Do Voters A�ect or Elect Policies? The Value of School Facility Investments Media Bias and In�uence Momentum and Social Learning in Presidential Primaries
Data
The authors examine various measures of voting records in the
U.S. House of Representatives during the period 1946-1995
Americans for Democratic Action (ADA) scores, which arehigher for more liberal voting patterns.DW-Nominate scores (Poole and Rosenthal, 1985).
The regression analysis is restricted to close elections, de�ned
as cases where the Democratic vote share was between 48 and
52 percent.
The authors show that the standard conditions for the RD
design are satis�ed (e.g., there are no discontinuities in district
characteristics at 50 percent).
13/60
Overview Do Voters A�ect or Elect Policies? The Value of School Facility Investments Media Bias and In�uence Momentum and Social Learning in Presidential Primaries
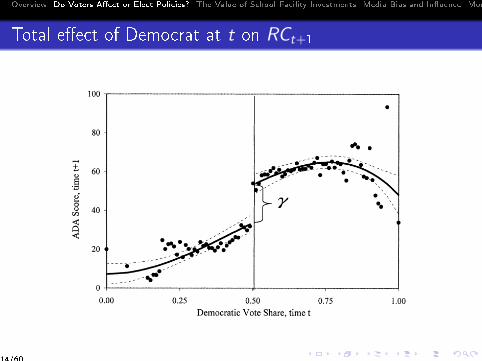
Total e�ect of Democrat at t on RCt+1
828 QUARTERLY JOURNAL OF ECONOMICS
100
0.00 0.25 0.50 0.75 1.00
Democratic Vote Share, time t
Figure I
Total Effect of Initial Win on Future ADA Scores: 7 This figure plots ADA scores after the election at time t + 1 against the
Democrat vote share, time t. Each circle is the average ADA score within 0.01 intervals of the Democrat vote share. Solid lines are fitted values from fourth order polynomial regressions on either side of the discontinuity. Dotted lines are
pointwise 95 percent confidence intervals. The discontinuity gap estimates
7 = iroiPKx
- PT+i) + irxGP??!
- PFEi).
N-v-/ V-v-/ "Affect" "Elect"
be a continuous and smooth function of vote shares everywhere,
except at the threshold that determines party membership. There
is a large discontinuous jump in ADA scores at the 50 percent threshold. Compare districts where the Democrat candidate
barely lost in period t (for example, vote share is 49.5 percent), with districts where the Democrat candidate barely won (for
example, vote share is 50.5 percent). If the regression disconti
nuity design is valid, the two groups of districts should appear ex
ante similar in every respect?on average. The difference will be
that in one group, the Democrats will be the incumbent for the next election (t 4- 1), and in the other it will be the Republicans. Districts where the Democrats are the incumbent party for elec
tion t + 1 elect representatives who have much higher ADA
scores, compared with districts where the Republican candidate
14/60
Overview Do Voters A�ect or Elect Policies? The Value of School Facility Investments Media Bias and In�uence Momentum and Social Learning in Presidential Primaries
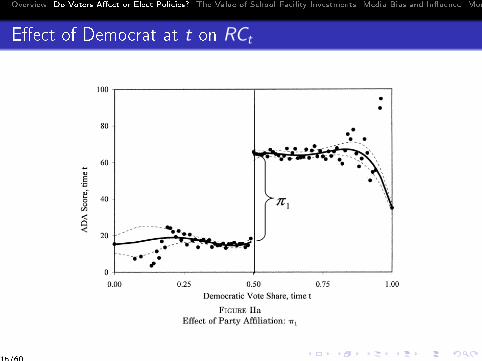
E�ect of Democrat at t on RCt
830 QUARTERLY JOURNAL OF ECONOMICS
<
<
0.00 0.25 0.50 0.75
Democratic Vote Share, time t
Figure lia
Effect of Party Affiliation: -n1
1.00
M#.-#.)
0.00 0.25 0.50 0.75
Democratic Vote Share, time t
1.00
Figure lib
Effect of Initial Win on Winning Next Election: {Pf+1 -
Pf+1)
Top panel plots ADA scores after the election at time t against the Democrat vote share, time t. Bottom panel plots probability of Democrat victory at t + 1
against Democrat vote share, time t. See caption of Figure III for more details.
15/60

Overview Do Voters A�ect or Elect Policies? The Value of School Facility Investments Media Bias and In�uence Momentum and Social Learning in Presidential Primaries
Incumbency advantage
830 QUARTERLY JOURNAL OF ECONOMICS
<
<
0.00 0.25 0.50 0.75
Democratic Vote Share, time t
Figure lia
Effect of Party Affiliation: -n1
1.00
M#.-#.)
0.00 0.25 0.50 0.75
Democratic Vote Share, time t
1.00
Figure lib
Effect of Initial Win on Winning Next Election: {Pf+1 -
Pf+1)
Top panel plots ADA scores after the election at time t against the Democrat vote share, time t. Bottom panel plots probability of Democrat victory at t + 1
against Democrat vote share, time t. See caption of Figure III for more details. 16/60
Overview Do Voters A�ect or Elect Policies? The Value of School Facility Investments Media Bias and In�uence Momentum and Social Learning in Presidential Primaries
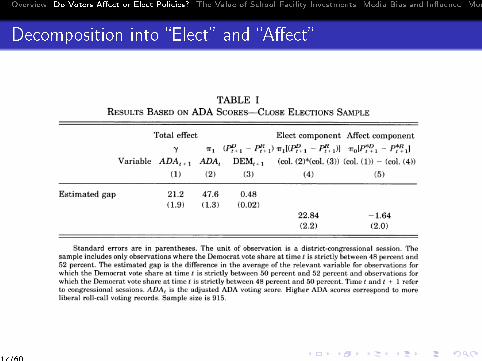
Decomposition into �Elect� and �A�ect�
832 QUARTERLY JOURNAL OF ECONOMICS
TABLE I Results Based on ADA Scores?Close Elections Sample
Total effect Elect component Affect component
7 ^ (Pf+1-/f4l)^[(P?+1-Pf+1)] TTolP*?! -
PtR+1\ Variable ADAt + l ADAt DEM, + 1 (col. (2)*(col. (3)) (col. (1))
- (col. (4))
(1) (2) (3) (4) (5)
Estimated gap 21.2 47.6 0.48
(1.9) (1.3) (0.02) 22.84 -1.64
(2.2) (2.0)
Standard errors are in parentheses. The unit of observation is a district-congressional session. The sample includes only observations where the Democrat vote share at time t is strictly between 48 percent and 52 percent. The estimated gap is the difference in the average of the relevant variable for observations for which the Democrat vote share at time t is strictly between 50 percent and 52 percent and observations for which the Democrat vote share at time t is strictly between 48 percent and 50 percent. Time t and t + 1 refer to congressional sessions. ADAt is the adjusted ADA voting score. Higher ADA scores correspond to more liberal roll-call voting records. Sample size is 915.
primarily elect policies (full divergence) rather than affect poli cies (partial convergence).
Here we quantify our estimates more precisely. In the analy sis that follows, we restrict our attention to "close elections"?
where the Democrat vote share in time t is strictly between 48
and 52 percent. As Figures I and II show, the difference between
barely elected Democrat and Republican districts among these elections will provide a reasonable approximation to the discon
tinuity gaps. There are 915 observations, where each observation
is a district-year.20
Table I, column (1), reports the estimated total effect 7, the
size of the jump in Figure I. Specifically, column (1) shows the difference in the average ADAt + 1 for districts for which the
Democrat vote share at time t is strictly between 50 percent and
52 percent and districts for which the Democrat vote share at
time t is strictly between 48 percent and 50 percent. The esti
mated difference is 21.2.
In column (2) we estimate the coefficient nly which is equal to
the size of the jump in Figure Ha. The estimate is the difference
in the average ADAt for districts for which the Democrat vote
20. In 68 percent of cases, the representative in period t + 1 is the same as the representative in period t. The distribution of close elections is fairly uniform across the years. In a typical year there are about 40 close elections. The year with the smallest number is 1988, with twelve close elections. The year with the largest number is 1966, with 92 close elections.
17/60
Overview Do Voters A�ect or Elect Policies? The Value of School Facility Investments Media Bias and In�uence Momentum and Social Learning in Presidential Primaries
Outline
1 Overview
2 Do Voters A�ect or Elect Policies?
3 The Value of School Facility Investments
4 Media Bias and In�uence
5 Momentum and Social Learning in Presidential Primaries
18/60

Overview Do Voters A�ect or Elect Policies? The Value of School Facility Investments Media Bias and In�uence Momentum and Social Learning in Presidential Primaries
Introduction
Is public spending capitalized into house prices?
If so, is public spending above or below e�cient levels?
If above, an increase in public spending should decreasehousing prices.If below, an increase in public spending should increasehousing prices.
The authors examine the passage of bond elections in
California, which require voter approval, during the period
1988-2005 using data on housing transactions.
19/60

Overview Do Voters A�ect or Elect Policies? The Value of School Facility Investments Media Bias and In�uence Momentum and Social Learning in Presidential Primaries
Introduction
Is public spending capitalized into house prices?
If so, is public spending above or below e�cient levels?
If above, an increase in public spending should decreasehousing prices.
If below, an increase in public spending should increasehousing prices.
The authors examine the passage of bond elections in
California, which require voter approval, during the period
1988-2005 using data on housing transactions.
19/60

Overview Do Voters A�ect or Elect Policies? The Value of School Facility Investments Media Bias and In�uence Momentum and Social Learning in Presidential Primaries
Introduction
Is public spending capitalized into house prices?
If so, is public spending above or below e�cient levels?
If above, an increase in public spending should decreasehousing prices.If below, an increase in public spending should increasehousing prices.
The authors examine the passage of bond elections in
California, which require voter approval, during the period
1988-2005 using data on housing transactions.
19/60

Overview Do Voters A�ect or Elect Policies? The Value of School Facility Investments Media Bias and In�uence Momentum and Social Learning in Presidential Primaries
Introduction
Is public spending capitalized into house prices?
If so, is public spending above or below e�cient levels?
If above, an increase in public spending should decreasehousing prices.If below, an increase in public spending should increasehousing prices.
The authors examine the passage of bond elections in
California, which require voter approval, during the period
1988-2005 using data on housing transactions.
19/60

Overview Do Voters A�ect or Elect Policies? The Value of School Facility Investments Media Bias and In�uence Momentum and Social Learning in Presidential Primaries
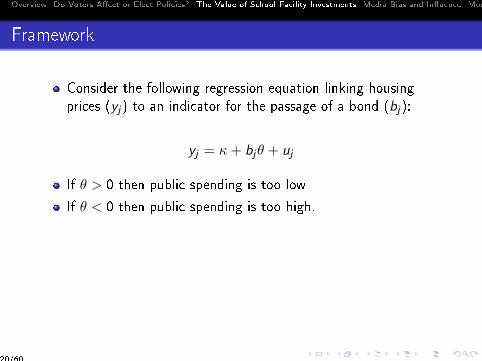
Framework
Consider the following regression equation linking housing
prices (yj) to an indicator for the passage of a bond (bj):
yj = κ+ bjθ + uj
If θ > 0 then public spending is too low
If θ < 0 then public spending is too high.
The key identi�cation problem is that unobserved preferences
for education are likely correlated with both support for bonds
and housing prices.
The authors address this using a regression discontinuity
design, under the assumption that failing municipalities are
otherwise equivalent to passing municipalities.
20/60

Overview Do Voters A�ect or Elect Policies? The Value of School Facility Investments Media Bias and In�uence Momentum and Social Learning in Presidential Primaries
Framework
Consider the following regression equation linking housing
prices (yj) to an indicator for the passage of a bond (bj):
yj = κ+ bjθ + uj
If θ > 0 then public spending is too low
If θ < 0 then public spending is too high.
The key identi�cation problem is that unobserved preferences
for education are likely correlated with both support for bonds
and housing prices.
The authors address this using a regression discontinuity
design, under the assumption that failing municipalities are
otherwise equivalent to passing municipalities.
20/60

Overview Do Voters A�ect or Elect Policies? The Value of School Facility Investments Media Bias and In�uence Momentum and Social Learning in Presidential Primaries
Bond passage increases expenditures and capital outlays
240 QUARTERLY JOURNAL OF ECONOMICS0
50
01
,00
01
,50
0M
ea
n t
ota
l exp
en
ditu
res
pe
r p
up
il
0 5 10Vote share relative to threshold (2 pp bins)
Total expenditures
05
00
1,0
00
1,5
00
Me
an
ca
pita
l ou
tlays
pe
r p
up
il
0 5 10Vote share relative to threshold (2 pp bins)
Year before election
Three years after election
Capital outlays
FIGURE IITotal Spending and Capital Outlays per Pupil, by Vote Share, One Year before
and Three Years after ElectionGraph shows average total expenditures (left panel) and capital outlays (right
panel) per pupil, by the vote share in the focal bond election. Focal elections aregrouped into bins two percentage points wide: measures that passed by between0.001% and 2% are assigned to the 1 bin; those that failed by similar margins areassigned to the −1 bin. Averages are conditional on year fixed effects, and the −1bin is normalized to zero.
after the election, districts where the measure just passed spendabout $1,000 more per pupil, essentially all of it in the capitalaccount.31
Panel A of Table IV presents estimates of the intent-to-treateffect of bond passage on district spending and on state and fed-eral transfers (all in per-pupil terms) over the six years followingthe election, using equation (7).32 Bond passage has no significanteffect on any of the fiscal variables in the first year. We see largeincreases in capital expenditures in years 2, 3, and 4. These in-creases fade by the fifth year following the election. There is noindication of any effect on current spending in any year, and con-fidence intervals rule out effects amounting to more than about
31. It is possible that districts use bond revenues for operating expenses butreport these expenditures in their capital accounts. The CCD data are not used forfinancial oversight, so districts have no obvious incentive to misreport.
32. We make one modification to equation (7): We constrain the τ = 0 coeffi-cients to zero. It is not plausible that bond passage can have effects on that year’sdistrict budget, which will typically have been set well before the election. In anycase, results are insensitive to removing this constraint.
21/60

Overview Do Voters A�ect or Elect Policies? The Value of School Facility Investments Media Bias and In�uence Momentum and Social Learning in Presidential Primaries
Bond passage increases housing pricesTHE VALUE OF SCHOOL FACILITY INVESTMENTS 245
0–0.1
0.1
0.2
0.3
Mean lo
g h
ousi
ng p
rice
s
–10 –5 0 5 10
Vote share relative to threshold (2 pp bins)
Year before election Three years after election
FIGURE VLog Housing Prices by Vote Share, One Year before and Three Years after
ElectionGraph shows average log housing prices by the vote share in the focal bond
election. Focal elections are grouped into bins two percentage points wide: mea-sures that passed by between 0.001% and 2% are assigned to the 1 bin; those thatfailed by similar margins are assigned to the −1 bin. Averages are conditional onyear fixed effects, and the −1 bin is normalized to zero.
uniformly significant after year 0. The estimates indicate that theTOT effect of bond approval in year t is to increase average pricesby 2.8%–3.0% that year, 3.6%–4.1% in year t + 1, 4.2%–8.6% inyears t + 2 through t + 5, and 6.7%–10.1% in t + 6. Figure VI plotsthe coefficients and confidence intervals from the two dynamicspecifications, showing estimates out to year 15. The recursiveestimator shows growing effects through almost the entire period,whereas the one-step estimator yields a flatter profile. Confidenceintervals are wide, particularly for the recursive estimator in laterperiods, and a zero effect is typically at or near the lower boundof these intervals.35
As discussed in Section IV, the TOT estimators assume thathouse prices are unaffected by the likelihood of a future bond
35. We have also estimated models that constrain the TOT to be constantover time. With our one-step estimator, we obtain a point estimate of 4.9% and astandard error of 1.7%.
22/60
Overview Do Voters A�ect or Elect Policies? The Value of School Facility Investments Media Bias and In�uence Momentum and Social Learning in Presidential Primaries
WTP for education spending
In addition to the sign of the e�ect, the authors are interested
in the WTP for an additional dollar of spending.
Consider the passage of a bond increasing spending per-pupil
by $6,000 and �nanced by a $6,000 increase in per-pupil taxes.
If housing prices in a passing municipality increase by θ,relative to a failing municipality, then we have that:
θ = 6, 000 ∗WTP − 6000
Solving for WTP , we have that:
WTP = 1+θ
6, 000
If θ > 0, then WTP > 1 and if θ < 0, then WTP < 1.
23/60

Overview Do Voters A�ect or Elect Policies? The Value of School Facility Investments Media Bias and In�uence Momentum and Social Learning in Presidential Primaries
But failing municipalities are future passing municipalities
THE VALUE OF SCHOOL FACILITY INVESTMENTS 243
–0.5
–0.2
50
0.2
50.5
0.7
51
Effect
on p
r(pass
bond)
0 3 6 9 12 15Year (relative to election)
95% CI
Reduced-form RD estimate
FIGURE IIIEstimates of the Effect of Bond Passage on the Probability of Passing a Later
Bond, by Years since the Focal ElectionGraph shows coefficients and 95% confidence intervals for the effect of measure
passage in year t on the probability of passing a measure in year t + τ . The spec-ification is the ITT regression described in equation (7). Sample includes relativeyears −19 through +19, excluding relative year 0 (when the effect is mechanicallyone).
confidence intervals, particularly at long lags. When we discountall of the estimated effects from the one-step estimator back to thedate of the election, using a discount rate of 7.33% as in Barrowand Rouse (2004), the effect of authorizing a bond is to increasethe present value of future spending by $5,671. This is quite sim-ilar to the size of the average bond proposal in close elections,$6,309.
VII. RESULTS
VII.A. Housing Prices
Figure V provides a graphical analysis of the impact of bondpassage on log housing prices corresponding to the analyses offiscal outcomes in Figure II. Two important patterns emerge.First, housing prices in the year before the election are positivelycorrelated with vote shares, indicating that higher priced districtsare more likely to pass bond measures with larger margins of
24/60

Overview Do Voters A�ect or Elect Policies? The Value of School Facility Investments Media Bias and In�uence Momentum and Social Learning in Presidential Primaries
WTP with dynamics
To address this, consider a two-period case in which failing
municipalities in t pass a bond in t + 1 with probability π.
Then, the relationship between the increase in housing prices
and WTP is given by:
θ = 6, 000 ∗WTP − 6000− πδ[6, 000 ∗WTP − 6000]
WTP is then adjusted as follows:
WTP = 1+θ
6, 000(1− πδ)
See the paper for more general dynamic relationships.
With estimates of π, WTP is estimated to be between $1.13
and $1.50.
25/60
Overview Do Voters A�ect or Elect Policies? The Value of School Facility Investments Media Bias and In�uence Momentum and Social Learning in Presidential Primaries
Other Voting RD Applications
Ferreira and Gyourko, �Do political parties matter? Evidence
from US cities�, Quarterly Journal of Economics, 2009.
Ferraz and Finan, �Electoral accountability and corruption:
Evidence from the audits of local governments�, American
Economic Review, 2011.
Pettersson-Lidbom, Per, "Do Parties Matter for Economic
Outcomes: A Regression Discontinuity Approach", Journal of
the European Economic Association, 2008.
Dal Bó, Dal Bó, and Snyder, �Political dynasties�, The Review
of Economic Studies, 2009.
Folke and Snyder. "Gubernatorial midterm slumps." American
Journal of Political Science, 2012.
Brollo and Nannicini. "Tying your enemy's hands in close
races: The politics of federal transfers in Brazil." American
Political Science Review, 2012.26/60

Overview Do Voters A�ect or Elect Policies? The Value of School Facility Investments Media Bias and In�uence Momentum and Social Learning in Presidential Primaries
Outline
1 Overview
2 Do Voters A�ect or Elect Policies?
3 The Value of School Facility Investments
4 Media Bias and In�uence
5 Momentum and Social Learning in Presidential Primaries
27/60
Overview Do Voters A�ect or Elect Policies? The Value of School Facility Investments Media Bias and In�uence Momentum and Social Learning in Presidential Primaries
Introduction
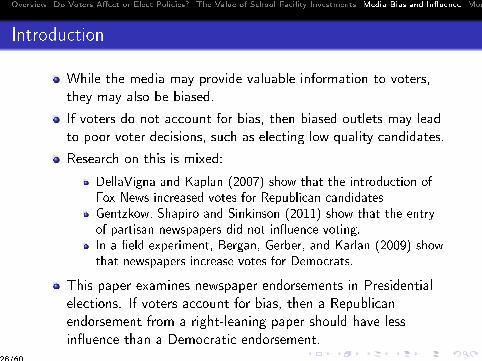
While the media may provide valuable information to voters,
they may also be biased.
If voters do not account for bias, then biased outlets may lead
to poor voter decisions, such as electing low quality candidates.
Research on this is mixed:
DellaVigna and Kaplan (2007) show that the introduction ofFox News increased votes for Republican candidatesGentzkow, Shapiro and Sinkinson (2011) show that the entryof partisan newspapers did not in�uence voting.In a �eld experiment, Bergan, Gerber, and Karlan (2009) showthat newspapers increase votes for Democrats.
This paper examines newspaper endorsements in Presidential
elections. If voters account for bias, then a Republican
endorsement from a right-leaning paper should have less
in�uence than a Democratic endorsement.
28/60

Overview Do Voters A�ect or Elect Policies? The Value of School Facility Investments Media Bias and In�uence Momentum and Social Learning in Presidential Primaries
Introduction
While the media may provide valuable information to voters,
they may also be biased.
If voters do not account for bias, then biased outlets may lead
to poor voter decisions, such as electing low quality candidates.
Research on this is mixed:
DellaVigna and Kaplan (2007) show that the introduction ofFox News increased votes for Republican candidates
Gentzkow, Shapiro and Sinkinson (2011) show that the entryof partisan newspapers did not in�uence voting.In a �eld experiment, Bergan, Gerber, and Karlan (2009) showthat newspapers increase votes for Democrats.
This paper examines newspaper endorsements in Presidential
elections. If voters account for bias, then a Republican
endorsement from a right-leaning paper should have less
in�uence than a Democratic endorsement.
28/60

Overview Do Voters A�ect or Elect Policies? The Value of School Facility Investments Media Bias and In�uence Momentum and Social Learning in Presidential Primaries
Introduction
While the media may provide valuable information to voters,
they may also be biased.
If voters do not account for bias, then biased outlets may lead
to poor voter decisions, such as electing low quality candidates.
Research on this is mixed:
DellaVigna and Kaplan (2007) show that the introduction ofFox News increased votes for Republican candidatesGentzkow, Shapiro and Sinkinson (2011) show that the entryof partisan newspapers did not in�uence voting.
In a �eld experiment, Bergan, Gerber, and Karlan (2009) showthat newspapers increase votes for Democrats.
This paper examines newspaper endorsements in Presidential
elections. If voters account for bias, then a Republican
endorsement from a right-leaning paper should have less
in�uence than a Democratic endorsement.
28/60

Overview Do Voters A�ect or Elect Policies? The Value of School Facility Investments Media Bias and In�uence Momentum and Social Learning in Presidential Primaries
Introduction
While the media may provide valuable information to voters,
they may also be biased.
If voters do not account for bias, then biased outlets may lead
to poor voter decisions, such as electing low quality candidates.
Research on this is mixed:
DellaVigna and Kaplan (2007) show that the introduction ofFox News increased votes for Republican candidatesGentzkow, Shapiro and Sinkinson (2011) show that the entryof partisan newspapers did not in�uence voting.In a �eld experiment, Bergan, Gerber, and Karlan (2009) showthat newspapers increase votes for Democrats.
This paper examines newspaper endorsements in Presidential
elections. If voters account for bias, then a Republican
endorsement from a right-leaning paper should have less
in�uence than a Democratic endorsement.
28/60
Overview Do Voters A�ect or Elect Policies? The Value of School Facility Investments Media Bias and In�uence Momentum and Social Learning in Presidential Primaries
Introduction
While the media may provide valuable information to voters,
they may also be biased.
If voters do not account for bias, then biased outlets may lead
to poor voter decisions, such as electing low quality candidates.
Research on this is mixed:
DellaVigna and Kaplan (2007) show that the introduction ofFox News increased votes for Republican candidatesGentzkow, Shapiro and Sinkinson (2011) show that the entryof partisan newspapers did not in�uence voting.In a �eld experiment, Bergan, Gerber, and Karlan (2009) showthat newspapers increase votes for Democrats.
This paper examines newspaper endorsements in Presidential
elections. If voters account for bias, then a Republican
endorsement from a right-leaning paper should have less
in�uence than a Democratic endorsement.28/60
Overview Do Voters A�ect or Elect Policies? The Value of School Facility Investments Media Bias and In�uence Momentum and Social Learning in Presidential Primaries
Model
Voters di�er in their ideology (iv ), with increases in ideology
associated with movements to the right.
Two candidates c ∈ D,R up for election di�er in terms of their
quality (qc) and their ideology (ic).
Voters value quality independent of their ideology, have a
preference for candidates with similar ideology, and thus
receive the following payo� from candidate c winning:
Uvc = qc − (ω/2)(iv − ic)²
Under certain conditions, the di�erence in utility for voter vcan be written as a function of the di�erence in candidate
quality (q = qD − qR).
∆v = UvD − UvR = q − ωiv (iR − iD)
29/60

Overview Do Voters A�ect or Elect Policies? The Value of School Facility Investments Media Bias and In�uence Momentum and Social Learning in Presidential Primaries
Newspapers
Newspapers receive a signal about relative quality: θn = q + εn
Each newspaper has an editorial position (pn), the �standard�
for endorsing the Democrat:
en = 1[θn/√σ2q + σ2ε > pn]
Voters reading an endorsement for the Democrat update via:
E (q|en) = βλd(pn)
where the �credibility� of the endorsement is given by:
λd(pn) =φ(pn)
1− Φ(pn)
Endorsements for Democrats from right-leaning papers have
more in�uence.
30/60

Overview Do Voters A�ect or Elect Policies? The Value of School Facility Investments Media Bias and In�uence Momentum and Social Learning in Presidential Primaries
Newspapers
Newspapers receive a signal about relative quality: θn = q + εn
Each newspaper has an editorial position (pn), the �standard�
for endorsing the Democrat:
en = 1[θn/√σ2q + σ2ε > pn]
Voters reading an endorsement for the Democrat update via:
E (q|en) = βλd(pn)
where the �credibility� of the endorsement is given by:
λd(pn) =φ(pn)
1− Φ(pn)
Endorsements for Democrats from right-leaning papers have
more in�uence.30/60

Overview Do Voters A�ect or Elect Policies? The Value of School Facility Investments Media Bias and In�uence Momentum and Social Learning in Presidential Primaries
Illustration
0.1
.2.3
.4y
-2 -1 0 1 2x
Example without noise--standard normal prior
31/60

Overview Do Voters A�ect or Elect Policies? The Value of School Facility Investments Media Bias and In�uence Momentum and Social Learning in Presidential Primaries
Illustration
0.1
.2.3
.4y
-1.25 0 .2x
Endorsement for Democrat from left-leaning paper
32/60

Overview Do Voters A�ect or Elect Policies? The Value of School Facility Investments Media Bias and In�uence Momentum and Social Learning in Presidential Primaries
Illustration
0.1
.2.3
.4y
0 1.25 1.73x
Endorsement for Democrat from right-leaning paper
33/60

Overview Do Voters A�ect or Elect Policies? The Value of School Facility Investments Media Bias and In�uence Momentum and Social Learning in Presidential Primaries
Data
Key prediction: if voters account for media bias, then
surprising endorsements should have more in�uence than
unsurprising endorsements.
We test this prediction using data on the timing of newspaper
endorsements during the 2000 and 2004 Presidential elections.
We use three variables in the Annenberg National Election
Surveys.
voting intentionsdate of the interviewnewspaper readership
34/60

Overview Do Voters A�ect or Elect Policies? The Value of School Facility Investments Media Bias and In�uence Momentum and Social Learning in Presidential Primaries
Data
Key prediction: if voters account for media bias, then
surprising endorsements should have more in�uence than
unsurprising endorsements.
We test this prediction using data on the timing of newspaper
endorsements during the 2000 and 2004 Presidential elections.
We use three variables in the Annenberg National Election
Surveys.
voting intentions
date of the interviewnewspaper readership
34/60

Overview Do Voters A�ect or Elect Policies? The Value of School Facility Investments Media Bias and In�uence Momentum and Social Learning in Presidential Primaries
Data
Key prediction: if voters account for media bias, then
surprising endorsements should have more in�uence than
unsurprising endorsements.
We test this prediction using data on the timing of newspaper
endorsements during the 2000 and 2004 Presidential elections.
We use three variables in the Annenberg National Election
Surveys.
voting intentionsdate of the interview
newspaper readership
34/60

Overview Do Voters A�ect or Elect Policies? The Value of School Facility Investments Media Bias and In�uence Momentum and Social Learning in Presidential Primaries
Data
Key prediction: if voters account for media bias, then
surprising endorsements should have more in�uence than
unsurprising endorsements.
We test this prediction using data on the timing of newspaper
endorsements during the 2000 and 2004 Presidential elections.
We use three variables in the Annenberg National Election
Surveys.
voting intentionsdate of the interviewnewspaper readership
34/60

Overview Do Voters A�ect or Elect Policies? The Value of School Facility Investments Media Bias and In�uence Momentum and Social Learning in Presidential Primaries
Measuring newspaper ideology
The literature on media bias has focused on two sources of
media bias:
According to the demand side view, bias originates from voterpreferences for like-minded news and pro�t-maximizing mediaoutlets. This includes Gentzkow and Shapiro (2010) andMullainathan and Schleifer (2005)According to the supply side view, bias originates from ownersof media outlets desiring to in�uence voters, as emphasized byDjankov et. al. (2003) and Baron (2006) .
Given these two sources, we measure newspaper ideology via a
statistical model that includes demand side factors (reader
preferences prior to the endorsement) and supply side factors
(group ownership).
We also estimate speci�cations that use information on the
historical pattern of Presidential endorsements.
35/60

Overview Do Voters A�ect or Elect Policies? The Value of School Facility Investments Media Bias and In�uence Momentum and Social Learning in Presidential Primaries
Measuring newspaper ideology
The literature on media bias has focused on two sources of
media bias:
According to the demand side view, bias originates from voterpreferences for like-minded news and pro�t-maximizing mediaoutlets. This includes Gentzkow and Shapiro (2010) andMullainathan and Schleifer (2005)
According to the supply side view, bias originates from ownersof media outlets desiring to in�uence voters, as emphasized byDjankov et. al. (2003) and Baron (2006) .
Given these two sources, we measure newspaper ideology via a
statistical model that includes demand side factors (reader
preferences prior to the endorsement) and supply side factors
(group ownership).
We also estimate speci�cations that use information on the
historical pattern of Presidential endorsements.
35/60

Overview Do Voters A�ect or Elect Policies? The Value of School Facility Investments Media Bias and In�uence Momentum and Social Learning in Presidential Primaries
Measuring newspaper ideology
The literature on media bias has focused on two sources of
media bias:
According to the demand side view, bias originates from voterpreferences for like-minded news and pro�t-maximizing mediaoutlets. This includes Gentzkow and Shapiro (2010) andMullainathan and Schleifer (2005)According to the supply side view, bias originates from ownersof media outlets desiring to in�uence voters, as emphasized byDjankov et. al. (2003) and Baron (2006) .
Given these two sources, we measure newspaper ideology via a
statistical model that includes demand side factors (reader
preferences prior to the endorsement) and supply side factors
(group ownership).
We also estimate speci�cations that use information on the
historical pattern of Presidential endorsements.
35/60

Overview Do Voters A�ect or Elect Policies? The Value of School Facility Investments Media Bias and In�uence Momentum and Social Learning in Presidential Primaries
Measuring newspaper ideology
The literature on media bias has focused on two sources of
media bias:
According to the demand side view, bias originates from voterpreferences for like-minded news and pro�t-maximizing mediaoutlets. This includes Gentzkow and Shapiro (2010) andMullainathan and Schleifer (2005)According to the supply side view, bias originates from ownersof media outlets desiring to in�uence voters, as emphasized byDjankov et. al. (2003) and Baron (2006) .
Given these two sources, we measure newspaper ideology via a
statistical model that includes demand side factors (reader
preferences prior to the endorsement) and supply side factors
(group ownership).
We also estimate speci�cations that use information on the
historical pattern of Presidential endorsements.
35/60

Overview Do Voters A�ect or Elect Policies? The Value of School Facility Investments Media Bias and In�uence Momentum and Social Learning in Presidential Primaries
Endorsements and voting Intentions
“rdq037” — 2011/6/14 — 6:59 — page 807 — #13
CHIANG & KNIGHT MEDIA BIAS AND INFLUENCE 807
TABLE 4Influence of top20newspapers in 2000†
Reader support Probability of Actual ImpliedNewspaper for Gore (%) Group owner‡ endorsing Gore (%) endorsement influence(%)
New York Times 75 New York Times 90 Gore 0∙50Washington Post 64 – 54 Gore 2∙10New York Daily News 67 – 58 Gore 1∙90Chicago Tribune 53 – 36 Bush -1∙70Newsday 57 – 44 Gore 2∙60Houston Chronicle 39 Hearst 34 Bush -1∙60Dallas Morning News 35 – 17 Bush -0∙87Chicago Sun Times 67 – 58 Bush -2∙70Boston Globe 72 New York Times 89 Gore 0∙50San Francisco Chronicle 74 Hearst 82 Gore 0∙90Arizona Republic 41 – 20 Bush -1∙00New York Post 49 – 31 Bush -1∙50Rocky Mountain News 47 – 28 Bush -1∙30Denver Post 52 – 35 Gore 3∙10Philadelphia Inquirer 59 Knight Ridder 82 Gore 0∙90Union-Tribune 51 – 34 Bush -1∙60
†USA Today,Wall Street Journal, andLA Timesare not in this table because those newspapers did not make an endorse-ment or made a non-endorsement in 2000. Star Ledger is not included because the newspaper is not in the sample dueto missing ownership information in the ownership data in 2000.‡Missing (–) means that the newspaper is not owned by a group owner. Group owner is defined as a company that ownsmore than ten daily newspapers in the survey.
FIGURE 2Endorsements and voting
school, relative to high school dropouts, who are male, who attend religious services or considerthemselves born-again Christians are more likely to vote for the Republican.
To provide a sense of the magnitude of this effect of endorsements and endorsement credibil-ity, the final column of Table4 provides our implied estimates of the influence of endorsementsin the largest newspapers in the U.S. during the 2000 campaign. As shown, the least credible
at Brow
n University on O
ctober 24, 2011http://restud.oxfordjournals.org/
Dow
nloaded from
36/60

Overview Do Voters A�ect or Elect Policies? The Value of School Facility Investments Media Bias and In�uence Momentum and Social Learning in Presidential Primaries
High credibility endorsements
“rdq037” — 2011/6/14 — 6:59 — page 808 — #14
808 REVIEW OF ECONOMIC STUDIES
FIGURE 3High-credibility endorsements and voting
FIGURE 4Low-credibility endorsements and voting
endorsements were for Gore from theNew York Timesand for Bush from theDallas MorningNews. According to the logic of our model, the higher probability of endorsing Gore by theNewYork Times, e.g.can be interpreted as having a lower standard in terms of information regardingthe quality of Gore, relative to Bush. Thus, these low-credibility endorsements from theNewYork Timesand theDallas Morning Newsconvinced less than 1% of their readers to switch theirallegiance to the endorsed candidate. The endorsements with the largest effect, by contrast, camefrom theDenver Postand theChicago Sun Times, both of which had surprising endorsements.According to our estimates, these endorsements convinced about 3% of readers to switch theirallegiance to the endorsed candidate. Interestingly, both of these newspapers switched their en-dorsements in 2004, when theChicago Sun TimesendorsedKerry and theDenver Postendorsed
at Brow
n University on O
ctober 24, 2011http://restud.oxfordjournals.org/
Dow
nloaded from
37/60

Overview Do Voters A�ect or Elect Policies? The Value of School Facility Investments Media Bias and In�uence Momentum and Social Learning in Presidential Primaries
Low credibility endorsements
“rdq037” — 2011/6/14 — 6:59 — page 808 — #14
808 REVIEW OF ECONOMIC STUDIES
FIGURE 3High-credibility endorsements and voting
FIGURE 4Low-credibility endorsements and voting
endorsements were for Gore from theNew York Timesand for Bush from theDallas MorningNews. According to the logic of our model, the higher probability of endorsing Gore by theNewYork Times, e.g.can be interpreted as having a lower standard in terms of information regardingthe quality of Gore, relative to Bush. Thus, these low-credibility endorsements from theNewYork Timesand theDallas Morning Newsconvinced less than 1% of their readers to switch theirallegiance to the endorsed candidate. The endorsements with the largest effect, by contrast, camefrom theDenver Postand theChicago Sun Times, both of which had surprising endorsements.According to our estimates, these endorsements convinced about 3% of readers to switch theirallegiance to the endorsed candidate. Interestingly, both of these newspapers switched their en-dorsements in 2004, when theChicago Sun TimesendorsedKerry and theDenver Postendorsed
at Brow
n University on O
ctober 24, 2011http://restud.oxfordjournals.org/
Dow
nloaded from
38/60

Overview Do Voters A�ect or Elect Policies? The Value of School Facility Investments Media Bias and In�uence Momentum and Social Learning in Presidential Primaries
Regression results
“rdq037” — 2011/6/14 — 6:59 — page 806 — #12
806 REVIEW OF ECONOMIC STUDIES
TABLE 3Second Stage: effect of newspaper endorsements on voteintention
Dependentvariable: 1 if intend to vote for the DemocratI II III
After×Credibility 0∙029** 0∙055**(0∙013) (0∙026)
After×Endorsement 0∙011 −0∙020(0∙008) (0∙017)
High school −0∙047*** −0∙047*** −0∙047***(0∙016) (0∙015) (0∙016)
College −0∙013 −0∙013 −0∙013(0∙016) (0∙016) (0∙016)
Male −0∙088*** −0∙087*** −0∙088***(0∙006) (0∙006) (0∙006)
Black 0∙440*** 0∙440*** 0∙440***(0∙009) (0∙008) (0∙009)
Age 0∙002** 0∙002** 0∙002**(0∙001) (0∙001) (0∙001)
Age squared 0∙000 0∙000 0∙000(0∙000) (0∙000) (0∙000)
Born-again Christian −0∙150*** −0∙150*** −0∙150***(0∙007) (0∙007) (0∙007)
Attend religious activities −0∙123*** −0∙123*** −0∙123***(0∙006) (0∙006) (0∙006)
Constant 0∙740*** 0∙740*** 0∙741***(0∙183) (0∙189) (0∙183)
Income categories Yes Yes YesNewspaper fixed effects Yes Yes YesDate fixed effects Yes Yes YesObservations 32,014 32,014 32,014
Notes:Standarderrors in parentheses, * denotes 90% significance, ** denotes 95% significance, and *** denotes 99%significance.
doesseem to be a slight widening in the gap between readers of Democrat-endorsing newspa-pers and readers of Republican-endorsing newspapers after publication of the endorsement. Theeffect is relatively small, however, and is somewhat difficult to detect. As evidence regardingthe prediction that endorsement influence depends upon its credibility, we next split the sam-ple into readers of newspapers with high-credibility endorsements and readers of newspaperswith low-credibility endorsements. As shown in Figure3, which focuses on high-credibility, orsurprising, endorsements, there appears to be an immediate and significant effect of the endorse-ment on reader voting intentions. In Figure4, by contrast, which focuses on low-credibility, orunsurprising endorsements, the effect is again small and difficult to visually detect. These re-sults suggest that high-credibility endorsements do have more influence than do low-credibilityendorsements, and we turn next to a more formal econometric examination of this hypothesis.
As shown in column 1 of Table3, which presents our second-stage results based upon ourfirst-stage estimates of credibility, we find support for the idea that endorsement credibility is akey determinant of the influence of the endorsement, as the coefficient on our credibility measureis positive and statistically significant. Regarding the other controls, we also find that voterswho are older or black are more likely to vote for Democrats and voters who complete high
at Brow
n University on O
ctober 24, 2011http://restud.oxfordjournals.org/
Dow
nloaded from
39/60
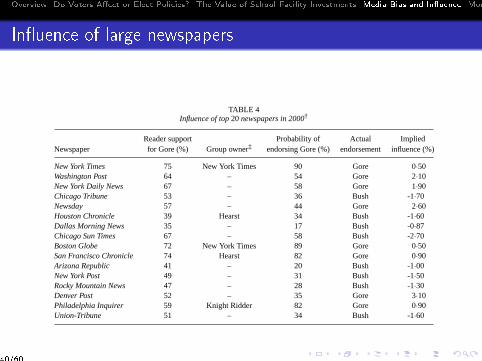
Overview Do Voters A�ect or Elect Policies? The Value of School Facility Investments Media Bias and In�uence Momentum and Social Learning in Presidential Primaries
In�uence of large newspapers“rdq037” — 2011/6/14 — 6:59 — page 807 — #13
CHIANG & KNIGHT MEDIA BIAS AND INFLUENCE 807
TABLE 4Influence of top20newspapers in 2000†
Reader support Probability of Actual ImpliedNewspaper for Gore (%) Group owner‡ endorsing Gore (%) endorsement influence(%)
New York Times 75 New York Times 90 Gore 0∙50Washington Post 64 – 54 Gore 2∙10New York Daily News 67 – 58 Gore 1∙90Chicago Tribune 53 – 36 Bush -1∙70Newsday 57 – 44 Gore 2∙60Houston Chronicle 39 Hearst 34 Bush -1∙60Dallas Morning News 35 – 17 Bush -0∙87Chicago Sun Times 67 – 58 Bush -2∙70Boston Globe 72 New York Times 89 Gore 0∙50San Francisco Chronicle 74 Hearst 82 Gore 0∙90Arizona Republic 41 – 20 Bush -1∙00New York Post 49 – 31 Bush -1∙50Rocky Mountain News 47 – 28 Bush -1∙30Denver Post 52 – 35 Gore 3∙10Philadelphia Inquirer 59 Knight Ridder 82 Gore 0∙90Union-Tribune 51 – 34 Bush -1∙60
†USA Today,Wall Street Journal, andLA Timesare not in this table because those newspapers did not make an endorse-ment or made a non-endorsement in 2000. Star Ledger is not included because the newspaper is not in the sample dueto missing ownership information in the ownership data in 2000.‡Missing (–) means that the newspaper is not owned by a group owner. Group owner is defined as a company that ownsmore than ten daily newspapers in the survey.
FIGURE 2Endorsements and voting
school, relative to high school dropouts, who are male, who attend religious services or considerthemselves born-again Christians are more likely to vote for the Republican.
To provide a sense of the magnitude of this effect of endorsements and endorsement credibil-ity, the final column of Table4 provides our implied estimates of the influence of endorsementsin the largest newspapers in the U.S. during the 2000 campaign. As shown, the least credible
at Brow
n University on O
ctober 24, 2011http://restud.oxfordjournals.org/
Dow
nloaded from
40/60

Overview Do Voters A�ect or Elect Policies? The Value of School Facility Investments Media Bias and In�uence Momentum and Social Learning in Presidential Primaries
Implications
We �nd that voters account for media bias.
While moving a newspaper to the right increases the likelihood
of a Republican endorsement, the in�uence of a Republican
endorsement by this newspaper falls.
These e�ects cancel out such that, from an ex-ante
perspective, changing the ideology of a newspaper has no
impact on voting.
41/60
Overview Do Voters A�ect or Elect Policies? The Value of School Facility Investments Media Bias and In�uence Momentum and Social Learning in Presidential Primaries
More on the media economics literature
Groseclose and Milyo, �A Measure of Media Bias�, Quarterly
Journal of Economics, 2005.
Durante and Knight, �Partisan Control, Media Bias, and
Viewer Responses: Evidence from Berlusconi's Italy�, Journal
of the European Economic Association, 2012.
Gentzkow and Shapiro, �Ideological Segregation Online and
O�ine�, Quarterly Journal of Economics, 2011.
Snyder and Stromberg, �Press Coverage and Political
Accountability�, Journal of Political Economy, 2010.
Stromberg, �Radio's Impact on Public Spending, �, Quarterly
Journal of Economics, 2004.
Gentzkow, Shapiro and Sinkinson, �Competition and
Ideological Diversity: Historical Evidence from US
Newspapers�, American Economic Review, 2014.
42/60
Overview Do Voters A�ect or Elect Policies? The Value of School Facility Investments Media Bias and In�uence Momentum and Social Learning in Presidential Primaries
Outline
1 Overview
2 Do Voters A�ect or Elect Policies?
3 The Value of School Facility Investments
4 Media Bias and In�uence
5 Momentum and Social Learning in Presidential Primaries
43/60

Overview Do Voters A�ect or Elect Policies? The Value of School Facility Investments Media Bias and In�uence Momentum and Social Learning in Presidential Primaries
Introduction
While all voters go to the polls on the same day in many
elections, states choose on di�erent days in other cases.
The most prominent example of a sequential election is the
Presidential primary system, under which Iowa and New
Hampshire vote �rst.
The key di�erence between sequential and simultaneous
systems is the ability of late voters to observe early returns
under sequential.
In this paper, we investigate whether late voters can learn
about the desirability of candidates from early returns.
44/60
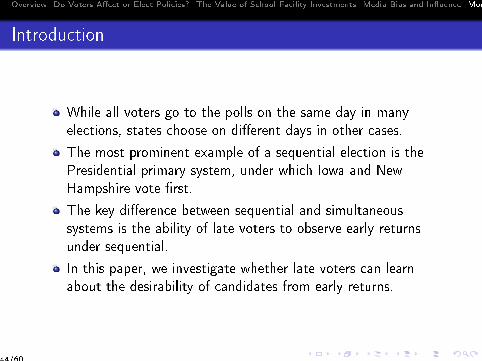

Overview Do Voters A�ect or Elect Policies? The Value of School Facility Investments Media Bias and In�uence Momentum and Social Learning in Presidential Primaries
Challenges to measuring social learning via
Vt = ft(Vt−1,Vt−2, ...)
What is the information content of early returns?
How to account for unmeasured candidate quality?
How to weigh past returns (i.e. Vt−1 versus Vt−2)?
How to account for early learning:
Vt−1 = ft−1(Vt−2,Vt−3, ...)
45/60
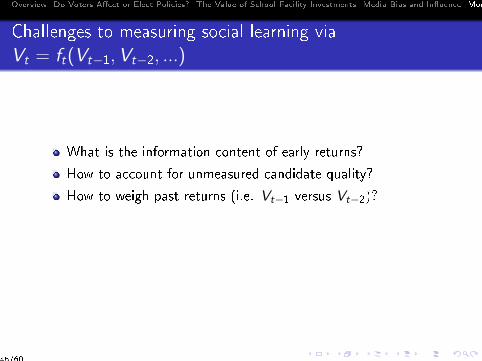
Overview Do Voters A�ect or Elect Policies? The Value of School Facility Investments Media Bias and In�uence Momentum and Social Learning in Presidential Primaries
Simple model of sequential voting
Two states, early (A) and late (B) choose between two
candidates, the front-runner and the dark horse..
Voter i in state s receives the following utility from the
front-runner, relative to the dark horse, winning:
uis = q + ηs + νis
where q represents the quality of the front-runner,
ηs ∼ N(0, ση2) is a preference for the front-runner in state s,
and
νis is distributed type-I extreme value.
46/60

Overview Do Voters A�ect or Elect Policies? The Value of School Facility Investments Media Bias and In�uence Momentum and Social Learning in Presidential Primaries
Information structure
Quality of the front-runner is unknown. Voters have normal
priors characterized by a mean µ1≥0 and variance σ12.
Voters in state s receive a signal (θs) over quality:
θs = q + εs
This signal is common within a state, private across states,
unbiased, and normally-distributed: εs ∼ N(0, σε2).
State-level preferences (ηs) are private across states.
All voters observe their signal before voting. Late voters also
observe the returns from state A.
47/60

Overview Do Voters A�ect or Elect Policies? The Value of School Facility Investments Media Bias and In�uence Momentum and Social Learning in Presidential Primaries
Voting
Given their information, voters support the candidate that
provides the highest expected utility.
Given their signal over front-runner quality, early voters update
as follows:
E (q|θA) = αθA + (1− α)µ
where α = σ21/(σ21 + σ2ε )
Voting returns in the early state are then given by:
vA =exp[αθA + (1− α)µ+ ηA]
1+ exp[αθA + (1− α)µ+ ηA]
Late voters observe vA and attempt to infer θA. This is
complicated by the fact that late voters do not observe ηA.
48/60
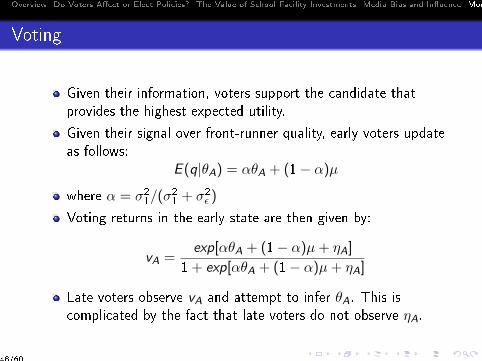
Overview Do Voters A�ect or Elect Policies? The Value of School Facility Investments Media Bias and In�uence Momentum and Social Learning in Presidential Primaries
Empirical application
Key prediction: support should increase among late voters for
candidates performing better than expected in early states.
We test this prediction and estimate the parameters of this
model using the 2004 Democratic primary, in which Iowa voted
�rst, followed by New Hampshire, etc.
We focus on the three key candidates (Dean, Kerry, and
Edwards) and use aggregate voting returns and daily survey
data from the 2004 Annenberg National Election Survey
In particular, we examine how voting intentions of late voters
in the survey respond to the release of early returns.
49/60

Overview Do Voters A�ect or Elect Policies? The Value of School Facility Investments Media Bias and In�uence Momentum and Social Learning in Presidential Primaries
Support for Dean before and after Iowa
Fig. 2.—Dean before and after the Iowa primary
Fig. 3.—Kerry before and after the Iowa primary
50/60

Overview Do Voters A�ect or Elect Policies? The Value of School Facility Investments Media Bias and In�uence Momentum and Social Learning in Presidential Primaries
Support for Kerry
Fig. 2.—Dean before and after the Iowa primary
Fig. 3.—Kerry before and after the Iowa primary
51/60
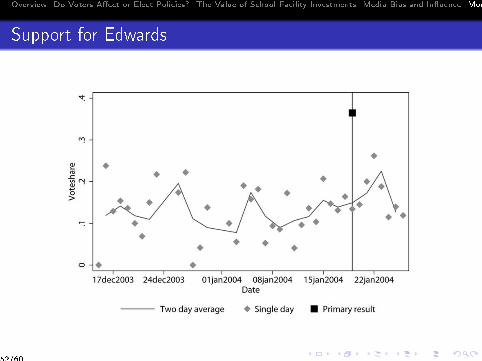
Overview Do Voters A�ect or Elect Policies? The Value of School Facility Investments Media Bias and In�uence Momentum and Social Learning in Presidential Primaries
Support for Edwards
momentum and social learning 1123
Fig. 4.—Edwards before and after the Iowa primary
appropriately.14 Kerry, by contrast, outperformed expectations in Iowa,and survey respondents updated accordingly. Edwards also outper-formed his pre-Iowa polling numbers, and his polling numbers in-creased following Iowa. After a few days, however, his support fell backto pre-Iowa levels.15
B. Empirical Model
As noted above, our empirical strategy involves comparing support forcandidates among late voters before and after the release of votingreturns from early states. In our econometric specification, we assumethat voters receive their signals just prior to the date of their primary.That is, these respondents from late states have not yet observed their
14 The “Dean scream” will be discussed in detail below.15 These patterns are similar to those in prices from the Iowa Electronic Market, in
which market participants purchased contracts that would pay $1 in the event that Kerry,e.g., is the party’s nominee in the general election, and the price of this contract can thusbe interpreted as the probability that a given candidate wins the nomination (Wolfers andZitzewitz 2004). We choose to focus on polling data, rather than these prices from pre-diction markets, for two reasons. First, the mapping from voting in primaries to theprobability of nomination, as provided by the prediction market prices, is confounded bythe presence of superdelegates, who are not pledged to the winning candidate, as well asthe possibility that no candidate wins a majority of the delegates, in which case the nomineeis chosen through a bargaining process at the party convention. Second, the daily pollingdata, but not prediction market data, include additional measures of candidate quality,and we will make use of these in our discussion of alternative explanations to follow.
52/60

Overview Do Voters A�ect or Elect Policies? The Value of School Facility Investments Media Bias and In�uence Momentum and Social Learning in Presidential Primaries
Model parameter estimates
Using this approach, we also estimate the key model
parameters: the initial prior over candidate quality (µc1), the
degree of variation in state-level preferences (ση2), and the key
learning parameters (σε2, σ1
2).
μD1 0.938**[0.773,1.14]
μE1 ‐0.701**[‐0.913,‐0.433]
ση2 0.815**
[0.551,1.194]σ1
2 3.577**[1.497,7.129]
σε2 1.197**
[0.062,4.097][bootstrap95%confidenceinterval],**denotessignificanceatthe95‐percentlevel
Table1:ParameterEstimatesfromKnightandSchiff(2010)
53/60

Overview Do Voters A�ect or Elect Policies? The Value of School Facility Investments Media Bias and In�uence Momentum and Social Learning in Presidential Primaries
Supporting evidence of learning
Survey questions involving candidate quality (e.g. inspiring,
strong leader, trustworthy) move with support for candidates.
Early voters are better informed about candidate
characteristics than later voters. Moreover, this gap narrows as
the campaign progresses.
A structural break analysis documents breaks in support on
key early election dates (e.g. the Iowa Caucuses and the New
Hampshire Primaries).
54/60

Overview Do Voters A�ect or Elect Policies? The Value of School Facility Investments Media Bias and In�uence Momentum and Social Learning in Presidential Primaries
Welfare analysis: sequential or simultaneous
In a companion paper, Hummel and Knight (2014) investigate
alternative systems, including a National Primary system.
Opponents of the current system argue that early states have
disproportionate in�uence, while supporters argue that it
enhances competition.
"...for years concerns have been raised regarding the calendarthat some believe gives a disproportionate in�uence to thesetwo early states", David Price, Commission on PresidentialNomination Timing and Scheduling, 10/1/2005."We need to preserve the possibility for lesser known, lesserfunded candidates to compete, and a national primary onFebruary 5th will not do that", Terry Shumaker, 12/5/2005.
55/60

Overview Do Voters A�ect or Elect Policies? The Value of School Facility Investments Media Bias and In�uence Momentum and Social Learning in Presidential Primaries
Welfare analysis: sequential or simultaneous
In a companion paper, Hummel and Knight (2014) investigate
alternative systems, including a National Primary system.
Opponents of the current system argue that early states have
disproportionate in�uence, while supporters argue that it
enhances competition.
"...for years concerns have been raised regarding the calendarthat some believe gives a disproportionate in�uence to thesetwo early states", David Price, Commission on PresidentialNomination Timing and Scheduling, 10/1/2005.
"We need to preserve the possibility for lesser known, lesserfunded candidates to compete, and a national primary onFebruary 5th will not do that", Terry Shumaker, 12/5/2005.
55/60

Overview Do Voters A�ect or Elect Policies? The Value of School Facility Investments Media Bias and In�uence Momentum and Social Learning in Presidential Primaries
Welfare analysis: sequential or simultaneous
In a companion paper, Hummel and Knight (2014) investigate
alternative systems, including a National Primary system.
Opponents of the current system argue that early states have
disproportionate in�uence, while supporters argue that it
enhances competition.
"...for years concerns have been raised regarding the calendarthat some believe gives a disproportionate in�uence to thesetwo early states", David Price, Commission on PresidentialNomination Timing and Scheduling, 10/1/2005."We need to preserve the possibility for lesser known, lesserfunded candidates to compete, and a national primary onFebruary 5th will not do that", Terry Shumaker, 12/5/2005.
55/60

Overview Do Voters A�ect or Elect Policies? The Value of School Facility Investments Media Bias and In�uence Momentum and Social Learning in Presidential Primaries
Welfare analysis: sequential or simultaneous
We show that sequential elections place too much weight on
information of early states but also provide late voters with
valuable information.
Under simultaneous elections, voters equally weigh the
available information but place too much weight on their
priors, providing an inappropriate advantage to front-runners.
Given these trade-o�s, simultaneous elections are preferred if
the front-runner initially has a small advantage, but sequential
elections are preferred if the front-runner has a large
advantage.
To evaluate this trade-o�, we simulate the model using the
Knight and Schi� (2010) parameter estimates and consider a
simultaneous system and an all public system.
56/60

Overview Do Voters A�ect or Elect Policies? The Value of School Facility Investments Media Bias and In�uence Momentum and Social Learning in Presidential Primaries
Information of early states is over-weighted
0.0
5.1
.15
coef
ficie
nt
0 5 10 15 20t
sequential publicsimultaneous
FIG 2: THE RESPONSE OF VOTES TO SIGNALS
57/60

Overview Do Voters A�ect or Elect Policies? The Value of School Facility Investments Media Bias and In�uence Momentum and Social Learning in Presidential Primaries
Preferences of early states are over-weighted
0.0
5.1
.15
coef
ficie
nt
0 5 10 15 20t
sequential publicsimultaneous
FIG 3: THE RESPONSE OF VOTES TO PREFERENCES
58/60

Overview Do Voters A�ect or Elect Policies? The Value of School Facility Investments Media Bias and In�uence Momentum and Social Learning in Presidential Primaries
Sequential is more competitive
System Pr(Dean) Pr(Edwards) Pr(Kerry)
all public 60.88% 12.61% 26.50%
simultaneous 68.91% 8.11% 22.98%
sequential 62.24% 11.84% 25.92%
59/60

Overview Do Voters A�ect or Elect Policies? The Value of School Facility Investments Media Bias and In�uence Momentum and Social Learning in Presidential Primaries
Implications
Given the front runner advantage in 2004, the simultaneous
system outperforms the sequential system.
But the di�erences in welfare are small, and the result reverses
with a larger lead for the front-runner.
Finally, we consider a weighted sequential system. Under the
optimal weights, which gives voters from the latest state 18
times more in�uence than voters from the earliest state, this
system dominates both sequential and simultaneous.
Deltas, Herrera and Polborn (2010) examine a similar model
but allow for di�erences in ideology. With more than two
candidates, sequential primaries allow voters to better
coordinate as the election unfolds.
60/60


