Quantifying Surface Energy Fluxes and Evaporation overa Significant Expanding Endorheic Lake in the Central Tibetan Plateau
Yanhong GUO
Key Laboratory of Tibetan Plateau Environment Changes and Land Surface Processes,Institute of Tibetan Plateau Research, Chinese Academy of Sciences, China
University of Chinese Academy of Sciences, China
Yinsheng ZHANG
Key Laboratory of Tibetan Plateau Environment Changes and Land Surface Processes,Institute of Tibetan Plateau Research, Chinese Academy of Sciences, China
CAS Center for Excellence in Tibetan Plateau Earth Sciences, China
Ning MA
Key Laboratory of Tibetan Plateau Environment Changes and Land Surface Processes,Institute of Tibetan Plateau Research, Chinese Academy of Sciences, China
University of Chinese Academy of Sciences, China
Hongtao SONG, and Haifeng GAO
Key Laboratory of Tibetan Plateau Environment Changes and Land Surface Processes,Institute of Tibetan Plateau Research, Chinese Academy of Sciences, China
(Manuscript received 17 March 2016, in final form 23 June 2016)
Abstract
In this study, energy and water vapor exchange between the lake and atmosphere over the largest lake in Tibet, Lake Serling Co, was measured by an eddy covariance system from April 26 until September 26, 2014. The results demonstrated that the diurnal variations of the sensible heat flux (H) and latent heat flux (LE) were different from that of the net radiation (Rn). Rn reached its peak value at the local noon, whereas H peaked in the morning and LE peaked in the afternoon. On a seasonal scale, H and LE were also different from Rn. The maximum value of Rn occurred in June, while the maxima of H and LE were observed in September. Lake evaporation was quantified with a daily mean value of 2.7 mm d−1 and a total amount of 417.0 mm during the study period. In addition, evaporation from Lake Serling Co was compared with two types of pan evaporation (D20 pan and E601B pan) and potential evaporation on the land surface. The variability of conversion coefficients between lake evaporation, D20/E601B pan and potential evaporation indicate that coefficients varied depending on the month and could not be defined as a single experimental value.
Keywords energy fluxes; eddy covariance method; lake evaporation; pan evaporation; Tibetan Plateau
Journal of the Meteorological Society of Japan Vol. 94, No. 5454
1. Introduction
With a mean altitude of 4,000 m above sea level (a.s.l.), the Tibetan Plateau (TP) plays important roles in the global water cycle and the Asian monsoon system because of its thermodynamic influence on atmospheric circulation patterns (Ma et al. 2015a; Wu et al. 2012; Xu and Haginoya 2001). The TP has the greatest number (1055) and area (41831.7 km2) of lakes in China (Ma et al. 2011). Heat and water exchange between such large water bodies and the atmosphere strongly influence the local climate (Lv et al. 2007; Yang et al. 2015). Observations of lake surface energy balance and evaporation by the eddy covariance (EC) method, which is typically consid-ered to be the most reliable and accurate method, have been reported in several studies (Allen and Tasumi 2005; Liu et al. 2014; Spank and Bernhofer 2008; Tanny et al. 2008). Previous observed results have shown that the characteristics of the surface energy balance and turbulent exchange vary and depend on various factors, including lake sizes, depths, and regional climate conditions. For instance, shallow subtropical lakes, e.g., Lake Taihu (Wang et al. 2014) and Logan Dam (McGloin et al. 2015), have small heat capacities and quickly respond to changes in the atmospheric forcing, leading to short time lags between net radiation and turbulent fluxes. In contrast, deep cold lakes, e.g., Great Slave Lake (Oswald and Rouse 2004; Rouse et al. 2003) and Superior Lake (Blanken et al. 2011), have larger heat capacities and slowly respond to changes in the atmospheric forcing, leading to longer time lags (e.g., several months). However, the characteristics of the heat and water exchange over the lakes in the TP remain unclear since the harsh environment of the TP has resulted in extremely sparse in situ observation of its lakes. Li et al. (2015) analyzed two-year surface energy budgets during the ice-free period over Lake Ngoring in the northeast of the TP. Wang et al. (2015) observed and modeled the interactions between a lake and the air during the summer over a small and shallow lake in the Nam Co basin of the central TP. Moreover, remote-sensing-based investigations have suggested that most lakes in the central TP have expe-rienced significant expansions in area and increases in water level during the past few decades (Lei et al. 2013; Wang et al. 2013; Zhang et al. 2011, 2013). This is especially true for the largest lake in Tibet, Lake Serling Co (88°33′–89°21′E, 31°34′–31°57′N) (Fig. 1), which has expanded from 1617 km2 in the mid-1970s to 2341 km2 in the 2010s (Zhang et al.
2011). To reveal the reason for such fast endorheic lake expansion, an accurate estimation of the lake water balance components, including precipita-tion, runoff, and evaporation from the lake surface is needed (Lenters et al. 2005). As Lake Serling Co is an endorheic lake, evaporation from its surface is the only output component because there is no outlet runoff. Therefore, precise quantification of the evapo-ration from Lake Serling Co is crucial for elucidating the mechanism of lake expansion.
Based on in situ observations of turbulent fluxes measured using the EC method from April 26 until September 26, 2014, the objectives of the present study were (1) to investigate the characteristics of the energy fluxes over largest endorheic lake in the central TP, Lake Serling Co, and (2) to quantify the evaporation over the surface of Lake Serling Co and its relation with two types of pan evaporation as well potential evaporation.
2. Methods
2.1 Site description and measurementsThe elevation of Lake Serling Co is about 4543 m
(a.s.l.), and its maximum depth is about 50 m (Chen et al. 2001; Lei et al. 2013). Our field observations showed that Lake Serling Co is ice-covered from the end of December until mid-April of the following year. A flux tower was installed on an island in the west part of Lake Serling Co (88°37′, 31°48′, Fig. 1b, c). An EC system consisting of a three-dimensional sonic anemometer (CSAT3, Campbell Scientific Inc., USA) and an open-path carbon dioxide/water vapor (CO2/H2O) infrared gas analyzer (Li 7500, Li-Cor Inc., USA) was mounted on the tower at a height of approximately 3.2 m above the water surface. Raw data were recorded by a data logger (CR1000, Campbell Scientific Inc., USA) at a frequency of 10 Hz. Additionally, a four-component net radiometer (CNR4, Kipp & Zonen, Netherlands) was installed on the tower approximately 1.5 m above the water surface. The air temperature (Ta) and relative humidity (RH) were measured using temperature and humidity probes (HMP45C, Vaisala Inc., Finland) located 3.0 m above the water surface. The water temperature was also measured using temperature sensors (109, Campbell Scientific Inc., USA) near the tower at the depths of 0.25 m, 0.45 m, and 0.85 m, respectively. A double tipping-bucket rain gauge (SM3-1, Shanghai Meteorological Instrument Factory Co. Ltd., China) was installed near the tower. A China D20 pan with a diameter of 0.2 m was installed at the shore side (about 3 km from the lake side) to observe the pan
Y. GUO et al.October 2016 455
evaporation (Fig. 1b). In addition, the lake surface temperature (Tw) was obtained by using the water temperature at a depth of 0.45 m, which is reasonable because the water is well mixed by high-speed wind (Nordbo et al. 2011; Zhang and Liu 2013). The water surface vapor pressure (ew) was calculated according to Tw in this study.
2.2 Data processing and footprint analysisThe 10 Hz raw EC data were processed using
EddyPro software (Burba 2013). All of the necessary data corrections, including the deletion of outliers, the double rotation of the coordinate axes, and the correc-tion of the Webb–Pearman–Leuning density were performed (Kaimal and Finnigan 1994; Vickers and Mahrt 1997; Webb et al. 1980). Finally, the 30 min mean values of the sensible heat flux (H) and latent heat flux (LE) were calculated.
To perform turbulent flux measurements, it is necessary to quantify the sampling area, also called the flux footprint, which is the upwind area or distance contributing to the turbulent fluxes (Blanken
et al. 2000). Here we estimated the upwind distance using a footprint model developed by Kljun et al. (2004). We also analyzed the wind rose during the study period, and the results showed that the vast majority of the winds flowed from the southwest and northeast (Fig. 2b). The distances from the obser-vation tower providing the 90 % cumulative contri-butions to the turbulent fluxes from the southwest and northeast were approximately 225 m and 254 m, respectively (Fig. 2c). Based on the Google Earth satellite image (Fig. 2a), we found that more than 90 % of the flux measurements originated from the lake surface. The 30 min mean H and LE data were filtered out during (1) periods in which the wind direction was 0°–25° or 270°–360°, which indicated fluxes that were affected by the island, and (2) rainfall events. These resulted in 18.9 % and 23.7 % gaps for H and LE, respectively, during the study period. All of the gaps were filled using the bulk transfer relation, which has been widely used in a variety of previous studies (e.g., McGloin et al. 2015; Wang et al. 2014).
Fig. 1. (a) Map of Lake Serling Co basin and position of Xainza meteorological station (88°38′ E, 30°57′ N; 4672 m) in the basin; (b) location of eddy covariance tower and D20 pan; and (c) an image of eddy covariance tower.
Journal of the Meteorological Society of Japan Vol. 94, No. 5456
3. Results
3.1 Seasonal and diurnal variation of lake surface energy fluxes
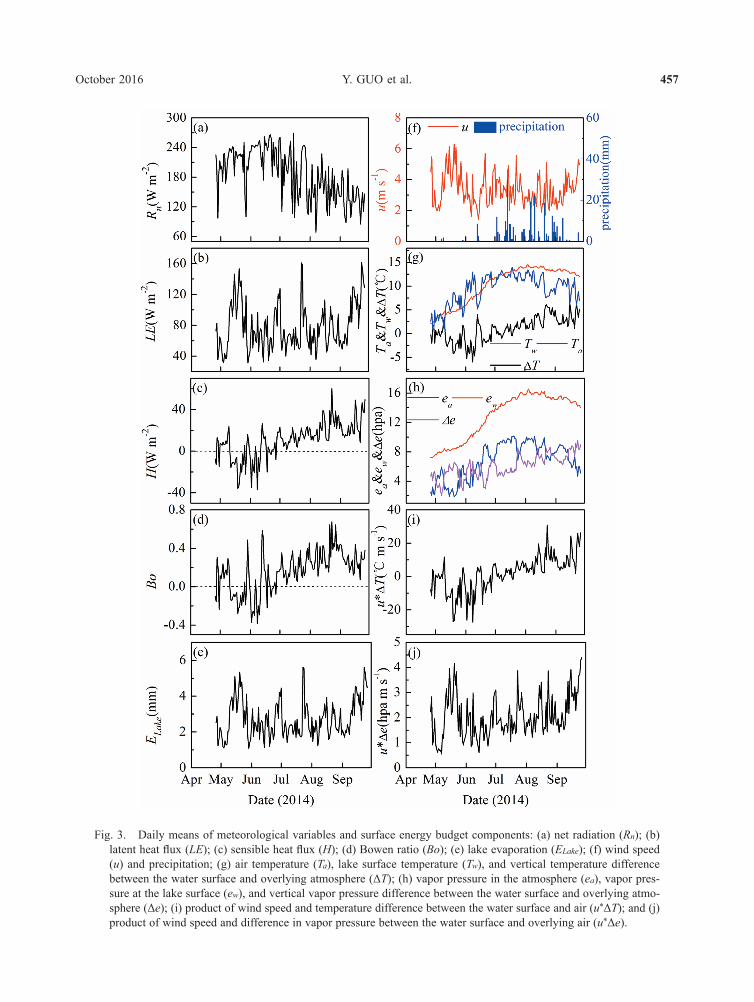
The seasonal variations of the surface energy budget components and the meteorological vari-ables over the lake surface are illustrated in Fig. 3 and Table 1. It can be seen that Rn peaks in June and decreases from July with a fluctuating pattern due to the increases in cloudiness and precipitation after the
monsoon onset (Figs. 3a, f). The seasonal variations of LE are different from those of Rn with some weekly scale sporadic increases (Fig. 3b), which are in agree-ment with the wind speed variations (Fig. 3f). The larger vapor pressure deficit between the lake surface and the overlying atmosphere caused by the decreased water vapor pressure in the atmosphere in high wind conditions might also enhance LE (Figs. 3f, h). The seasonal variation of H is also different from that of Rn, with an increasing trend during the observation
Fig. 2. (a) Google Earth satellite image showing the location of eddy covariance tower; (b) wind rose from April 26 until September 26, 2014; and (c) upwind distances providing 90 % cumulative contributions to turbulent fluxes from northeast and southwest.
Y. GUO et al.October 2016 457
Fig. 3. Daily means of meteorological variables and surface energy budget components: (a) net radiation (Rn); (b) latent heat flux (LE); (c) sensible heat flux (H); (d) Bowen ratio (Bo); (e) lake evaporation (ELake); (f) wind speed (u) and precipitation; (g) air temperature (Ta), lake surface temperature (Tw), and vertical temperature difference between the water surface and overlying atmosphere (ΔT); (h) vapor pressure in the atmosphere (ea), vapor pres-sure at the lake surface (ew), and vertical vapor pressure difference between the water surface and overlying atmo-sphere (Δe); (i) product of wind speed and temperature difference between the water surface and air (u*ΔT); and (j) product of wind speed and difference in vapor pressure between the water surface and overlying air (u*Δe).
Journal of the Meteorological Society of Japan Vol. 94, No. 5458
period due to the increase in the vertical temperature gradient (Tw − Ta) (Figs. 3c, g). Due to the different specific heat capacities of water and air, the warming rate of the air over the lake surface is faster than that of the water in May and June, and the cooling rate of the air over the lake surface is also faster than that of water in August and September. Therefore, H is negative in May and June and positive in August and September. H shows better accordance with (Tw− Ta) than with u, while LE shows better accordance with u than with (ew − ea) (Figs. 3b, c and Figs. 3f, h). As demonstrated by Figs. 3b, c and Figs. 3i, j, H shows the best accordance with u*(Tw − Ta), while LE shows the best accordance with u*(ew − ea). The Bowen ratio (Bo = H/LE) ranges from −0.38 to 0.67, with a daily mean value of 0.14 during the observation period (Fig. 3d), demonstrating that the majority of the avail-able energy contributed to water loss through evapo-ration.
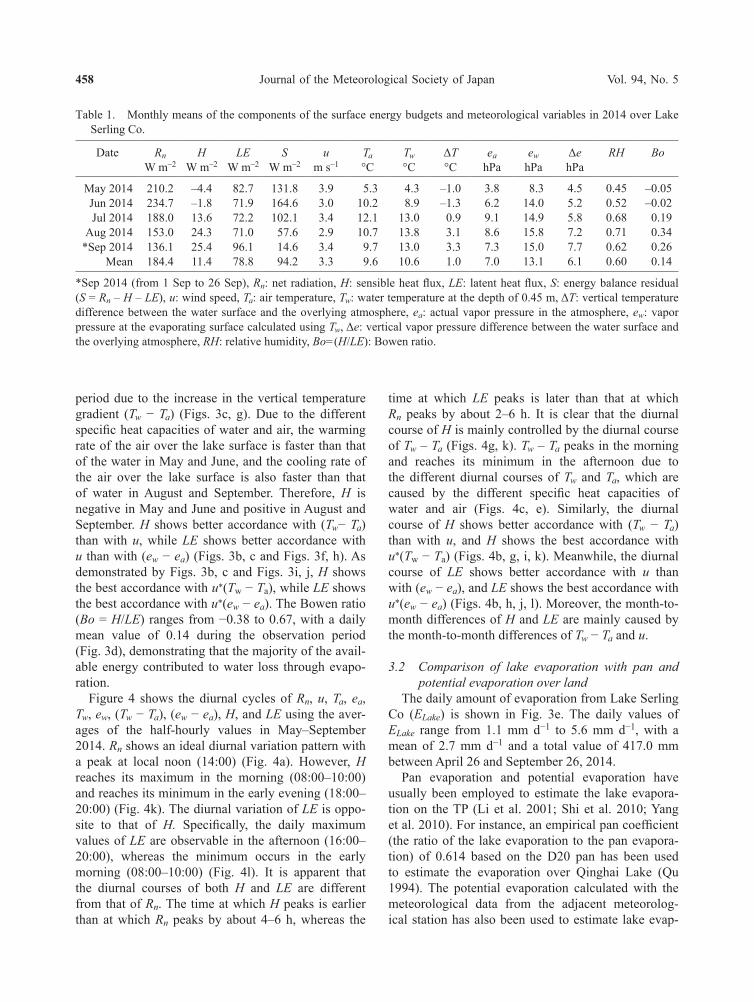
Figure 4 shows the diurnal cycles of Rn, u, Ta, ea, Tw, ew, (Tw − Ta), (ew − ea), H, and LE using the aver-ages of the half-hourly values in May–September 2014. Rn shows an ideal diurnal variation pattern with a peak at local noon (14:00) (Fig. 4a). However, H reaches its maximum in the morning (08:00–10:00) and reaches its minimum in the early evening (18:00–20:00) (Fig. 4k). The diurnal variation of LE is oppo-site to that of H. Specifically, the daily maximum values of LE are observable in the afternoon (16:00–20:00), whereas the minimum occurs in the early morning (08:00–10:00) (Fig. 4l). It is apparent that the diurnal courses of both H and LE are different from that of Rn. The time at which H peaks is earlier than at which Rn peaks by about 4–6 h, whereas the
time at which LE peaks is later than that at which Rn peaks by about 2–6 h. It is clear that the diurnal course of H is mainly controlled by the diurnal course of Tw – Ta (Figs. 4g, k). Tw – Ta peaks in the morning and reaches its minimum in the afternoon due to the different diurnal courses of Tw and Ta, which are caused by the different specific heat capacities of water and air (Figs. 4c, e). Similarly, the diurnal course of H shows better accordance with (Tw − Ta) than with u, and H shows the best accordance with u*(Tw − Ta) (Figs. 4b, g, i, k). Meanwhile, the diurnal course of LE shows better accordance with u than with (ew − ea), and LE shows the best accordance with u*(ew − ea) (Figs. 4b, h, j, l). Moreover, the month-to-month differences of H and LE are mainly caused by the month-to-month differences of Tw − Ta and u.
3.2 Comparison of lake evaporation with pan and potential evaporation over land
The daily amount of evaporation from Lake Serling Co (ELake) is shown in Fig. 3e. The daily values of ELake range from 1.1 mm d−1 to 5.6 mm d−1, with a mean of 2.7 mm d−1 and a total value of 417.0 mm between April 26 and September 26, 2014.
Pan evaporation and potential evaporation have usually been employed to estimate the lake evapora-tion on the TP (Li et al. 2001; Shi et al. 2010; Yang et al. 2010). For instance, an empirical pan coefficient (the ratio of the lake evaporation to the pan evapora-tion) of 0.614 based on the D20 pan has been used to estimate the evaporation over Qinghai Lake (Qu 1994). The potential evaporation calculated with the meteorological data from the adjacent meteorolog-ical station has also been used to estimate lake evap-
Table 1. Monthly means of the components of the surface energy budgets and meteorological variables in 2014 over Lake Serling Co.
Date RnW m–2
HW m–2
LEW m–2
SW m–2
um s–1
Ta°C
Tw°C
ΔT°C
eahPa
ewhPa
ΔehPa
RH Bo
May 2014Jun 2014Jul 2014
Aug 2014*Sep 2014
Mean
210.2234.7188.0153.0136.1184.4
–4.4–1.813.624.325.411.4
82.771.972.271.096.178.8
131.8164.6102.1 57.6 14.6 94.2
3.93.03.42.93.43.3
5.310.212.110.7 9.7 9.6
4.3 8.913.013.813.010.6
–1.0–1.3 0.9 3.1 3.3 1.0
3.86.29.18.67.37.0
8.314.014.915.815.013.1
4.55.25.87.27.76.1
0.450.520.680.710.620.60
–0.05–0.020.190.340.260.14
*Sep 2014 (from 1 Sep to 26 Sep), Rn: net radiation, H: sensible heat flux, LE: latent heat flux, S: energy balance residual (S = Rn – H – LE), u: wind speed, Ta: air temperature, Tw: water temperature at the depth of 0.45 m, ΔT: vertical temperature difference between the water surface and the overlying atmosphere, ea: actual vapor pressure in the atmosphere, ew: vapor pressure at the evaporating surface calculated using Tw, Δe: vertical vapor pressure difference between the water surface and the overlying atmosphere, RH: relative humidity, Bo=(H/LE): Bowen ratio.
Y. GUO et al.October 2016 459
Fig. 4. Monthly mean diurnal course of (a) net radiation (Rn), (b) wind speed (u), (c) air temperature (Ta), (d) vapor pressure in the atmosphere (ea), (e) lake surface temperature (Tw), (f) vapor pressure at the lake surface (ew), (g) vertical temperature difference between the water surface and overlying atmosphere(ΔT), (h) vertical vapor pressure differ-ence between the water surface and overlying atmosphere (Δe), (i) product of wind speed and temperature difference between the water surface and air (u*ΔT), (j) product of wind speed and difference in vapor pressure between the water surface and overlying air (u*Δe), (k) sensible heat flux (H), and (l) latent heat flux (LE) in May–September 2014.
Journal of the Meteorological Society of Japan Vol. 94, No. 5460
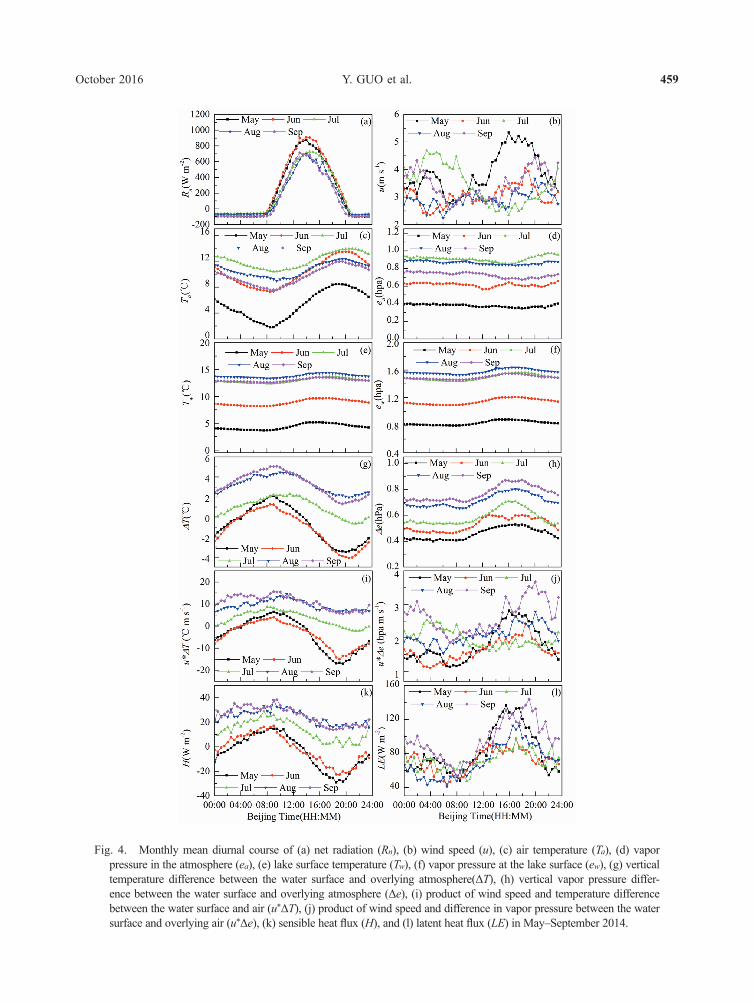
oration on the TP (Li et al. 2001; Yu et al. 2011). It is therefore necessary to compare the current lake evaporation observations with the pan evapora-tion and potential evaporation. Figure 5a shows a comparison of the monthly values of ELake with the pan evaporation from two kinds of pan and poten-tial evaporation. The first pan is the China D20 pan, which was mentioned above, and the other pan is the China E601B pan made of fiberglass with a depth of 0.687 m and a diameter of 0.618 m (Ma et al. 2015b), which was installed at the Xainza China Meteorolog-ical Administration meteorological station (Fig. 1a). The potential evaporation was calculated using the method given by Xu et al. (2005) based on the mete-orological data from Xainza station. ELake exhibits seasonal patterns different from those of the evapo-ration from the D20 pan (ED20), E601B pan (EE601B), and potential evaporation (EP(Xainza)). ED20, EE601B, and EP(Xainza) reach peak values in June, but seasonal variations of ELake are not obvious. It can also be seen that ED20, EE601B, and EP(Xainza) display similar seasonal variations during the observation period, but their amounts are obviously different. ED20 shows the largest value, followed by EP(Xainza) and EE601B. Addi-tionally, ED20, EE601B, and EP(Xainza) are always larger than ELake during this period. The differences between the lake evaporation and pan evaporation are mainly caused by different thermal characteristics of the pan and large water bodies. The heat storage in the D20 and E601B pans is too small to cause any lag effect. Moreover, the horizontal wind from the dry surfaces around the pans could enhance the pan evaporation (Ma et al. 2015b; Shuttleworth and Maidment 1992). Conversely, a lake with a larger water body and depth could store and release a great amount of heat. Furthermore, thermal stratification occurs in large and deep water bodies and may accentuate the time lag between the net radiation and the lake evapora-tion (Finch and Calver 2008). Therefore, the seasonal patterns of the pan evaporation closely follow the energy input, but the seasonal patterns of the lake evaporation lag behind the energy input by several months (Brutsaert 1982, 2005). It should be noted that potential evaporation calculated using the meteo-rological variables from the land surface (i.e., Xainza station) actually reflected a non-potential environment maximum evaporation (Brutsaert 2005). For instance, in the potential evaporation results calculated using the observed data obtained from Lake Serling Co (Ep(Lake)), it can be found that Ep(Lake) is smaller than Ep(Xainza) and that Ep(Lake) agrees well with ELake (Fig. 5c). It is also evident that the larger wind speed and
drier air in Xainza station are the main reasons for Ep(Xainza) being larger than Ep(Lake) and ELake (Figs. 5d, f). Meanwhile, it can also be concluded that lake evaporation can be well estimated using the potential method if meteorological variables near the lake (i.e., the meteorological variables are able to reflect the lake environment to a large extent) are available.
Research related to the ratio of lake evaporation to pan evaporation using a US Class A pan has been reported in many studies (Lapworth 1965; Boyd 1985). However, research into the ratio of lake evapo-ration to pan evaporation is scarce because of the lack of lake evaporation observation (Ma et al. 2016). The monthly ratios of lake evaporation to D20 pan evap-oration (ELake/ED20) and lake evaporation to E601B pan evaporation (ELake/EE601B) are given in Fig. 5b. These results show that ELake/ED20 and ELake/EE601B have seasonal variations similar to those of ED20 and EE601B, with the minimum values in June. The values of ELake/EE601B and ELake/ED20 obtained during the observation period are 0.37 and 0.54, respectively. Fig. 5b shows that the seasonal variations of ELake/EP(Xainza) are similar to those of ELake/ED20 and ELake/EE601B. During the observation period, ELake/EP(Xainza) was determined to be 0.49. It is also evident that the conversion coefficients vary by month and cannot be defined as single experimental values.
4. Discussion
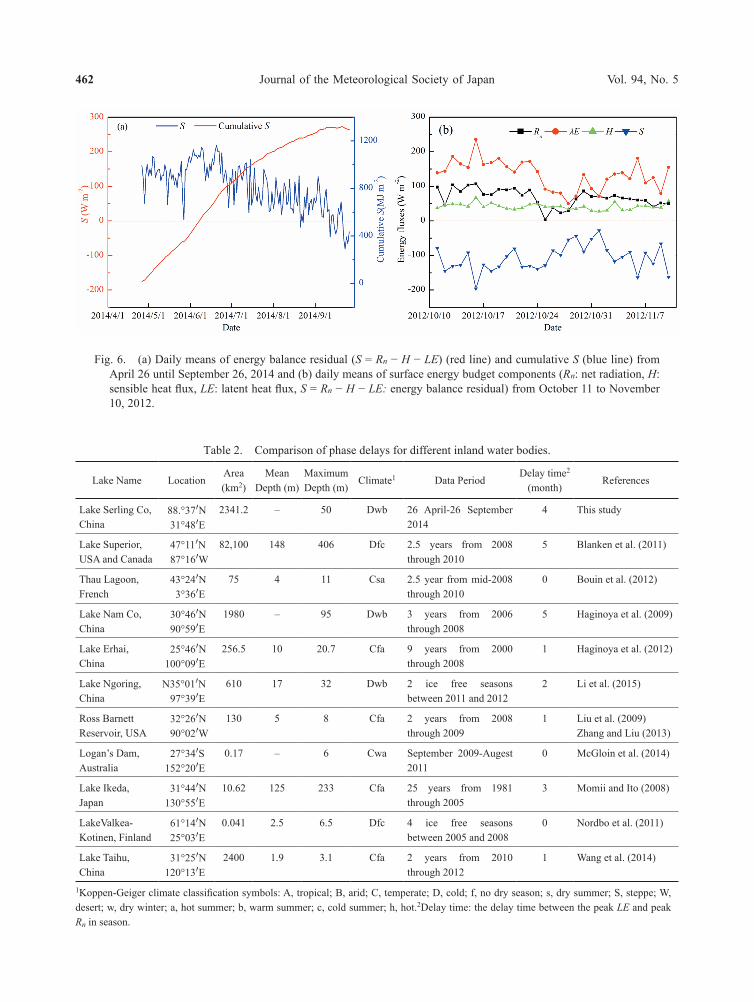
As pointed out in the descriptions of Fig. 3 and Table 1, the seasonal variations of LE and H show patterns different from that of Rn. This phenom-enon is likely due to the changes in heat storage in the water body. The residual of the energy balance (S = Rn − H − LE) was assumed to be heat storage, although estimating S as a residual incorporates all of the errors in the other energy balance terms (Blanken et al. 2000, 2011; Li et al. 2015). As shown in Fig. 6a, S is positive during most of the observation period, and negative S is observable only for several days in mid- and late September. The variation of S suggests that the majority of Rn absorbed by the lake was stored into the water body in May–August and was then released in September during the obser-vation period. The cumulative S reaches its peak in the middle of September. The observed daily mean surface energy budget components between October 11 and November 10, 2012, using the EC method are also given in Fig. 6b. These results also show that S is always negative during this period, suggesting that the release of heat stored in the lake contributed to the increases of H and LE in October and November. The
Y. GUO et al.October 2016 461
seasonal variations of LE and H over Lake Serling Co might lag Rn by approximately 4 months, based on the two periods of observational data.
The heat storage capacity of a lake has a remark-able influence on the phases of the seasonal variations of the lake surface turbulent fluxes, as has frequently
been reported (Blanken et al. 2011; Schertzer et al. 2003; Tasumi 2005). Table 2 provides a comparison of the phase delay between LE and Rn over Lake Serling Co and those of 10 different inland water bodies in different climatic zones and with different water areas and depths. The climate classifications in
Fig. 5. (a) Monthly variation of lake evaporation (ELake), D20 pan evaporation (ED20), E601B pan evaporation (EE601B), and potential evaporation calculated using Xainza meteorological data (EP(Xainza)); (b) monthly variation of conversion coefficients, ELake/ED20, ELake/EE601B, and ELake/EP(Xainza); (c) comparison of ELake, EP(Xainza), and potential evaporation calculated using observed meteorological data over the lake surface (EP(Lake)); (d) compar-ison of air temperature between Xainza (Ta(Xainza)) and the lake surface (Ta(Lake)); (e) comparison of wind speed between Xainza (u(Xainza)) and the lake surface (u(Lake)); (f) comparison of vapor pressure between Xainza (ea(Xainza)) and the lake surface (ea(Lake)).
Journal of the Meteorological Society of Japan Vol. 94, No. 5462
Fig. 6. (a) Daily means of energy balance residual (S = Rn − H − LE) (red line) and cumulative S (blue line) from April 26 until September 26, 2014 and (b) daily means of surface energy budget components (Rn: net radiation, H: sensible heat flux, LE: latent heat flux, S = Rn − H − LE: energy balance residual) from October 11 to November 10, 2012.
Table 2. Comparison of phase delays for different inland water bodies.
Lake Name LocationArea(km2)
MeanDepth (m)
MaximumDepth (m)
Climate1 Data PeriodDelay time2
(month)References
Lake Serling Co,China
88.°37′N 31°48′E
2341.2 – 50 Dwb 26 April-26 September 2014
4 This study
Lake Superior, USA and Canada
47°11′N 87°16′W
82,100 148 406 Dfc 2.5 years from 2008 through 2010
5 Blanken et al. (2011)
Thau Lagoon, French
43°24′N 3°36′E
75 4 11 Csa 2.5 year from mid-2008 through 2010
0 Bouin et al. (2012)
Lake Nam Co, China
30°46′N 90°59′E
1980 – 95 Dwb 3 years from 2006 through 2008
5 Haginoya et al. (2009)
Lake Erhai, China
25°46′N 100°09′E
256.5 10 20.7 Cfa 9 years from 2000 through 2008
1 Haginoya et al. (2012)
Lake Ngoring, China
N35°01′N 97°39′E
610 17 32 Dwb 2 ice free seasons between 2011 and 2012
2 Li et al. (2015)
Ross BarnettReservoir, USA
32°26′N 90°02′W
130 5 8 Cfa 2 years from 2008 through 2009
1 Liu et al. (2009)Zhang and Liu (2013)
Logan’s Dam, Australia
27°34′S 152°20′E
0.17 – 6 Cwa September 2009-Augest 2011
0 McGloin et al. (2014)
Lake Ikeda, Japan
31°44′N 130°55′E
10.62 125 233 Cfa 25 years from 1981 through 2005
3 Momii and Ito (2008)
LakeValkea-Kotinen, Finland
61°14′N 25°03′E
0.041 2.5 6.5 Dfc 4 ice free seasons between 2005 and 2008
0 Nordbo et al. (2011)
Lake Taihu, China
31°25′N 120°13′E
2400 1.9 3.1 Cfa 2 years from 2010 through 2012
1 Wang et al. (2014)
1Koppen-Geiger climate classification symbols: A, tropical; B, arid; C, temperate; D, cold; f, no dry season; s, dry summer; S, steppe; W, desert; w, dry winter; a, hot summer; b, warm summer; c, cold summer; h, hot.2Delay time: the delay time between the peak LE and peak Rn in season.
Y. GUO et al.October 2016 463
Table 2 were established using the updated Koppen–Geiger climate classification method (Peel et al. 2007; McGloin et al. 2015). Table 2 shows that delay times in both temperate and cold region lakes range from 0 to 5 months, suggesting the climatic condi-tions might be not the main factor influencing the phase delays. It can also be seen from Table 2 that the delay time is generally shorter for a lake with a small water area than for one with a large water area. However, contradictory examples also exist: Lake Taihu (area: 2400 km2), which has a phase delay of only 1 month, and Lake Ikeda (area: 10.62 km2), which has a phase delay of 3 months (Momii and Ito 2008; Wang et al. 2014). These results also suggest that the water area is not the main factor controlling the phase delay. Finally, it is obvious from Table 2 that deep lakes have longer time delays than shallow lakes; for instance, Lake Valkea-Kotinent and Logan’s Dam have water depths of less than 10 m and do not show obvious phase delays. However, Lake Supe-rior and Lake Namu Co have depths of more than 90 m and display phase delays as long as 5 months (Blanken et al. 2011; Haginoya et al. 2009; McGloin et al. 2015; Nordbo et al. 2011). Therefore, the phase delay between the net radiation and turbulent energy may be attributable to the lake depth. Deep lakes can store large amounts of heat in the spring and summer and release it in the fall and winter. However, shallow lakes have very low abilities to store and release heat from solar radiation. The phase delay time of Lake Serling Co is approximately 4 months, which is reasonable considering its depth (which has a maximum of approximately 50 m) with reference to the results of former studies that are shown in Table 2.
5. Conclusion
The characteristics of the heat and water exchange over a significant expanding endorheic lake (Lake Serling Co) in the central TP were analyzed using measurements based on the EC method. The primary results are as follows: (1) H and LE exhibited patterns different from those of Rn on both diurnal and seasonal scales. On a diurnal scale, Rn reached its peak at the local noon, but H peaked in the morning and LE peaked in the afternoon. On a seasonal scale, the maximum value of Rn occurred in June, while the maxima of H and LE were observed in September. The Bowen ratio (Bo) over Lake Serling Co was approximately 0.14 during our study period, indi-cating that the majority of the available energy was consumed by evaporative water loss. (2) Evaporation from Lake Serling Co was quantified with a daily
mean value 2.7 mm d−1 and a total value of 417.0 mm from April 26 to September 26, 2014. Comparing these results with those of two kinds of pan evapora-tion (D20 pan and E601B pan) and potential evapo-ration, it was found that the conversion coefficients varied depending on the month and could not be defined as single experimental values.
Monthly conversion coefficients were obtained for May–September in 2014. However, further observa-tions are needed to acquire long-term data to improve the conversion coefficients parameterization. In addi-tion, the daily range of the air temperature was larger than that of the water temperature, suggesting that the turbulent observations might have been affected by the land. Therefore, the average evaporation over the whole lake might be smaller than that reported herein. Overall, the present study provides the seasonal and diurnal variations of the energy fluxes between the largest lake and atmosphere; however, long-term in situ observations are still needed to elucidate how the lake-atmosphere energy and water exchange respond to climate changes.
Acknowledgments
This study was supported by the Natural Science Foundation of China (Grant No. 41430748) and the Strategic Priority Research Program (B) of the Chinese Academy of Sciences (Grant No. XDB03030206). This study was also supported by the Key Projects of Foreign Cooperation of Bureau of International Co-operation Chinese Academy of Sciences (Grant No. 131C11KYSB20150006) and the Natural Science Foundation of China (Grant No. 41190080).
References
Allen, R. G., and M. Tasumi, 2005: Evaporation from American Falls Reservoir in Idaho via a combina-tion of Bowen ratio and eddy covariance. Proceeding of Impacts of Global Climate Change, World Water and Environmental Resources Congress, Anchorage, Alaska, United States, 1–17.
Blanken, P. D., W. R. Rouse, A. D. Culf, C. Spence, L. D. Boudreau, J. N. Jasper, B. Kochtubajda, W. M. Schertzer, P. Marsh, and D. Verseghy, 2000: Eddy covariance measurements of evaporation from Great Slave Lake, Northwest Territories, Canada. Water Resour. Res., 36, 1069–1077.
Blanken, P. D., C. Spence, N. Hedstrorn, and J. D. Lenters, 2011: Evaporation from Lake Superior: 1. Phys-ical controls and processes. J. Great Lakes Res., 37, 707–716.
Bouin, M. N., G. Caniaux, O. Traulle, D. Legain, and P.
Journal of the Meteorological Society of Japan Vol. 94, No. 5464
Le Moigne, 2012: Long-term heat exchanges over a Mediterranean lagoon. J. Geophys. Res., 117, D23104, doi: 10.1029/2012JD017857.
Brutsaert, W., 1982: Evaporation into the Atomosphere: Theory, History, and Applications. Springer Science & Business Media, 302 pp.
Brutsaert, W., 2005: Hydrology: An Introduction. Cambridge Univeristy Press, 605 pp.
Burba, G., 2013: Eddy Covariance Method for Scientific, Industrial, Agricultural and Regulatory Applications: A Field Book on Measuring Ecosystem Gas Exchange and Areal Emission Rates. LI-Cor Biosciences, 343 pp.
Chen, Y., Z. Chen, D. He, B. Cai, and B. Zhu, 2001: Hydro-graphic features of Serling Co, North Tibetan Plateau. J. Lake Sci., 13, 28–33 (in Chinese).
Finch, J., and A. Calver, 2008: Methods for the quanti-fication of evaporation from lakes. Proceeding of World Meteorological Organization Commission for Hydrology. UK, 45 pp.
Haginoya, S., H. Fujii, T. Kuwagata, J. Xu, Y. Ishigooka, S. Kang, and Y. Zhang, 2009: Air-lake interaction features found in heat and water exchanges over Nam Co on the Tibetan Plateau. SOLA, 5, 172–175.
Haginoya, S., H. Fujii, J. H. Sun, and J. Y. Liu, 2012: Features of air-lake interaction in heat and water exchanges over Erhai Lake. J. Meteor. Soc. Japan, 90, 55–73.
Kaimal, J. C., and J. J. Finnigan, 1994: Atmospheric Boundary Layer Flows: Their Structure and Measure-ment. Oxford University Press, 304 pp.
Kljun, N., P. Calanca, M. Rotach, and H. Schmid, 2004: A simple parameterisation for flux footprint predictions. Bound.-Layer Meteor., 112, 503–523.
Lapworth, C., 1965: Evaporation from a reservoir near London. J. Inst. Water Environ. Manage., 19, 163–181.
Lei, Y., T. Yaoa, B. W. Birda, K. Yanga, J. Zhaic, and Y. Shengd, 2013: Coherent lake growth on the central Tibetan Plateau since the 1970s: Characterization and attribution. J. Hydrol., 483, 61–67.
Lenters, J. D., T. K. Kratz, and C. J. Bowser, 2005: Effects of climate variability on lake evaporation: Results from a long-term energy budget study of Sparkling Lake, northern Wisconsin (USA). J. Hydrol., 308, 168–195.
Li, W. C., S. Li, and P. Pu, 2001: Estimates of plateau lake evaporation: A case study of Zige Tangco. J. Lake Sci., 13, 228–232 (in Chinese).
Li, Z., S. Lyua, Y. Aoa, L. Wena, L. Zhaoa, and S. Wanga, 2015: Long-term energy flux and radiation balance observations over Lake Ngoring, Tibetan Plateau. Atmos. Res., 155, 13–25.
Liu, H., Y. Zhang, S. Liu, H. Jiang, L. Sheng, and Q.
L. Williams, 2009: Eddy covariance measure-ments of surface energy budget and evapora-tion in a cool season over southern open water in Mississippi. J. Geophys. Res., 114, D04110, doi:10.1029/2008JD010891.
Liu, H., J. Feng, J. Sun, L. Wang, and A. Xu, 2014: Eddy covariance measurements of water vapor and CO2 fluxes above the Erhai Lake. Sci. China Earth Sci., 58, 317–328.
Lü, Y., and X. Yang, Y. Ma, 2007: Numerical simulation of summer circulation and atmospheric boundary layer characteristics over Qinghai Lake. Plateau Meteor., 26, 686–692 (in Chinese).
Ma, N., Y. Zhang, Y. Guo, H. Gao, H. Zhang, and Y. Wang, 2015a: Environmental and biophysical controls on the evapotranspiration over the highest alpine steppe. J. Hydrol., 529, 980–992.
Ma, N., Y. Zhang, J. Szilagyi, Y. Guo, J. Zhai, and H. Gao, 2015b: Evaluating the complementary relationship of evapotranspiration in the alpine steppe of the Tibetan Plateau. Water Resour. Res., 51, 1069–1083.
Ma, N., J. Szilagyi, G.-Y. Niu, Y. Zhang, T. Zhang, B. Wang, and Y. Wug, 2016. Evaporation variability of Nam Co Lake in the Tibetan Plateau and its role in recent rapid lake expansion. J. Hydrol., 537, 27–35.
Ma, R. H., G.-S. Yang, H.-T. Duan, J.-H. Jiang, S.-M. Wang, X.-Z- Feng, A.-N. Li, F.-X. Kong, B. Xue, J.-L. Wu, and S.-J. Li, 2011: China’s lakes at present: Number, area and spatial distribution. Sci. China Earth Sci., 54, 283–289.
McGloin, R., H. McGowan, and D. McJannet, 2015: Effects of diurnal, intra-seasonal and seasonal climate vari-ability on the energy balance of a small subtropical reservoir. Int. J. Climatol., 35, 2308–2325.
Meng, K., X. Shi, E. Wang, and F. Liu, 2011: High-alti-tude salt lake elevation changes and glacial ablation in Central Tibet, 2000–2010. Chinese Sci. Bull., 57, 525–534.
Momii, K., and Y. Ito, 2008: Heat budget estimates for Lake Ikeda, Japan. J. Hydrol., 361, 362–370.
Nordbo, A., S. Launiainen, I. Mammarella, M. Leppäranta, J. Huotari, A. Ojala, and T. Vesala, 2011: Long-term energy flux measurements and energy balance over a small boreal lake using eddy cova-riance technique. J. Geophys. Res., 116, D02119, doi:10.1029/2010JD014542.
Oswald, C. J., and W. R. Rouse, 2004: Thermal character-istics and energy balance of various-size Canadian Shield lakes in the Mackenzie River basin. J. Hydro-meteor., 5, 129–144.
Peel, M. C., B. L. Finlayson, and T. A. McMahon, 2007: Updated world map of the Koppen-Geiger climate classification. Hydrol. Earth Syst. Sci., 4, 439–473.
Qu, Y. G., 1994: Water balance and forecasting of water level change in Qinghai Lake. J. Lake Sci. 6, 298–307 (in Chinese).
Y. GUO et al.October 2016 465
Rouse, W. R., C. M. Oswald, J. Binyamin, P. D. Blanken, W. M. Schertzer, and C. Spence, 2003: Interannual and seasonal variability of the surface energy balance and temperature of central Great Slave Lake. J. Hydrometeor., 4, 720–730.
Schertzer, W. M., W. R. Rouse, P. D. Blanken, and A. E. Walker, 2003: Over-lake meteorology and estimated bulk heat exchange of Great Slave Lake in 1998 and 1999. J. Hydrometeor., 4, 649–659.
Shi, X. H., S. C. Li, D. An, D. L. Li, and Z. C. Su, 2010: A study of the change of Qinghai Lake evaporation. Climatic. Environ. Res., 15, 787–796 (in Chinese).
Shuttleworth, W. J., 1992: Evaporation. Handbook of Hydrology. Maidment, D. R. (ed.), McGraw-Hill, 41, 505–572.
Spank, U., and C. Bernhofer, 2008: Another simple method of spectral correction to obtain robust eddy-covari-ance results. Bound.-Layer Meteor., 128, 403–422.
Tanny, J., S. Cohen, S. Assouline, F. Lange, A. Grava, D. Berger, B. Teltch, and M. B. Parlangec, 2008: Evap-oration from a small water reservoir: Direct measure-ments and estimates. J. Hydrol., 351, 218–229.
Tasumi, M., 2005: A review of evaporation research on Japanese lakes. Proc. ASCE/EWRI World Water and Environmental Resources Congress, 1–10.
Vickers, D., and L. Mahrt, 1997: Quality control and flux sampling problems for tower and aircraft data. J. Atmos. Oceanic Technol., 14, 512–526.
Wang, B., Y. Ma, X. Chen, Y. Ma, X. Chen, W. Ma, Z. Su, and M. Menenti, 2015: Observation and simulation of lake-air heat and water transfer processes in a high-altitude shallow lake on the Tibetan Plateau. J. Geophys. Res., 120, 12327–12344.
Wang, W., W. Xiao, C. Cao, Z. Gao, Z. Hu, S. Liu, S. Shen, L. Wang, Q. Xiao, J. Xu, D. Yang, and X. Lee, 2014: Temporal and spatial variations in radiation and energy balance across a large freshwater lake in China. J. Hydrol., 511, 811–824.
Wang, X., P. Gonga, Y. Zhao, Y. Xu, X. Cheng, Z. Niu, Z. Luo, H. Huang, F. Sun, and X. Li, 2013: Water-level changes in China’s large lakes determined from
Webb, E. K., G. I. Pearman, and R. Leuning, 1980: Correc-tion of flux measurements for density effects due to heat and water vapour transfer. Quart. J. Roy. Meteor. Soc., 106, 85–100.
Wu, G., Y. Liu, B. He, Q. Bao, A. Duan, and F. F. Jin, 2012: Thermal controls on the Asian summer monsoon. Sci. Rep., 2, 404, doi:10.1038/srep00404.
Xu, J. Q., and S. Haginoya, 2001: An estimation of heat and water balances in the Tibetan Plateau. J. Meteor. Soc. Japan, 79, 485–504.
Xu, J., S. Haginoya, K. Masuda, and R. Suzuki, 2005: Heat and water balance estimates over the Tibetan plateau in 1997–1998. J. Meteor. Soc. Japan, 83, 577–593.
Yang, X., Y. Lü, Y. Ma, and J. Wen, 2015: Summertime thermally-induced circulations over the Lake Nam Co region of the Tibetan Plateau. Acta Meteor. Sinica, 29, 305–314.
Yang, P., S.-K. Cao, C.-H. Meng, C.-Y. Wang, 2010: Calcu-lation of Qinghai Lake evaporation. J. Qinghai Normal Univ. Nat. Sci., 3, 75–79 (in Chinese).
Yu, S., J. Liu, J. Xu, and H. Wang, 2011: Evaporation and energy balance estimates over a large inland lake in the Tibet-Himalaya. Environ. Earth Sci., 64, 1169–1176.
Zhang, G., H. Xie, S. Kang, D. Yi, and S. F. Ackley, 2011: Monitoring lake level changes on the Tibetan Plateau using ICESat altimetry data (2003–2009). Remote Sens. Environ., 115, 1733–1742.
Zhang, G., T. Yao, H. Xie, S. Kang, and Y. Lei, 2013: Increased mass over the Tibetan Plateau: From lakes or glaciers? Geophys. Res. Lett., 40, 2125–2130.
Zhang, Q., and H. Liu, 2013: Interannual variability in the surface energy budget and evaporation over a large southern inland water in the United States. J. Geophys. Res., 118, 4290–4302.
Zhang, Y., T. Yao, and Y. Ma, 2011: Climatic changes have led to significant expansion of endorheic lakes in Xizang (Tibet) since 1995. Sci. Cold. Arid Region, 3, 463–467.