Lehigh University Lehigh Preserve eses and Dissertations 1-1-1983 A simulation model of a robotic assembly line. Chen-Fa Sun Follow this and additional works at: hp://preserve.lehigh.edu/etd Part of the Industrial Engineering Commons is esis is brought to you for free and open access by Lehigh Preserve. It has been accepted for inclusion in eses and Dissertations by an authorized administrator of Lehigh Preserve. For more information, please contact [email protected]. Recommended Citation Sun, Chen-Fa, "A simulation model of a robotic assembly line." (1983). eses and Dissertations. Paper 1934. brought to you by CORE View metadata, citation and similar papers at core.ac.uk provided by Lehigh University: Lehigh Preserve
Transcript
Lehigh UniversityLehigh Preserve
Theses and Dissertations
1-1-1983
A simulation model of a robotic assembly line.Chen-Fa Sun
Follow this and additional works at: http://preserve.lehigh.edu/etd
Part of the Industrial Engineering Commons
This Thesis is brought to you for free and open access by Lehigh Preserve. It has been accepted for inclusion in Theses and Dissertations by anauthorized administrator of Lehigh Preserve. For more information, please contact [email protected].
Recommended CitationSun, Chen-Fa, "A simulation model of a robotic assembly line." (1983). Theses and Dissertations. Paper 1934.
brought to you by COREView metadata, citation and similar papers at core.ac.uk
INFORMATION TO ALL USERS The quality of this reproduction is dependent upon the quality of the copy submitted.
In the unlikely event that the author did not send a complete manuscript and there are missing pages, these will be noted. Also, if material had to be removed,
a note will indicate the deletion.
uest
ProQuest EP76207
Published by ProQuest LLC (2015). Copyright of the Dissertation is held by the Author.
All rights reserved. This work is protected against unauthorized copying under Title 17, United States Code
I would like to extend my sincere thanks and appreciation
to Dr. John W. Adams for his advice, encouragement, and
guidance in the role of major advisor; and to Dr. Mikel
P. Groover for his support as minor advisor.
In addition, I would like to thank all of the members of
the Industrial Engineering Department at Lehigh University
for making my graduate studies thoroughly worthwhile and
enjoyable.
111
Table of Contents
1. INTRODUCTION 2 2. SYSTEM DEFINITION 5 2.1 Palletizing line 5 2.2 Assembly line 5 3- MODEL BUILDING 7 3.1 Factors affect the system's performance 7 3.2 Performance evaluation • 9 3-3 Model development 10 4. STATISTICAL ANALYSIS OF THE RESULTS 13 5. SIMULATION RESULTS 15 5.1 Probability of having a jam vs. performance 15 5-2 Time needed for solving the jam vs. performance 15 5-3 Processing time vs. performance 16 5-4 Time between successive pallet's arrival vs. performance 16 6. DISCUSSION 17 6.1 Reliability of the results 17 6.2 The time spent in system by the pallets and maximum queue 17
observed 6.3 Robot's utilization 18 6.4 Output of the system 18 7. CONCLUSIONS 19 REFERENCES 21 I. THE APPENDIX 24 1.1 TABLE 24 1.2 FIGURES 38 l.j, SIMULATION PROGRAM 74
VITA 81
IV
ABSTRACT
A Simulation Language for Alternative Modeling (SLAM) computer
program was used to help analyze some important factors arising in
connection with assembly by robot. These factors were used as
parameters in the program and changed individually to obtain
different System's performance. Then the relationships between
system's performance and those parameters were generated by using
statistical methods.
This thesis includes a description of a special assembly
system, model building for this system and discussion of the
results. For each set of parameters, several executions of program
have been made by changing the random number only. The statistical
analysis is all based on these data group.
1. INTRODUCTION
Ln. a conventional assembly system, the assembly activities are
separated into several steps, each step being the placement of a
specific part in the assembly. These steps are assigned to a series
of stations which are operated by either persons or special-purpose
machines. The work proceeds from station to station and finished
assemblies come out of the final station. A manual assembly,
typically has low amount of output, low accuracy, poor repeatability
and poor resistance to errors and fatique. Although the station's
motions can be assigned with more flexibility, this type of assembly
line (operated by humans) is difficult to achieve a high product
quality, high equipment utilization and high production rate. A
special machine, typically a one-of-a-kind device is built to
assemble one product or subassembly for its entire productivity
life. So the station's motions are simple and are fixed to a
pattern. It is therefore difficult to change the machine to
accommodate changes in the product. This type of assembly(operated
by special machines) has limited the flexibility which can not be
changed easily to produce another type of product.
Ln recent years, industrial robots have found practical and
economic application in manufacturing environments performing such
tasks as spot welding, palletizing, paint spraying, machine loading
and unloading, machine-to-machine transfer and material handling
2
tasKs. It can not only be used to do a repetitive operation and
because of its programming ability, also be easily switched to do
another series of operations by unloading and loading different well
prepared programs. By letting these properties to be used in a
batch size multi-product assembly line, it is possible that the
assembly process can be carried to completion at a single station
(which is operated by robot)•[7],[sJ,[l 1],[12] Moreover, we can
provide sufficient stations operating in parallel to attain the
desired production rate. If one assumes that a small percentage of
any assembly job will require manual intervention, then efficient
deployment of lead men at phased parallel stations will allowed the
roving men to proceed logically from station to station to lend a
hand at critical stages of assembly. This system is less sensitive
to production loss due to individual station downtime and has high
product quality, high production rate, low in-process inventory and
is less disruptive to production schedules.
These thesis will discuss some factors which may affect the
performance of an assembly system. A Simulation Language for
Alternative Modeling (SLAW) computer program has been used to
simulate this assembly system. Several factors such as process
time, robot's breakdown rate, the probability of having a jam in
assembly and time needed for solving the jam are treated as
parameters. From the results of simulation program, we can find out
the relationship between the parameters and the system's
3
performance.[2J
2. SYSTEM DEFINITION
The first step in the simulation application consisted of
system definition.
2.1 Palletizing line
In the first subsystem, the blank pallet and oriented parts
come in to the palletizing station, then the placer picks up the
part and puts it on the pallet at the proper location. The pallets
are prepared in batches of N, and each pallet contains n different
parts. To prepare a batch of N pallets, the N pallets are
circulated through the placer system n times. On each pass the
placer puts a different part on the pallet, and after a pallet
completes its n-th pass all n parts are on the pallet . When the 11-
th part is placed on the N-th pallet, the entire batch of N pallets
is complete and ready for assembly. The circulating conveyor system
on which the pallets are traveling must be large enough to contain
all N pallets simultaneously. The next batch of blank pallets will
come into the palletizing line and repeat all the operations again.
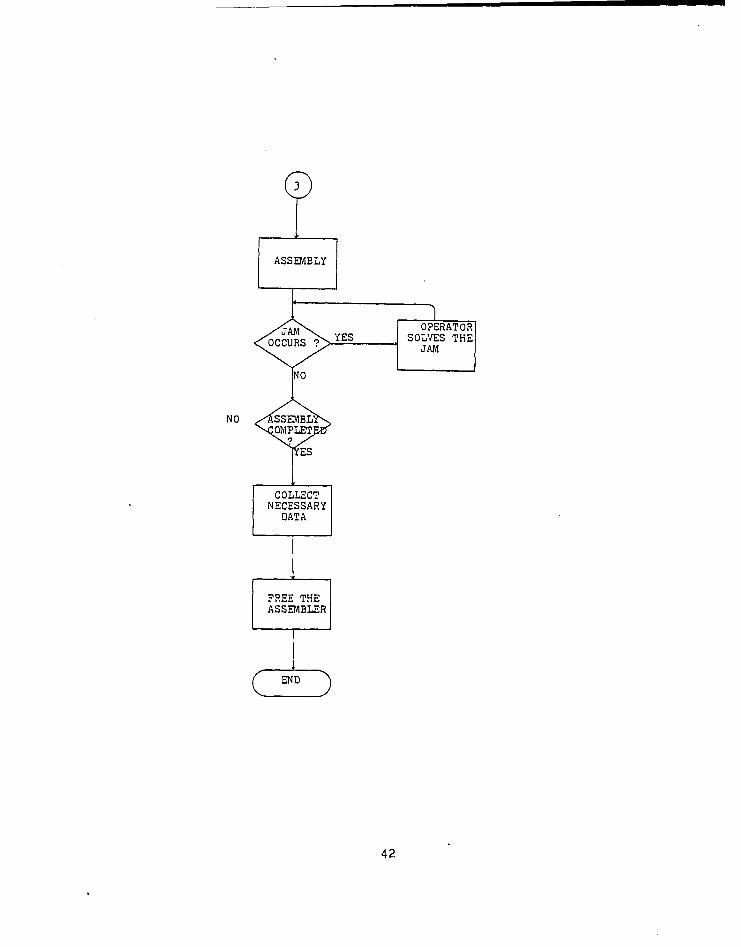
2.2 Assembly line
In the second subsystem, the assembler picks up the parts from
the pallets and assembles them on a base plate. However, for
certain parts, the assembly operation can not be performed by the
assembler. In this case the base plate will be routed to another
station for special treatment. This treatment can be performed
5
manuaiy or by some special purpose machine. Meanwhile, the
assembler and the pallet in assembly station must wait for the base
plate until it comes back from the other station after completing a
specific operations.
After the base plate is returned, the assembler keeps on
assembling until another special treatment is needed or to the end
of assembly operation. Whenever it reaches the end of assembly
operation, The pallet and base plate will be routed out of the
assembly station and next pallet will come in (if there is a pallet
waiting), or the assembler will be idle.
These two subsystems are connected by a conveyor: from the
output of the first subsystem to the input of the second subsystem.
After completing assembly from assembly station, the blank pallet
will be routed back to palletizing station and the base plate with
final product will be routed to another area for unloading and
inspection. Then the base plate will be routed back to assembly
station again.
When the palletizing and assembly are in progress, there is a
probability that a jam will occur. All jams are removed by a human
operator.
j>. MODEL BUILDING
3.1 Factors affect the system's performance
Among the whole system, the main concern is to find a proper
input which will yield an optimal performance. Some factors which
will affect these values are listed as follow:
1. pallet's input rate
An input rate which is too high does not increase the
performance of the system but would just build up a long
queue which increases cost. An input rate which is lower
than needed would cause the line to be idle more
frequently and the yield will be low.
2. probability of a jam which is caused by improper
orientation of the part or inaccuracy of the robot
The placement of a part is not necessarily successful,
and if not the intervention of a human operator is
required. It is assumed that the probability of failure
is known for each part, say p. for the i-th part.
Morever, when human intervention is required, there is an
additional delay, say d.
3. robot's breakdown rate and repair time
In this assembly system, only the robots are directly
processing the parts. So that the robot's breakdown will
greatly influence the output of the system especially
when the repair time for breakdown comparing to the
process time is significant. In general the repair times
is so significant that it is impossible to treat the
breakdown as a factor in this system. Therefore, the
robot's breakdown is assumed not to occur in the
execution of simulation. In the real world, this effect
can be estimated for the long run.
4. process time for the individual operations
The time required for the placement of each part is
assumed to be known, say t- for the i-th part."
5. the speed of the robot
Ln some caess, the robot's movement can be speeded up.
This will reduce the process time but the probability of
a jam increases.
6. time for pallet to feed into the station and its transfer
times
Pallet transfer time and time for pallet to be fed into
the station will have a great influence to the system's
performance when these times are significant comparing to
the process time. If these times do not appear
significant, it can be treated as constant or just
neglects it(a too small time value used in the simulation
will greatly increase the program's execution time). In
this thesis, all these times are treated as constant.
7. the effect of the batch size
A large batch size will build up a longer queue and will
need a larger circulating conveyor to contain all N
pallets simultaneously. A small batch size will cause
changing robot's program and/or gripper more frequently
and the change-over time will become significant.
3.2 Performance evaluation
The performance of the system is judged by the following:
1. number of product completed(For the assembly station,
pallets completed is the index. For the palletizing
station, parts used is the index).
2. utilization of the robot (percentage of the idle time of
the robot).
$. maximum queue length
4. how muny pallets and base plates are needed to supply the
whole system.
5. total time spend in the system by the pallet.
3.3 Model development
Ln the model developement, all the pallets are treated as
entities.[1j Along with them, several attributes are assigned to
represent their characteristics. These characteristics include the
times that pallet first arrived at both lines, the number of the
parts currently or. the pallet and the process time needed for the
current operation. The process times and the probabilities of
having a jam for all the parts are stored in memory arrays. All the
pallets queuing on the line are grouped into several files and all
the movements of the pallets are treated as activities.
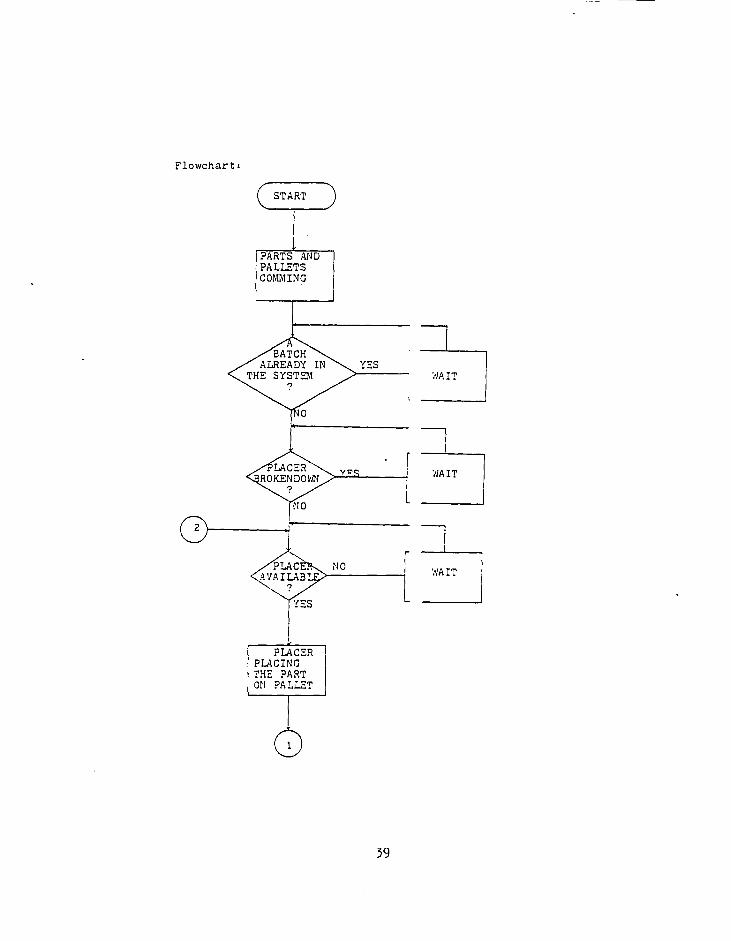
The pallets(entities) arrive at the palletizing line with a
predetermined rate. After arriving at the palletizing line, the
pallet wait for seizing the resources(placer and part) in a waiting
file. When a pallet seizes the placer and part, its attributes are
reviewed, then the process time needed and the probability of having
a jam and the time needed to solved the jam are determined from the
memory arrays. Whenever placing a part on a pallet is completed,
the placer is released and the next pallet comes in(if there ia one
waiting) and seizes the resources again. The original pallet is
10
routed to a checking point(gate) and then will be routed back to
waiting file or out of palletizing line according to the values of
its attributes(to check how many parts already on the pallet).
Before entering the palletizing line, there is another checking
pomt(gate) in which a counter and a setting number( batch size) are
used to prevent more than N pallets from coming into the waiting
file in the same time.
The pallet which carries the parts enters the assembly line
with a predetermined rate. After arriving at the assembly line, the
pallet waits for seizing the resources(assembler and base plate) in
a waiting file. When a pallet seizes the placer and base plate, its
attributes are reviewed, then the process time needed and the
probability of having a jam and the time needed to solved the jam
are determined from the memory arrays. In the same time, another
memory array is also reviewed to determine which steps the special
treatments will be needed. Whenever these steps are reached, the
base plate will be routed to another station for processing and then
be routed back. After assembling a product is completed, the
assembler is released and next pallet comes in(if there is one
waiting) and seizes the resources again. The original pallet is
routed out of the system and will release the base plate after some
time period.
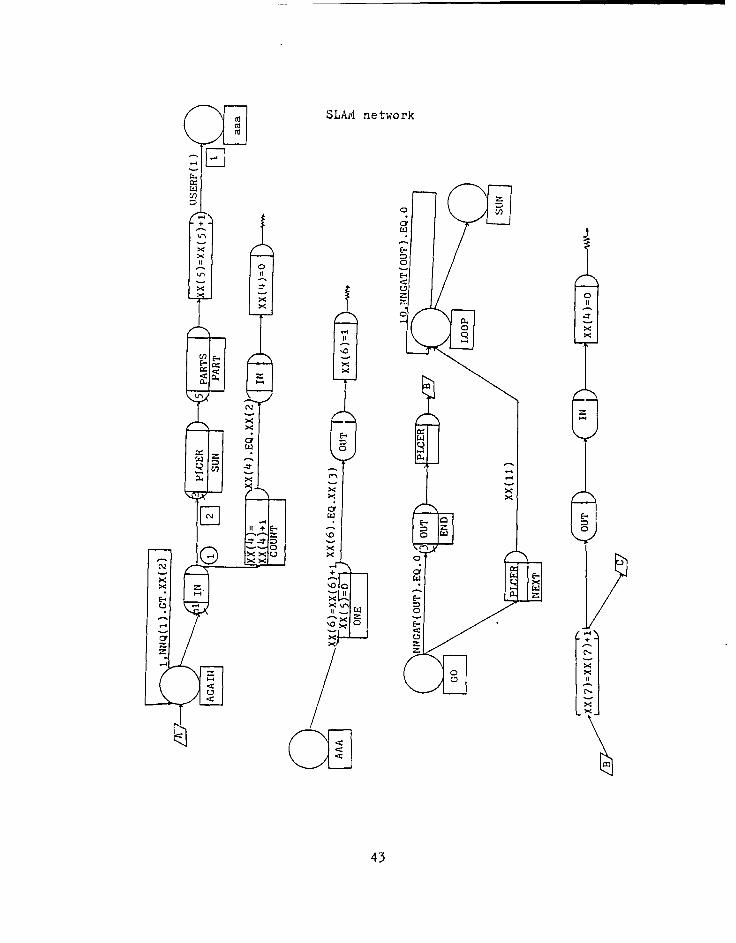
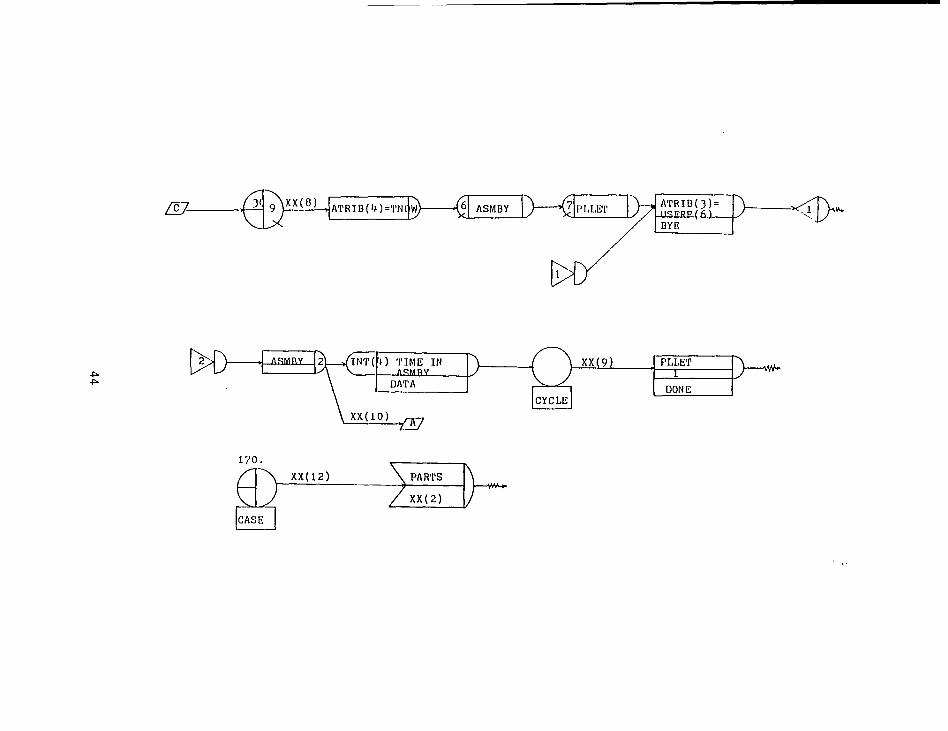
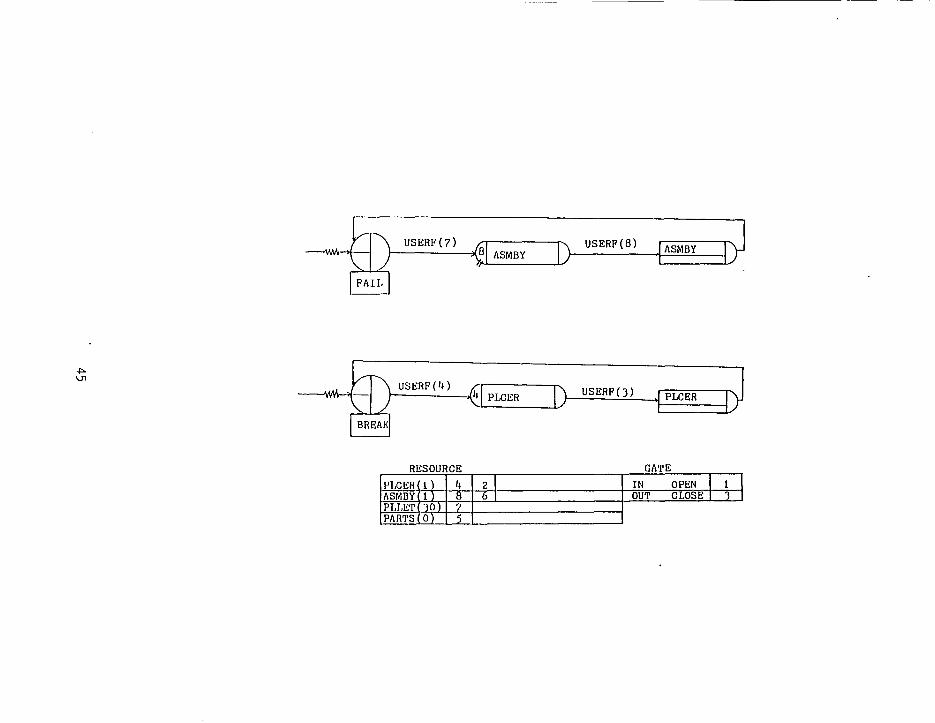
The whole system was then programmed in the SLAM format. The
11
number of operations and the process time for individual operation
could be assigned to any values to simulate different product which
would like to be produced in this system. In the actual execution
of the simulation, the number of operations for assembling a product
is 20 and the average process time is assigned to 8.5 second. The
base plates available at the beginning is assigned to 30.
Acctually, after taken some simulation runs, we found 2 base plates
are enough for the system if there has no time delay between pallet
is routed out and then release the base plate. Approximately 17000
parts were used for each 24-hours simulated period. The time unit
was equal to 1 second.
12
4- STATISTICAL ANALYSIS OF THE RESULTS
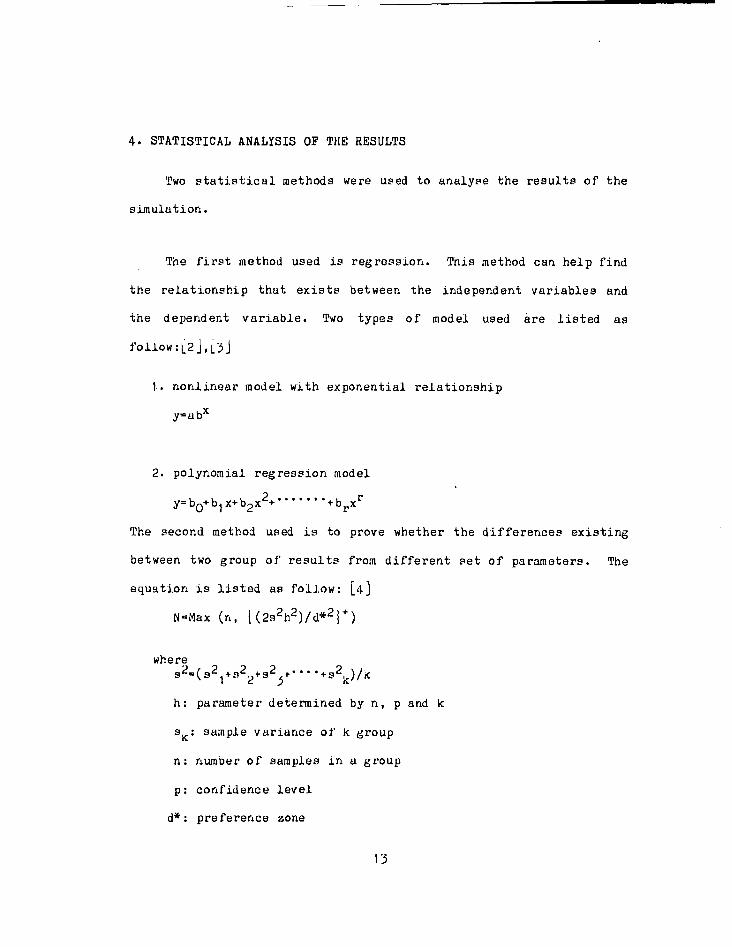
Two statistical methods were used to analyse the results of the
simulation.
The first method used is regression. This method can help find
the relationship that exists between the independent variables and
the dependent variable. Two types of model used are listed as
follow:L2j,L3j
1. nonlinear model with exponential relationship
y=abx
2. polynomial regression model
y=bQ+b1x+b2x'l+ "' ' + brx
The second method used is to prove whether the differences existing
between two group of results from different set of parameters. The
equation is listed as follow: [4]
N=Max (n, |(2s2h2)/d*2}+)
where s2-(s2
1 + s22+s2
:5+ +s2k)/k
h: parameter determined by n, p and k
Sj: sample variance of k group
n: number of samples in a group
p: confidence level
d*: preference zone
13
k: number of groups
14
5. SIMULATION RESULTS
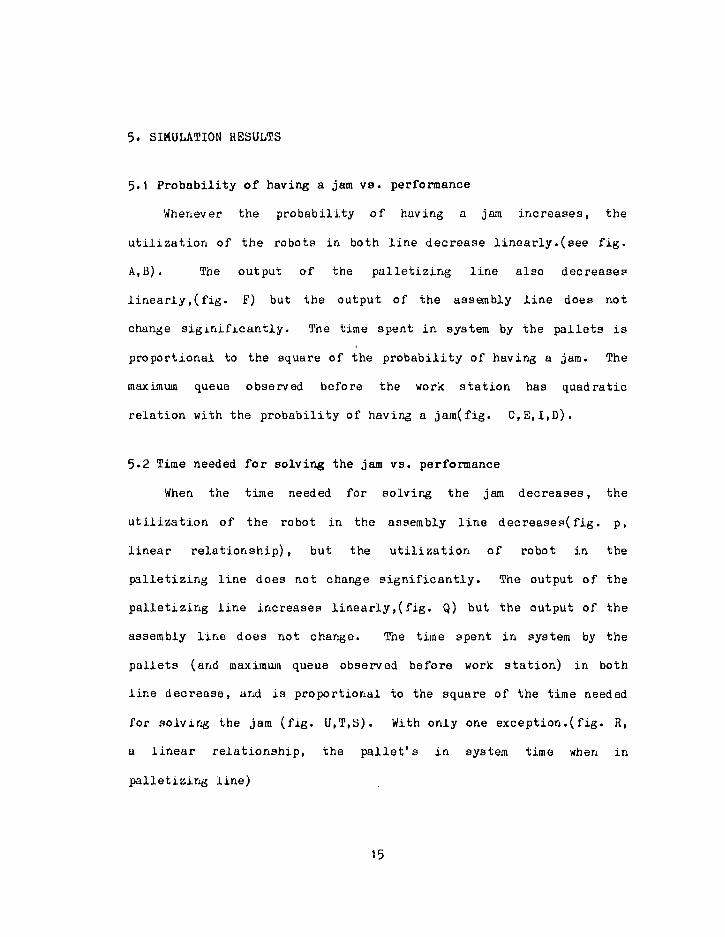
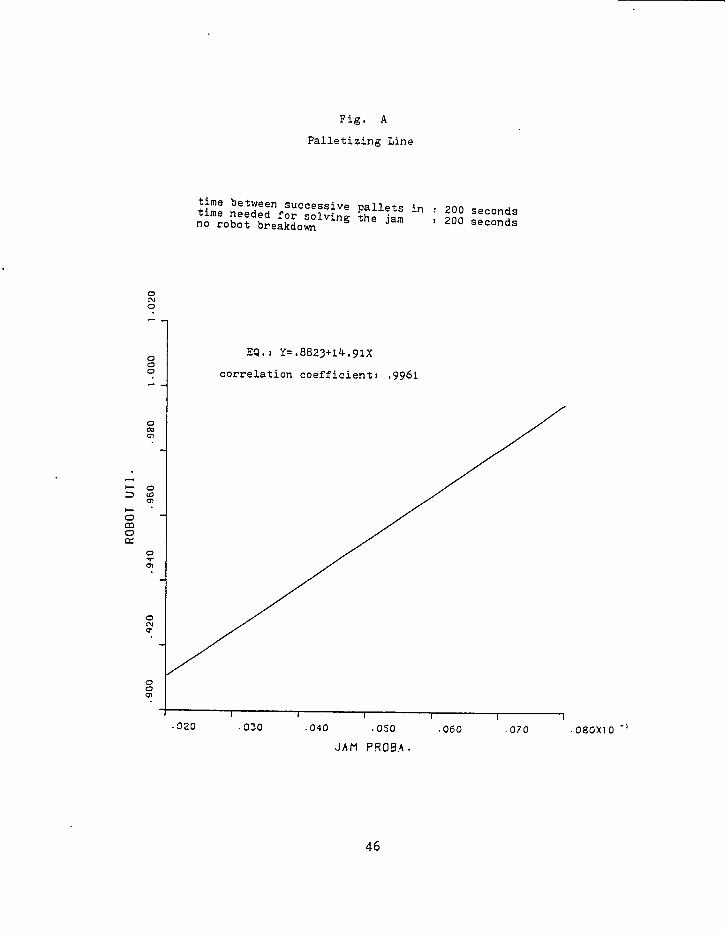
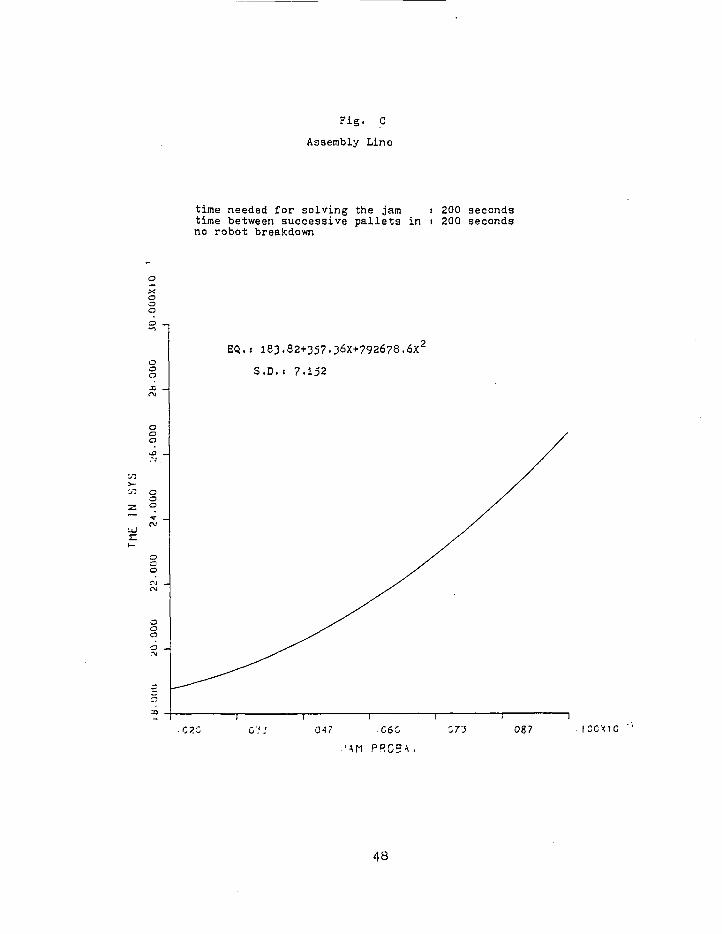
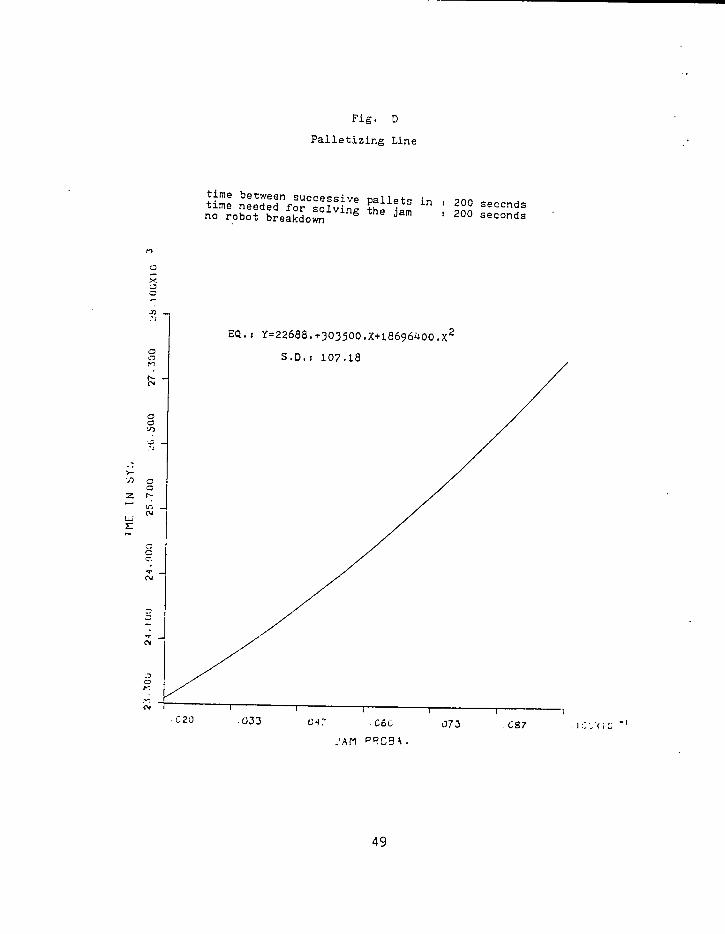
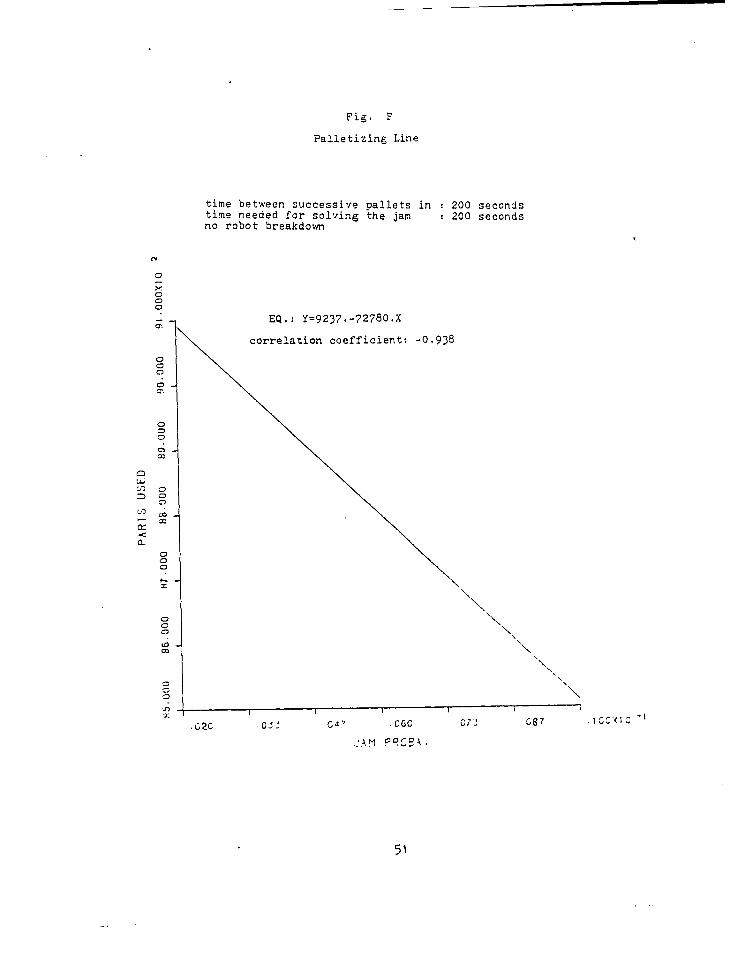
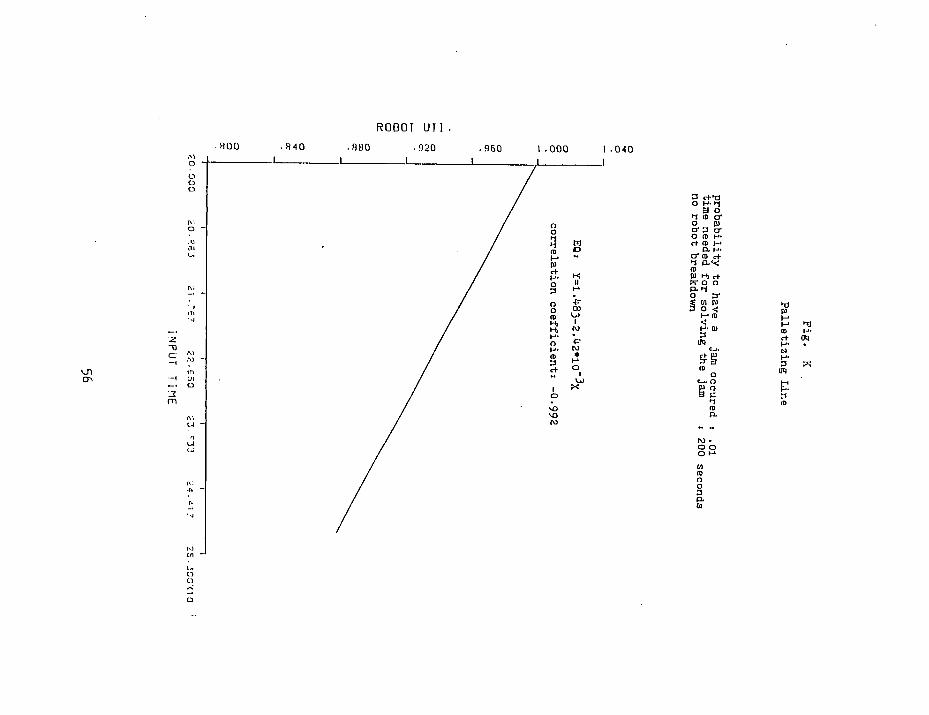
5.1 Probability of having a jam vs. performance
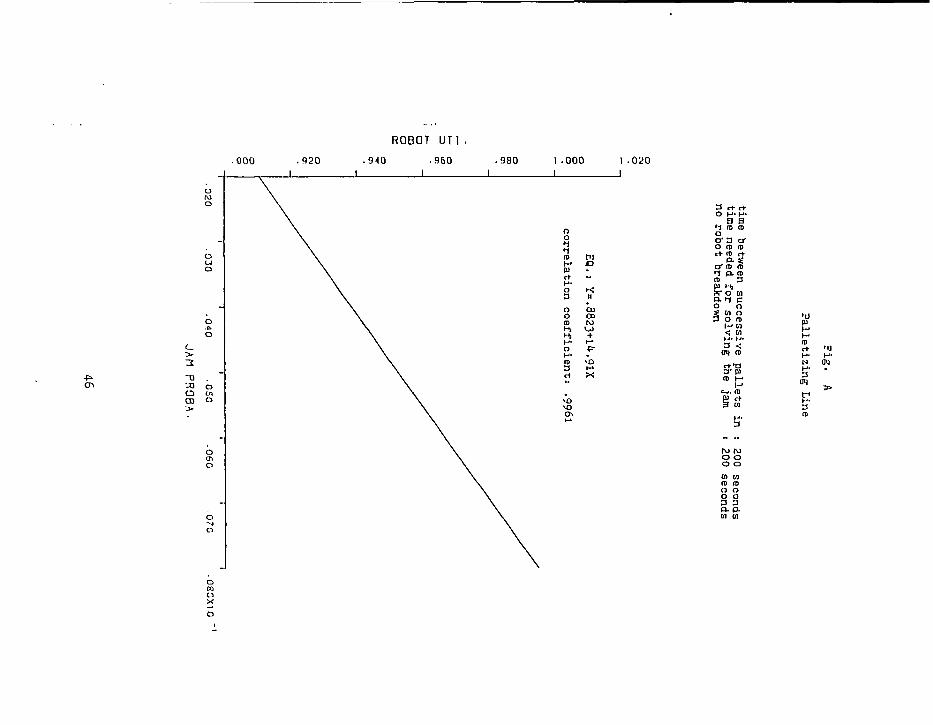
Whenever the probability of having a jam increases, the
utilization of the robots in both line decrease linearly.(see fig.
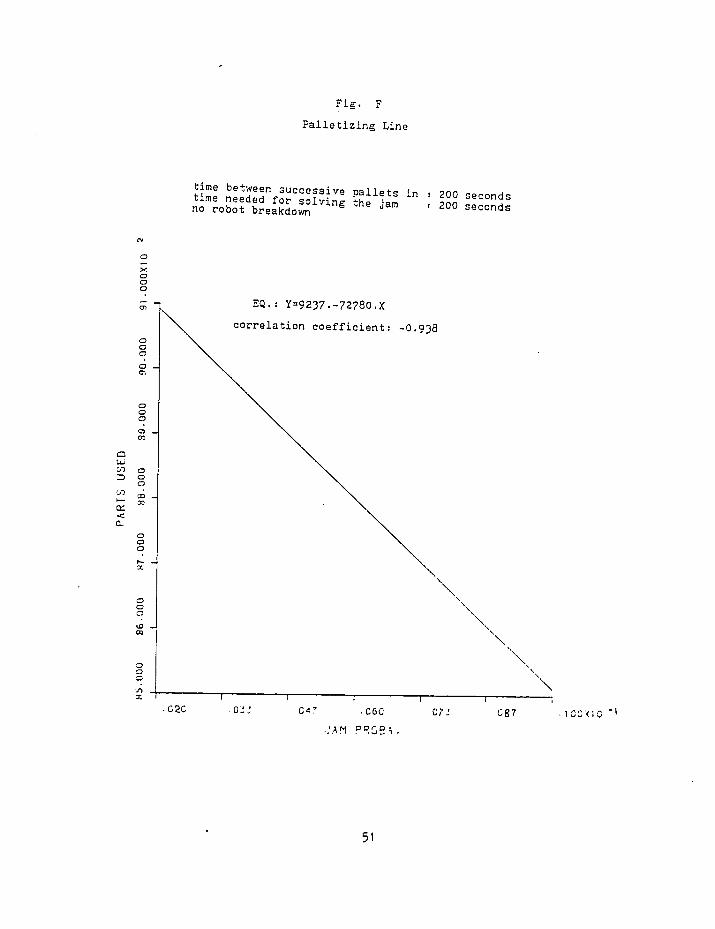
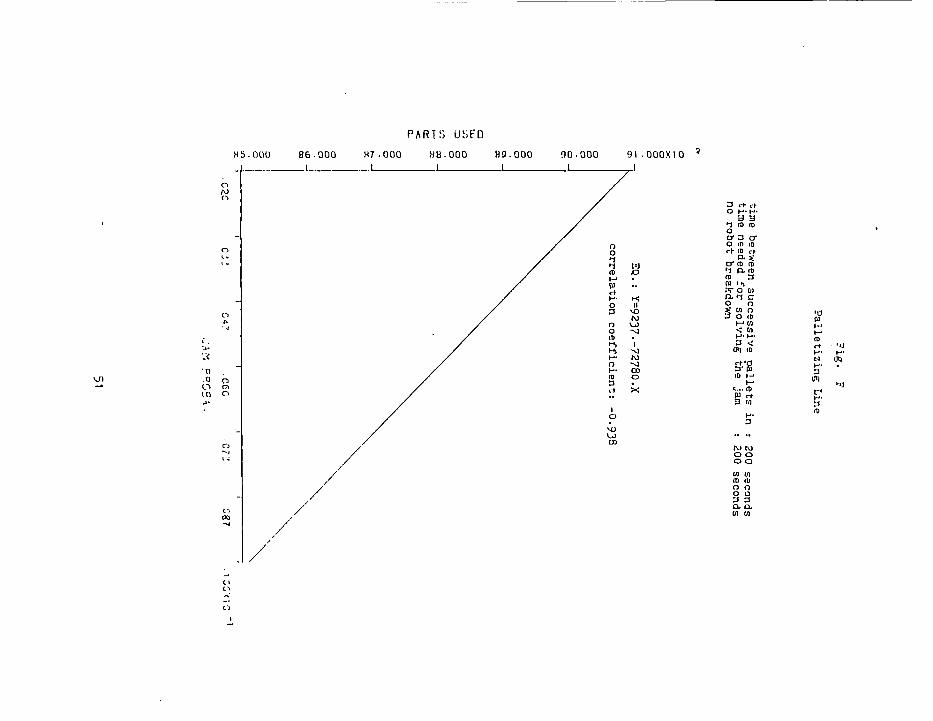
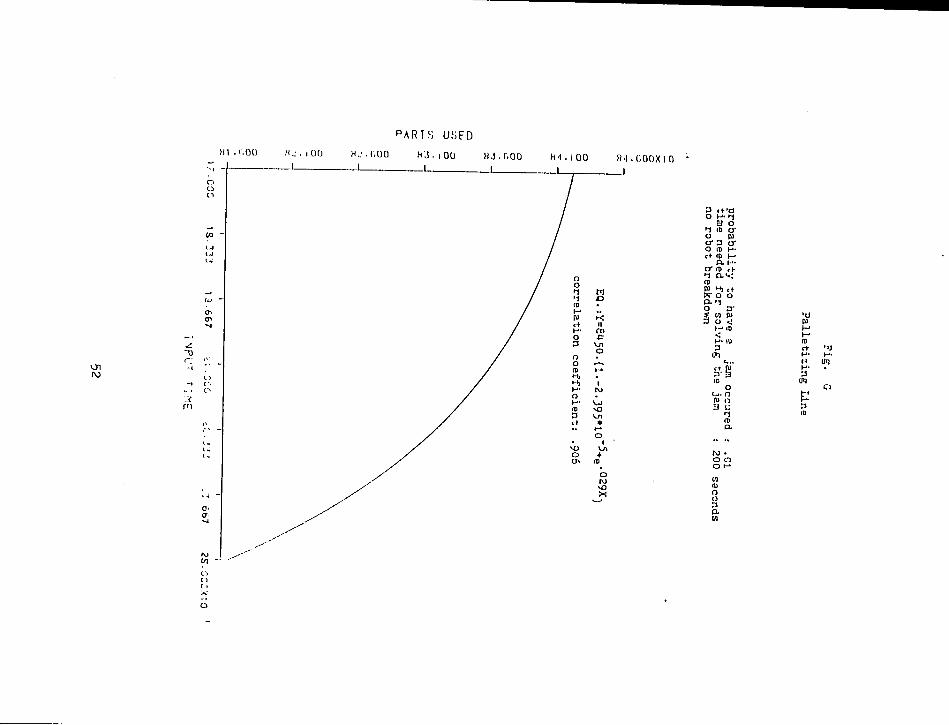
A,B). The output of the palletizing line also decreases
linearly,(fig. F) but the output of the assembly line does not
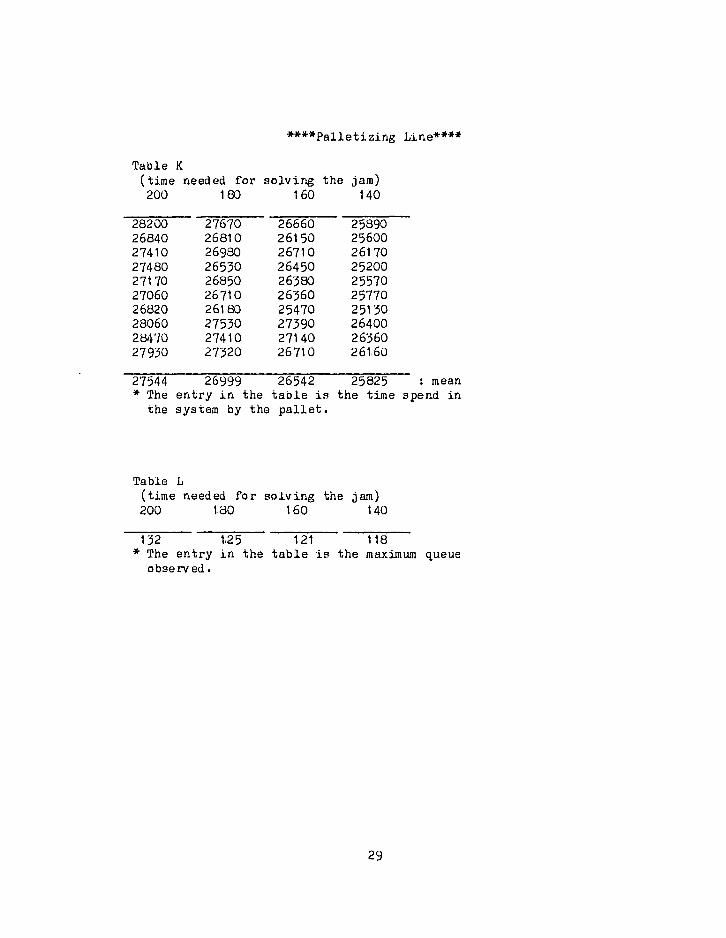
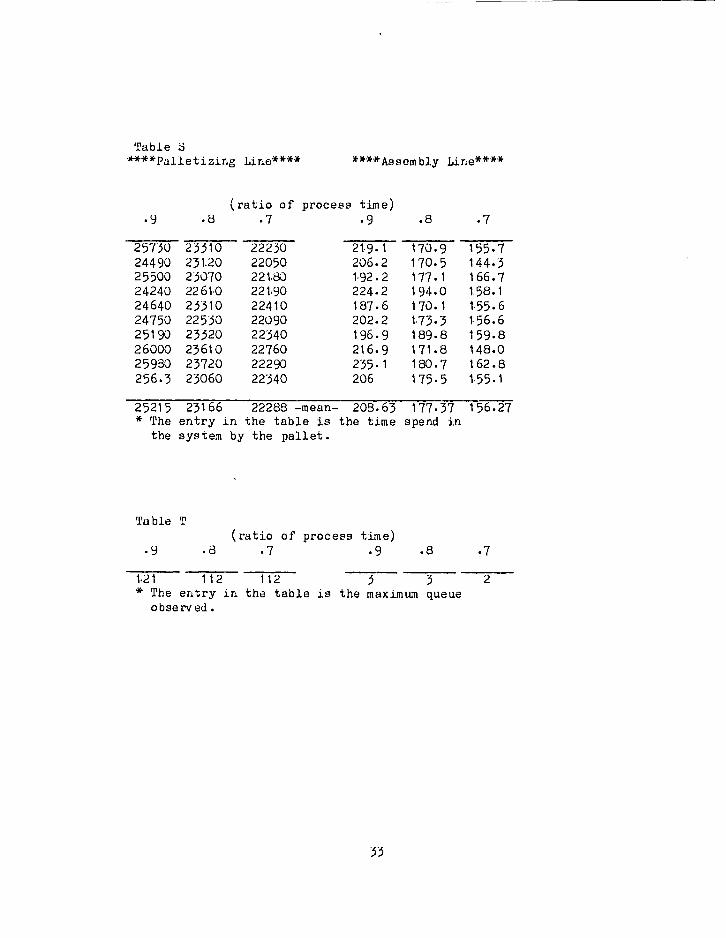
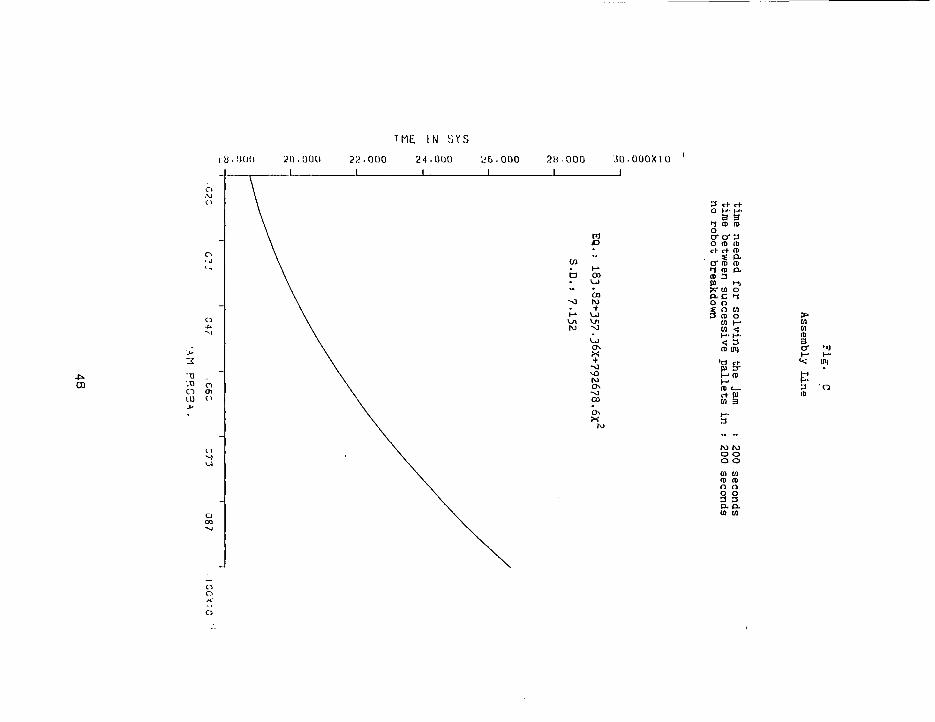
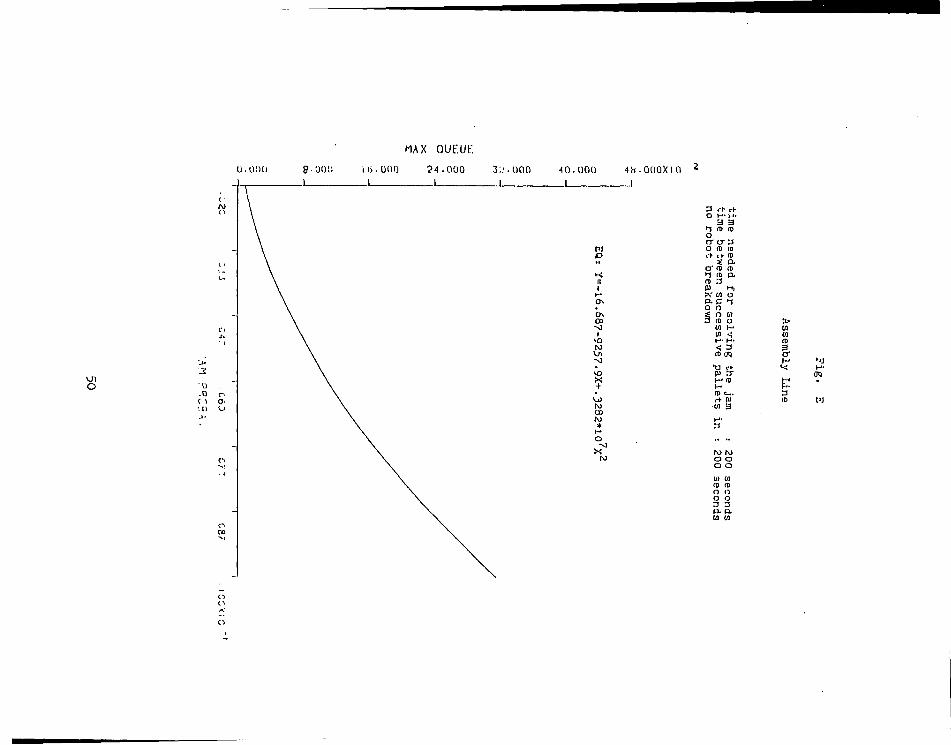
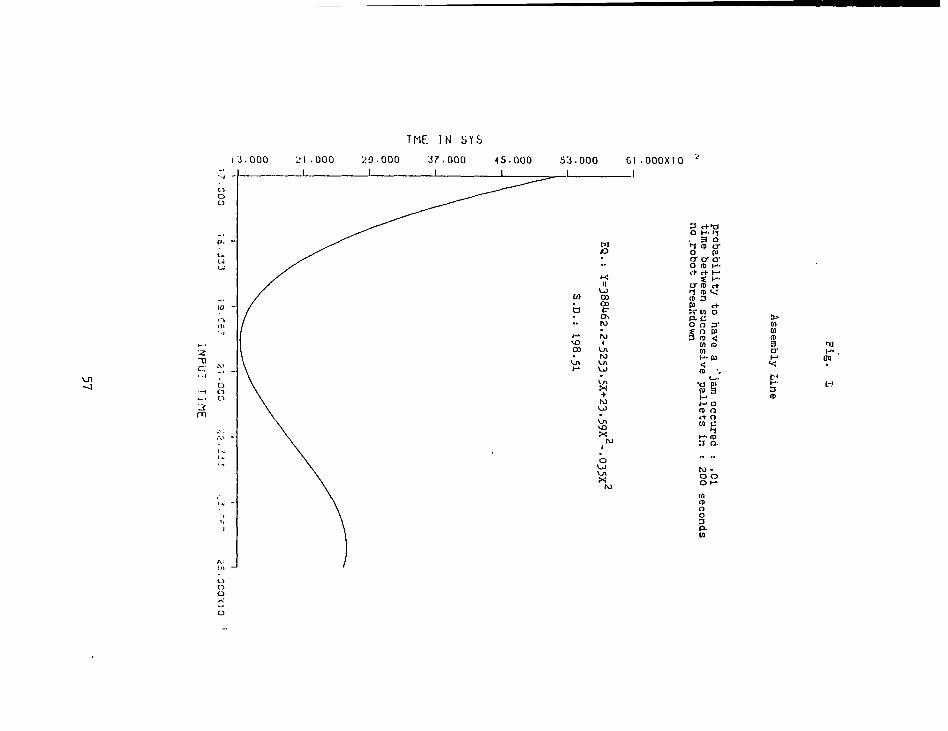
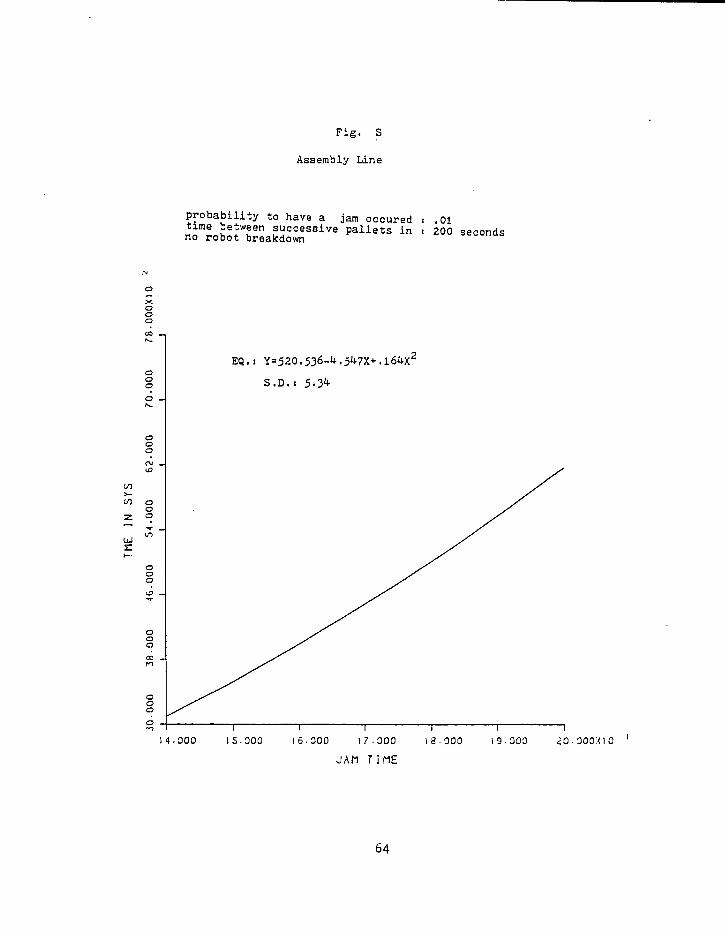
change siginificantly. The time spent in system by the pallets is
proportional to the square of the probability of having a jam. The
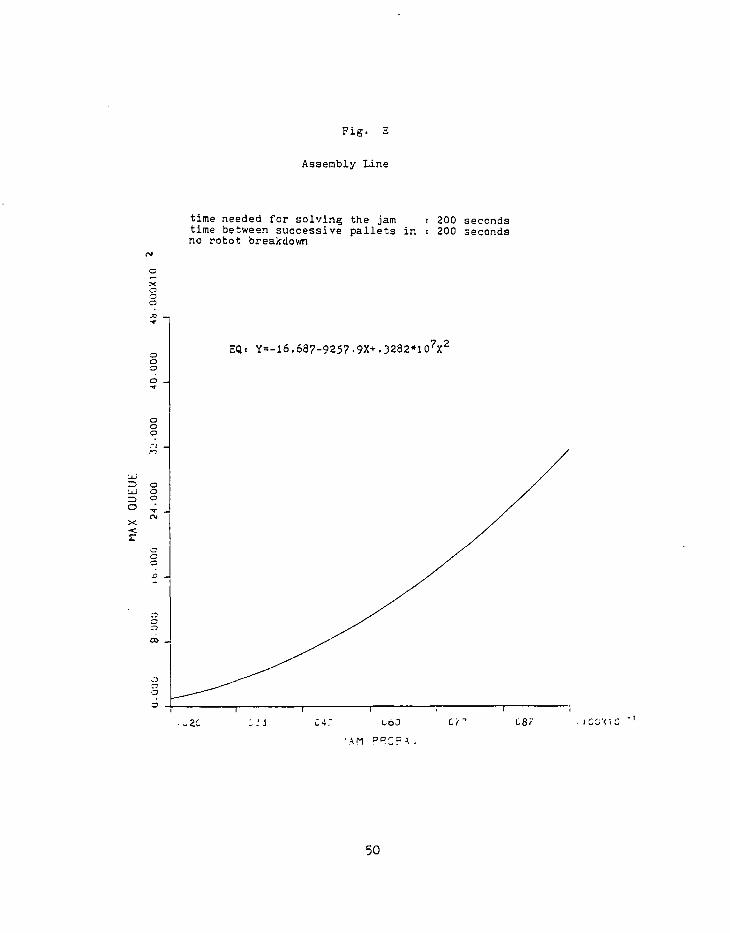
maximum queue observed before the work station has quadratic
relation with the probability of having a jam(fig. C,E,I,D).
5-2 Time needed for solving the jam vs. performance
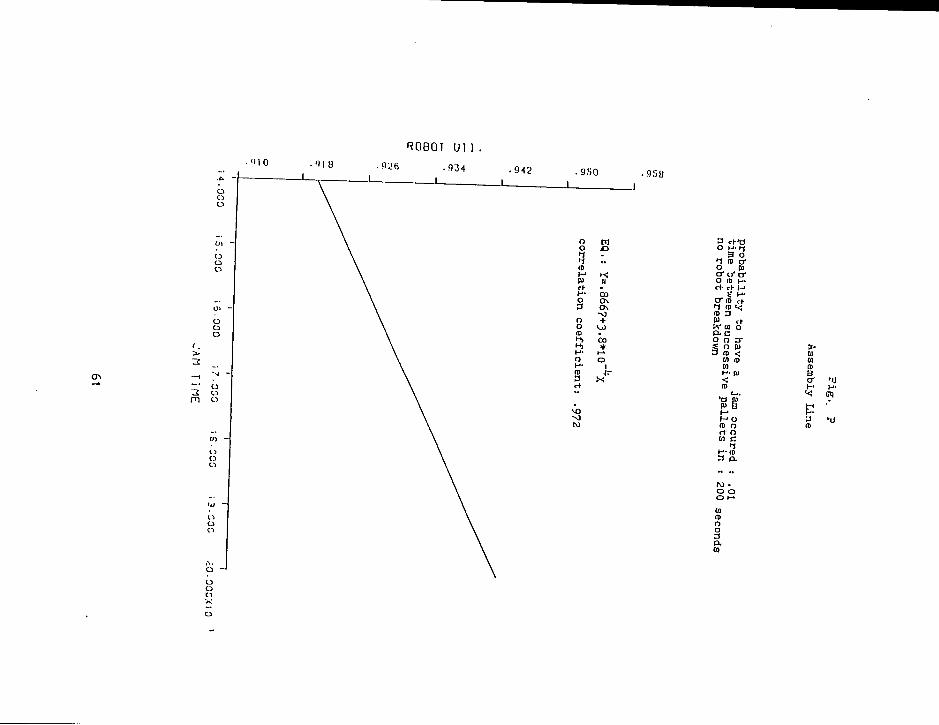
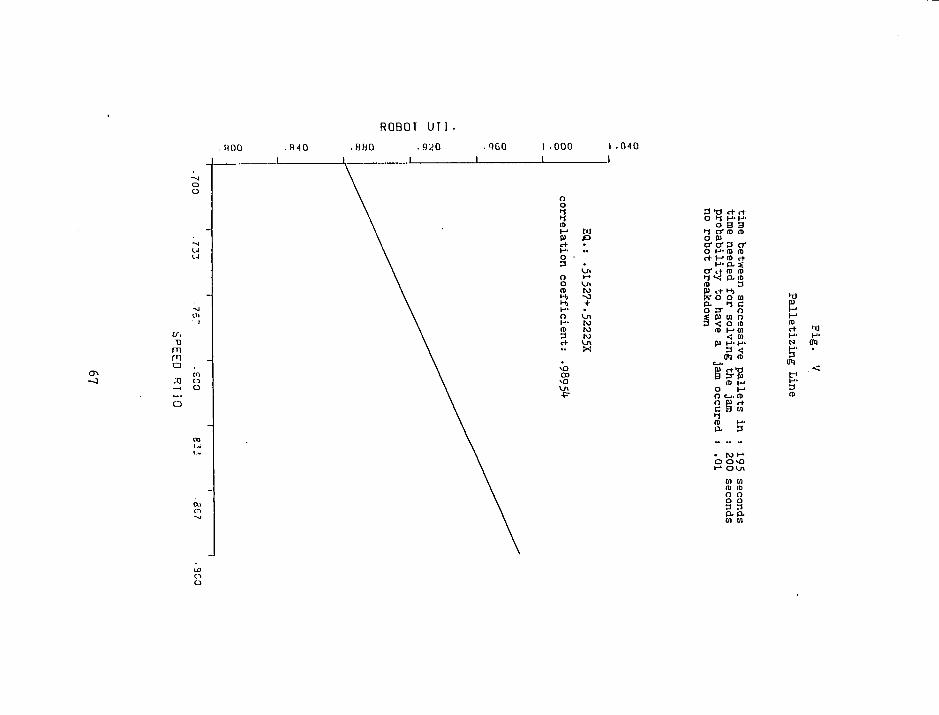
When the time needed for solving the jam decreases, the
utilization of the robot in the assembly line decreases(fig. p,
linear relationship), but the utilization of robot in the
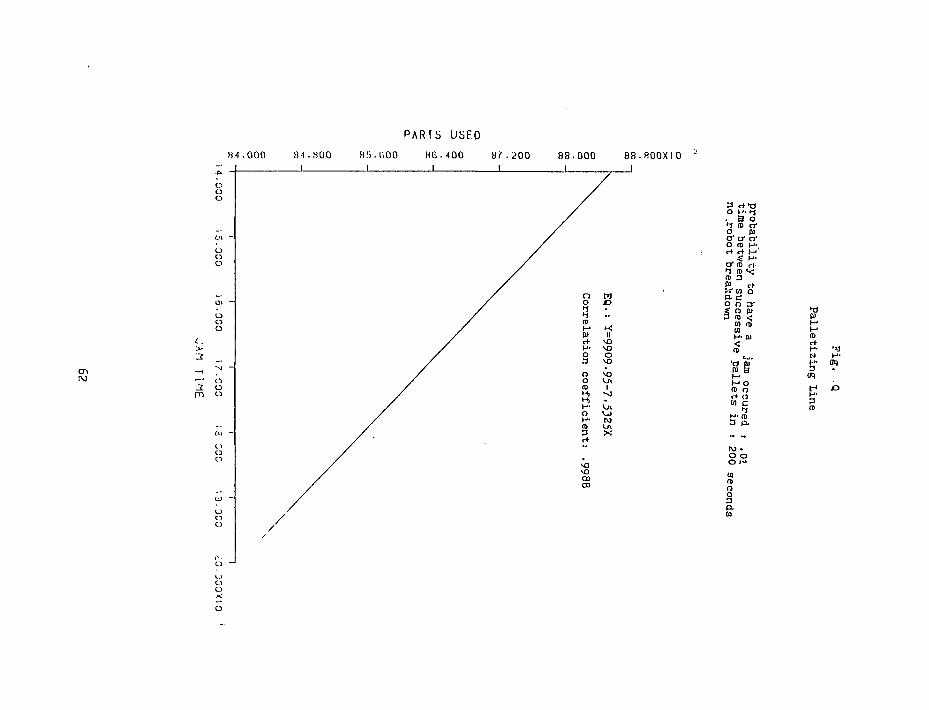
palletizing line does not change significantly. The output of the
palletizing line increases linearly,(fig. Q) but the output of the
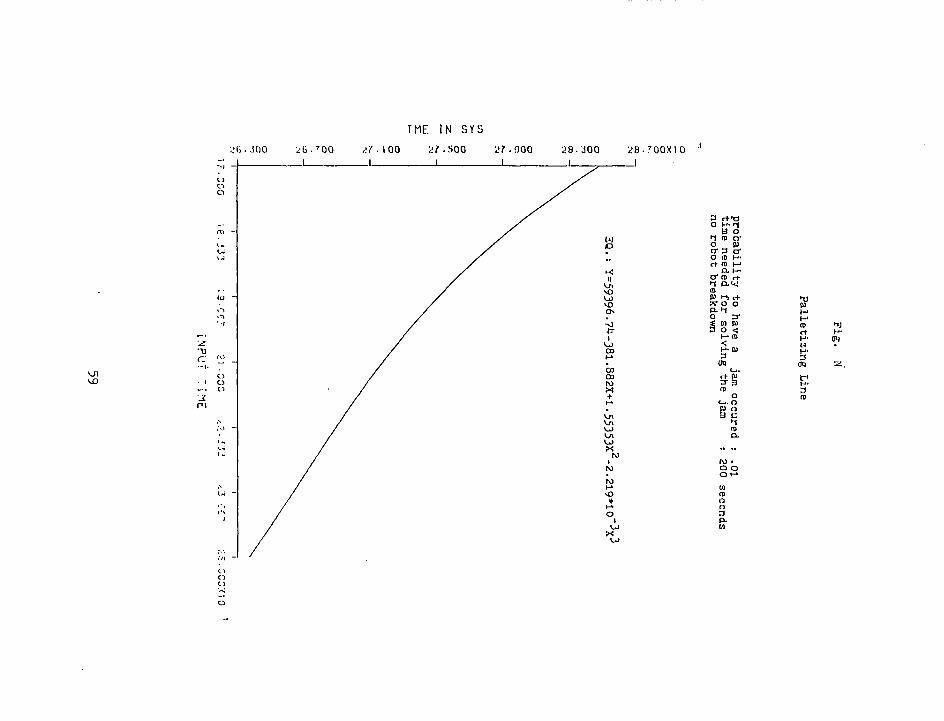
assembly line does not change. The time spent in system by the
pallets (and maximum queue observed before work station) in both
line decrease, and is proportional to the square of the time needed
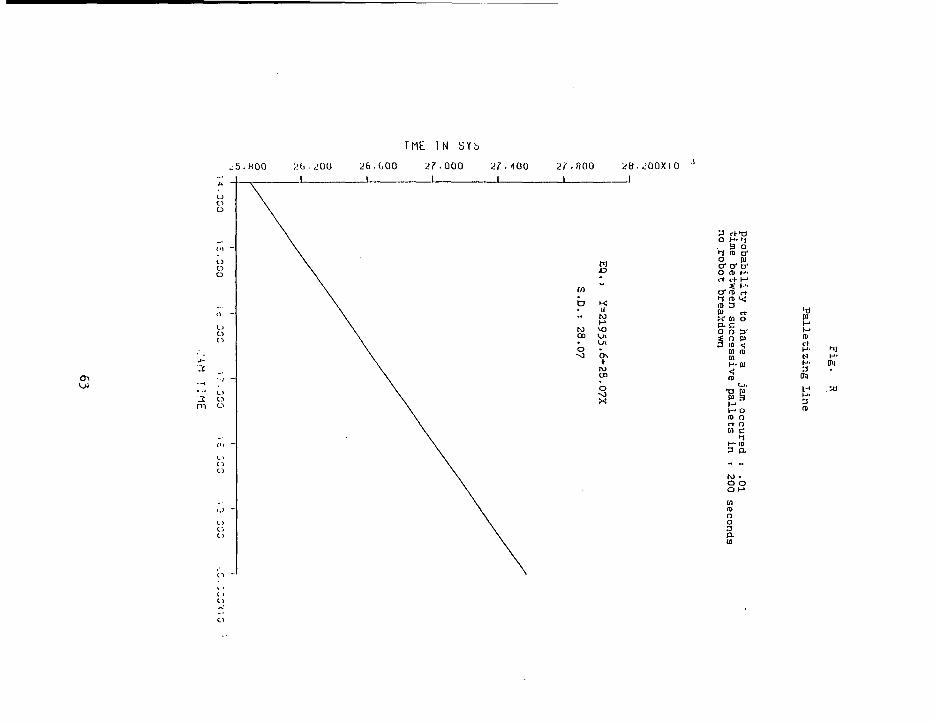
for solving the jam (fig. U,T,S). With only one exception.(fig. R,
a linear relationship, the pallet's in system time when in
palletizing line)
15
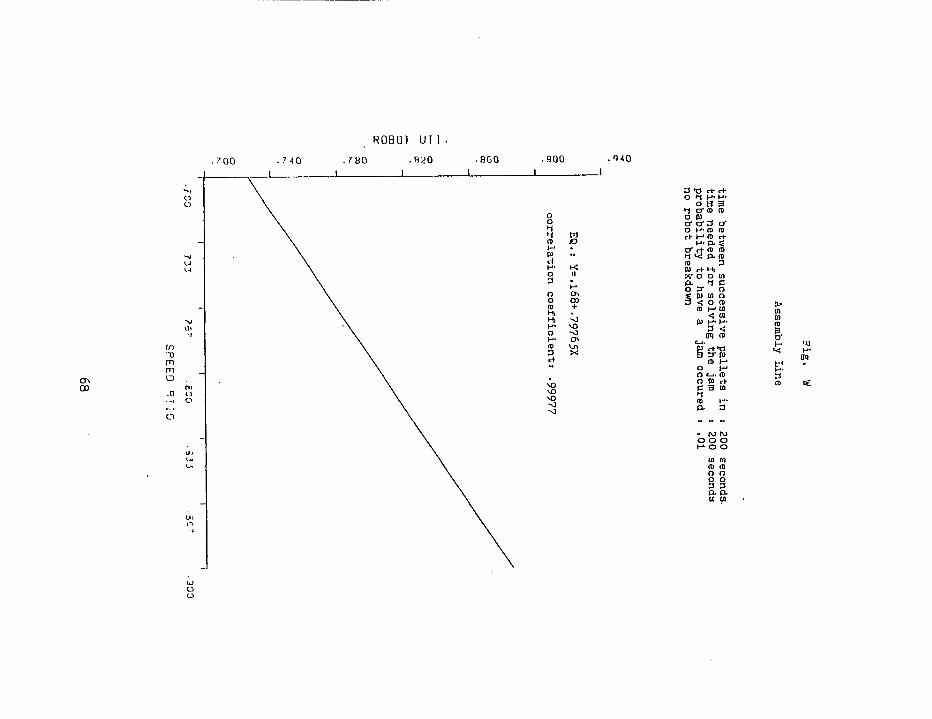
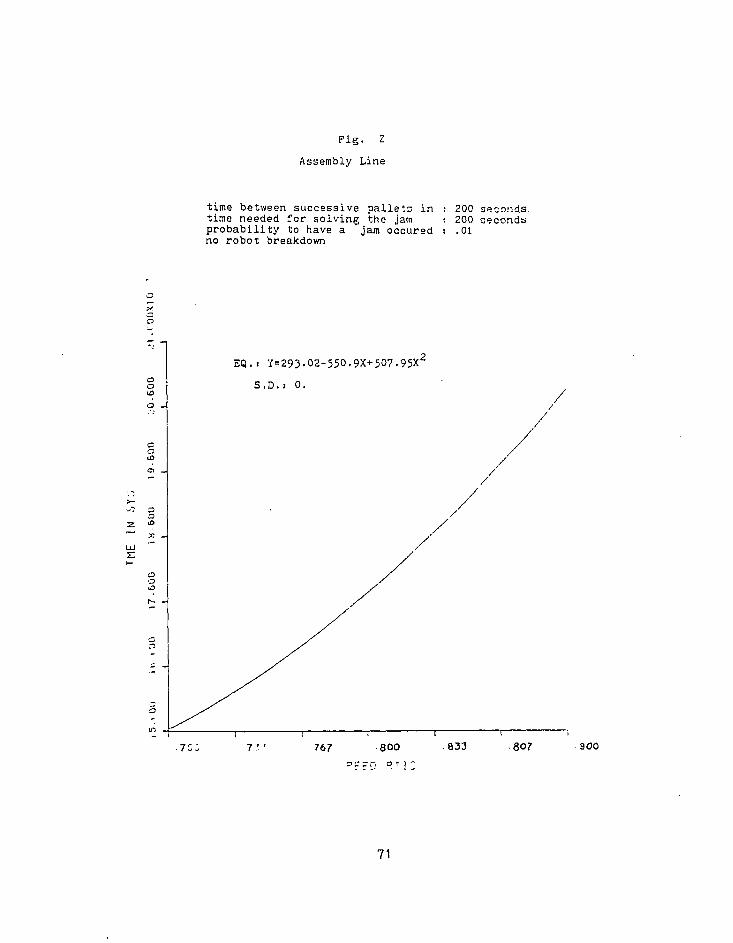
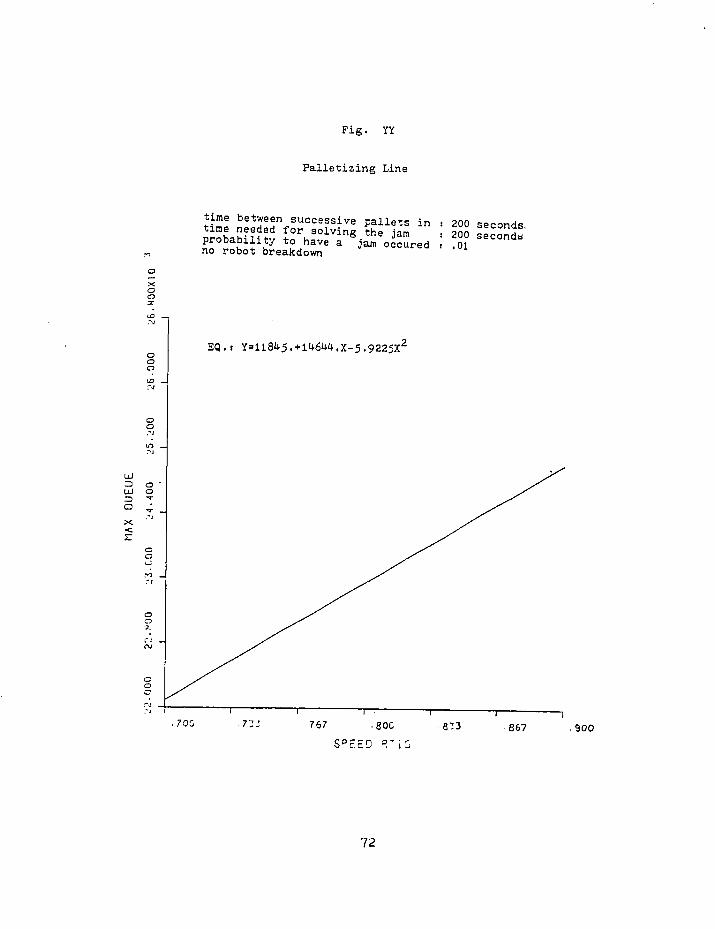
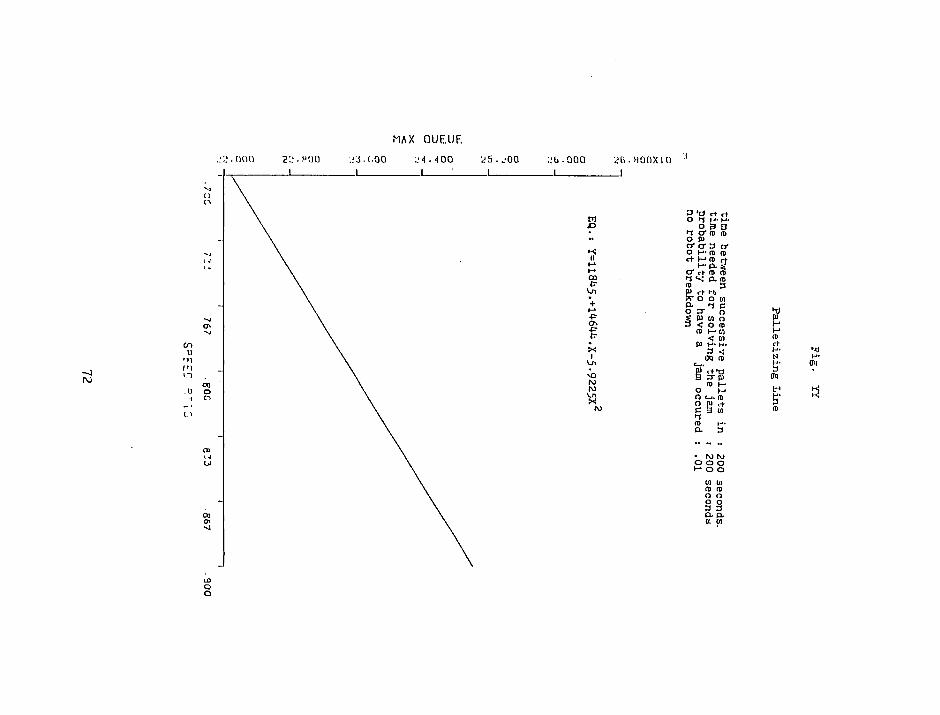
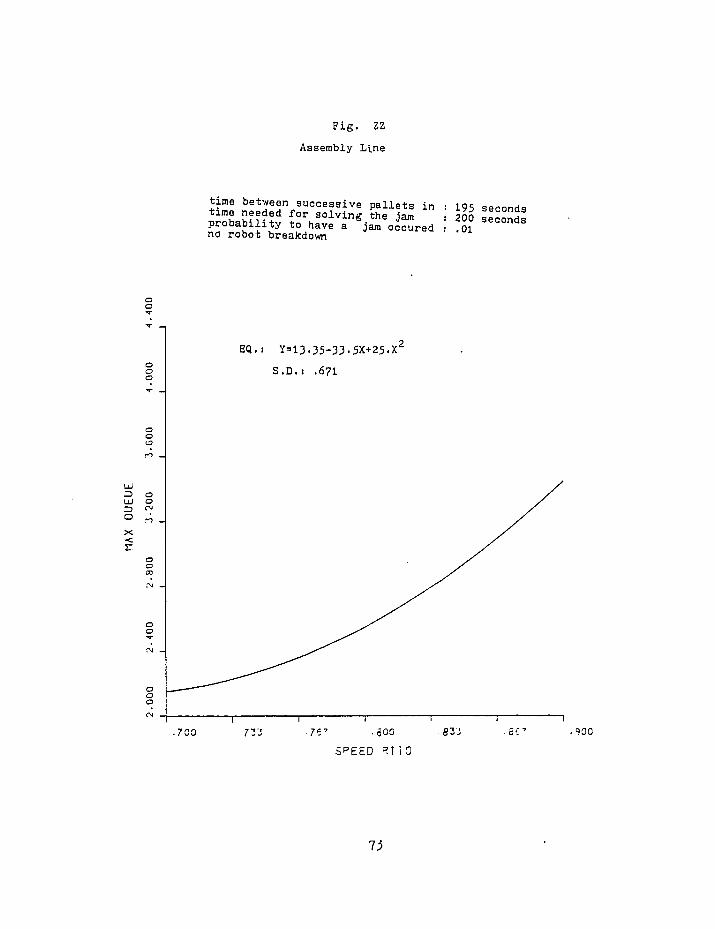
5»3 Processing time vs. performance
When the process time of the operations decreases(from 100^
improves to 70/0, the utilization of the robots in both line
decreases linearly.(fig. W,V) The output of the palletizing line
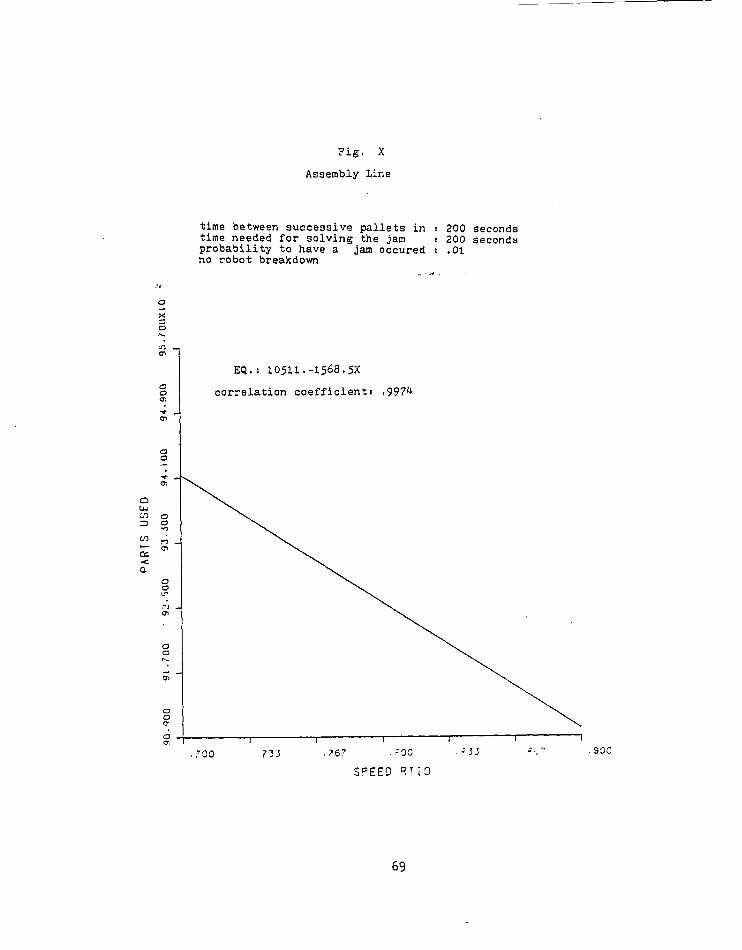
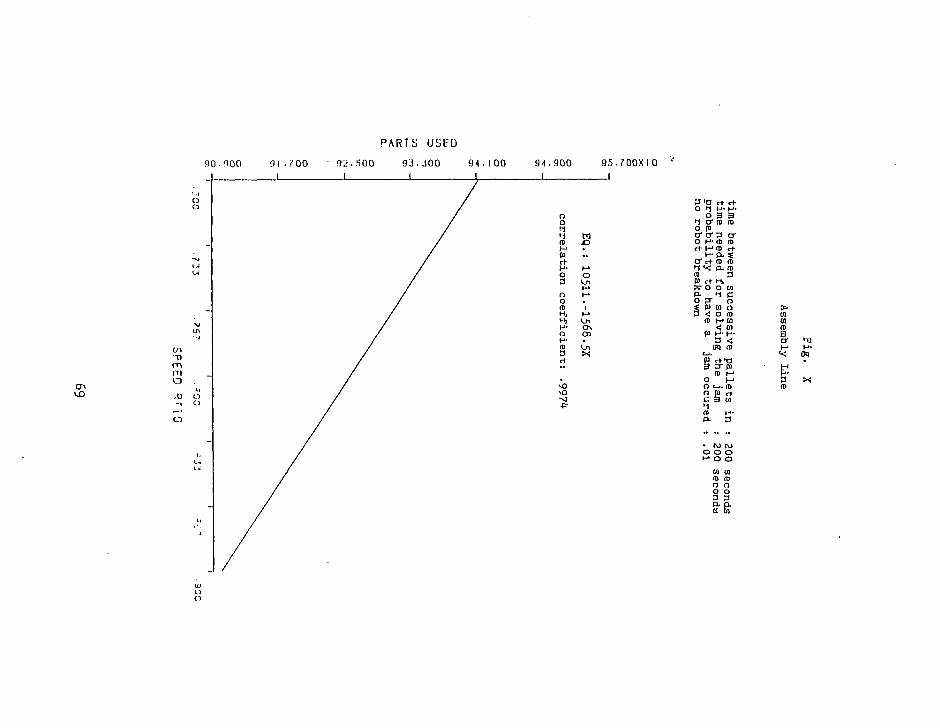
increases linearly (fig. X), but the output of the assembly line
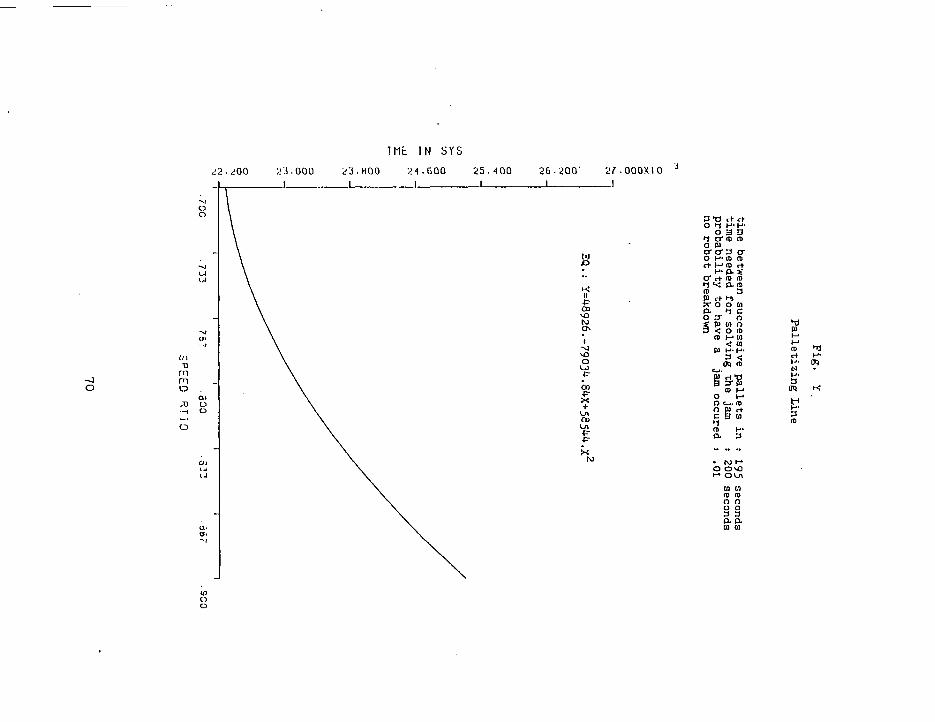
does not have a significant change. The time spent in system by the
pallets and maximum queue observed before the work station in both
lines decreases and is proportional to the square of the processing
time(fig. Y, Z.YY.ZZ).
5»4 Time between successive pallet's arrival vs. performance
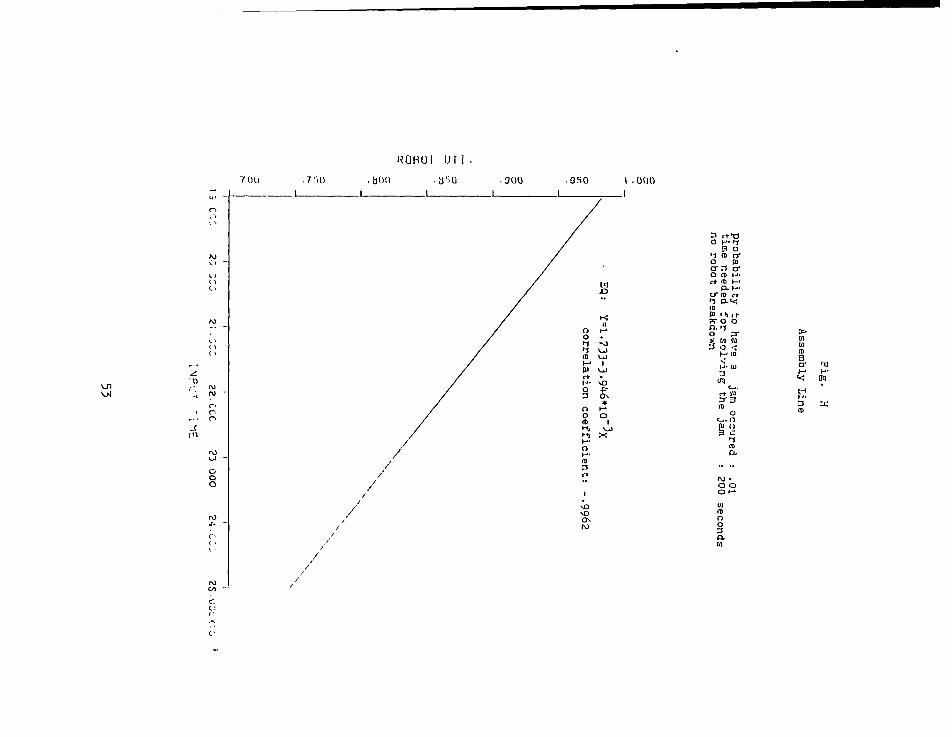
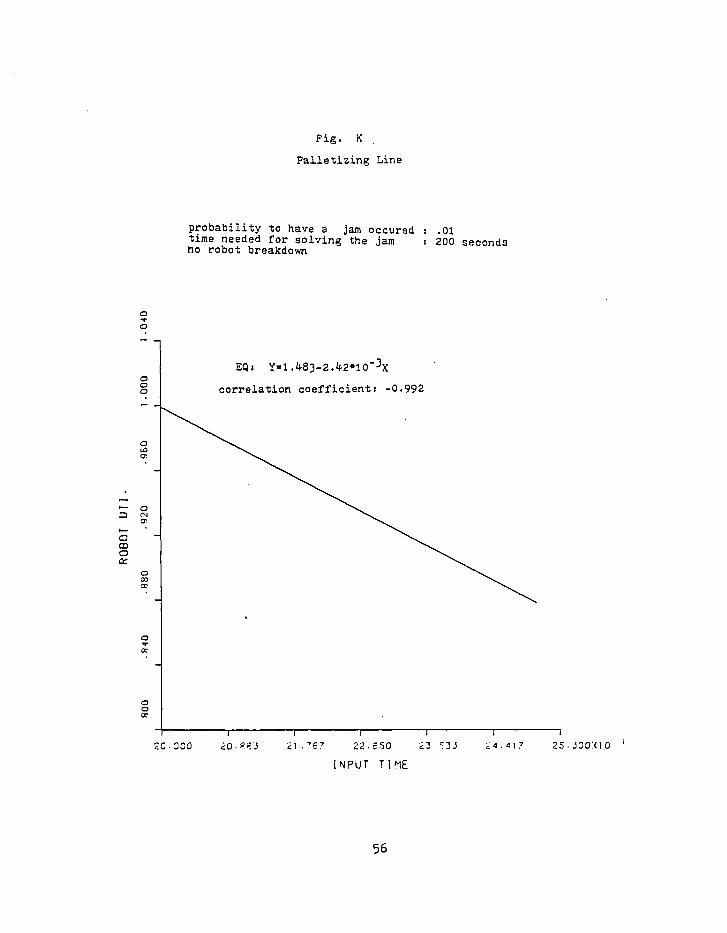
Whenever the time between successive pallet's arrival
decreases, the utilizations of the robots in both line increase
linearly until the 100,2 utilization rate reached.(fig. K,H) The
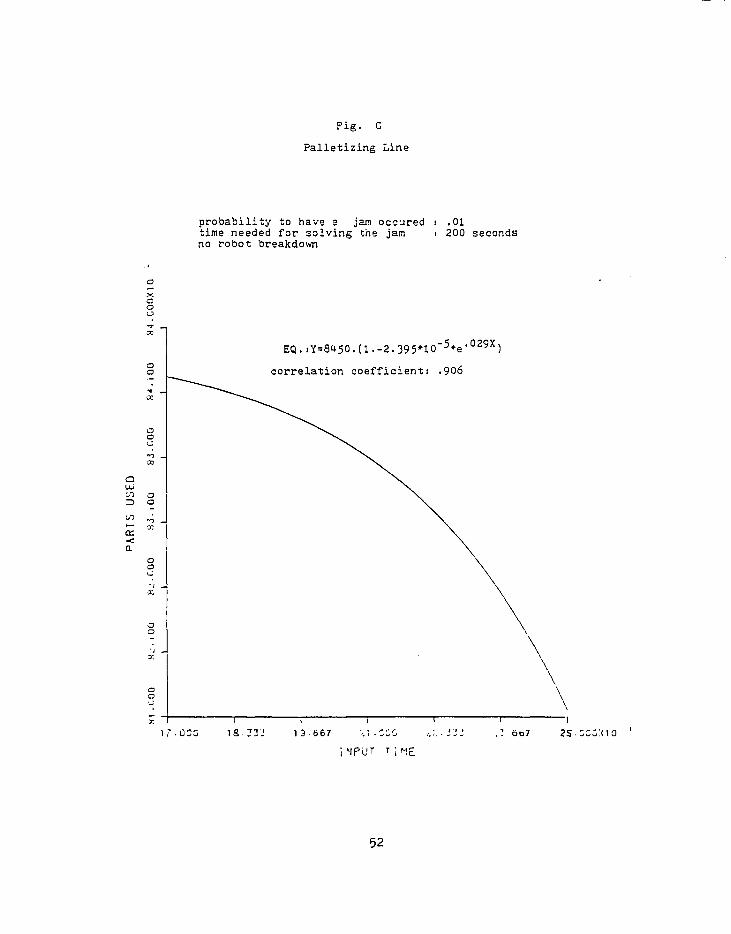
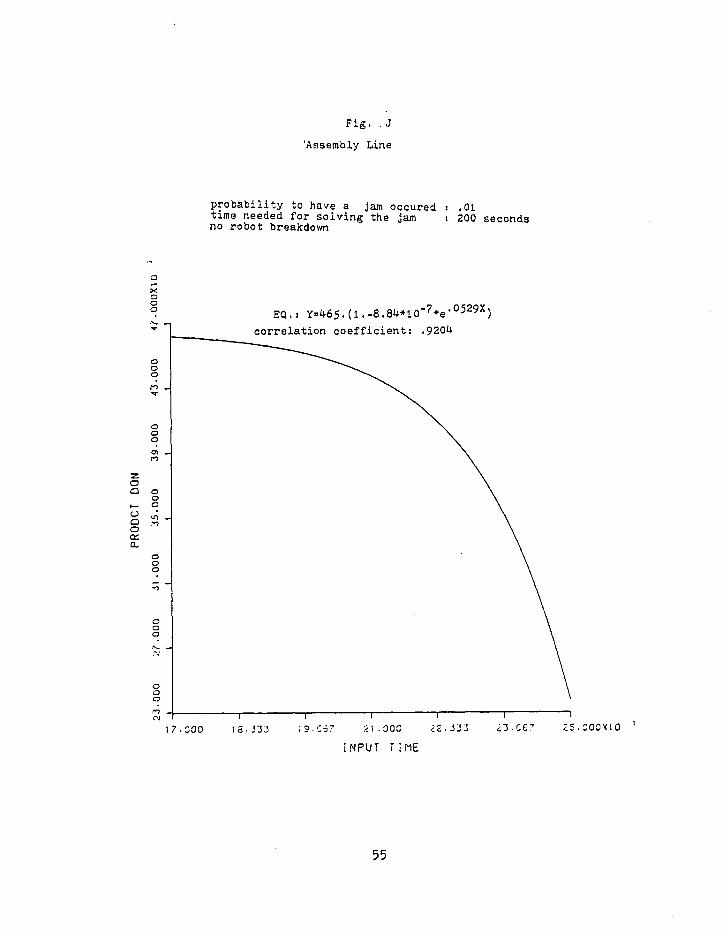
outputs of these two lines increase and have exponential
relationships(fig. J,U). The time spent in system by the pallets
and the maximum queue observed in both lines decrease with respect
to the change of processing time( cubic relationships).
16
6. DISCUSSION
6.1 Reliability of the results
All the results obtained from the simulation were used to
generate several emprical equations by means of regression.
Accompanied with the equations generated, a correlation coefficient
or a standard deviation has been caculated to make sure the equation
is a good fit. Ail the equations have significantly high
correlation coefficients.
6.2 The time spent in system by the pallets and maximum queue
observed
From the results listed before, whenever the factors changed,
the time spent in system by the pallets always has a similar
variation with the maximum queue observed and all have square or
cubic relationships. This means that these two types of performance
change more quickly than those of factors.
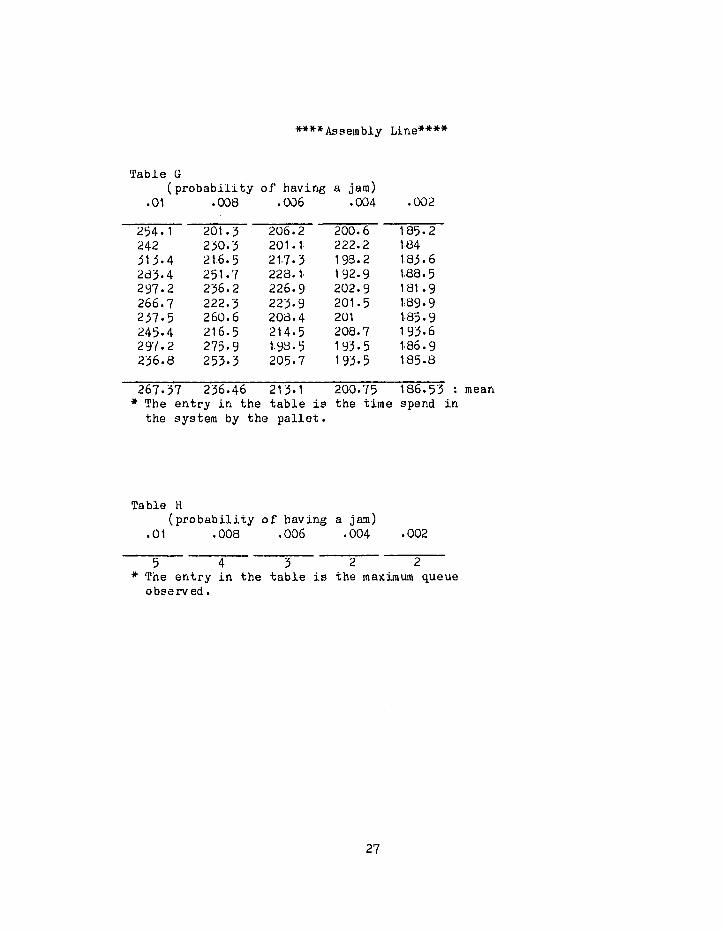
Both lines have a lower bound of the maximum queue observed.
In the assembly line the value is 2. in the palletizing line the
value is 112 which is a little higher than the batch size(lOO) and 2
more higher than the initial value(l10 Was assumed in the
simulation).
17
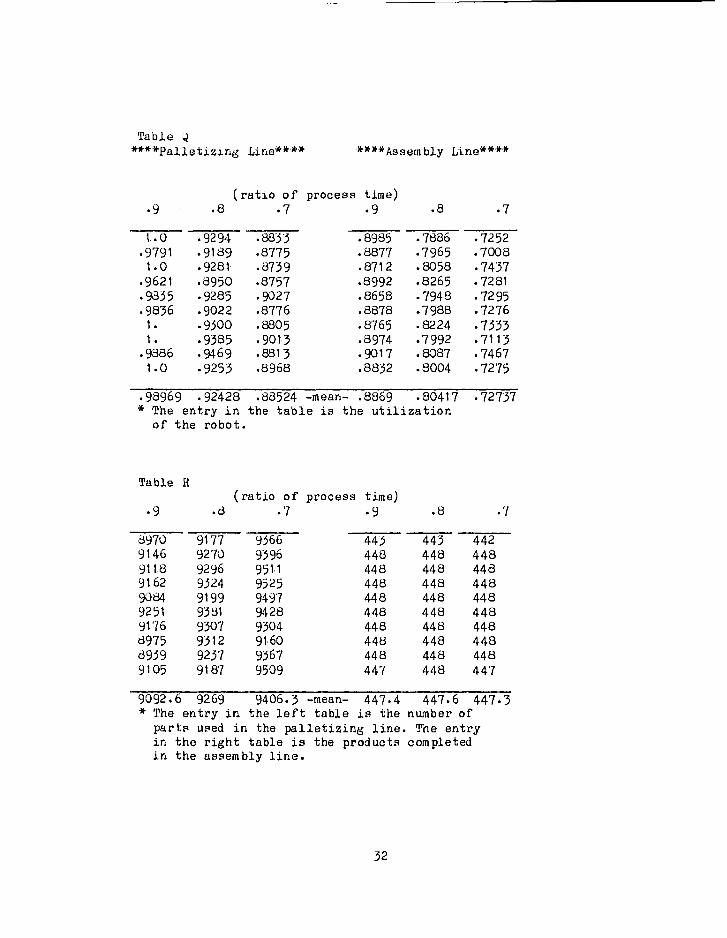
6-3 Robot's utilization
From the results listed before, The robot's utilization always
changed linearly when factors changed except Vs. the time needed for
solving the jam changed in the palletizing line. In this
exceptional case, the robot's utilization stayed around 100$ which
means that in this palletizing line, the robot is always too busy
and the effect of the time needed for solving the jam is not so
significant to affect it.
6.4 Output of the system
From the results listed before, except under the effectiveness
of changing the time between successive pallet's arrival(exponential
relationship vs. output and has an upper bound), the output of the
palletizing line has a linear relationship with respect to all the
factors. The output of the assembly line does not have a
significant change for all of these cases, and the factors do not
change the production rate of the assembly line. The reason is that
the pallet's input rate is too low to restrict the effectiveness of
the other factors.
18
7. CONCLUSIONS
From the results and disussion listed before, we can conclude
the following:
1. Maximum queue observed and the time spent in the system
by the pallet have simillar variation when the
factors(pallet's input rate, probability of having a jam,
time needed to resolve a jam and processing time)
changed. So, these two types of performance of the
system can be seen as the same index of the performance.
2. The output of these two lines(palletizing line and
assembly line) has an upper bound and this upper bound is
greatly influenced by the pallet's input rate(or time
between successive pallet's arrival). A too low input
rate will reduce the value of this upper bound(certainly
can not yield a high output) and a too high input rate
does not increase the output of the system(because there
is an upper bound). So, an optimal range of the pallet's
input rate which can yield the best performance exists
and can be found(obtain the highest output with the
lowest maxiraun queue observed).
3. Reducing the batch size in the palletizing line will
reduce the length of the circulating conveyor and the in-
19
process iriveritory(the pallets needed are less too). But
a too small batch size will result in excessive change-
over time of the work station and the pallet's
circulating time delay. So, theoretically, there is an
optimal range of the batch size , and this range can not
be found prior some cost informations(cost for pallet,
cost for conveyor, etc.)are obatained.
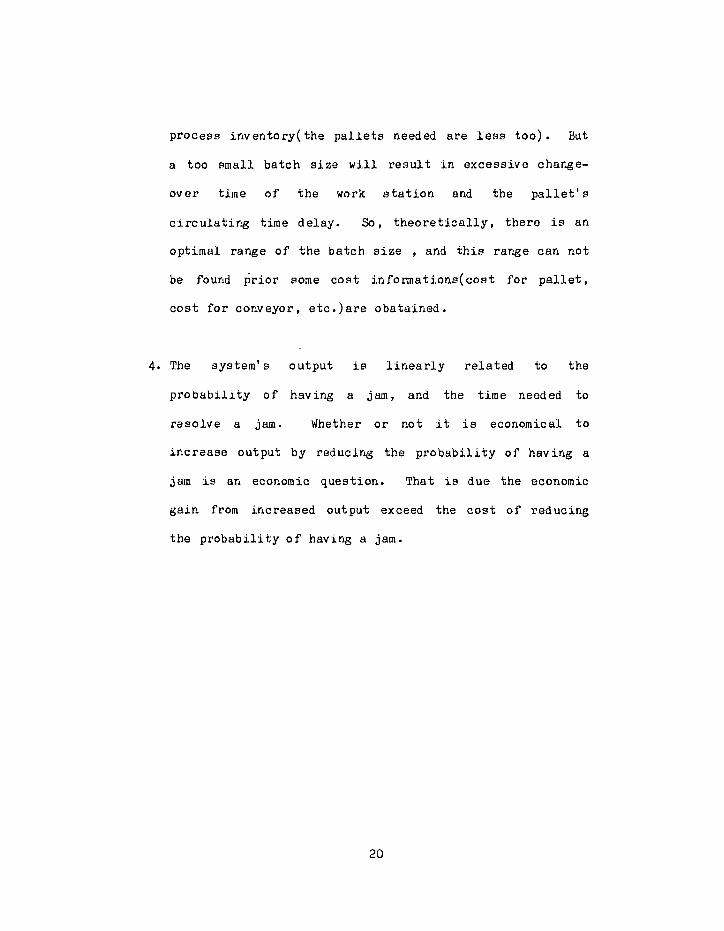
4. The system1s output is linearly related to the
probability of having a jam, and the time needed to
resolve a jam. Whether or not it is economical to
increase output by reducing the probability of having a
jam is an economic question. That is due the economic
gain from increased output exceed the cost of reducing
the probability of having a jam.
20
REFERENCES
1. Pritsker, A. A. Introduction to Simulation and SLAM.
New York: Halsted Press, 1979-
2. Walpole, R. E. Probability and Statistics for engineers
and scientists. 2nd ed. New York: Macmillan, 1978.
3. Simmons, Donald M. Nonlinear Programming for Operations
Research. N.J.: Prentice-Hall, 1975-
4. Gibbons, Jean D. Selecting and Ordering Populations.
New York: rfiley, 1977-
5. Van cleave, David A. One Big Step For "Assembly In The
Sky." Nov. 1977 Iron Age.
6. Abraham, R. G. State-Of-The-Art Ln Adaptable-Programmable
time needed for solving the jam : 200 seconds time between successive pallets in s 200 seconds no robot breakdown
o a
a o o
EQ.: Y=1.8-28.57X+3571^3X£
S.D.: .23905
uJ r> UJ •D a x r
2
. C2C C3_' Ci? C6C
'AM PRCPA .
cr3 087 l-X'KiC
54
I . 000 . atjci J.6U0
MAX OUEUE
3.4 00
4^ a
.a O n
. HOO
3rtrt O (-■■ >-■•
3 3 ►iron) o era- 3 0 (o n> c+ c+ fl> _S a □* CD (D 1 10 O. (D 3 (0 hi, W M O a c i o o 5 o co 3 n> o
</) K" H <J H- H- < 3 IB (Jl)
•a c+ pi 3-
(D C-i.
U 3
3
to t\> O O O O
M W ro in o o o o 3 3 p. a u> en
> to n> 3 zf H
tm
Fig. . J
'Assembly Line
probability to have a jam occured s .01 time needed for solving the jam i 200 seconds no robot breakdown
a o EQ.: Y=465.(l.-8.8iJ.no"7*e,0529X)
correlation coefficient: ,9204
o a
o a o OS a.
17.000 13-J33 19.C57 21.000 ?.l ■ iil
INPUT T i ME
i3-CC7 2S.000*10
55
PRODCT DON
23.000 ;?.ooo
"0 c
3. m
31.000 35.000 1_
39.000 -L.
A? . 000X10 .1
3 rt->d 0 H-1 a o
1 ro cr o m O (D H- c+ (0 (-•
P. p. o" n> c+ >1 P-<<; (D (U ^ ,f rV O O O. 1 o 2r g 01 P) 3 o <
<; pi 3
(0
jn>
o o
3 a
> 01 01 IB a
g iw
o
Fig. K .
Palletizing Line
probability to have a jam ocoured : .01 time needed for solving the jam i 200 seconds no robot breakdown
o o
o o o
EQi Y=1.^83-2.1*2*10"3X
correlation coefficient: -0.992
a CD o or
o
20-000 I
i0-e.fi 21 22.650
INPUT TIME
-T3J ; 4. o i.' —i
25. J00X10
56
ROBOT UTI
800 • 840 .880 .920 .960 1 .000 I -040
NJ1
c
2. m
o 1
CD (-" •• P ■+ t->. H;
O II 3 »-* o V o oo (0 U) H, i Ml to H- O ■p- h" to (D * 3 H* c+ O
" loJ 1 X. O
VO >o to
3 c+hd O M ■1
S O 1 ro a* o P C3-3 cr O fD H- t+ (0 I-"
Q. p. O* (D c+ 1 as ra PI H, C(. (v o o p. n o 3" £ "1 (U 3 O <
H1 ro <! H- CD 3 (ft
§s
o o O M
IB
3 P.
t+ H- N
3 (X)
3 (B
PS
Fig. L
Assembly Line
probability to have a ''jam occured : .01 time between successive pallets in : 200 seconds no .robot breakdown
o X o
EQ. i Y=388i)-62.2-5253.5X+23.59X2-.035X2
S.D.: 198.51
UJ SI
I 7-000 <:S.000'<1 0
INPUT TiME
57
i3.000
W O - " K II ^
w 00 ■ oo a *■ * ON •• to
H» to ^5 1 00 U* • to Ul Ul h» VJ
Ui « + to <J
u> M3
to 1
o VJ U\ X
to
Gl.000X10 I
0 H- i • S o 1 n> a* o pi fftfo- 0 ID H-
cra> rt 1 ID v; ro 3 P c+ tr i/i o p. c o o 3"
to • o o o i-
3 a in
> to 01
t/1 ID 3 0) cr H- H) M < «< (D '.
•a pi P 3 3 !-■ ID I-- o ID O i+ O (/] c
1
w
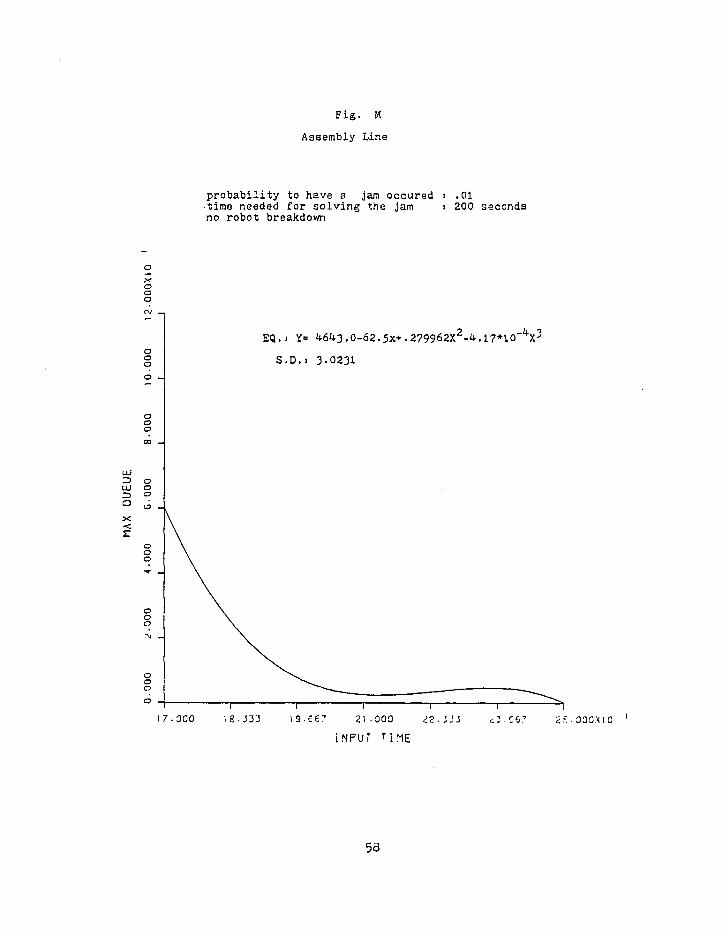
Fig. M
Assembly Line
probability to have a jam occured : .01 •time needed for solving the jam : 200 no robot breakdown
seconds
EQ.i Y= i)-6^3.0-62.5x+.2?9962X2-4.l7*10'i;X3
S.D.j 3-0231
LLl
LLl
X
r
17.000 lg.J3J 19.CB? 21.000 iZ-iSl
INPUT TI ME
ii-ce.7 ■000XI0
53
MAX OUEUE
o.ooo 4.000
.2
c
m
12.000X10 I
n </) ■
n K
•■ II
VJ £- ■ (T\ o ^~ M >*J K.) • H* o
ON w v_n X + M ^1 \o VO <J\
VJ
3 <+>d 0 H'l
a o 1 (B cr o pi o* 3 o- o ro H- ctlt H d p. O- ID rt- i-i as* ro pi «-» <+ woo Q. 1 O ST f »U 3 o <;
3 cm
£3 is o
C-J. O (u o 3 C
1 ID
IV) • O O O i-»
3 p.
> 01 in a> 3 a"
3 ro
mi
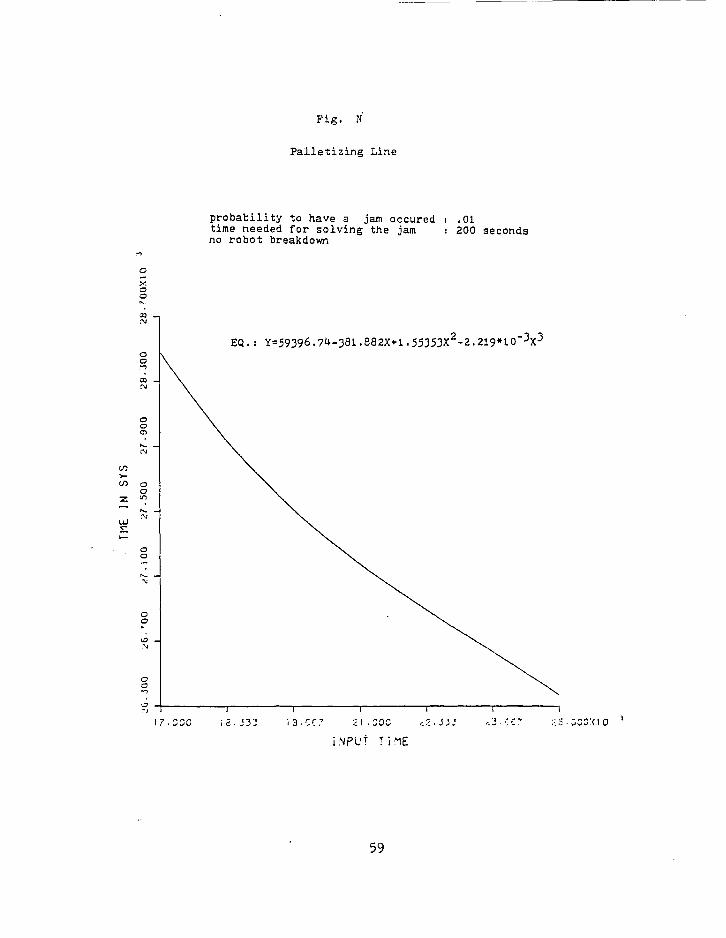
Fig. N
Palletizing Line
probability to have a jam occured i .01 time needed for solving the jam s 200 seconds no robot breakdown
a o
EQ.: Y=59396.7U-38I.882X+1.55353X2-2.219*10"V
to >- to
UJ
£1-30C
i.NPUf T I ME
. GCO.'OO
59
TME IN SY!
,.'(>. JOO V!6. _1_
'00 _t_
100 2( ■ SOO ^7.noo _J
28.J00 _l_
NJ1
fl"
m
ys.rooxio _l
a <+'d U H 1
H o i m IT o P tr 3 <r o (0 H- c+ <D M
a. *-•• o- ro r+ 1 u-S' ID w K> C+ w O o a. i o 3"
§ <fl o < K-(D < H- IU 3
U<)
c ►1 ID a
to • o o o I-1
in ro o o 3 o. u
c+ h" N h" 3 m
i-» 3 ID
Fig.
Palletizing Line
tftl^n11^? *° haVe a Jam °«ured , .01 time needed for solvine the iam . inn no robot breakdown J 2°° seconds
o o
EQ. : Y=1586.if26-15.075X+.0iJ-839X2-4.7*l0"5X3
o o o
a o UJ o
o o o
a o o
~i 1 1 1—: 17.000 18.J33 19.06? 21.000
INPUT TIME
—1 1
IZ-iSi <!3.C';.- 25.000X10
60
MAX QUEUE
10.000
o
22-000X10
1 o
3 o ro □*
P era o- O (D H. c+ ro (->
(X h" 0"(t) i+
ID
X o o ci O 3- £1111 3 o <
I—ro < 3
im <+ (U Era (D
o «-*. o
gg 1 ro
o o OH
3 a. in
p !-■ T) M H- (I) <m c+ H- N
B- o 0>)
IT" h" 3
o
o CD a or
Fig.. P
Assembly Line
probability to have a jam occured : .01 time between successive pallets in i 200 seconds no robot breakdown
EQ.i Y=.8667+3.8*1O'^X
correlation coefficient: .972
1 1 1 14.000 iS-OOO i6-000 17.000
JAM TIME
iS.QOO
1
i n . "1
'.0.300X10
61
ROBOT UT1. <1|0 • ni a
.958
o W o £) 4 ►1 ,. ID (-■ K PI II e+ ■
I-" CD O CK 3 0\
-vl o + o VuJ ID « M, CO H, * H- H* O o H- 1 IB £- 3 X c+
Co ^3 l\>
3 d-^d 0 H'M
3 o 1 ro o" o pi c o* o- O (D p*
_ *' •- O-ID <+ 't ID •<; ID 3
Jv en o o-c o o 3- g O P 3 0 <;
(A ID CD
< ID
C_i. •a w P § H* Mo ID o <+ o w c HMO 3 a
o o o l-»
10 ID o o 3 p.
> CO CO ID B 0' ►a H >-•• «< im
£ 3 *ti ID
Fig. Q
Palletizing Line
probability to have a jam occured , 01 time between successive pallet^ no .robot breakdown »*^exs in i 200 seconds
o o
EQ.i Y=9909-95-7.5325X
Correlation coefficient! .9988
CO
3
or 0.
il.OOO 13.000 io.OOO i7.000
JAM T i ME
i s.000 i 3-000 •:o. 000x10
62
PARTS USF.D
H4.000 8 4.HOO H5.GOO I
CT> IV)
88.R00XI0 J
o m o ii ►1 - i-( •• n> H X P II r+ vj> H- vn O o 3 vo
o vo o Vn (D 1 Hi -M H, ■
H- vn O V.) H- M (D Vn 3 * (+
vn v<> m CD
3 eft) O (-■• 1
. a o >i m o" o pi o" o" o' 0 (B H- ct c+ t-1
< M-
1 (0 << ro 3 [» ■+ rf 0) O ft c O o 3" S o P 3 (D ^
to ra U) hi. Ill <
•a w
(B o <•+ O (/) f.
1 H- m 3 a •• - to . O O O »-»
U) (0 r> (i 3 ft ID
p
h" 3
(X)
h" 3
Fig. R
Palletizing Line
probability to have a jam occured i .01 time between successive pallets in : 200 seconds no .robot breakdown
o o
00
EQ.s Y=21955.6+28.07X
S.D.: 28.0?
:c"<io
63
TME IN SYS
iS.HOO
rn
3 r+>tf o M ►1
. 9 o 1 m rr o 1U o- o* o- O 0) H- t+ t+ (-• * h" O* (I) r+ i m <<; as 3 P r+ ?r 01 O M. C1 o o 3"
3 ID 01 <
B) m in M- w < (B
LJ.
T) pi ft) g (-• !-• O (B o rt <i in c
1 M* (D 3 (X
l\j . o o o h-»
0] (1) o o 3 a u
*Tl 111 H H ID ct H- •n N H- h" (11 3
un
M w i-» 3 ID
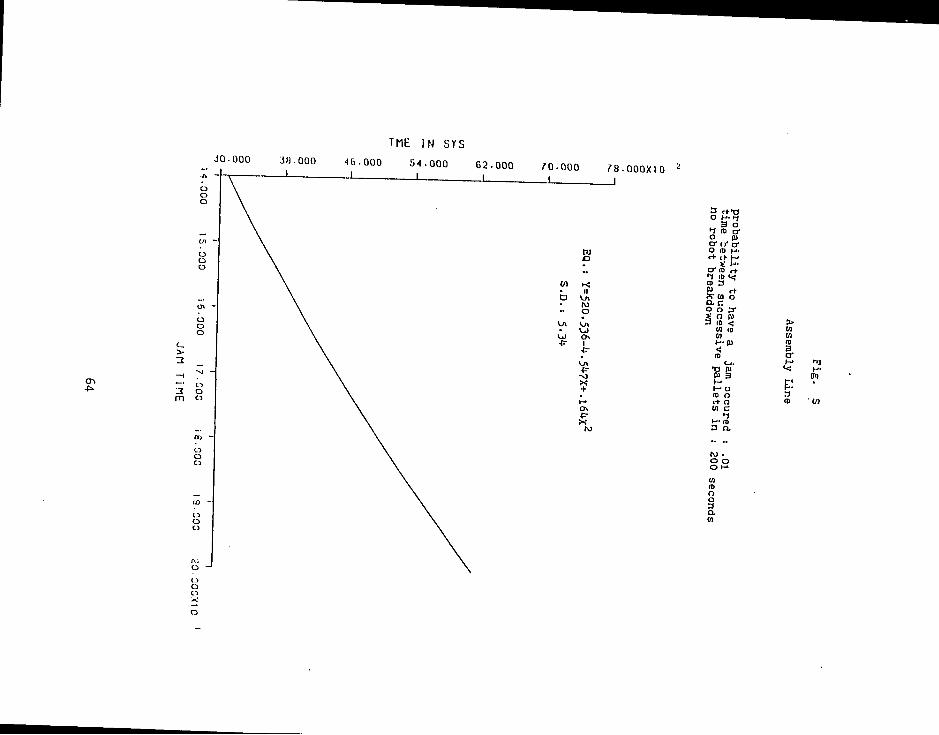
Fig. S
Assembly Line
probability to have a jam occured time between successive pallets in no robot breakdown
.01 200 seconds
o a o
EQ.i Y=520.536-^.5^7X+.l6^X':
S.D.: 5.34
UJ
o o o 01
o o
o o o
o o o
14.000 15.000 16.000 17-000
JAM TIME
18■000 —1
19.000 ~1 ao-ooo:<io
64
THE IN SYS
o o o
3
3 m
JO.000 3H.00O
-f-^ 1 . •(6.000
1
54 l
000 62.000 I
70.000 I
78 000X10 '< • 1
a <+>a OH.11 - 3 ° 1 ro a o p O* 11* o*
w O ID H. o rttH-
*' H- - 1 IB •<
w K (B 3 II 0> cf
D (v (a o a c
H o 003-
Ol U\ S 0 P 3 ro < 9> • >oj 01 IB m
VJ d\ 01 0} ■p- 1
+ »-» 0\ ■P"
M
i-"P <* IB
C-j.
P b K- i-" 0 IB 0 <+ 0 01 c
►1 N-IB 3 0.
IB s a-
•<;
P 3 IB ' l/l
M . O o ot- tn IB o o 3 n. 00
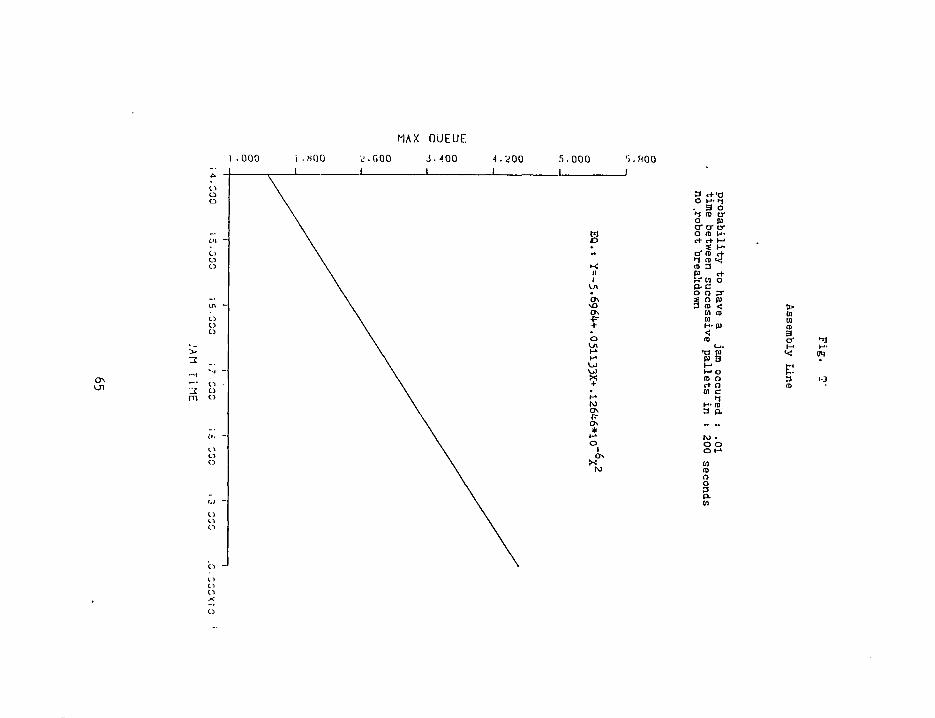
Fig. r
Assembly Line
ff«ba5±i1'ty t0 have a JM occured , .01 non?obotW^ai1do^a3iVe Pall6tS in ' 20° ■"««»-
o o
EQ. i Y=-5.696i;+.051133X+.l26't6*io"6x2
14.300 ;c:oo
AM T i ME
65
MAX OUEUF.
i .000 i .HOO .000 J.400 4 . ^00 5 .000 '"). ROO
Ul .2 m
a rf a 0 (-"• f(
. 3 o 1 ID or o pi o'er c O <D H- e+ t+ H- _*' H- o*n> «+
ID 3 p <+ r? CO O P. c O O ST SOP 3 <D <
01 (I
m <
M o ro o cf o oi c
1 H" (0 3 p.
O O O l-»
O O 3 0. w
> (A 01 m a o*
cm
Fig. U
Palletizing Line
probability to have a jam occured : .01 time between successive pallets in i '200 seconds no robot breakdown
EQ.i Y=155.9-.62X+2.5*10"3X2
S.D.i .^72
14.000 15.000 15.000 17.000
JAM TiME
000 13.000 '.0. 000X10
66
I I .HOO MAX OUEUE
13.000 13.400 ■^00X10
W o
K M II • H» a Oi • Ul
VO
£- 1
£- 0\
K + to Oi * H* o
V-J X to
3 ct>c< O M-^
a o o |U o*ty a-
0 a> H* c+ cr M _ ** H- 0*10 re 1 (0 •< rt> 3 p> rt- Jvcii o ac O o 3* 3 fl> <$
(a n>
*: ID
'O 0) PI 3
r- • o ra o <+ n (n c
1 h- CO 3 o. - •• to' . o o o H*
ID n o o 3 PL m
Hi
M- N H- 3
<W
tr<
3
o •v o
Fig. V
Palletizing Line
time between successive pallets in i 195 seconds time needed for solving the jam s 200 seconds probability to have a jam occured t .01 no robot breakdown
o a o
EQ.i .51527+.52225X
correlation coefficient! .9895^
o m o or.
o a <x
.700 .733 767 .800
SPEED RTI 0
8C7 .300
67
ROBOT UT1
.800 .840 .880 .fliiO .160 I .000 1 .040
-J
u, rn rn o
o o n 1 n> M W P /D ct ■ M- ■• o • 3 •
!j» o H* o U\ n> to H> -vj H, + h" > O U\ (-•• tO IS M 3 to ct U\
ts . VO 00 VO
-P
3-0 ct ct 0 1 HM-"-
o 3 3 1 O" (D <D O P tftratf 0 h" ro ro c+ !-■ (0 ct
o- ct ID ID 1 •<! P-ro CD 3 P. ct H>
a o o on h)
1 C P 3" O H" (0 tn o M < o ro 0) It h-«l ct >*J
«S fl h" H- P H-I-" ts im
3 < 3 cm
• at ID
C_l.
§ 3" P f .«*
ID (-■ 3 O H"
OIJ.O ID O P ct c g oi
• to h* o OVO H* OUl
0) </] ID ID O o O o 3 3 p. a. (a (A
Fig. W
Assembly Line
time between successive pallets in i 200 seconds, time needed for solving the jam i 200 seconda probability to have a jam occured i .01 no robot breakdown
EQ.i Y=.168+.79?65X
correlation coefficienti .99977
o m o or
./GO 733 ?6' .800
SPEED °J\0 5JJ ■ 300
68
ROBOT UT1•
7QO '40 .7tiO .a^o .860 .900 .940
00
rn o
1 1 1 1 1 1
\ o \ ° \ 1 \ ^ w
\ p \ ■+
o
\ H- K \ o II
\ 3 l-» \ ° Ox
\ o 00 _ \ <B + \ H> ■
\ Hi -o •\ I-" \o \ o -o \ >"" Os \ ™ V-n \ 3 >4 \ rt
\ Co \ *o \ »o \ ~J
-
\ ~°
\
3Ti c+ <+ O 1 H- H-
o H H 1 C ro ro n |U cr a-3 tr o p. (0 (D c+ H1 <n <+
H- p. ^ a" i+ fl> (D 1««« a. n> m 3 in c+ H !>r o o Ul p. 1 c n 3- o
3 P 01 o <$ o (D (D H" U)
<s 01 P H- I-"
3 «* in 01
c_t
g ctv 3"P> ro H"
O H O c_. ID O P rt- c B 01 1
• NN o o o t-* o o
01 «i (D a> O o O o 3 3 a- o- [C 01
01 (D a o-
Fig. X
Assembly Line
time between successive pallets in : 200 seconds time needed for solving the jam : 200 seoonda probability to have a jam occured s .01 no robot breakdown
EQ.: 10511.-1568.5X
correlation coefficient: .997^
a Lu
■<
a.
.700 ■7Ti . ?6? --"30
SPEED RTiO
. 90C
69
PARTS USFD
90.000 91.ZOO
J.
V m m a
o 1 '1 m (0 JIT M • 111 •■
r+ H- H* O O 3 Or
H* o I-* o ■
IB 1 H, 1-* H, v_n I-" Ov O CD h" ■
(t> lj\ a X rt
Cr> yn -s] -p-
3* rtrt o 3 a
1 o* ra ro o |U o- cr 3 cr 0 H-CD (0 rt H<D <+
H-O. S CT c+ ID (0 1 «<! p. (D m 3 f» c+ M> (v o o en P- 1 c O 3" O * w to o 3 <i O CD
SHU <J 01
(D H- I— 3 <J
TO ID
IJrt'd a 3-p
ID H* O M O c_i. ID O fj) r+ C 3 01 1
• M M O O O MOO
01 01 ID ID O f) O O 3 3 a a. a oi
m 01
<m
Fig. r.
Palletizing Line
time between successive pallets in s 195 seconds time needed for solving the jam i 200 seconds probability to have a jam occured t .01 no robot breakdown
Y=^8926 . -7903^ .8^Xf 585^ .X
UJ
,700 733 767 .800
SPEED RT10
667 .900
70
TMc. IN SYS
<;2.<;00
o
</i
m ni a
■if . 000X10
I
0 fl H-P- OSS
1 a* ro m O B) a- o"3 cr 0 H- m (0 ct (--n) c+
H- p. S O* c+ (0 (0 1 <<: p. ni ro 3
Voou O. 1 C O 3" O
S"" P 01 o hi < o <t> (U a> H-* oi (-"
< M (-" (U |J. H. IB >fl
3 < e+ H- W <o h" 0>)
O. N
§£3 3 W (-> cm K
O h-" Oo. (D tr< O 0) rt C 3 CO 3 •1 rt> (D H- a 3
• INJ I"1
O OvO ►■* ou
(a i/1 m a> o o o o 3 3 p. p. CQ 01
o o
Fig. Z
Assembly Line
time between successive pallets in : 200 seconds, time needed for solving the jam : 200 seconds probability to have a jam occured : .01 no robot breakdown
o o
a a UJ
EQ.i Y=293-02-550.9X+5O7.95X
S.D.: 0. /
o o
o a
767 800
p p f D ? T J.'
833 ■807 300
71
TME IN SY:,
i S.I no ih.UKl 17-600 .1 L
11
.1
IJ CO o o
CO
Co O
3 •r) r+ r+ <J M H H-
o r) r! 1 cr ra ID O HI a- a" 3 rr c H a> ID H H 10 ft
H a O* e+ ID ID 1 •< CL (D ID 3 111 el- n> SV O o (11 o. 1 c U s' o f (U 0) o J < o ID
ID P-- 01 < «i HI H* h"
3 < J<1 ID
t^.
U rl-'d 3- PI 10 t-
o r-1
o :_,. ID o 111 .+ c H 11 i ID M- a 3
% ro fo o o O H* o O
i,i 1/1 • D .D O 1) o tl 3 ^J p. u. u. 01
> 01 01 ID g
tr1
3
CD a o
Fig. T£
Palletizing Line
time between successive pallets in time needed for solving the jam probability to have a jam occured no robot breakdown
200 seconds. 200 seconds .01
o o
EQ.i Y=118^5. + 1>6^.X-5.9225X':
o o
667 900
SpEE
72
MAX OUEUE
3 'd ct c+ 0 >i |J. H-
o a a 1 ffm n o pi ffcraff 0 H-(B n> ct t-'lt rt
P. as; 1 ^ am re 3 P ct H>i rV O O W
O 3" o S W 0) o 3 < O (D
IB I-1 W < M
P> H- H-
cm <o c_i.
a a- iu O (-. O cj. (ti O (U rt C 3 O 1 ro i- a 3
o o o •"• o o
m u> a> ro o o o o 3 3 a a a in
hj
£ H- (0 ct (-■• ►a N M- M' oq 3
im
3 3 01
o o
Fig. ZZ
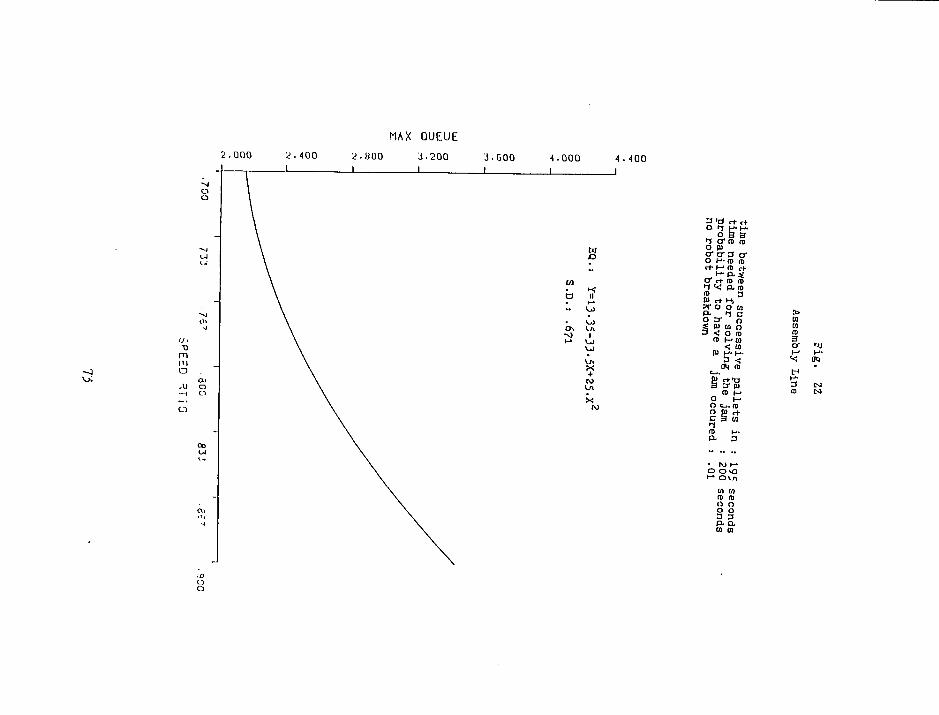
Assembly Line
time between successive pallets in time needed for solving the jam probability to have a jam occured no robot breakdown
195 seconds 200 seconds .01
EQ.i Y=13.35-33.5X+25.X'
S.D.: .671
a a
UJ o o • X -c r
o o o
.700 7TJ 75' .600
SPEED RTiO
83J ■6C- . <?0C
73
MAX QUEUE
2.000 2.400
-J
m m a
CO
GOO 4.000 J
4.400 J
M £> ■
{/] ■ K a 1! > M •• U)
. l_J 0\ U\ -N3 1 l-» U)
U)
u> X + M U\
X w
o a a 1 fflO It o pi cro-3 cr O H- <D fl> «+ (- ID <+
O* c+ ID (D i"*; p.™ (0 3 (» rt-Hi ITOOU P- 1c o a- o J pi la n 3 < o ro
ID H* IQ
< U>
0*i ID C-J.
§£+•□ (D (-•
O (-. 0 c. re ngrf c 3 co 1 01 H- O- 3
O OO I- OUl
U) (A re re o o o o 3 3 o. o. CO CO
> CO CO ID 3
H- 01)
CS1 IS)
o o
1.3 SIMULATION PROGRAM
PROGRAM MAIN DIMENSION N3ET(10000) C0MM0N/SC0M1/ ATRIB(tOO),DD(t00),DDL(tOO).DTNOtf,II 9,MFA,MST0P,NCLNR 1,NCRDR,NPRNT,NNRUN,NNSET,NTAPE,S3(1.00), 8, SoL( 1-00) , TNEXT, TNOW, XX (200) C0MM0N/UC0M1./ TPLCR(20), ASMBT(3), REPAR, FAST COMMON QSET( 1,0000) EQUIVALENCE (NSET(1),QSET(1)) OPEN (UNIT-5, DEVICE-' DSK' ,"FILE- 'SLIN.DAT* .ACCESS- 'SEQIN' ) 0PEN(UNIT=6,D2VICE='D3K'.FILE-'SLOUT.DAT',ACCESS-'SEQOUT') 0PEN(UNIT=7,DEVICE-'DSK'.FILE-'TEMP.DAT',ACCESS-'SEQINOUT') NNSET-10000 NCRDR-5 NPRNT-6 NTAPE-7 CALL SLAM STOP END
10 F0HMAT(10X,'TIME FOR SOLVING THE JAM-',F10.5) 20 FORMAT(tOX,'BATCH SIZE =',F10.5) t>0 F0Ri4AT( 10X ,' No . OF PARTS IN A PALLET=',F10. 5) 80 FORMAT(1 OX,'TRANSFER TIME FROM 1-2 =',F10.5) 90 FORMAT(10X,'TIME FOR PALLET RELEASED-',F10.5) HO FORMAT (1 OX," PROBABILITY OF PASS «',F10.5) 150 FORMAT(tOX,'TIME BET. PALLET ARRIVAL'',F10.5)
RETURN END
C C
76
FUNCTION U3ERF(I) COMMON/SCOM17 ATRIB(100),DD(100),DDL(100),DTNOW,II 9,MFA,MSTOP,NCLNR 1 ,NCRDR,NPRNT,NNRUN,NN3ET,NTAPE,SS(100), 8,SSL(100),TNEXT,TNOW,XX(200) COMMON/UCOM1/ TPLCR(20) ,ASMBT(3) ,REPAR,FAST COMMON Q5ET(10000) 00 TO (1,2,3,4,5,6,7,8)1