+ All Categories
Home > Documents > › sites › default › files... · The adaptive measures and experience for the quality...

› sites › default › files... · The adaptive measures and experience for the quality...

Date post: 27-Feb-2020
Category:
Upload: others
View: 10 times
Download: 0 times
Share this document with a friend
54
1 Nuwong Chollacoop National Metal and Materials Technology Center (MTEC) National Science and Technology Development Agency (NSTDA) Ministry of Science and Technology (MOST) [email protected] On behalf of Department of Alternative Energy Development and Efficiency (DEDE) 2014 APEC Workshop on Biodiesel Application Experiences GIS NTU Convention Center, Taipei, Taiwan 10 September 2014 The adaptive measures and experience for the quality variation effects of blended biodiesel
Transcript

1

Nuwong Chollacoop

National Metal and Materials Technology Center (MTEC)National Science and Technology Development Agency (NSTDA)

Ministry of Science and Technology (MOST)[email protected]

On behalf of Department of Alternative Energy Development and Efficiency (DEDE)

2014 APEC Workshop on Biodiesel Application ExperiencesGIS NTU Convention Center, Taipei, Taiwan

10 September 2014

The adaptive measures and experience for the quality variation effects of blended biodiesel

2

Outline• Brief Introduction of my organization• Biodiesel development in Thailand

– History of various national energy policy & plans – Current Alternative Energy Development Plan (AEDP: 2012-2021)– Current situation – Step towards increased biodiesel utilization

B20 (FAME) in fishery project B20 (FAME) in heavy duty truck project BHD (Bio-Hydrotreated Diesel) projectH-FAME (partially Hydrogenating Fatty Acid Methyl Ester) project

• Lessons learned and experiences shared– Quality assurance of biodiesel in actual market– BDF blends and based diesel specification– Contamination prevention

• Concerns for Taiwanese biodiesel market– Issues of BDF blending in ULSD promoting microbial growth

NSTDA at a glance

Established: December 1991 by the National Science and Technology Development Act, 1991

Governance: A quasi-government agency with Minister of Science and Technology as chairman of the board

Location: Thailand Science Park (30 kilometers north of Bangkok)Vision: Key S&T partner towards knowledge based society/economyMissions: R&D, Technology Transfer, HRD, and InfrastructureOrg chart : Four national R&D centers (total 98 laboratories):

BIOTEC National Center for Genetic Engineering and Biotechnology MTECNational Metal and Materials Technology CenterNECTEC National Electronics and Computer Technology Center NANOTEC National Nanotechnology Center

One technology management center TMC Technology Management Center

Focal point: NSTDA is national focal point for EU’s Framework Program

NSTDA

BIOTEC MTEC NECTEC NANOTEC TMC

1,240 1,267 1,209 1,217

136 180 213296

386519

650731

8511,026

1,2451,378

1,4881,619

1,803

1,999

2,240

2,4342,569

2,644 2,681 2,668

0

500

1,000

1,500

2,000

2,500

3,00019

91

1992

1993

1994

1995

1996

1997

1998

1999

2000

2001

2002

2003

2004

2005

2006

2007

2008

2009

2010

2011

2012

Persons

Fiscal year

Total R&D personnel

Personnel Distribution

Doctorate18%

Master's44%

Bachelor's and under

38%

Budget, Income and Expenses

MB = million baht

1,700.90 2,201.78 2,178.49

3,021.42 3,495.32 3,606.04 3,414.17

3,158.30

4,023.08

3,246.02 3,349.80 334.34

363.66 371.08

448.83

562.22 604.25 916.33 1,186.85

855.04

932.74 344.30

2,012.35 2,324.10

2,627.31

3,083.88

3,825.12

4,107.42 4,419.37

4,686.73 4,315.17 4,142.51

904.12

0

500

1,000

1,500

2,000

2,500

3,000

3,500

4,000

4,500

5,000

0

1,000

2,000

3,000

4,000

5,000

6,000

2003 2004 2005 2006 2007 2008 2009 2010 2011 2012 Q1/2013

MBMB

Fiscal Year

Government Allocated Budget Income Actual Expenses

6www.nstda.or.th© NSTDA 2014 Overview of National Science and Technology Development Agency (NSTDA), Thailand

R&D Strategy (2011-2016)

TargetIndustry

Cross-cutting

Programs

Agriculture and Food

Energy and Environment

Health and Medicine

Bioresources, Communities and

the Underprivileged

Manufacturing and Service Industries

Functional Materials and Processing

Digital Engineering (Design, Engineering and Automation)

Sensor and Intelligent System

SRI (Service Research and Innovation)

Biotechnology

Functional genomics technologyMicrobial

Biotechnology Agro-

biotechnology

Nanotechnology

Nano-coating Nano-encapsulation Functional

Nanostructure

PlatformTechnologies

Information and Computer

Technology

Devices and Systems Service Informatics

Materials Technology

Computer–Aided Design, Engineering and ManufacturingMaterials Design

and Production

7www.nstda.or.th© NSTDA 2014 Overview of National Science and Technology Development Agency (NSTDA), Thailand

S&T Infrastructure of NSTDA

Software Park Building

Science Camp Convention Center National centers Pilot Plant

8www.nstda.or.th© NSTDA 2014 Overview of National Science and Technology Development Agency (NSTDA), Thailand

Innovation Cluster IIo 4 integrated Towers o Gross area of 124,000 sqm.o World class R&D infrastructureo Sensitive lab, heavy equipment area o Superb ICT infrastructure & business serviceso Additional 150 Companieso To be open in 2014

To be completed by 2013

Innovation Cluster I and II (or INC I and INC II)@ Thailand Science Park

Innovation Cluster I 60 Tenant Companies , 12 Incubatees 70% Thai : 30% Foreign ~500 Staffs with over 300 researchers

9www.nstda.or.th© NSTDA 2014 Overview of National Science and Technology Development Agency (NSTDA), Thailand

NSTDA International Collaboration Japan: AIST, RIKEN, JICA, JST, e-ASIA, JAXA, JETRO, METI, MEXT, NUT, NIMS, NISTEP, NEDO, Tokyo Tech, Hiroshima U., Toyota, Shiseido, Shimadzu, Ube, Denso, ATPIJ, YU, Yamagata Univ., etc.Korea: KRIBB, KRISS, STEPI, Korea Science FoundationTaiwan: ITRI

Australia: QUT, U. of Queensland,Australasian Corrosion Association

Europe: EU-FP7, UK-Thailand Partners in Science, Thai-German Mobility Scheme, BMBF, Fraunhofer-Gesellschaft, Fraunhofer-ISE, Fraunhofer-IFF, University of Magdeburg, Karlsruhe Institute of Technology, Imperial College London, University of Zurich, CNRS, CIRAD, Institut National Polytechnique de Toulouse (INPT), Universite de Bourgogne, The Franco - Thai Scholarship program, Ecole Polytechnique,DESY, Lindau, CERN, K.U. Leuven, IMEC, etc.

ASEAN: ASEAN COST, SIRIM, MIGHT, LIRE, VAST, NISTPASS, A*STAR, Singapore Polytechnic, CEBU Technological University

U.S.A.:NSF, IBM, NBIA, Carnegie Mellon U., MIT, REI Int’l, PSU, UWM, GEC, TMS, U of Wisconsin-Madison

Middle-east: Technion – Israel institute of Technology, Ben-Gurion University of the Negev (BGU), Israel

China: CAS, GUCAS, Xiamen University, SAAS, KIB, SSRC, Sino – Thai Scientific and Technical Coorperation, Sichuan Academy of Agricultural Science (SAAS)

Latin America: Brazil, Argentina

10

History of Various National Energy Policy & Plan

11

12

7.6%

Target 5,608 MWExisting 1,750 MW

Adder cost 3,858 MW-Mini/Micro Hydro, Wind, Solar-Biomass, Biogas, MSW, Hydrogen

Target 7,433 ktoeExisting 3,007 Ktoe

2011

15.6%

2.4%

EthanolTarget 9.0 ML/dExisting 1.24 ML/d

BiodieselTarget 4.5 ML/dExisting 1.56 ML/d

HydrogenTarget 0.1 m.kg

4.1%

Power Generation

Heat Generation

Biofuel

2022

20.3%

2008*

6.4%

R&D

Adder cost

ESCO Fund

BOI/Revolving Fund

Prom

otio

n M

easu

res

CDM

NGVTarget 690 mmscfd

(6,090 ktoe)Existing 108.1 mmscfd

6.2%

19.1%

2016

Substitute Energy of 4,237 ktoe/yr Reduce Energy Import 99,500 mTHB/yr

Reduce GHGs 10.5 mton/yr

Substitute Energy of 19,800 ktoe/yrReduce Energy Import 461,800 mTHB/yr

Reduce GHGs 42 mton/yr

Development Strategy on Alternative Energyfor 2008 - 2022

Remarks: *as of Jan 2009Projected with 2008 average crude oil price of $94.45/barrel

131

Renewable energy Plan & Policy

Development of low-carbon societyDevelopment of low-carbon society

Budget to supportResearch & Development

Support the investment

of Private sector and community

Alternative Energy Development Plan (AEDP : 2012-2021)

Target on using Renewable Energy at 25 % of Total Energy Consumption By 2021

solar wind

2,000 MW1,200MW

100 ktoe

3,200 MW ,100 ktoe

solar wind

2,000 MW1,200MW

100 ktoe

3,200 MW ,100 ktoe

Bio-energy

Biomass Bio-gas MSW

3,630 MW

600 MW

160 MW

8,200 ktoe

1,000 ktoe

35 ktoe

4,390 MW , 9,235 ktoe

Bio-energy

Biomass Bio-gas MSW

3,630 MW

600 MW

160 MW

8,200 ktoe

1,000 ktoe

35 ktoe

4,390 MW , 9,235 ktoe

Hydro power plant

MiniMicro

Pumped-Storage

324MW

1,284 MW

1,608 MW

Hydro power plant

MiniMicro

Pumped-Storage

324MW

1,284 MW

1,608 MW

New energy resources

Tidal wave Geothermal

2 MW 1 MW

3 MW

New energy resources

Tidal wave Geothermal

2 MW 1 MW

3 MW

Biofuels

Ethanol Bio-diesel

New Fuel for diesel

9 ML/day

5.97 ML/day

25ML/day

44% Replacing Oil

Biofuels

Ethanol Bio-diesel

New Fuel for diesel

9 ML/day

5.97 ML/day

25ML/day

44% Replacing Oil

AEDP Goal 2555 2559 2564

3,283 MW 4,987 MW 7,633 MWAEDP Goal

2555 2559 2564

3,283 MW 4,987 MW 7,633 MW

1414

Renewable energy Plan & Policy

Development of low-carbon society

Budget to supportResearch & Development

Support the investment of Private sector and community

Alternative Energy Development Plan (AEDP : 2012-2021)

Target on using Renewable Energy at 25 % of Total Energy Consumption By 2021

solar wind

2,000 MW1,200MW

100 ktoe

3,200 MW ,100 ktoe

Bio-energy

Biomass Bio-gas MSW

3,630 MW

600 MW

160 MW

8,200 ktoe

1,000 ktoe

35 ktoe

4,390 MW , 9,235 ktoe

Hydro power plant

Mini Micro

Pumped-Storage

324MW

1,284 MW

1,608 MW

New energy resources

Tidal wave Geothermal

2 MW 1 MW

3 MW

Biofuels

Ethanol Bio-diesel

New Fuel for diesel

9 ML/day

5.97 ML/day

25ML/day

44% Replacing Oil

AEDP Goal 2555 2559 2564

3,283 MW 4,987 MW 7,633 MW

1515

Current Renewable energy Plan & Policy

Development of low-carbon society

Budget to supportResearch & Development

Support the investment of Private sector and community

Alternative Energy Development Plan (AEDP : 2012-2021)

Target on using Renewable Energy at 25 % of Total Energy Consumption By 2021

solar wind

3,000 MW 1,800MW

100 ktoe

4,800 MW ,100 ktoe

Bio-energy

Biomass Bio-gas MSW

4,800 MW

3,600 MW

400 MW

8,500 ktoe

1,000 ktoe

200 ktoe

8,800 MW, 9,700 ktoe

Hydro power plant

Micro Mini

324 MW

324 MW

New energy resources

Tidal wave Geothermal

2 MW 1 MW

3 MW

Biofuels

Ethanol BDFNED

(BHD)CBG

9 ML/d

7.2 ML/d

3ML/d

1,200 ton

• ⇑ Solar, Wind, Biomass, Biogas, MSW, BDF• Add NED (New Energy Replacing Diesel) such as BHD and CBG

• Remove Pump-Storage, New fuel for diesel

Revised by National Energy Policy Committee on 16 July 2013http://weben.dede.go.th/webmax/content/dede-adjusts-alternative-energy-target

16

History of Various National Energy Action Plans

17

2003-2011 Plan

18

Click to edit Master title style

2010

Action Plan for Biodiesel PromotionAction Plan for Biodiesel Promotion

1

2009 1.6 ML/d2009

1.6 ML/d2011 3 ML/d2011 3 ML/d

2016 3.64 ML/d

2016 3.64 ML/d

2022 4.5 ML/d2022

4.5 ML/dTargetTarget 2009 1.6 ML/d2009

1.6 ML/d2011 3 ML/d2011 3 ML/d

2016 3.64 ML/d

2016 3.64 ML/d

2022 4.5 ML/d2022

4.5 ML/dTargetTarget

1. Promote

2. Prototype and Demonstration

3. Research & Development

4. Standard for confidence

5. Public relation and info dissemination

6. Improve database system

2011 2012 2013-2016 2017-2022BiodieselBiodiesel

การผลิตไบโอดีเซลชุมชนการผลิตไบโอดีเซลชุมชน

SupplySupply

Raise public awareness in sustainable production of BDFRaise public awareness in sustainable production of BDF

Prototyped community BDF usagePrototyped community BDF usage

Learning centerLearning center

Promote B20 in fishery boatPromote B20 in fishery boat Use B10 in railUse B10 in rail

R&D B10 in diesel vehicleR&D B10 in diesel vehicle

Promote B10 for vehicle usagePromote B10 for vehicle usageCommercial BDF usage

Issue B10 standardIssue B10 standard

PR campaign for B10 usage in carPR campaign for B10 usage in car

Discussion on B10 usage with vehicle manufacturersDiscussion on B10 usage with vehicle manufacturers

Production of liquid fuel from biomass: BHD

Biomass to Liquid

BDF production from non-food biomass, e.g. Jatropha, algaBDF production from non-food biomass, e.g. Jatropha, alga

Support BDF-related industry (oleochemical)

Prototype BDF from algaePrototype BDF from algae

integrate Complex (Biomass + biogas+ biodiesel)integrate Complex (Biomass + biogas+ biodiesel)

Increase efficiency in logisticIncrease efficiency in logistic

Review BDF pricing formula to align with worldwide priceReview BDF pricing formula to align with worldwide price

Database of oil palm growers on website with GIS technology to track plantation area

PR Green DieselPR Green Diesel

Increase yieldIncrease yield

Support plantation area increase (via BAAC)Support plantation area increase (via BAAC)

Establish biofuel management organizationEstablish biofuel management organization

จัดตั�งกลุ่มและเครือข่ายผู้ร่วมพัฒนาการใช้ไบโอดีเซลระดับชุมชน จัดตั�งกลุ่มและเครือข่ายผู้ร่วมพัฒนาการใช้ไบโอดีเซลระดับชุมชน

Promote B5 for vehicle usagePromote B5 for vehicle usage

RailRail

VehicleVehicle

FisheryFishery

Expand plantation area: Rangsit, upper N & NE (Kong river)Expand plantation area: Rangsit, upper N & NE (Kong river)

R&D on new plantation areaR&D on new plantation area

Action PlanAction Plan

15-Year (2008-2022) Plan

20

Remarks on Thailand Renewable Energy Plan• Despite various revisions, the trends are clear

– Set rather ambitious utilization targets under estimated available resources

– Focus on indigenous resources and appropriate technologies (e.g. biomass, biofuel, biogas) with supporting mechanism

– Initial subsidy may be needed but gradually decreasing (or even removed) over time

• Issues on biofuel & biomass– Priority on domestic food and feed with surplus amount for biofuel

production (export depending on market price)– Rearranging of cultivation land for food & fuel crops– Increasing use of biomass resource from agricultural

residue/processing for heat and power production– 2nd generation biofuels are under R&D and demonstration phase

21

Current Situation

22

23

Benefits of Biofuel

Reduce fossil fuel usage and dependency

Reduce carbon release to atmosphere

Increase agricultural product prices

Promote self-sufficiency economy

23

24

Status of Biodiesel

25

3.55 3.56

3.71

3.91

4.10

2.32

3.02 3.063.27 3.22

0.00

0.50

1.00

1.50

2.00

2.50

3.00

3.50

3.20

3.30

3.40

3.50

3.60

3.70

3.80

3.90

4.00

4.10

4.20

2010 2011 2012 2013 2014

Yiel

d (to

n/Ra

i)

Harv

estin

g are

a (M

illio

n Ra

i)Harvesting area and Yield of Palm oil

Harvesting area Yield

Oil Palm Production

Oil palm plantation in Thailand

6.25 Rai = 1 Ha.

Oil palm plantation = 4.5 Million Rai

Oil palm is mostly planted in the southern and

eastern part of Thailand.

Source – Office of agricultural Economics

1 hectare = 6.25 Rai25

1,052,543 Rai

989,246 Rai

848,903 Rai

330,407 Rai

Source: OAE

< 1,000 Rai1,001 - 10,000 Rai

50,001 - 300,000 Rai10,001 - 50,000 Rai

> 300,000 Rai

26

Biodiesel feedstock: Oil palm

Production (2011): ton01-1,0001,0001-10,00010,001-100,000100,001-1,000,0001,000,001-10,000,000

Map for oil palm plantation (2011)

Production (2011): ton01-1,0001,0001-10,00010,001-100,000100,001-1,000,0001,000,001-10,000,000

Map for oil palm plantation (2011)Oil palm plantation area

Total (2012) area of 3,982,623 Rai

East (11.54%)

Central (10.32%)Northeast (3.80%)North (0.90%)

South (73.44%)

Oil palm plantation area

Total (2012) area of 3,982,623 Rai

East (11.54%)

Central (10.32%)Northeast (3.80%)North (0.90%)

South (73.44%)

Oil palm production

Total (2012) production of 11,326,660 Ton

East (10.77%)

Central (10.60%)Northeast (1.88%)North (0.20%)

South (76.55%)

Oil palm production

Total (2012) production of 11,326,660 Ton

East (10.77%)

Central (10.60%)Northeast (1.88%)North (0.20%)

South (76.55%)

DIT (2012), http://gis.dit.go.th/gis56/agri/Report/palm_product.aspxA. Thammanomai (2012)

2.72% of arable land in Thailand

0.64 M ha(2012)

27

Oil palm production, productivity & utilization

• 2010-2011, large increase in oil palm (20-30% on both production and productivity) due to additional demand from biodiesel

• 2011-2012, a drop in productivity due to the inadequate rainfall. • Palm oil usage in 2011,

– 49% of palm oil used for domestic consumption, – 22% for biodiesel production, – 16% for export potential as feedstock for biodiesel– 13% for stock.

Oil Palm Production/Productivity

Production (x1,000ton) Productivity (kg/rai)

2010 2011 2012

Oil Palm Production/Productivity

Production (x1,000ton) Productivity (kg/rai)

2010 2011 2012

Source: OAE (2012) & A. Thammanomai (2012)

(~17.8 ton/ha)

28

Palm Oil Usage

Source : Department of Internal Trade of Thailand, Ministry of Commerce 28

Domestic

Consumption

0.93

0.96

MMT

Biodiesel

production

0.63

0.77

MMT

Export

0.31

0.57

MMT

Stock at year end

0.36

0.20

MMT

1.89

2.14

MMT

2012

2013

2012

2013

CPO Production Stock at the

beginning

0.30

0.36

MMT

0.04

-

MMT

Import

2929

Biodiesel Production

B2 - B7

BiodieselFatty acid methyl ester (FAME)

Palm Oil Biodiesel Fuel

B100

Blend

Diesel

In-line blending

30

Government Policy & Regulation

• Biodiesel is produced from the surplus palm oil in the country.

• Biodiesel blending is varied according to the domestic supply

Biodiesel ratio management

30

31

Biodiesel Situation

Biodiesel 2.76 ML/dayAEDP Target

20217.20 ML/day

Source: Department of Energy BusinessMay 2014

31

Biodiesel consumption policy

2008B2 (Option)

2010B3 (Option)

Mar 2011B2 (Option)

May 2011B3-B5 (Mandate)

July 2011 B4 (Mandate)

2012

B5 (Mandate)

2014

B7 (Mandate)

32

B100 Usage in Diesel

One-grade diesel from May 2011

0.0

0.5

1.0

1.5

2.0

2.5

3.0

3.5

4.0

Jan-

07

Apr-

07

Jul-0

7

Oct

-07

Jan-

08

Apr-

08

Jul-0

8

Oct

-08

Jan-

09

Apr-

09

Jul-0

9

Oct

-09

Jan-

10

Apr-

10

Jul-1

0

Oct

-10

Jan-

11

Apr-

11

Jul-1

1

Oct

-11

Jan-

12

Apr-

12

Jul-1

2

Oct

-12

Jan-

13

Apr-

13

Jul-1

3

Oct

-13

Jan-

14

Apr-

14

Jul-1

4

ML/

D

Total B100B100 in DieselB100 in B5

B2 inroduction nation-wide from Jun 2007

B2 mandate from Feb 2008

B7 mandatefrom Jan 2014

http://www.dede.go.th/dede/images/stories/Biodiesel/B100_demand_for_Diesel_Jan_12.xlshttp://www.doeb.go.th/info/data/datadistribution/biodieselB100.pdf

33

Biodiesel Production

Biodiesel production factory

9 CPO/RBD/Stearine

3 RBD/Stearine

Raw material

Registration

factory Capacity

(ML/day)

CPO/RBDPO/Stearin 9 4.06

RBDPO/Stearine 3 0.90

รวม 11 4.96

Current biodiesel production capacity is

4.96 ML/day

Source - Department of Energy Business, Feb 2014

33

34

Biodiesel Consumption

Source - Department of Energy Business

Average daily usage of biodiesel (B100)

• Mar - May 2014, biodiesel blending % was reduced according to the palm oil situation.

• All involving parties keep monitoring on CPO supply and adjusting biodiesel blending %

correspondingly to avoid foot supply interference

Thailand has mandated 7% biodiesel (B7) blend

for every liters of diesel sold in 2014

34

1.231.67 1.646 1.725

2.4232.88 3.029

0

1

2

3

4

2008 2009 2010 2011 2012 2013 ก.ค.-2014Jan-Jul

ML/dML/d

35

Step towards increased biodiesel utilization

36

Supply and Demand Plan

Balance between domestic supply and biofuel demand.

Demand of Palm oil (2012 – 2021)

36

1.932.04

2.32

2.512.67

2.792.93

3.073.20

3.33

0.93 0.96 0.98 1.00 1.03 1.06 1.08 1.11 1.14 1.16

0.580.72

1.03 1.05 1.071.24

1.41 1.46 1.52

2.04

1.521.68

2.01 2.05 2.10

2.30

2.492.57

2.66

3.20

0.00

0.50

1.00

1.50

2.00

2.50

3.00

3.50

2012 2013 2014 2015 2016 2017 2018 2019 2020 2021

CPO

(MM

T)

CPO supply Consumption and Industry Biodiesel and Advance Biofuel CPO usage

3737

Future Trend of Biodiesel Using

B10Mandatory B10

Mandatory B7 + B20 for Bus and Truck

B7 B20

Mandatory B7+ B100 for Agricultural Machinery

B7 B100

38

B20 in Fishery Project (2013)

• 20 fishery boats participated (20 4-cylinder & 20 6 cylinder)

• Using B20 for 500 hours over 1-7 months depending on usage (as is)

• T-test statistical interview with boat owners after 500 hours usage

– No significantly different from diesel (B5) usage at 95% confident interval

• Lube oil sampling showed no significant degradation over 500 hours

• Engine dyno test before and after 500 hours

– Power/torque, SFC (specific fuel consumption) and emissions (HC, CO, NOx, smoke)

showed no significant deterioration

39

B20 in HD Truck Project (2014)

• Thailand has ~1 million HD (heavy-duty) trucks with ~0.6 million trucks

over 15 years old age

• 20 HD (heavy duty, 6-cylinder) cement-carrying truck of 200-350HP trucks

ran with B20 for 30,000 km each (4 HD trucks on diesel)

– B20: 12 HINOs, 7 ISUZUs, 1 Mitsubishi

– Diesel: 2 HINOs, 2 ISUZUs

• Tailpipe emissions of B20 showed higher HC and NOx but lower

PM than diesel; whereas, no significant difference in fuel consumption

(liter/km-ton)

40http://www3.pttplc.com/Files/RTI/62_110040_T.pdf

PTT-Toyota tests on engine/vehicle with BHD blends

BHD seminar, 13 Sep 2012

41http://www3.pttplc.com/Files/RTI/62_110040_T.pdf BHD seminar, 13 Sep 2012

4242

Vegetable/ Plant

oils, etc.

Esterification/Transesteri-fication

FAME H-FAME

Hydrodeoxy-genation

Isomerization

Gas (C3H8, H2O, CO2, CO, etc.)

Gasoline

HVO,BHD

MeOH Catalyst(H2SO4/KOH)

Glycerin

CatalystH2

CatalystH2 CatalystH2

Conventional biodiesel production process

H-FAME Technology

1.5th gen. FAME

2nd gen. Biodiesel

Partial hydrogenation

Conventional FAME

antioxidant

< B5-B7

< B10-B20

< B100

Upgrading via. Incidental facility

1st gen. FAME

Possible production only under the high-pressure and high-temperature facility (e.g., P>5 MPa, T>280ºC)

Petroleum refineries could afford to produce this 2nd

gen. biodiesel.

Innovation on production and automotive utilization of biofuels from non-food biomass (FY2010 - FY2014)

4343

• H-FAME is intrinsically stable for oxidation: meets with the FAME standards (>10 h), and less amounts of peroxides.

• Very lower cost-up for H-FAME compared with HVO, BHD:no need of the high-pressure and high temperature facilities (i.e., P<0.5MPa, T<100-130ºC), and less amounts of H2 necessary compared with HVO, BHD.

• Detoxification of the phorbol ester in Jatropha FAME.• Higher combustibility (increase in Cetane number).• Decrease in the high-boiling point fractions of FAME, i.e.,

T95=380ºC for Rapeseed FAME into T95=360ºC.• Possible high concentration use more than B10.• Make ease the removal of saturated monoglyceride, etc.

Advantages of H-FAME:

• Need of the hydrogen supply system, i.e., on-site and package-type hydrogenation production unit, H2 delivery systems, etc.

Advantages of H-FAME

Issues of H-FAME:

44

Reaction

Oxidation Stability

Reaction Conditions

Location of processing facility

Further processing

Oil (Triglyceride)

Hydrocarbons

High

High pressure (>5MPa)High temperature (>280ºC)

Petroleum refinery(Neat ~ Coprocessing)

Isomerization for conditioning cold flow property and cetane number

Mono/Polyunsaturated FAME

Monounsaturated-rich FAME

Relatively high

Low pressure (atmospheric~0.5MPa)Low temperature (80~130ºC)

Local Community~ Refinery(small ~ large plants)

Catalysts Ni catalysts, Noble metal catalysts, etc.(sulfur-tolerant ones)

Water (steam)-tolerant NiMo catalysts, CoMo catalysts, etc.

None

Hydrogen consumption Partial hydrogenation : 3H2

Hydrogenolysis/hydrogenation: 18H2Decarboxylation: 9H2

H-FAME (1.5th gen. FAME) HVO (2nd gen. biofuel)

Comparison between the H-FAME and HVO (BHD)

OO

OO

OO

OOCH3

OOCH3

OOCH3

OOCH3

44

4545

EU Japan WWFC TISR's PPEN14214:2003 JIS K2390:2008 March, 2009 Product BDF

Ester content mass% 96.5 min. 96.5 min. 96.5 min. 96.5 min. 99.7Density kg/m3 860-900 860-900 860-900 Report 876Viscosity mm2/s 3.50-5.00 3.50-5.00 2.00-5.00 2.0-5.0 5.0Flashpoint deg. C 120 min. 120 min. 100 min. 100 min. 186Sulfur content mass% 0.0010 max. 0.0010 max. 0.0010 max. 0.0010 max. 0.00025Distillation, T90 deg. C - - - - -Carbon residue (100%) orCarbon residue (10%) mass% -

0.30 max.-

0.3 max.0.05 max.0.3 max.

0.05 max.- 0.14

Cetane number   51.0 min. 51.0 min. 51.0 min. 51.0 min. 57Sulfated ash mass% 0.02 max. 0.02 max. 0.02 max. 0.005 max. <0.001Ash content mass% - - - 0.001 max. -Water content mg/kg 500 max. 500 max. 500 max. 500 max. 385Water and sediment vol% - - - 0.05 max. -Total contamination mg/kg 24 max. 24 max. 24 max. 24 max. 8.3Copper corrosion   Class-1 Class-1 Class-1 - Class-1aCorrosion: Ferrous - - - light rusting. Max -Acid value mgKOH/g 0.50 max. 0.50 max. 0.50 max. 0.5 max. 0.16Oxidation stability hrs. 6.0 min. (**) 10.0 min. (****) 10 min. 15.1Iodine value   120 max. 120 max. Reported (***) 130 max. 70.5Methyl Linolenate mass% 12.0 max. 12.0 max. 12.0 max. 12.0 max. 0Polyunsaturated FAME(more than 4 double bonds) mass% 1 max. N.D. N.D. (***) 1 max. N.D.

Methanol content mass% 0.20 max. 0.20 max. 0.20 max. 0.20 max. <0.01Monoglyceride content mass% 0.80 max. 0.80 max. 0.80 max. 0.80 max. 0.54Diglyceride content mass% 0.20 max. 0.20 max. 0.20 max. 0.20 max. 0.20Triglyceride content mass% 0.20 max. 0.20 max. 0.20 max. 0.20 max. 0.06Free glycerol content mass% 0.02 max. 0.02 max. 0.02 max. 0.02 max. 0Total glycerol content mass% 0.25 max. 0.25 max. 0.25 max. 0.25 max. 0.17Na+K mg/kg 5.0 max. 5.0 max. 5.0 max. 5 max. <3Ca+Mg mg/kg 5.0 max. 5.0 max. 5.0 max. 5 max. <2Phosphorous content mg/kg 10.0 max. 10.0 max. 10.0 max. 4 max. <1Trace metals - - - no addition -

EAS-ERIA BDF Standard(EEBS):2008Items Units

EAS: East Asia Summit ; ERIA: Economic Research Institute for ASEAN and East Asia; WWFC: World Wide Fuel Charter

(*) Equivalent to diesel oil (***) Need data check and further discussion(**) Meet diesel oil specification (****) Need more data & discussion from 6 to 10 hrs.

Demands for high quality BDF

H-FAME meets with the FAME standards

EAS-ERIA BDF standard, (EEBS):2008

WWFC Guideline BDF quality

Mid-term target

Final target

4646

Automotive compatibility of Jatropha H-FAMEEAS-ERIA BDF standard, (EEBS):2008

WWFC Guideline BDF quality

MOU ceremony on “Innovation on New Non-Food Biodiesel Project” (2012.7.30) @Bangkok

On-road test (50,000km)2012.11.1-2013.5.31

47

Lessons learned & Experiences shared

• Quality assurance of biodiesel in actual market

• BDF blends and based diesel specification

• Contamination prevention

48

Quality Assurance of BDF

• Thailand (by Department of Energy Business, DOEB) has issued separate

standards for

– Neat biodiesel (B100) for both industrial grade (blended with diesel for

multiple cylinder engine) and community grade (strictly used with agricultural

engine)

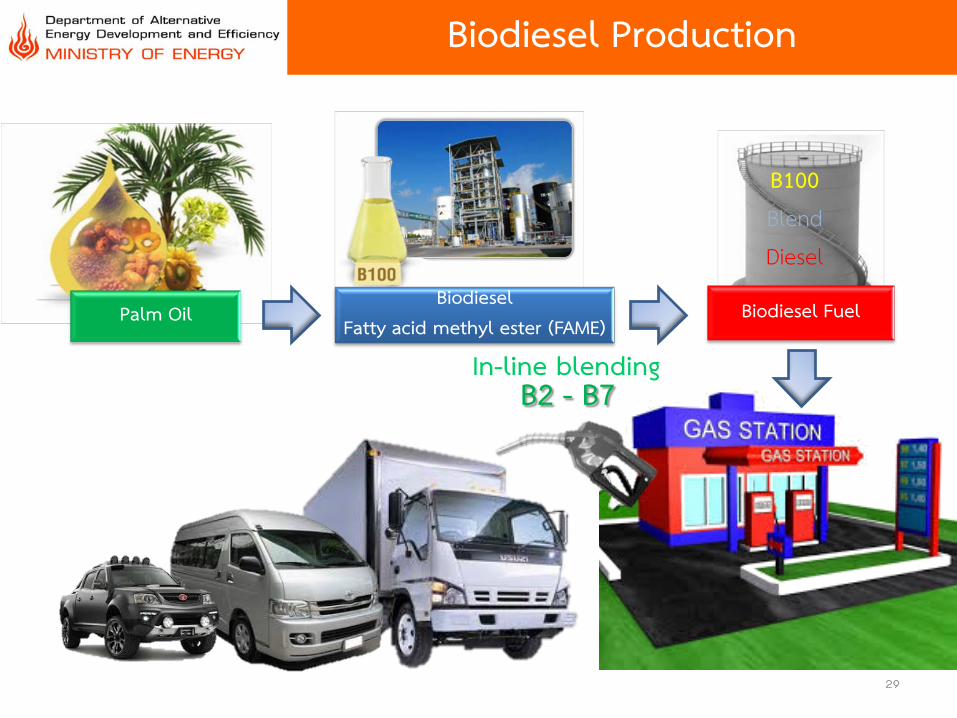
– Blended diesel at biodiesel ratio of currently 7% (B7) and adjustable

depending on palm oil supply

• B100 producers must comply to B100 specification when selling to oil

retailers for blending; whereas, oil retailers are randomly audited by

DOEB against diesel specification

• Penalty given to those who fails to meet specification (Fuel Act 2000)*

• With mandate of B7 since 1 Jan 2014, need to modify some diesel

specifications

– Add ‘Oxidation stability’ > 35 hrs*http://www.doeb.go.th/knowledge/complain_instruction.htm

49

Quality Inspection

• DOEB encourages fuel station to take part in quality assurance program

• Both DOEB (by law) and fuel companies perform quality check at fuel

stations

http://www.doeb.go.th/activity/56/feb56/238.jpghttp://www.benzowner.net/forum/showthread.php?t=32843

50

BDF Specification (2014)

http://www.ratchakitcha.soc.go.th/DATA/PDF/2556/E/158/15.PDF

96.5< 860900

> <

3.55.0

> <

120>

0.001<

0.3<

51>

0.02<

500< 24<

No.1< 10>

0.5<

120<

12<

0.2<

0.7<

0.2<

0.2<

0.02<

0.25<

5.0<

5.0<

0.001<

Reported

ReportedApproval from Director-General

51

Diesel Specification (2014)

http://www.ratchakitcha.soc.go.th/DATA/PDF/2556/E/158/15.PDF

0.810.87

> < 0.92

DieselHiSp LoSp

50> 45

1.84.1

> < 8.0< 6.0

10< 160.05< 1.5

No.1<

2535

> <

0.3<

< 0.3300< 24<

0.01< 0.0252> 52

357<

11<

4.54.0

> < 7.5

6.07

> <

460< Approval from Director-General

DieselHiSp LoSp

52

Contamination Prevention

• Fuel contamination may occur during

processing, storage, transportation, dispenser and underground fuel tank so

need to be cautious in all steps

• Explicit laws to govern fuel storage, transportation tank, dispenser and

underground tank for both safety and contamination prevention

• Additional guideline during flooding*

*http://www.doeb.go.th/knowledge/data/protecttank.pdf

53

Concerns for Taiwanese Biodiesel Market

• Issues of BDF blending (B2) in ULSD promoting microbial growth*

– Biodiesel is more susceptible to oxidation stability due to bio component

– Water content as low as 100ppm may be sufficient to allow microbial growth

– Reduced sulfur (natural bacteria killer) content in ULSD (<10 ppm S)

• Discussion points

– Technical or logistic issues?

Quality according to specification at BDF producer or blending facility

Need to check quality at fuel station especially contamination in underground tank

storage

– Even with diesel, already some protocol to follow

Diesel fuel microbe infestation analysis, IP-385 and IP-472

Biocide may be added for biodiesel blending

* http://www.petrolplaza.com/technology/articles/MiZlbiYxNDg1NCYmMSYxJiY%3D

54

Thank you

Acknowledgement for slide preparation toDEDE (Dr. Apiradee Thammanomai, Mr. Arkorn Soikaew and Ms. Sutharee Kiatman)

KU (Mr. Ob Nilpai)


Recommended