Ng Investigation on defects occuring in paper production process A Six Sigma Black Belt project at SCA Edet mill Master of Science Thesis in the Master’s Degree Program Quality and Operations Management HENRY SAVAGE OLUGBENGA ROBBIE HÄLLÅS Department of Technology Management and Economics Division of Quality Sciences CHALMERS UNIVERSITY OF TECHNOLOGY Göteborg, Sweden, 2011 Report No. E 2011:104
Transcript
Ng
Investigation on defects occuring in paper
production process A Six Sigma Black Belt project at SCA Edet mill
Master of Science Thesis in the Master’s Degree Program Quality and
Operations Management
HENRY SAVAGE OLUGBENGA
ROBBIE HÄLLÅS
Department of Technology Management and Economics
Division of Quality Sciences
CHALMERS UNIVERSITY OF TECHNOLOGY
Göteborg, Sweden, 2011
Report No. E 2011:104
MASTER‟S THESIS E 2011:104
Investigation on defects occurring in paper production process
A Six Sigma Black Belt project at SCA Edet mill.
HENRY SAVAGE OLUGBENGA
ROBBIE HÄLLÅS
Stefano Barone: Supervisor, Chalmers University of Technology
Jonas Pihlström: Supervisor, SCA, Edet Mill
Department of Technology Management and Economics
Division of Quality Sciences
CHALMERS UNIVERSITY OF TECHNOLOGY
Göteborg, Sweden 2011
ABSTRACT
This study aims at understanding the related problems which affect the processes and quality
of the final product during paper production. As an age-long problem in the paper production
industry, web-flutter of paper and unwanted folding in the final product could be often seen,
so steps towards managing these problems are continually developed. However, identifying
and understanding the root causes of these problems has been a grey-area due to the
complexity involved during paper production processes. This study adopted the Six Sigma
methodology to try to identify what factors/parameters are influencing the occurrence of web-
flutter during paper production processes at SCA Edet mill. It also highlighted other root
causes for the unwanted folding in the final product of tissue paper at the paper mill.
Six Sigma is a methodology which can be used for root cause identification, problem-solving
and improving processes in manufacturing/production. The methodology often follows the
DMAIC (Define-Measure-Analyze-Improve-Control) framework in its application.
ACKNOWLEDGEMENTS
This Master‟s thesis carried out as a Six Sigma Black Belt project at SCA Edet Mill has been
the result of six months effort.
We would like to express our gratitude to our company supervisor at SCA, Jonas Pihlström
for his constant support and guidance throughout this thesis work. He was a pillar during the
project, who lead, motivated and provided us with a great learning experience.
We would like to appreciate process engineer Johan Georgii, whose insight and help in this
project was invaluable whenever we were faced with tough questions or decisions.
Our sincere and deepest thanks also goes out to our supervisor at Chalmers University of
Technology Stefano Barone, Six Sigma Master Black Belt and associate professor whose
experience, knowledge and guidance was of great importance for the completion of this
master thesis.
Special thanks go to all employees from Papermaking machine (PM7), converting line 10,
SCA (LAB) and everyone else who provided support during this Master thesis. Their efforts
made it possible and we are forever grateful.
Last but not the least, we would like to thank our friends and family for their moral support
and encouraging us to successfully complete our Master‟s thesis.
settings during unwinding, external disturbances during unwinding and improper pope winding.
26
4.2.3 Data collection plan
This section is divided into three parts; Data preparation plan that describes how the
measurements were initially planned to be carried out, Data collection plan that describes
how the database system was exploited to acquire the right data measurements, Focused
measurement report that elaborates on the separate set of data collected.
Table 2 Preparation for data Collection
y measure Web characteristics Converting (Unwinding settings)
Operational Definitions
Cross sectional variation in the
moisture content and surface
weight of the web. Difference of
radius on operator and driver sides
of the MR. On paper qualities 2067
and 1067
The measurement will focused on a
particular paper quality 2067 and
1067, where defects have been
seen to be imminent most often
through analysis of the data (see
Appendix X).
Data source and location
Paper making QCS system (PM7 ),
Manual measurements of the MR
(PM7)
Converting line 10, PLAIN, QIS
(Centerline), Internal Claim
system, Video recordings
Sample size Approximately 20 mother reels
produced a day
Every production of paper qualities
2067 and 1067.
Who will collect the data Representatives of PM7 Representatives of Converting line
10 and project analysts
When will data be collected
Every day from the 5th July, 2011 -
End of August (On each MR
produced)
Begins by end of week 31. Focused
measurements in week 34.
Frequency of data collection
depends on planned scheduling
accessed through PLAIN system.
How will data be collected
Through the IT report system
(ABB control system) and
manually by operators
Through automatic and manual
measurements and video coverage
- Speed data from plain system,
web tension from QIS (Centerline),
and Fluttering data will be
collected through video recordings,
supported by internal claim system.
MR ID will be collected by
operators manually.
x data should be collected at the
same time
Cross-sectional moisture content
after the paper making and surface
weight, radius of MR from the core
Unwinding speed and speed
differences, Web-tension, Angle of
attack of first bowed roll Width
and side of web fluttering.
Frequency, date and time of web-
fluttering.
27
Table 3 Data Collection Plan
COLLECTION OF THE
DATA
STEP 1 STEP 2
Internal Claim System Through the internal claim
system. Locate the fluttering
complaints that have been
entered into the system.
Extract the MR ID and time the
complaint was perceived to
have happened. Also extract
information about the fluttering,
the width, the unwind stand it
occurred on and what side it.
Check for the run ability of the
MR if it was still used or not.
VIDEO Use to verify physically when
the reported claim says
fluttering occurs and to locate
claims on fluttering that are not
entered into the internal claim
system
Collect web-fluttering date,
time and unwinding stand side
of web-fluttering. Also use as a
base for collecting speed, web-
tension and to identify MR.
CENTRELINE Collect information on the MR
IDs and web tension.
PLAIN Collect information on the
speed difference. Planned
production schedule for paper
qualities 2067 and 1067.
Further logbook information
can be accessed to verify claims
PM Measurement Check the fluttered MR ID
through the previous systems
and then collect information
about the MR when it was
produced at the PM7
Collect information on Basis
weight, Moisture content,
Diameter of the FS and DS and
the difference between both
sides. Also look at the graphical
undulations which have
documented.
28
Focused measurements
The measurement was conducted so as to observe the characteristics of the MR after storage
before consumed on the converting lines. As specified earlier in the data collection plan, the
focused measurement followed on the paper quality and converting line already identified and
selected for the measure phase.
Firstly, the cross-sectional diameter of each of the MRs before loaded into the unwind stands
were taken on both the driver‟s and operator‟s side of the MR. This is collected for the
purpose of investigating the MR symmetry and oval-ness.
Full length cross-sectional of 3.41m and specified vertical samples were collected on 10 MR‟s
at each interval before these MR were loaded into the unwind stands at converting line 10.
These samples were then carefully cut and sized at the SCA laboratory so as to carry out
measurements on them. Two samples were collected for the specified vertical samples, on the
driver‟s and operator‟s side of the MR. Each of the specified vertical samples were firstly
placed in containers and then weighed to determine their moist weight while also having the
standard weight of each of the containers without any content. The vertical samples were then
placed in an oven of 102c for duration of 3hours after which they were then placed back into a
container for an hour. Each of the samples was then weighed to determine the weight after
this process. All data and information was collected and recorded for later analysis of
difference of the moist content on the different sides of the MR.
The full cross-sectional samples were cut and sized, focusing 6 of 8 samples mainly on the
edges of the driver‟s and operator‟s side of the samples and 2 in the middle area of the cross-
sectional samples. These 8 samples were then sorted into layers of 4 plies where they were
then further cut and sized for measurements on their stretch strength on both the machine
length (MD) and cross-directional length (CD). For the basis measurement, using the same 8
samples earlier on in this measurement, samples were cut into layers of 8 plies for each cross-
sectional sample and then weighed and measured to determine each sample thickness. All this
data was carefully collected and recorded for later analysis so as to determine any variation in
the stretch, strength, weight and thickness across the 3.41m cross-sectional length of the MR.
The focused measurement for strength and stretch samples were replicated collecting data on
an additional 9 MRs. The sample size collected for each measurement is presented in Table 4.
Table 4 Sample size collected on each measurement
Variables MR (ID) Strength
MD/CD
(N/m)
Stretch
MD/CD
(%)
Moist
(%)
Thickness
(µ m)
Weight
(g)
Diameter
(cm)
Sample
size
10+(9) 160 160 20 80 80 20
29
4.3 Analyze
Based on data carefully collected in the earlier phases, in this phase they were subjected to
systematic analyses using several graphical and numerical tools. The aim of this query was to
develop, eliminate, and validate inferences towards the root causes of the problem focused on
during the measure phase of the project.
To help validate the analysis, several measurements were taken especially in successive
processes so as to have fluidity and continuity in the measurement system. However, some
variables could not be pursued in the analysis due to resource limitations.
The focus of the analysis was to give inferences on where and what influence the occurrence
of “Tissue splitting”. These analyses include the following below.
Occurrence of MR “web-flutter” during unwinding (converting).
Variations of the MR symmetry before and after storage.
Variations in the weight, thickness and moisture profile of the MR web with respect
to “web-flutter”.
Variations in the MR stretch at break and tensile strength with respect to “web-
flutter”.
Speed behavior during fluttering (converting).
Physical observations on converting line.
Using Minitab® and Microsoft Excel
® as software, graphical analyses of the data are shown
below with descriptions.
30
Occurrence of MR “web-flutter” during unwinding (converting)
Through video coverage of the unwinding phase during converting, observations towards the
occurrence, location and frequency of “web-flutter” was collected across the three different
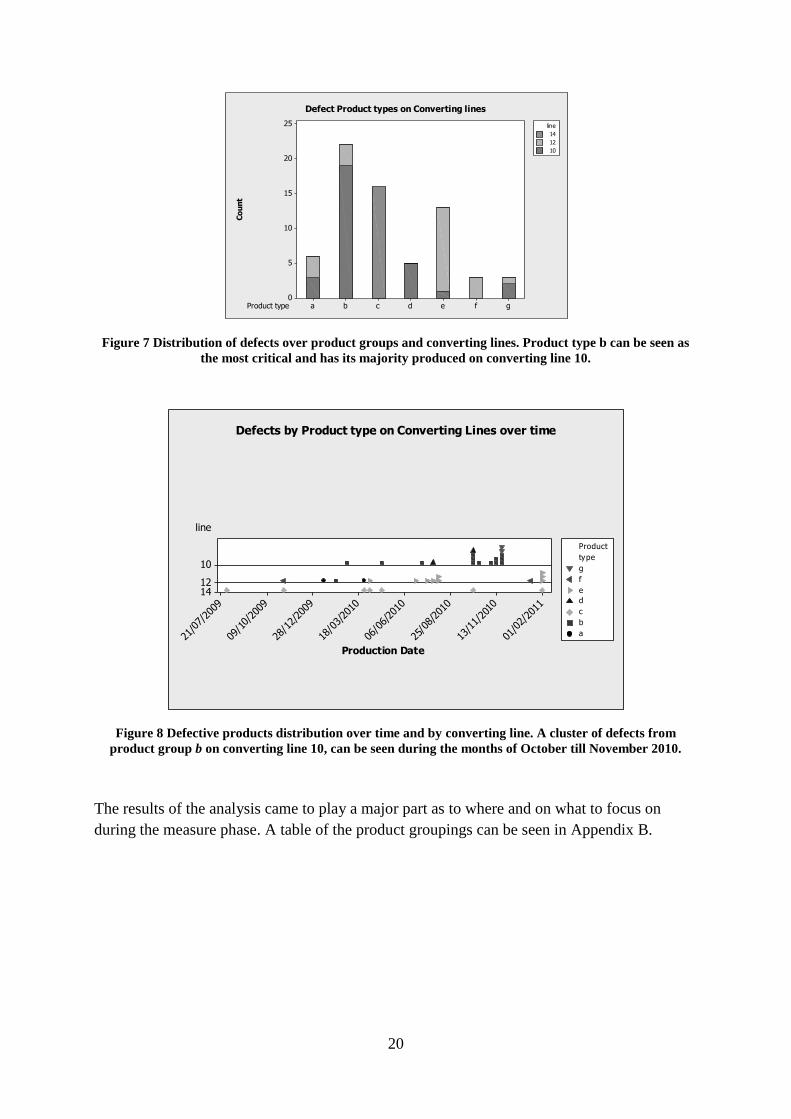
unwind stands. The graphical data analysis is presented below, see Figure 14.
Figure 14. Frequency of fluttering on the three different unwinding stands on converting line 10.
Since unwinding stand 3 is reversed the “web-flutter” as seen in the graph can be isolated to
one side of the MR during unwinding. The frequency of “web-flutter” is of equal value across
unwinding stands 2 and 4 with a 50% occurrence of “web-flutter”, while having
approximately 35% “web-flutter” on unwind stand 3.
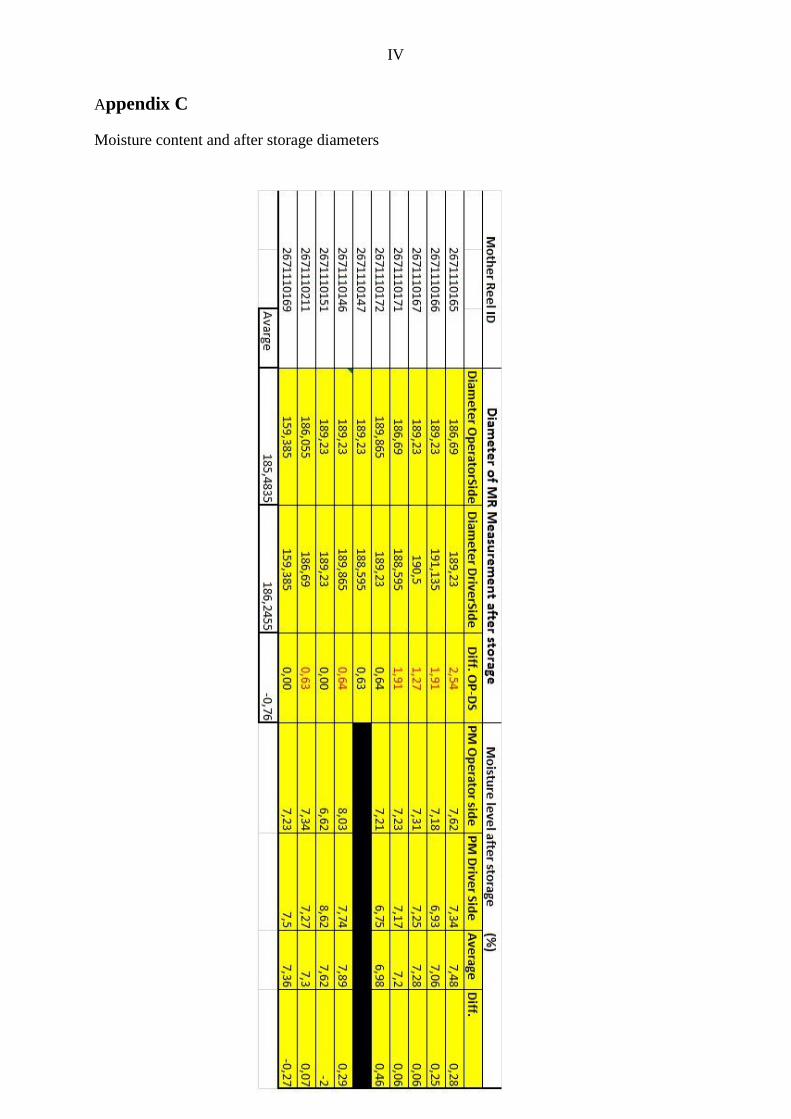
Variations of the MR symmetry before and after storage
Measurements were taken to analyze any variations as to the diameter of the MRs on both
operator‟s and driver‟s sides before and after storage. 501 MRs were measured before
storage, the operator sides had an approximate average of 162.1 cm and 160.7 cm on driver
side, excluding MR core. The results from the analysis of the data showed an average
difference of 1.4 cm between the driver side and operator side of the MRs‟ before storage, the
operator side being the larger side. 10 MRs were measured after storage. The operator side
had an approximate average of 185.5 cm and 186.2 cm on driver side, including MR core.
This results in a 0.71 cm difference, the driver side being the larger side. See Appendix C and
G for data tables.
31
Variations in the weight, thickness and moisture profile of the MR web with respect to
“web-flutter”
Through a focused measurement, cross-directional variations in the thickness and weight of
samples taken from MRs were analyzed. The cross directional variation in thickness differed
between 90.6101.5 µm, and in weight between 1.31.4 g. The moisture profile difference
between operator and driver side of the MRs were analyzed to check for any variation. It
differed between 6.628.03 % on operator side and 6.758.92 % on driver side. The average
value of the moisture samples for the MRs was calculated to 7.4 % after storage. These
variations were also analyzed with respect to the MRs which experienced “web-flutter”
during unwinding to determine any patterns towards its occurrence. The results showed no
trends in variation in thickness, weight or moisture profile towards “web-flutter”. See
Appendix C and E for data tables.
Variations in the MR stretch at break and tensile strength with respect to “web-flutter”
The variations of the tensile strength and stretch at break of the MR web in both MD and CD
were analyzed. At stretch at break both paper qualities have the same specification limits, thus
the average of all samples could be shown as one graph. As for the tensile strength, the paper
qualities have different specification limits and are separated into two graphs, see Figure 15
and 16. A skewed web tension can be discerned, with lower values on the operator side
increasing towards the driver side. Also noticeable is that the values in stretch at break are
very close or falling below the lower control limit on the operator side and in the middle area
of the web.
32
Figure 15. Average of all samples in stretch at break, measured in MD. Lower values can be seen from
samples taken from operator side.
Figure 16. Average of all samples in tensile strength, measured in MD. Paper qualities 2067 and 1067 are
viewed in two different graphs.
33
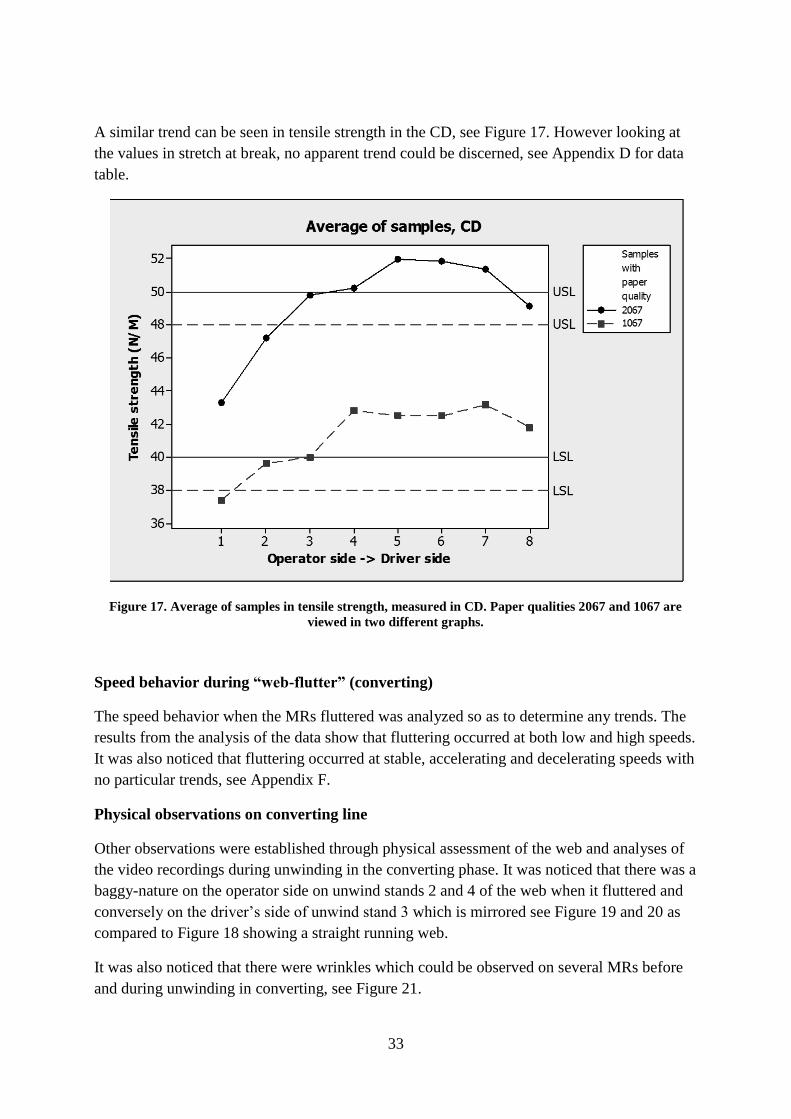
A similar trend can be seen in tensile strength in the CD, see Figure 17. However looking at
the values in stretch at break, no apparent trend could be discerned, see Appendix D for data
table.
Figure 17. Average of samples in tensile strength, measured in CD. Paper qualities 2067 and 1067 are
viewed in two different graphs.
Speed behavior during “web-flutter” (converting)
The speed behavior when the MRs fluttered was analyzed so as to determine any trends. The
results from the analysis of the data show that fluttering occurred at both low and high speeds.
It was also noticed that fluttering occurred at stable, accelerating and decelerating speeds with
no particular trends, see Appendix F.
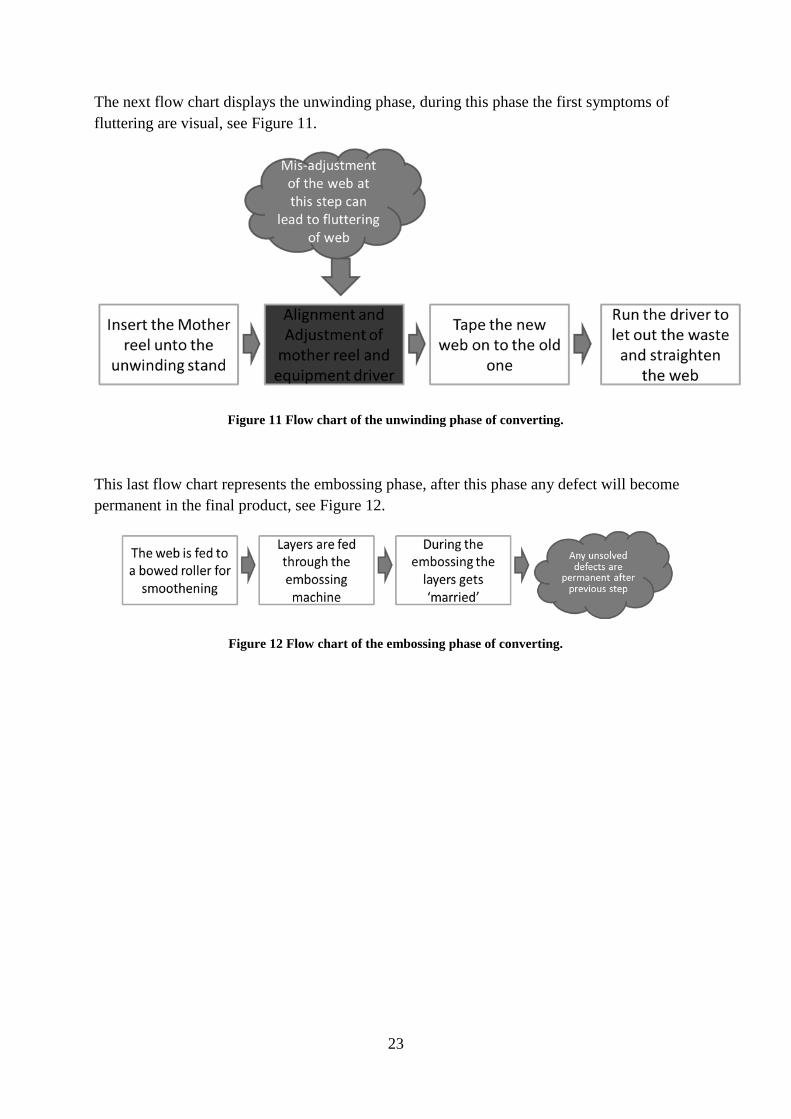
Physical observations on converting line
Other observations were established through physical assessment of the web and analyses of
the video recordings during unwinding in the converting phase. It was noticed that there was a
baggy-nature on the operator side on unwind stands 2 and 4 of the web when it fluttered and
conversely on the driver‟s side of unwind stand 3 which is mirrored see Figure 19 and 20 as
compared to Figure 18 showing a straight running web.
It was also noticed that there were wrinkles which could be observed on several MRs before
and during unwinding in converting, see Figure 21.
34
Figure 18 Pictures a straight running web, during unwinding.
Figure 19 Web-flutter during unwinding on Driver side, Stand 3.
35
Figure 20 Web-flutter during unwinding on Operator side, Stand 4.
Figure 21 Wrinkles in web while running during unwinding.
36
4.3.1 Discussion
As could be seen from the physical observations and data analysis, the operator side of the
MRs was seen to be the side which fluttered exclusively. It was also observed that almost
50% of the MRs fluttered which is significantly of a high value and probes for more
investigations. Following below will be comments on several variables that were considered
during the analysis.
Stretch at break and Tensile Strength
Figure 22 depicts the distribution of values collected for each MR in stretch at break. The
figure includes all MRs tested during the focused measurements and is displayed as a box
plot. The MRs with IDs; 0211, 1384, 1380 and 1585 were determined not to flutter during the
physical observations. In the box plot three out of four have median values that fall below
14% and have a distribution of 1.7% or less between their 1st and 3
rd quartiles. As compared
to the other MRs which in general are above the 14% mark and have a wider distribution
between their 1st and 3
rd quartiles. From the paper-making process, the target value of the
stretch at break for the paper quality 1067 & 2067 in the MD is 17% with an upper
specification limit (USL) of 19% and Lower specification limit of 15% and specification limit
of 12%. It is also necessary to emphasize the instability of this process with big variations in
the values across the MRs produced, where 85% of the mean values fall below the target
value and 36.8% below the lower control limit. Similar in CD for Tensile strength, the
samples from paper quality 2067 tends to fall above the USL on the driver side of the MRs as
seen in Figure 17.
37
Figure 22 Distribution of the stretch at break values in MD. Samples collected from produced MRs on PM
7, the circled staples represent MRs that did not show “web-flutter” during unwinding.
Taking into consideration the results from the analysis of the data and looking at previous
literature on the same subject, similarities can be seen. With reference to the physical
observations made, different levels of tautness were seen on the web in the cross direction of
the MRs, with a high level of slackness focus in the areas of the edges that were observed to
have fluttered. Similar observations had been made in studies on the same subject by authors
Land (2010), Roisum (2001) and Kulachenko et al., (2006) see Section 2.1.
Furthermore, considering the trends noticed with the stretch at break and tensile strength,
results can be related to a similar study by Roisum (2001). He reasons that the variation of the
stress and strain across the cross-direction is one reason for these areas of slackness and
tautness. In particular, he highlights the case of the web exhibiting one slack part and terms
this occurrence as “Pure Camber”. In this case, the web will show a linear trend from one side
to the other causing the end with the lower values to become looser than the part with higher
values which can be seen in Figure 2 and be compared with Figure 23. Roisum (2001)
example of “Pure camber” coincides with the findings from analysis which shows a similar
regression trend in stress and strain, see Figure 24.
38
Figure 23 Scatter plot distribution of MRs in stretch at break and tensile strength.
Figure 24 Graph of a linear trend in stress or strain in paper web. Roisum (2001).
Due to the fact that only a few samples of the MRs produced at the Edet mill were considered
during this project as a result of production constraints and time. Recommendations on further
tests to be carried out on more MRs with more samples cross-directionally across the web so
as to further understand the trends and variations of the stretch at break and tensile strength.
Also to make more concrete conclusions on the variation in papermaking process a
substantially larger sample size would have to be required. Looking at other PMs and
converting lines with similar paper quality production as focused on during this project will
39
be a good area to also develop inferences towards the trends and variations of the stretch at
break and tensile strength.
Finally, these variations of the stretch at break and tensile strength could be directly a result of
irregularities in the paper making process. An extensive research on the variables and factors
which influences the stress and strain properties of paper during the paper making process
would be a good step in uncovering the root cause of this variation.
Wrinkles
Conversely, looking from the physical observation during the analysis, wrinkling in the MRs
could be observed as a fact, see Figure 2 and 21. This has also been highlighted in studies
from Roisum (1996) and Kulachenko et al, (2006). They relate wrinkling as a major
contributor to “Tissue splitting” as the wrinkles folds when the web passes through the nips in
the embossing phase during the converting process. They argue that wrinkles appear when a
MR is exposed to environments which make it want to expand beyond its equilibrium state.
Roisum (1996) identified the causes of such constrained expansion to; moisture increase,
solvent increase, temperature increase or tension drop.
Connecting this back to the empirical environment at Edet mill, it is very likely that one or
more of these potential causes vary in the factory. Seeing as the wrinkles first appeared on the
MRs after they had been transferred to the converting lines from the storage. The
environmental conditions of the storage room are likely to be affecting the MRs equilibrium.
Also Kulachenko et al. (2006), suspect that external pressure can cause the same
phenomenon. Observing as the MRs are transferred in and out of storage by a heavy
automated lift which grabs the whole MR surface area. Substantial pressure is applied to the
MRs, thus making this another likely cause of wrinkles.
Therefore, wrinkles on MRs can be seen as a direct cause of “Tissue splitting” which does not
necessarily influence “web-flutter”. More study on the effects of wrinkling in the empirical
settings of Edet mill, is an area for further research.
Variations of the MR symmetry before and after storage
The symmetry results before and after storage on MRs turned out inconclusive. Before
storage measure shows an approximate average difference of 1.4 cm, where the operator‟s
sides were larger compared to the driver‟s sides. This is a reverse in the10 MRs that was
measured after storage that showed 0.71 cm difference, where the driver sides were the larger
sides. These disputable results can be attributed to different measurement techniques used
before and after storage.
The set target for a MR produced at PM 7 is 190 cm. During these measurements, including
the MR cores places the measurements taken before storage close to the target values, while
the after storage measures fall a few centimeters short of it. Also, before storage measure had
substantially more measures collected. Therefore, before storage measure of MRs diameter
can be considered a more reliable source.
40
Accepting the before storage measures suggests that PM 7 were producing uneven MRs. The
roughly 1% larger operator side could in theory affect run-ability during converting. It is
difficult to determine if the 1% difference across sides are of any significance. Seeing as the
MRs produced generally suffer from skewed web tension that is argued in this report to be a
probable cause of baggy web. An increase in length of the baggy parts of the web would be a
natural outcome. Furthermore considering paper exposed to unstable environments, it is likely
to change in its state of equilibrium which can cause a potential difference in the symmetry of
sides in the MRs.
Air flow
An important variable which affects “web-flutter” also is the effects of external disturbances.
Air flow during the unwinding process has been found to have influences on “web-flutter”.
Chang & Moretti, (2002) study looked at the interaction of air with the web which they
presumed can cause the free edges to vibrate violently. Paper web being a very wide, thin and
non-uniform material when exposed to axial velocity creates forces in different directions,
which directly affects the surrounding air flow as well as the paper characteristics itself
(Kulachenko, et.al. , 2006). When the paper web interacts with the surrounding air flow, it
tends to get dominated by the surrounding air. This alters the web making it deflect out-of-
plane (Chang & Moretti, 2002).
An experiment created by Chang & Moretti (1992), on cross-air-flow influence on the moving
paper web could disregard that “web-flutter” was caused by random turbulence. They rather
suggested that it was the result of the velocity of web and air. Later Watanbe & Sueoka
(2001) confirmed these results, writing that “web-flutter” amplitude increases gradually with
increased wind speed. Chang & Moretti (1992) also showed that the waves created by the
cross-air-flow increased in amplitude toward the edges of the web.
Discussing airflow influence on web-flutter is important to underline that airflow is a three-
dimensional issue, which is hard to replicate. Most of the experiments carried out on the
phenomenon have been made with two-dimensional experiments.
However due to inadequate resources in physical measuring equipment and time, this variable
was not researched in this study. It was not possible due resource inadequacy to measure the
flutter amplitude and frequency and also the physical diagnosis/observations of “web-flutter”
were subjective. Therefore, “web-flutter” behavior could not be related directing to the
measurement data collected. This relates also directly to the process speed effects on “web-
flutter” which cannot be eliminated until objective measurements can be carried out. The area
of air flow is recommended to be further studied at Edet mill.
41
4.4 Improve
As no improvements were carried out during this project, this chapter will be dedicated to
recommendation areas. Also criticism towards the measures that were carried out will be
presented.
4.4.1Recommendations
Suggestions or recommendations have been drawn out towards improvements that will
facilitate better operations in terms of traceability and problem solving in the future. These
recommendations can be explained as long term solutions of: improving the databases used
presently so as to increase traceability for problem solving; addressing the current state of the
quality control system; and a short term solution of adopting the use of video coverage to
monitor processes.
Long-term Suggestions
Improved databases to increase traceability
There have been several databases analyzed during the course of this project to collect,
manipulate, verify and draw out conclusions according to the peculiarity of the problems
encountered during this project. Based on mostly observations and problems encountered due
to continuous operations of these database systems, it has been observed that there is lot of
duplication information, incorrect or in some cases insufficient information entered into them.
A few suggestions will be presented as recommendations towards procuring solutions to the
afore-mentioned problems. These suggestions will be presented as immediate and long-term
suggestions.
Continuous synchronization of the databases with real-time events which they track is an
immediate issue that should be addressed. As observed through analysis during the project,
problems were encountered when the TS database system was used for tracing MRs ID to MR
stands during the converting process. This was evident as a video coverage system was
installed so as to validate the collection of this information. It was noticed that there was a
mismatch between the information in the TS database system and real-time events.
Suggestions towards the standardization of the routines and information which are entered
into the database system manually. It was observed that there were variations in silimar
information entered into the database systems by shop-workers individually and by shifts.
This invariably created problems in terms of an objective description and view on problems
and routines towards enetering these information (problem codes) into these databases. Also
noticed was poor traceability between the external claim and internal claim system due to
little or no standardize form of collection of information in the internal claim system. Creating
standard procedures and trainings towards the description of common problems will help
maintain fluidity towards understanding the effects of these problem and problem-solving.
A suggestion for the future is the creation of a central system where all necessary information
is entered into a single database system. This will help centralize information, keep
42
consistency, reduce errors, and keep a centralized view on the information entered especially
across functions or processes that work together (converting and paper-making). An initial
step towards this proposition is by identifying common information which is duplicated
across the various databases and brainstorming across the various users of these databases as
to which information is relevant, commonly or functionally used.
Finally, one of the purposes of creation of database systems is to help in the traceability of
problems to their origins of development during the whole production process.
Synchronization, ambiguity, and traceability of information in these systems should be a
grounded thought when applying these improvement suggestions.
Quality control
There is a routine and well defined manual for the internal quality control currently at Edet
mill. This explicitly states how and where controls should take place and are reported back to
QIS. However, for unknown reasons very few defects are detected and entered into QIS,
which does not reflect the true value of defects. Instead, the external claim system has become
the most reliable source. This way of receiving feedback on defects has two major issues.
Firstly, it can safely be assumed that only a fraction of the defective products are shown in the
claims, since it is a low cost product. Secondly, it is a very slow process that can take months
in between production until claims are received. Thus, there is not any certainty of the
quantity of the defective products, namely Tissue splitting, on the external market.
If any improvement initiatives were to be carried out directly towards Tissue splitting it would
be very hard to track the immediate progress. It would require a more reliable quality control,
where sigma levels can be assured before and after any improvements are initiated.
Short-term Suggestion
Measurements system
Video coverage and monitoring was adopted for processes that were particularly focused on
during measurement and analysis on this project. This adoption was a relevation as it showed
a lot of details which were often missed by operators. It also served as a good validation
system for problem-solving as a complement to the other database systems. The acquistion
and installation of these video coverage and montoring systems is relatively cost-effective and
could be adopted in a lot of other systems where problems are encountered or perceived.
4.4.2 Criticisms of measures
In this investigation, “web-flutter” was treated subjectively. It was measured through video
coverage and analyzed by physical observations. Therefore no concrete measures on web-
flutter could be made such as „flutter amplitude‟, „flutter frequency‟ or „flutter speed‟. With
such variables available a much more in-depth analysis could have been carried out.
Correlation might have been found between different factors in “web-flutter” and the factors
measured in this project. Unwinding speed during converting is one of these factors that are
perceived to require more concrete measures of “web-flutter” in order to find any correlation.
43
4.5 Control
The control phase usually commences with setting controls towards sustaining the
improvements suggested and implemented in the previous phase of the DMAIC framework.
This represents creating guidelines, manuals, new techniques and control plans so as to
maintain and continuously sustain improvements implemented. On this project, this phase was
not fully arrived at due to some unforeseen circumstances and constraints however; proposed
actions to be carried out and benefits with respect to this project will be elaborated in this
chapter. In that respect, recommendations towards upgrading the use and performance level of
statistical process control techniques will be presented.
Statistical Process Control (SPC) charts graphically represent the variability in a process over
time. They are usually used to monitor processes, where control charts can uncover
inconsistencies and abnormal variations. In cases where there is no special-cause variation
found to be present in the process, SPC helps define the capability of the stable process to
evaluate whether it is operating at an acceptable level. As a result, SPC charts are used in
many industries to improve quality and reduce costs (Wheeler & Chambers, 1992).
As could be seen in the discussions of the results arrived at during this project, see Section
4.3.1, there was a lot of variation in some processes in the tissue paper production. This was
evident with a lot of inconsistences and deviations of processes from set target values, control
limits and specifications.
Recommendations on applying statistical process control so as to understand and reduce these
variations and manage them during production.
44
5 CONCLUSIONS
The primary defects investigated during this thesis were the issues of “Tissue splitting” and
“web-flutter”. Quantifying the resulting financial impact due to these defects occurrence
demonstrated large economic losses for the mill on a yearly basis.
From the analysis conducted, it could be discerned that the paper web are being produced
with a skewed cross directional profile in stretch at break and tensile strength. As discovered
through the results of the analysis, the paper web had inherently different properties after
production at the papermaking process. This unevenness of its properties resulted in
differences in length across the paper web. This gave the appearance of a baggy web, where
slack and taut areas of the web could be discerned. Running the unwinding operation with
paper web with this defect, will lead to “web-flutter”, where the slack parts of the web will
suffer. Also, “web-flutter” was discovered to have a great risk of causing “Tissue splitting”.
The root cause behind “web-flutter” was traced back to the papermaking machines and its
processes at the mill and a solution to the problem would have to be sought there. These
conclusions were made through in-depth analysis and research which are highlighted in this
report.
Another issue that is attributed to “Tissue splitting” and was eminent at Edet mill was
wrinkling on the MRs. Visible wrinkles on the paper web often results in folds during the
converting process as the web passes through nips which in-turn results in permanent folds or
creases in the output products. The origin of the wrinkles was traced back and isolated to the
transportation and environmental differences which the MRs were exposed to at the mill.
On a concluding note, the investigation conducted in the master‟s thesis has presented
interesting and valid results that can be utilized as a solid platform for proffering solutions to
defects in the paper production mill. However, more study by other researchers should be
carried out so as broaden and concretize findings and results on this area.
Reference List
Alänge, S. 2009. The Affinity-Interrelationship Method AIM, Chalmers University of
Technology, Gothenburg
Brook, Q. 2010. Lean Six Sigma and Minitab (3rd
Edition), OPEX Resources Ltd.
Bryman, A. and Bell, E., 2007. Business Research methods (2nd
Edition), Oxford: Oxford
University Press.
Chang, Y. B. and Moretti, P. M., 1992. An experimental study on edge flutter in webs, In Web
Handling, ASME AMD.
Chang, Y. B. & Moretti, P. M., 2002. Flow-Induced Vibration Of Free Edges Of Thin Films.
Journal of Fluids and Structures.
Roisum R. David 1996.” The Mechanics of Wrinkling”, Finishing Technologies, Inc.
Roisum R. David 2001. Baggy Webs: Making, Measurement and Mitigation theory, Finishing
Technologies, Inc.
Kulachenko a, P., Gradin a, H. and Koivurova 2006. Modelling the dynamical behaviour of a
paper web. Part I. Division of Solid Mechanics, Mid Sweden University, Sweden
Kulachenko a, P., Gradin a, H. and Koivurova 2006. Modelling the dynamical behaviour of a
paper web. Part II. Division of Solid Mechanics, Mid Sweden University, Sweden
Land, C. 2010. “Baggy paper webs: Effect of uneven moisture and grammage profiles in
different process steps” Karlstad University, Faculty of Technology and Science, Sweden
Magnusson, K., Kroslid, D. and Bergman, B., 2003. Six Sigma The Pragmatic Approach.
Lund, Studentlitteratur.
McCarty, T. Bremer, M. Daniels, L. and Gupta,P, 2005. The Six Sigma Black Belt handbook,
McGraw-Hill companies Inc.
Persse R. James 2006. Process Improvement Essentials, O‟Reilly Media Inc.
SCA, Edet Mill. 2011. (Personal communication, 30 April 2011 – 1 September 2011)
Shiba, Shoji, Graham, A. and Walden, D. 1993. A New American TQM: Four Practical
Revolutions in Management, Productivity Press, Portland, OR and Center for Quality
Management, Boston, MA
Watanabe, Y. & Sueoka, Y., 2001. An Experimental Study Of Paper Flutter, Elsevier Science
Ltd.
Wheeler, D J and Chambers, D S., 1992. Understanding Statistical Process Control.
Webex Inc., 2008. Common Problems in Web Handling. [Online] Available at:
<http://www.webexinc.com/technical_problems.html> [Accessed 12 September 2011].
I
Appendix A
Project Charter
Project Title: Investigation on defects in paper production process, a Six Sigma Black Belt
project at SCA Edet mill.
Company/Organization SCA Hygiene Products, AB
Unit/department Edet paper mill
IT Champion HR Champion Göran
Sponsor & Process owner Jonas Pihlström, Johan G.
Site or location Lilla Edet, Sweden
Project start date 2011-04-27 Project completion date 2011-10-21
Expected impact level Expected financial impact
Element Description Charter
Project description
A short description of the project.
A quality problem has been observed by end consumers in form of tissue splitting with the final products. This could be attributed to several parts of the process, and it is paramount to pinpoint the source of the defect in the process. Over-excessive web-fluttering was identified as cause to the tissue splitting problem. As the plant runs 24/7/365, a frequent occurrence of this problem leads to customer dissatisfaction, under-utilization of workforce and man-hours due to rework. This evidently leads to increase overhead cost.
Impacted process The specific process/es involved and where opportunity exists
Key processes where the quality problem could be attributed to presently are: Paper-making process and converting process.
Benefit to customers Define internal and external customers (most crucial) and their requirements.
Representatives of the Home-consumer products converting lines To keep the web-fluttering to a minimum degree that will not lead to web- breaks or tissue splitting without reduction of the process speed. manage the web- fluttering without it causing any quality problems
Benefit to business Describe the expected improvements in business performance.
Short term benefits: Maximum utility of workforce and man-hours and process efficiency. Reduction waste Cost efficiency Increase customers satisfaction (internally) Long term benefits: Solving the quality problem can increase the market share probabilities. Increase customers satisfaction (externally)
Project delimitations What will be excluded from the project?
This thesis will be limited to SCA, Edet paper mill, Sweden. Thus, the thesis project will follow a single case study approach. During the measure and analyze phase of this project, external wind which influences the term called “web-flutter” which consequently could cause “tissue splitting“ will not be considered during these phases due to scarce measurement resources. It is also assumed that the components in the converting machine or used during the process are in standard condition.
Required support
Support in term of resources (human and financial) required for the
Representatives of Paper-making, Converting process, Marketing, IT and Human Resources.
II
project.
Team members
List names of Master students.
Robbie Hällås Henry Savage Olugbenga
Specific goals
Define the Baseline, your realistic goals for the project and the best case target for improvement.
Actual value (Baseline) Realistic goal by project end date
Best case goal
To identify parts of the process where the problem could be seen.
To identify the root cause of “web-flutter” and other likely cause resulting in Tissue splitting.
To reduce the degree of web-flutter.
III
Appendix B
Paper qualities sorted into product groups
Paper Machine Paper quality 1 Paper quality 2 Paper quality 3 Product type
7 251134100 251134100 a
7 251134100 251134100 a
7 251134100 251134100 a
7 251134100 251134100 a
7 251134100 251134100 a
7 251134100 251134100 a
7 106734100 206734100 206734100 b
7 106734100 206734100 206734100 b
7 106734100 206734100 206734100 b
7 106734100 206734100 206734100 b
7 106734100 206734100 206734100 b
7 106734100 206734100 206734100 b
7 106734100 206734100 206734100 b
7 106734100 206734100 206734100 b
7 106734100 206734100 206734100 b
7 106734100 206734100 206734100 b
7 106734100 206734100 206734100 b
7 106734100 206734100 206734100 b
7 106734100 206734100 206734100 b
7 106734100 206734100 206734100 b
7 106734100 206734100 206734100 b
7 106734100 206734100 206734100 b
7 106734100 206734100 206734100 b
7 106734100 206734100 206734100 b
7 106734100 206734100 206734100 b
7 106734100 206734100 206734100 b
7 106734100 206734100 206734100 b
7 106734100 206734100 206734100 b
5 171316700 171316700 c
5 171316700 171316700 c
5 171316700 171316700 c
5 171316700 171316700 c
5 171316700 171316700 c
5 171316700 171316700 c
5 171316700 171316700 c
5 171316700 171316700 c
5 171316700 171316700 c
5 171316700 171316700 c
5 171316700 171316700 c
5 171316700 171316700 c
5 171316700 171316700 c
5 171316700 171316700 c
5 171316700 171316700 c
5 171316700 171316700 c
5 171334100 171334100 d
5 171334100 171334100 d
5 171334100 171334100 d
5 171134100 171134100 d
5 171134100 171134100 d
5 176034100 e
5 176034100 e
5 176034100 e
5 176034100 e
5 176034100 e
5 176034100 e
5 176034100 e
5 176034100 e
5 176034100 e
5 176034100 e
5 176034100 e
5 176034100 e
5 176034100 e
7 251134100 191134100 f
7 251134100 191134100 f
7 251134100 191134100 f
7 206734100 206734100 206734100 g
7 206734100 206734100 206734100 g
7 206734100 206734100 206734100 g
IV
Appendix C
Moisture content and after storage diameters
V
Appendix D Stretch at break and Tensile strength data