KEYWORDS Smartphone distributed applications, advanced metering, energy use, simulation in industry, business and services.
ABSTRACT
The work presented in this paper concerns the development of a smartphone application for the monitoring of energy consumption relative to a domestic electricity grid. An algorithm has been integrated in the smartphone application allowing Enel (the main Italian Electrical Company) customers to have, on their mobile phone, clear and transparent information about the energy consumption of their houses in real time. INTRODUCTION
Nowadays, producing and consuming energy constitutes the fundamental requirement for the political, economic and sociological development of humanity. So far, we have followed a model linked to a continuous increase in consumption, which has led us to a misuse of exhaustible fossil resources (European Commission, 2011). The scarcity of such resources, together with the increasing environmental pollution, linked to the production and consumption of energy, represent the reasons why we can regard such a model as inadequate and inefficient. Global phenomena such as population growth, modernization of developing countries and technological development, contribute to increasing the demand for electrical energy (Energy Authority, 2009). Therefore, the optimization of their use becomes extremely important, minimizing the waste of resources considerably. Several studies (Kamal, 2012), (Energy Authority, 2009) on the subject suggest how to update users on their actual consumption and relative costs in real time (Enel, 2010), (Enel, 2012). Starting from the display of the consumption of energy in kWh, the transformation of the quantity of kWh into its equivalent in monetary terms (EUROs) does not turn
out to be simple. This is mainly due to the non-linearity of the function that allows the calculation of energy consumption in terms of costs. The non-linearity is owing to the retroactivity of the cost of energy and represents a big obstacle. In this work it is highlighted a detailed analysis of the elements that constitute the energy costs (Darby, 2006) in order to analyze the algorithms, which have been processed to obviate the retroactivity, seeking a cost estimation that is as reliable as possible. We argue, therefore, that this work represents an experimental step towards the future, since its purpose is to make people familiar with the world of energy, providing them with clear information concerning the consumption and production both in terms of energy (kWh) and in terms of costs (EUROs) (European Commission, 2011), not only for what regards a private use, but also for what involves business activities, making users more aware of a more intelligent, practical use of energy (Faruqui, 2009). Information and communication technology (ICT) can help in many ways to conserve energy. On the one hand it does so by optimizing various industrial processes (and thus increasing their energy efficiency); on the other hand it can increase transparency, create energy awareness, and support individuals to make informed decisions that contribute to a more efficient energy use (Weiss et al., 2010). With the rise of ubiquitous computing, data about real-world events is being captured at an increasingly detailed level. Together with the rapid growth of the mobile phone market and mobile internet access, this has led to a large number of mobile applications which aim to support users’ daily life in a wide range of areas. To name a few, this ranges from insurance claims assistance (Baecker, 2009) over shopping assistance (Adelmann, 2007) to emergency response (Landgren & Nulden, 2007). The main contribution of this paper is the development of a mobile phone application for residential energy monitoring based on consumption data acquired by the domestic electronic meter. The resulting prototype on Android and iOs devices shows how mobile phones can
help users to monitor and control their energy consumption. This article is organized as follows: the following section describes a technical analysis of energy cost. In this section we describe the components of energy price, the Italian AEEG (Energy Authority, 2013) and its role in the market. The third section summarizes the way how the energy bill is composed and invoiced, giving an exhaustive explanation of the algorithm being behind the calculation to invoice a determined quantity of energy. The fourth section describes the planning of cost functionality, presenting the definition of the problem of retroactive costs, the choice of the input for the simulation and an analysis of the results and management relative to retroactive costs. Finally, the fifth section refers to the system architecture that allows to obtain and to present the consumption data. THE COMPONENTS OF PRICE
The price of electrical energy for final users is calculated in order to cover all the expense items linked to the electrical energy supply. It is, thus, the result of the sum of numerous components, each of which is present in a different percentage (Energy Authority, 2013b), as you can see from Figure 1.
Figure 1, Percentage composition of the price of electricity in Italy
More than half of the total is characterized by the selling costs of electrical energy, fixed either by the “Free Market” for the so-called “suited” customers, or by the “Service for Maximum Protection”, for those bound by one of the companies dealing with electrical energy. Such selling costs, together with the general ones and the costs for the electricity grid, are fixed by AEEG and updated every three months. Now, let us see more carefully what every single component of cost refers to:
A) COSTS FOR SELLING SERVICES: they are the different activities set by the provider to purchase and sell electrical energy to the final user.
B) COSTS FOR ELECTRICITY GRID SERVICES: they are the activities that allow providers (both operating in the “Free Market” and in the “Service for Maximum Protection”) to transport electrical energy to national and local grids as far as the electricity meter.
C) OVERHEAD COSTS: they are fixed by AEEG and are bound to pay taxes introduced by laws ministerial decrees.
D) TAXES: a percentage of the payment of the electricity bill is intended to cover some taxes such as ACCISA and IVA.
CALCULATION OF THE ELECTRICITY BILL
The price of the components of the electricity bill is calculated through some unit costs per kWh, taking cognizance of the quantity of energy, consumed and recorded during a specific period (Energy Authority, 2013a), (Energy Authority, 2013b).
Figure 2, Part of bill in which actual consumption of energy
is stated.
To understand the algorithm that is behind the calculation of the quantity of energy invoiced, which is obtained either by reading the electricity meters or by estimating users’ historical consumption, we need to describe in what its distribution of annual consumption consists. Let us establish what the annual tiers of cost, which determine the final tariff, are:
The calculation of the retroactive cost is drawn from the organization of consumption through tiers of annual estimation. All information about consumption can be divided into more than a temporal sub-interval, because rates are updated every three months and, consequently, the consumption of a month’s time can refer to rates of a
term of three months, which is different from that concerning the following month. Example: Let us suppose that we consume 333 kWh from September 5 to 30, 26 days (b). These 333 kWh (a) can be either the result of updated meter readings or the outcome of estimations, based on the user’s historical consumption. To reach the annual estimation (SA), composed of 365 days, supposing we have consumed 333 kWh in 26 days, we make a proportion (1):
4675 kWh would be the annual estimation if the consumption remained constant. Let divide the 333 kWh into tiers, applying the daily rate to 4675 kWh:
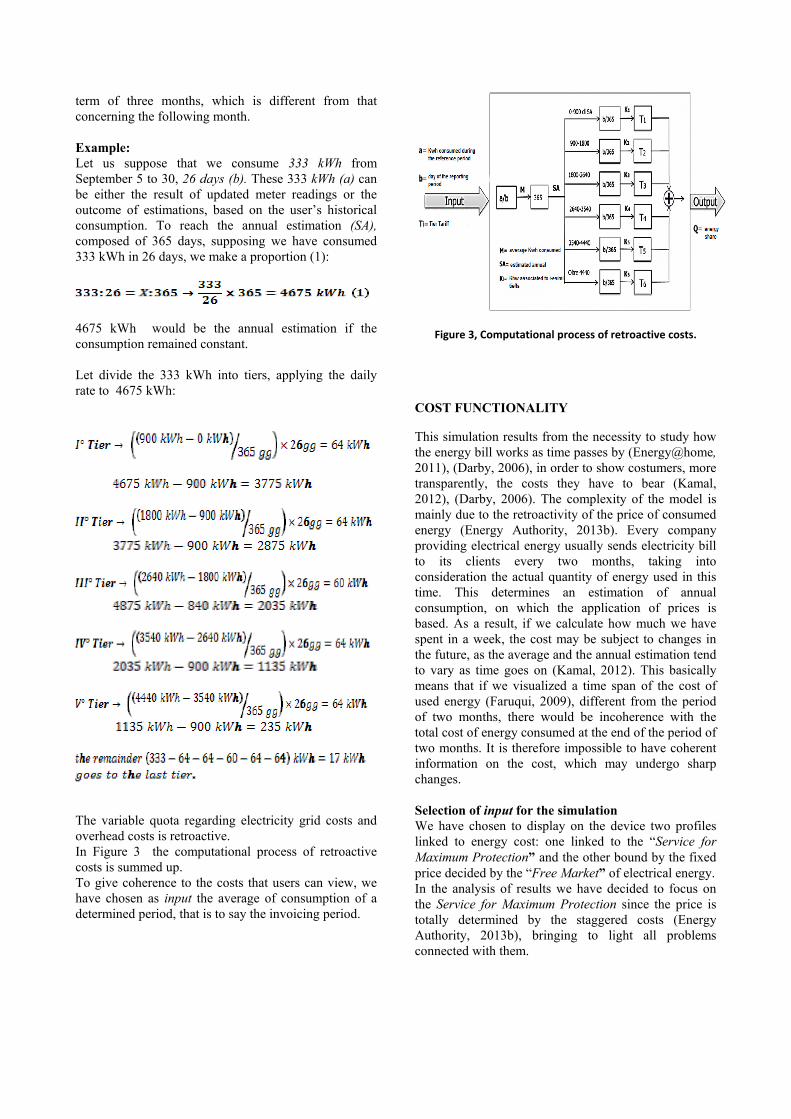
The variable quota regarding electricity grid costs and overhead costs is retroactive. In Figure 3 the computational process of retroactive costs is summed up. To give coherence to the costs that users can view, we have chosen as input the average of consumption of a determined period, that is to say the invoicing period.
Figure 3, Computational process of retroactive costs.
COST FUNCTIONALITY
This simulation results from the necessity to study how the energy bill works as time passes by (Energy@home, 2011), (Darby, 2006), in order to show costumers, more transparently, the costs they have to bear (Kamal, 2012), (Darby, 2006). The complexity of the model is mainly due to the retroactivity of the price of consumed energy (Energy Authority, 2013b). Every company providing electrical energy usually sends electricity bill to its clients every two months, taking into consideration the actual quantity of energy used in this time. This determines an estimation of annual consumption, on which the application of prices is based. As a result, if we calculate how much we have spent in a week, the cost may be subject to changes in the future, as the average and the annual estimation tend to vary as time goes on (Kamal, 2012). This basically means that if we visualized a time span of the cost of used energy (Faruqui, 2009), different from the period of two months, there would be incoherence with the total cost of energy consumed at the end of the period of two months. It is therefore impossible to have coherent information on the cost, which may undergo sharp changes. Selection of input for the simulation We have chosen to display on the device two profiles linked to energy cost: one linked to the “Service for Maximum Protection” and the other bound by the fixed price decided by the “Free Market” of electrical energy. In the analysis of results we have decided to focus on the Service for Maximum Protection since the price is totally determined by the staggered costs (Energy Authority, 2013b), bringing to light all problems connected with them.
Figure 4, Algorithm for the calculation of models of energy consumption.
For both profiles we have analyzed the progress through different time intervals. All this has been possible by linking a quantity of energy used in two months and distributing it to sub-intervals, taking a Gaussian mean of usual consumption into account. Analysis of results and management of retroactive costs The energy cost of a determined time span is established according to the daily average of consumption; nonetheless it is not useful to consider the daily average to calculate the energy cost relating to time intervals displayed on our device (U. E. Administration , 2011). In order to maintain coherence in the period of two months in question, with regard to all time intervals that users can view on our device, the displayed cost, for example, in the first month, must correspond to the sum of the displayed costs of every week (Enel, 2012). In order that this can be possible, the calculation has been managed in two ways: 1. Management of costs pertinent to the period of
two months: Every time users view an interval of cost (week or month), the algorithm, at heart of computation, will calculate consumption in Kwh from the beginning of the period of two months to this moment, as well as the daily average and, through this, the cost of the whole period. Once the cost of such a period has been obtained, some measures for the relative consumption will be linked to the models of the chart (Energy Authority, 2013b); for example, if we wanted to view the costs relating to a week, what would most interest us would be to know the measures connected with single days. Such measures will allow us to divide the total cost, previously calculated, among all models, which,
then, will be displayed by bars on the chart of costs relative to the time span selected. If the daily average does not undergo sudden changes, for this type of computation, the calculation of costs, on a time span of two months, should adopt a linear course.
2. Management of costs pertinent to the historical
average of consumption: The situation would be different if we did not have any date of invoicing. Presuming that the daily average of consumption has a constant trend, as it reflects user’s habits, we should take into consideration the daily average of the historical consumption of a recent period. After we have done this, determining the percentages of energy, linked to the tiers, through the relative estimation of annual consumption, for every quantity of energy model shown in the charts below, we can calculate the cost by multiplying the energy percentages relative to the i-th day by the prices that correspond to the tiers. In this case, we will obtain the opposite process to the previous one that provided for the calculation of cost and its division. According to such an algorithm, on the other hand, it is the energy that is divided among tiers of price, in order to determine the cost of the period in which we are interest. As we can see from Figure 5 and 6, although the incoherence of costs among the different time sub-intervals has been worked out, the incoherence relative to the possibility of observing, for a similar interval of visualization, different costs in different instants, still remains. This happens because of the calculation of the average; in fact, if it changes as time goes by, the values, in terms of cost, of a time span of a determined period change too.
Figure 5, Calculation of daily consumption costs relative to the first week of a period of two months. In consequence of a recalculation, relative to the first or second algorithm of a period previously consulted, if the daily average turns out to be modified, there will be an incoherence among the values viewed.
Figure 6, Calculation of daily consumption costs relative to the first week of a period of two months at the end of this.
The statistic nature of information determines the possibility of providing users with information that diverges from reality, just for this reason, users should be aware of this anomaly. In case there were changes in user’s consumption habits, they should be informed, by notification, for example, that what they view is temporary cost information and that, as time goes by, it may be updated by more accurate estimations.
Figure 7, Conversion kWh-Euro display.
SYSTEM ARCHITECTURE
The designed distributed system is composed of three elements that interact with each other through Internet.
More in detail there is a part of the system installed at home, with the purpose of acquiring the data, composed of a hardware device in communication with the counter (the SmartInfo) and a PC application that transmits the device data on the web. Another part of the system consists of a web application that interacts with a database, on the one hand making persistent and aggregating the data received from home, the other transmitting this data to the end user client. Finally, there is the client application on the user's mobile device, that allows it to access, wherever it is, the aggregated data from the web application. In case you want to handle even the energy production data instead, the system is more articulated. In fact, in these cases are typically installed in the user house two counters: the first connected to the mains and the second to the production plant.
Figure 8, The overall distributed system.
CONCLUSIONS
The goal of the work described in this paper was to analyze the energy market and the actors being part of it (Energy Authority, 2010), (Energy Authority, 2013); studying what the processes being behind the calculation of energy bills, which often appear little transparent to us, are and analyzing the variety of tariffs
determining the range of offers, now present in the Free Market (U. E. Administration, 2011), (Energy Authority, 2009), to which every customer can access. All this has led us to integrate new applications with the device, thanks to the development of an algorithm that can show users the costs linked to their own consumption, that surely represent, for users, useful information and more direct feedback (Faruqui, 2009) for the final aim of the “mission” concerning the project itself: saving electrical energy.
REFERENCES Adelmann R., 2007. Mobile Phone Based Interaction with
Everyday Products on the Go. In: Proc. NGMAST 2007. Baecker O., Ippisch T., Michahelles F., Roth S., Fleisch E.,
2009. Mobile claims assistance. In: Proc. MUM 2009. Council Directive, 2006. Directive 2006/32/Ec of the
European Parlament and of the Council on energy end-use efficiency and energy services and repealing. Council Directive 93/76/EEC (April, 5). http://eur-lex.europa.eu/LexUriServ/LexUriServ.do?uri=OJ:L:2006:114:0064:0064:en:pdf
Darby, S. (2006). The effectiveness of feedback on energy consumption.http://www.eci.ox.ac.uk/research/energy/downloads/smart-metering-report.pdf
Enel (2010). How to use the single-phase electronic meter and discover all the advantages. http://www.enel.it/it-IT/ doc/reti/enel_distribuzione/Contatore_Monofase_v1.pdf
Enel (2012). The electronic meter. http://www.enel.it/it-IT/reti/enel_distribuzione/qualita/progetti_contatore_elettronico/
Energy Authority (2009). Actions in the management and control of the application and promotion of efficient energy. http://www.autorita.energia.it/it/docs/09/056-09arg.htm
Energy Authority (2010). Deliberation 25 March 2010-ARG/elt39/10.http://www.autorita.energia.it/allegati/docs/10/039-10arg.pdf.
Energy Authority (2013a). Authority for Electrical Energy and Gas: http://www.autorita.energia.it/it/index.htm
Energy Authority (2013b). Percentage composition of the price of electricity for a domestic consumer type. http://www.autorita.energia.it/it/dati/ees5.htm
Energy@home (2011). Energy@home: a “User-Centric” Energy Management System. http://www.energy-home.it/Documents/110518Energy@Home_Whitepaper.pdf
European Commission (2011). Climate Action - EU action against climate change. http://ec.europa.eu/climateaction/eu_action/index_it.htm
Faruqui, A. S. , 2009. The impact of informational feedback on energy consumption. http://www.smartgridnews.com/ artman/uploads/1/The_Impact_of_Informational_Feedback__05-20-09_.pdf.
Kamal, D. (2012). Mobile Computing. Oxford University Press, Sept.
Landgren J., Nulden U.A, 2007. A study of emergency response work: patterns of mobile phone interaction. In: Proc. CHI 2007.
Patel, S. R., 2007. A flick of a switch. http://abstract.cs.washington.edu/~shwetak/papers/ubicomp2007_flick.pdf.
U. E. Administration (2011). International energy outlook 2011.http://205.254.135.24/forecasts/ieo/pdf/0484(2011).pdf.
Weiss M., Loock C.-M, Staake T., Mattern F., Fleisch E., 2012. Evaluating Mobile Phones as Energy Consumption Feedback Devices. P. Senac, M. Ott, A Seneviratne (Eds): MobiQuitous 2010, LNICST, vol 73, pp. 63-77.
AUTHOR BIOGRAPHIES FRANCO CICIRELLI, PhD, is a computer science post
doctoral fellow at University of Calabria (Unical), DEIS - department of electronics informatics and systems science, making research on agent and service paradigms for the development of distributed systems, parallel simulation, Petri nets, distributed measurement systems. He is a member of ACM.
EMMANUELE NERI, has obtained the bachelor degree
(2009) and the master degree (2012) in computer engineering at the University of Calabria – DEIS. He worked as a junior analist for Enel and ELIS Consulting in Rome. He is currently working for the Open Reply company in Milan, on projects of mobile applications.
FRANCESCO PUPO, PhD, is a computer science associate
professor at Unical, DEIS, teaching distributed systems and mobile devices programming. His research interests include: multi-agent systems, Petri nets, parallel simulation, verification of time-dependent systems, service oriented computing, distributed systems. He is a member of ACM and IEEE.
LIBERO NIGRO is a full professor of computer science at
Unical, DEIS, where he teaches object-oriented programming and real-time systems courses. He is the responsible of Software Engineering Laboratory (www.lis.deis.unical.it). His current research interests include: software engineering of time-dependent and distributed systems, real-time systems, Petri nets, modeling and parallel simulation of complex systems, multi-agent systems, service oriented computing. Prof. Nigro is a member of ACM and IEEE.