76
A Snapshot of the Danish Energy Transition Objectives, Markets, Grid, Support Schemes and Acceptance STUDY

A Snapshot of the Danish Energy Transition Objectives, Markets, Grid, Support Schemes and Acceptance
Study
A Snapshot of the Danish Energy Transition
ImprInt
Study
A Snapshot of the Danish Energy Transition
Objectives, Markets, Grid, Support Schemes and Acceptance
WRIttEN By
Agora EnergiewendeRosenstrasse 2 | 10178 Berlin | Germany
Stephanie Ropenus, Ph.D. [email protected]
DTU Management Engineering Danmarks Tekniske Universitet | Produktionstorvet Bygning 426 | rum 109 2800 Kongens Lyngby | Denmark
Prof. MSO Henrik Klinge Jacobsen, Ph.D. [email protected]
Typesetting: UKEX GRAPHIC, Ettlingen Cover: © robertharding/Fotolia
084/17-S-2015/En
Publication: November 2015
Please quote as:
Agora Energiewende and DTU Management Engineering (2015): A Snapshot of the Danish Energy Transition. Objectives, Markets, Grid, Support Schemes and Acceptance.
www.agora-energiewende.de

1
Preface
Dear Readers,
In recent years, Denmark has gained considerable interna-tional attention as one of the first movers in implementing a green energy transition – the so-called grøn omstilling. In order to achieve an energy system independent from fos-sil fuels by 2050, Denmark is pursuing an integrated policy approach that takes all energy sectors into account. In 2014, wind energy covered 39 percent of Danish electricity de-mand. Wind and bioenergy – the latter in particular for the conversion of combined heat and power plants – will play key roles in the Danish energy transition.
This paper invites you to take a deeper look at Danish energy policy in general and at the electricity sector in particular. What are the major objectives of Danish energy policy? What is the logic behind an integrated approach that encompasses all energy sectors? How has market integra-tion evolved in the Nordic countries? How does the off-shore wind tendering system work? What are the principles
underlying grid expansion within Denmark? What types of consumer participation schemes exist?
This paper aims to explore some of the lessons learned from the Danish experience. At the same time, this paper can serve as an introductory overview to the Danish power system and the policies that govern it. The paper is part of Agora Energiewende’s “Lessons Learned from Denmark” se-ries. More information on papers, events and presentations in this “Lessons Learned from Denmark” series is available on our website at www.agora-energiewende.de.
We hope you find this report to be a worthwhile contribu-tion to the current debate and wish you a pleasant read.
Kind regards,Patrick Graichen Director, Agora Energiewende
Key findings at a glance
Denmark is one of the first movers in implementing a green energy transition across all sectors, and aims to become independent from fossil fuels by 2050. The Danish power system has been undergoing a transfor-mation, moving from a highly centralised to a more decentralised structure in electricity generation. There has been a significant increase not only in wind power but also in distributed generation from combined heat and power plants since the 1980s. Broad-based political agreements on energy policy have provided security for investors while enabling a smooth and continuous transition to a sustainable power sector.
The Danish energy transition follows an integrated approach that encompasses the electricity, heat and transport sectors. The interdependencies among these different sectors are reflected in Danish energy policy goals, in scenario analyses as well as in concrete initiatives for implementing the transition to a renewables based energy system.
4
Denmark currently covers nearly 40 percent of its electricity needs with wind power, demonstrating that a grid can be well-equipped to accommodate high renewable energy feed-in. Internal grid expansion in neighbouring countries such as Germany and Norway will play a significant role in the future utilisation of interconnectors.
3
2
1
As an early mover, Denmark has already gained substantial experience in the application of tendering schemes for offshore wind energy. The Danish tendering scheme is characterised by Contracts for Difference with guaranteed support payments, a guaranteed grid connection and a one-stop-shop authority for preliminary site assessments when new offshore wind energy projects are developed.

2

3
Content
Summary of Key Findings and Conclusions 5
1. Introduction 7
2. Content of the paper 9
3. danish energy strategy: Objectives of the danish energy transition 11 3.1. A fossil fuel-free energy system by 2050 – Major objectives and development of energy policy targets 11 3.2. Two pillars of the green energy transition: Renewable energy and energy efficiency 13 3.2.1. The Energy Strategy 2050 14 3.2.2. The Energy Agreement 2012: Intermediate milestones for 2020 14
4. the danish electricity system: Current state and future scenarios 17 4.1. The Danish electricity system today 17 4.2. The Future Danish energy mix – Possible paths for wind and biomass 22
5. Major trends influencing future development 25
6. Lessons learned and regulatory responses – An overview 29
7. Lessons learned from the power market: Early integration and a new power market design 31 7.1. Early grid and market integration as a cross-border flexibility option 31 7.2. Market Model 2.0: Current challenges and a consensual approach to finding a new market design 34 7.3. Low hanging fruit: Participation of wind power producers in the regulating power market 37
8. Promotion of renewable energy sources 41 8.1. Supporting onshore wind energy 42 8.2. Offshore tender results and conditions for existing wind farms 43 8.3. Support for biomass, biogas and small-scale solar PV 49
9. Grid expansion as a cornerstone of the green energy transition 51 9.1. Danish grid expansion: Coherent planning across voltage levels and undergrounding for the beautification of the landscape 51 9.2. Interconnectors from Denmark to neighbouring countries: The major flexibility option for wind integration 55

Agora Energiewende | A Snapshot of the Danish Energy Transition
4
10. Consumers: Acceptance, participation and costs of the green energy transition 59 10.1. Consumer participation and wind projects 59 10.2. Financing of support and effects on consumer tariffs 61
11. Conclusions 65
References 67

Study | A Snapshot of the danish Energy transition
5
the first of its kind, both in Denmark and worldwide. The cross-sectoral approach of the Danish energy transition is comprised of two main pillars: namely, the adoption of green energy in the electricity, heat and transport sectors; and the implementation of energy efficiency measures. The 2012 Energy Agreement contained policy initiatives for the year 2020. These included the deployment of onshore and offshore wind energy, a smart grid strategy, a smart meter roll-out and initiatives facilitating the conversion to green heating. The latter foresees a shift from coal to biomass for combined heat and power, the implementation of green electricity heat pumps, and the phasing out of oil burners in the building sector. In the future, most likely by 2020, it is anticipated that a decision will be necessary between wind and bioenergy: If the policy choice focuses on a wind-based system, there will need to be a high degree of electrification to accommodate high wind energy feed-in. By contrast, the challenge in adopting a bioenergy based system lies in guar-anteeing sustainability and in securing fuel supplies should the price of imported biomass increase.
3. As an early mover, Denmark has already gained substan-tial experience in the application of tendering schemes for offshore wind energy. The Danish tendering scheme is characterised by Contracts for Difference with guar-anteed support payments, a guaranteed grid connection and a one-stop-shop authority for preliminary site as-sessments when new offshore wind energy projects are developed.
In the case of offshore wind energy, there are two proce-dures for the deployment of projects: an “open door proce-dure” and a tendering procedure. The tendering is carried out for a designated area, whereas the “open door proce-dure” invites unsolicited applications in areas not reserved for the tendering procedure. The financial support granted under the tendering scheme is paid as a Contract for Dif-ference. Both the geographical location and the specific size of the project – in megawatts – for which project devel-
Summary of Key Findings and Conclusions
1. Denmark is one of the first movers in implementing a green energy transition across all sectors, and aims to be-come independent from fossil fuels by 2050. The Danish power system has been undergoing a transformation, moving from a highly centralised to a more decentral-ised structure in electricity generation. There has been a significant increase not only in wind power but also in distributed generation from combined heat and power plants since the 1980s.
Broad-based political agreements on energy policy have provided security for investors while enabling a smooth and continuous transition to a sustainable power sector, also dur-ing changes in government. The Danish electricity system has been historically shaped by the early deployment of wind energy as well as early integration of the Nordic electric-ity markets. The renewable energy transition has involved a conversion of central and decentralised combined heat and power plants to biomass sources that is still ongoing. Most of the measures required to attain a 50 percent wind power share by 2020 are already well underway. Of particular note is the ambitious target of becoming independent from fossil fuels across all energy sectors by 2050. There were interme-diate goals of 100 percent renewables in the electricity and heat sectors by 2035 and a coal phase-out by 2030. How-ever, these timelines may be subject to change. A discussion began recently as to whether the timeframe for these inter-mediate objectives will be preserved, or whether the “imple-mentation speed” needs to be adjusted in specific areas.
2. The Danish energy transition follows an integrated ap-proach that encompasses the electricity, heat and transport sectors. The interdependencies among these different sec-tors are reflected in Danish energy policy goals, in scenario analyses as well as in concrete initiatives for implementing the transition to a renewables based energy system.
The Energy Strategy 2050, adopted in 2011, is comprehen-sive in scope, extending across all energy sectors. It was
Agora Energiewende | A Snapshot of the Danish Energy Transition
6
opers can submit their bids are determined ex ante by the Danish Energy Agency. The outcome of previous offshore wind tenders reveals large differences in the tendered price levels, ranging from approximately 7 to 14 ct/kWh. Sup-port is granted for a maximum amount of generation (e.g. 10 or 20 terawatt hours) and a limited number of years (e.g. 20 years). A striking characteristic of the Danish tendering model, rendering it attractive for investors, is that the Dan-ish Energy Agency serves as a one-stop-shop authority; its functions include granting licenses for preliminary investi-gations, licenses for establishment and licenses for electric-ity production. Technical background reports on geophysi-cal and geotechnical surveys for the preparation of bids are available to potential bidders on the Danish transmission system operator’s website, Energinet.dk. Nearshore wind farms included under the tendering scheme are subject to consumer participation schemes as stipulated by the Danish Renewable Energy Act. This means that any wind project must offer an ownership stake of at least 20 percent of the project’s total value to local citizens.
4. Denmark currently covers nearly 40 percent of its elec-tricity needs with wind power, demonstrating that a grid can be well-equipped to accommodate high renewable energy feed-in. Internal grid expansion in neighbouring countries such as Germany and Norway will play a sig-nificant role in the future utilisation of interconnectors.
In all, Denmark has 6.4 gigawatts of interconnectors to Nor-way, Sweden and Germany. These constitute an important flexibility option when it comes to integrating increasing shares of wind power. The internal Danish grid thus far has not experienced a bottleneck effect in the accommodation of green electricity. In addition to a biannually revised grid development plan, the Danish transmission system operator Energinet.dk develops the so-called System Plan that sup-plies a coherent and integrated planning approach across sectors, actors, authorities and countries. The underground-ing of new transmission lines at the 400 kV level and of existing 132/150 kV lines by 2030 is one aspect of internal Danish grid planning. Developments in neighbouring coun-tries – namely, grid expansion and the utilisation of inter-
connector capacity – affect Denmark, even more so as hours with negative wholesale electricity prices are on the rise. In 2014, West Denmark experienced 46 hours of negative prices, as compared to 15 hours in 2011. This situation may become problematic should it coincide with negative prices in Germany where there is a lot of wind power installed in the North of the country. While in the past the general Dan-ish price level was highly influenced by the level of available hydropower in Norway and Sweden (i.e. which varies from dry to wet years), now the downward pressure on prices ex-erted by wind energy during certain hours poses new chal-lenges with respect to the incentivising of investment in ad-ditional flexible generation capacity. For system balancing, particularly during times of high wind energy feed-in, the provision of regulating power by wind turbines has come to be viewed as “low-hanging fruit”, and has attracted consid-erable attention. Asymmetric bids, a split in the market into segments of availability and of activation (energy-only bids) combined with short gate closure times provide favourable conditions for the participation of wind energy producers.
Study | A Snapshot of the danish Energy transition
7
The Danish energy transition – which aims to achieve an energy system independent from fossil fuels by 2050 – has been gaining considerable attention across Europe. For the electricity sector there is an intermediate objective of a 50 percent share of wind energy by the year 2020. Al-ready in 2014, wind energy alone accounted for 39 percent of electricity consumption. Den grønne omstilling – as the Danish energy transition is called – involves a shift away from fossil fuels toward wind energy and biomass fuels in power and heat generation. Denmark constitutes a hub be-tween the Scandinavian countries with their large shares of hydropower, i.e. Norway and Sweden, and Germany, with its diverse thermal generation mix and increasing shares of renewables. Due to its geographical position, the Dan-ish electricity system is synchronised both with the Nordic and with the continental power systems.1 It might be said that Denmark virtually “bridges” the German and the Nordic electricity systems.
Many of the challenges Denmark is facing at present are similar to the ongoing policy discussions in Germany. Both countries are presently transitioning from an electricity system that uses coal as a dominant primary energy source to systems with variable renewable energy feed-in. This means that both Denmark and Germany are currently facing a multitude of challenges in common, such as:
→ The need for increased flexibility in order to accommo-date the production of renewable energy that is weather-dependent,
→ New means to secure investments in generation capacity given the decrease in electricity wholesale prices,
1 East Denmark (DK 2) has four alternating current (AC) connections to Sweden and one DC connection (Kontek) to Germany, whereas West Denmark (DK 1) is synchronised with the German system via four AC connectors and has direct current (DC) interconnections to Sweden and Norway. DK 1 and DK 2 are connected via a high voltage direct current (HVDC) link. When the NordLink cable is commissioned between Germany and Norway, there will also be a direct transmission link between these two countries in the future.
→ How to refine or recreate a market design and – in Ger-many – how to revise the design of a support scheme (adoption of tendering scheme),
→ How to maintain system reliability and security of supply, → How to enhance public acceptance – notably for grid ex-pansion and renewable deployment – and how best to ad-dress the cost issue for final consumers.
This paper explores the objectives and the implementation of the Danish energy transition by describing some of the major challenges and regulatory responses in the electricity sector. It constitutes a contribution to the “Lessons Learned from Denmark” series initiated by Agora Energiewende. The series also includes public events to which Danish, German and international stakeholders are invited to engage in dia-logue and facilitate the exchange of knowledge.
The purpose of this paper is two-fold. First, it aims at pro-viding insights based on lessons learned from the Danish experience thus far. Second, this overview of Danish policy may aid in identifying policy areas where it may be fruitful to commonly address challenges or to enhance the dialogue and exchange of knowledge between Denmark and Ger-many. Moreover, other countries may also benefit from the Danish experience. This experience may turn out to be par-ticularly useful in the years to come, as more and more en-ergy systems will begin to transition in light of the increas-ing penetration of renewable energy sources. Further, this paper may serve as an introductory overview of the Danish electricity sector and related policy.
The Danish energy transition is very comprehensive, en-compassing all energy sectors. Therefore, for the purpose of this paper, a focus had to be selected: namely, the develop-ment of Danish energy policy in general and policy devel-opments in the electricity sector in particular. This focus was inspired by questions frequently encountered in dis-cussions about the Danish energy transition: What are the objectives of Danish energy policy? How does Denmark decrease CO₂ emissions in the power sector? What is the in-
1. Introduction
Agora Energiewende | A Snapshot of the Danish Energy Transition
8
tegrated approach of the Danish energy transition all about? How has the Nordic electricity market evolved? What are the flexibility requirements for system balancing, such as the provision of regulating power by wind energy produc-ers? How does Denmark promote offshore wind power? How has the grid accommodated increasing shares of re-newables? How can consumers participate in renewable en-ergy projects?
As part of Agora Energiewende’s “Lessons Learned from Denmark” series, another report was elaborated by the Co-penhagen-based research and consulting company Ea En-ergy Analysis on behalf of Agora Energiewende. The latter describes “The Danish Experience with Integration of Vari-able Renewable Energy” (Ea, 2015),2 notably wind energy. For the interested reader, Ea (2015) details flexibility options for the integration of wind energy, including policy initia-tives undertaken in the heat sector. The report dives deep into district heating as a system integrator (combined heat and power) and measures taken and proposed to increase the flexibility of thermal power plants.
Together, this paper and Ea (2015) provide a comprehensive overview of the energy policy side (focus of this paper) and the more technical implementation side (focus of Ea, 2015).
Above all, the particular conditions specific to each country need to be taken into account in turning den grønne omstill-ing (in Denmark) and the Energiewende (in Germany) into a reality. No rigid “one size fits all” solution can be applied, nor can a single approach simply be carried over from one coun-try to another. Rather, the road to the energy transition is bound to take as many paths as there are variable factors in an ever-changing regulatory and commercial environment. In describing the Danish energy transition, the present pa-per means to highlight possible solutions alongside exam-ples of best practice that may resonate with and inspire policy debate in Germany and other countries. Finally, there is also the European dimension of integration to account for, given that both Germany and Denmark are part of the in-
2 Ea (2015). Study on behalf of Agora Energiewende. Also available on Agora Energiewende’s website.
ternal energy market and will each play a role in its further implementation. This last point will be touched upon in in-dividual sections as well.
Study | A Snapshot of the danish Energy transition
9
Section 3 begins with an overview of the objectives of the Danish energy transition for 2050, including intermediate steps. On the policy side, this includes the well-known En-ergy Strategy 2050 as well as various “Energy Agreements”, a frequently applied policy instrument in Denmark. The general energy objectives are important in order to under-stand the role of the Danish electricity sector in the overall context.
Section 4 describes the Danish electricity system as it stands today as well as scenarios for the future Danish en-ergy mix that have been developed by the Danish Energy Agency, called “Energistyrelse”. The scenarios encompass all sectors and have important implications for the future role of the electricity sector.
Section 5 introduces some major trends influencing the fu-ture development of the Danish electricity system.
Section 6 provides a brief overview of lessons learned and regulatory responses that will be treated more thoroughly in the subsequent parts of the paper (Sections 7–10). Sec-tion 7 deals with the power market. The Danish electricity sector must be understood in terms of early market integra-tion with the other Nordic countries. In order to cope with changes in the electricity system, stakeholders are work-ing to develop a new Market Model 2.0. Some “low hanging fruit” for enhancing wind integration, such as the provision of regulating power by wind generators, will also be touched upon. Section 8 then turns to the promotion of renewa-bles, focusing on supporting onshore wind energy as well as offshore wind tenders. Particular attention will be paid to the specific characteristics of offshore wind tenders in Denmark. Section 9 discusses grid expansion. This involves grid expansion internal to Denmark and the utilisation of interconnectors. So far, the grid has been able to accommo-date ever higher shares of variable renewables. Principles of grid expansion and the role of interconnectors are covered in this section. Section 10 takes a deeper look at consumer participation. Local participation schemes laid down by the
Renewable Energy Act work to promote consumer own-ership and involvement in the deployment of new wind projects. Furthermore, in this section we will explain the financing of renewables and the impact on consumers. Fi-nally, Section 11 wraps up with some concluding remarks.
At the beginning of each section, there will be a brief over-view box on major findings and lessons learned – an at-a-glance at selected topics.
2. Content of the paper

Agora Energiewende | A Snapshot of the Danish Energy Transition
10
Study | A Snapshot of the danish Energy transition
11
3.1 A fossil fuel-free energy system by 2050 – Major objectives and develop-ment of energy policy targets
Danish energy policy since the 1980s has been character-ised by energiaftaler, i.e. political agreements between the government in power and various other political parties with representation in the Danish parliament. These agree-ments have contributed substantially to the continuity in Danish energy policy. Frequently, political agreements con-stitute the basis for subsequent regulations and policy ini-tiatives in the energy sector. Furthermore, over time various governments have stipulated additional energy objectives. This combination of long-term objectives with short-term goals and concrete initiatives has helped shape a flexible strategy while ensuring stability, even during changing mi-nority governments.
An important milestone in Denmark’s energy transition was the adoption of the Energy Strategy 20503 in February 2011. This comprehensive energy strategy was the first of its kind both in Denmark and worldwide. It set forth a num-ber of concrete initiatives for the achievement of complete independence from fossil fuels across all energy sectors. At the time, a Venstre-Conservative government was in place, with Lars Løkke Rasmussen as Prime Minister and Lykke Friis as Climate and Energy Minister (both from Denmark’s Liberal Party, Venstre). The Energy Strategy 2050 will be briefly described in Section 3.2.1.
In early October 2011, a new coalition government was formed by the Social Democrats (Socialdemokratiet), the Danish Social Liberal Party (Radikale Venstre) and the So-cialist People’s Party (Socialistisk Folkeparti). Helle Thorn-ing-Schmidt (Socialdemokratiet) became Prime Minister, and Martin Lidegaard (Radikale Venstre) was appointed as the new Climate, Energy and Building Minister. After taking
3 Danish Government (2011).
Major findings and lessons learned:
→ It is Denmark’s objective to become independent from fossil fuels by 2050; the aim is to produce renewable energy sufficient to cover total Danish energy consumption.
→ The Danish energy strategy encompasses all sectors (electricity, heat and transport). It is characterised by a high degree of flexibility. Different paths of development and interdependencies across sectors are accounted for in these overall objectives. Short-term targets will pave the road for the achievement of long-term objectives. Another crucial pillar in the Danish energy transition is increasing energy efficiency.
→ Energy Agreements, backed by broad political support, have served as an instrument that has provided stability and continuity of Danish energy policy, even and especially in times of changing minority governments.
→ Most measures relating to the 2020 objectives, as stipulated by the Energy Agreement 2012 – an Agreement concluded across party lines – are already underway. The previous government had laid out intermediate targets that included 100 percent renewables in electricity and heat by 2035 and a coal phase-out by 2030. A big question for the future has to do with these intermediate milestones and targets for the years after 2020 and before 2050, notably for the period 2020–35.
3. Danish energy strategy: Objectives of the Danish energy transition
Agora Energiewende | A Snapshot of the Danish Energy Transition
12
second term. Lars Christian Lilleholt became the new En-ergy, Utilities and Climate Minister. According to a declara-tion (Regeringsgrundlaget, 2015) issued by the newly elected government, the long-term goal of the government is that Denmark be independent of fossil fuels by 2050; therefore there needs to be sufficient renewable energy production to cover total Danish energy consumption. The new govern-ment plans to establish a “broad” Energy Commission with extensive scope. One of this commission’s key tasks will be to draft a proposal for energy policy goals and measures for the period 2020 to 2030, demonstrating the energy sec-tor’s contributions to Denmark’s international climate com-mitments in a cost-efficient, market-based way.5 During the recent election campaign, some of the questions raised by the “blue block” (conservative and liberal parties that at the time of campaigning were still in opposition) revealed a stronger orientation toward the market, thus indicating a possible downward adjustment of the “implementation speed” of the green transition.6
Most measures for the achievement of the 2020-targets are already well underway. Based on recent deployment rates, the Danish transmission system operator (TSO) Energi-net.dk anticipates that wind energy generation will in-crease from 13.1 terawatt hours (TWh) in 2014 to 23.3 TWh in 2024, accounting then for 61 percent of total electricity consumption.7
The Energy Strategy 2050 and the Energy Agreement 2012 will be explained in more detail below. It is important to keep in mind that even within the next months some policy changes may yet take place. Technically speaking, the ob-jectives adopted by the 2011 government have not been taken over by the newly elected government. Since the ob-jectives laid out in Regeringsgrundlag (2011) – such as the above mentioned 2030 and 2035 targets – have not been adopted by law, they are technically speaking, not any more binding. By contrast, the Energy Agreement 2012, which contains some provisions not tied to specific percentage
5 Regeringsgrundlaget (2015) and Wittrup (2015c).
6 Cf. Wittrup (2015d).
7 Energinet.dk (2015e).
office in October 2011, the new government adopted a num-ber of cross-sectoral energy policy targets.4 These targets represented an ambitious continuation of the Energy Strat-egy 2050 put forth by the previous government. The cross-sectoral objectives included, among others:
→ 100 percent renewable energy sources by 2050 (across all energy sectors),
→ 100 percent renewables in electricity and heat supply by 2035,
•with50percentofclassicalelectricityconsumptionbased on wind energy by 2020,
→ A coal phase-out in power stations and oil burners by 2030,
→ Reduction of greenhouse gas emissions by 40 percent by 2020 (as compared with 1990 levels).
Following up on these targets, in March 2012 the Social democratic government concluded a new Energy Agreement (Energiaftale 2012) with broad political support from the other parties in parliament. This Energy Agreement 2012 contains milestones for the short- and medium-term as late as 2020. The agreement lays out concrete energy policy initiatives for the achievement of these goals. The Agree-ment and these initiatives will be further explained in Sec-tion 3.2.2.
At the start of February 2014, the Helle Thorning-Schmidt government took new shape after the Socialistisk Folkeparti left the initial three-party government. The change in gov-ernment meant that ministerial positions were taken over by the two remaining parties, the Social Democrats and Radikale Venstre. Rasmus Helveg Petersen (also from Radi-kale Venstre, as was his predecessor) was then appointed Climate, Energy and Building Minister.
In mid-June 2015 new parliamentary elections took place. As of the end of June, the liberal party Venstre forms the new government. Notably, the new government is a minor-ity government consisting of only one party: Venstre. Lars Løkke Rasmussen is the current Prime Minister, now in his
4 Regeringsgrundlaget (2011), p. 28, and Vores Energi (2011), p. 2.
Study | A Snapshot of the danish Energy transition
13
applies to all sectors. The Danish energy strategy takes a cross-sector approach that is comprised of two main pillars:
→ Green energy in the electricity, heat and transport sectors; → Energy efficiency measures.
The realisation of a system based on renewable energy sources necessitates an increase in energy efficiency so as to minimise energy consumption across all sectors. Energy efficiency measures comprise efficiency obligations im-posed on energy companies as well as other requirements applied to the business and buildings sectors.
targets on renewable energy as well as initiatives, has not been repealed by the present government. Hence, projec-tions based upon the measures contained in the Agreement remain pertinent.8910
3.2 Two pillars of the green energy transition: Renewable energy and energy efficiency
Denmark is striving for complete independence from fossil fuels, i.e. from coal, oil and gas, by the year 2050. The ambi-tious 2050 target for an entirely renewable energy system
8 Partially based on: http://www.kebmin.dk/sites/keb-min.dk/files/klima-energi-bygningspolitik/dansk-kli-ma-energi-bygningspolitik/energiaftale/Faktaark%202%20energi%20og%20klimapolitiske%20mal.pdf
9 Energiaftale (2008).
10 Energiaftale (Energy Agreement) of 2012.
Own elaboration 8
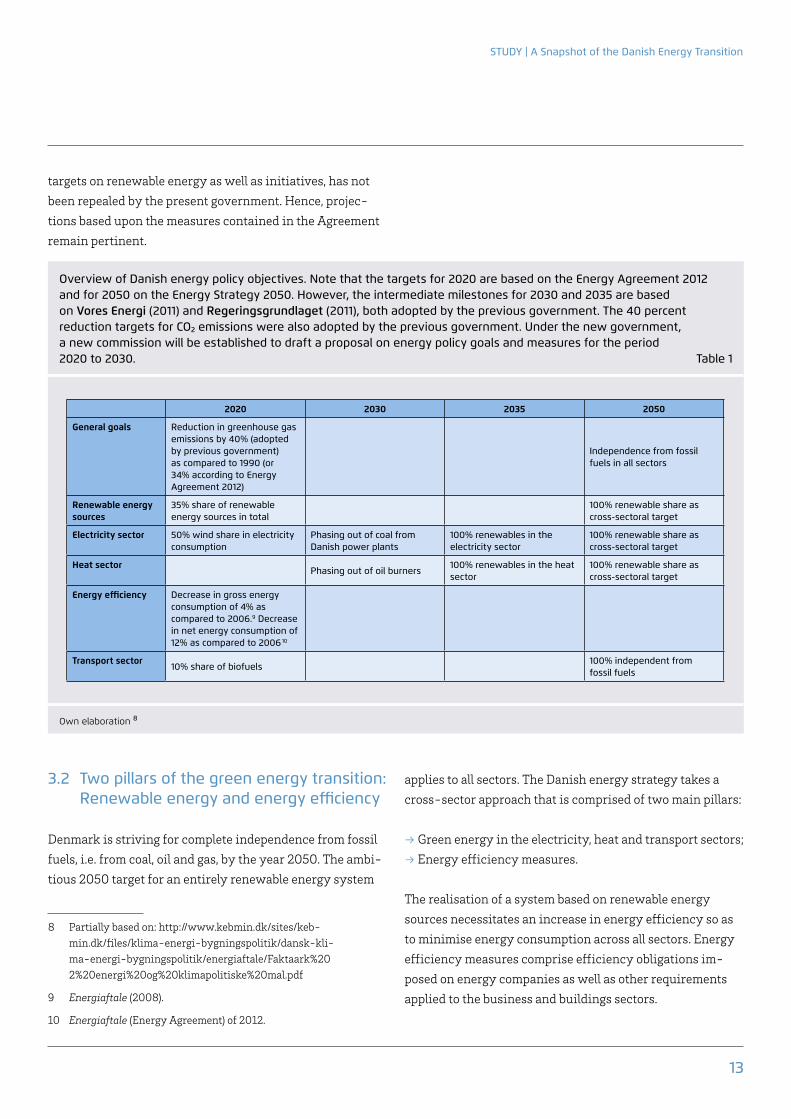
Overview of Danish energy policy objectives. Note that the targets for 2020 are based on the Energy Agreement 2012 and for 2050 on the Energy Strategy 2050. However, the intermediate milestones for 2030 and 2035 are based on Vores Energi (2011) and Regeringsgrundlaget (2011), both adopted by the previous government. The 40 percent reduction targets for CO₂ emissions were also adopted by the previous government. Under the new government, a new commission will be established to draft a proposal on energy policy goals and measures for the period 2020 to 2030. Table 1
2020 2030 2035 2050
General goals Reduction in greenhouse gas emissions by 40% (adopted by previous government) as compared to 1990 (or 34% according to Energy Agreement 2012)
Independence from fossil fuels in all sectors
Renewable energy sources
35% share of renewable energy sources in total
100% renewable share as cross-sectoral target
Electricity sector 50% wind share in electricity consumption
Phasing out of coal from Danish power plants
100% renewables in the electricity sector
100% renewable share as cross-sectoral target
Heat sectorPhasing out of oil burners
100% renewables in the heat sector
100% renewable share as cross-sectoral target
Energy efficiency Decrease in gross energy consumption of 4% as compared to 2006.9 Decrease in net energy consumption of 12% as compared to 2006 10
transport sector10% share of biofuels
100% independent from fossil fuels

Agora Energiewende | A Snapshot of the Danish Energy Transition
14
parts of the transport sector), more district heating and in-dividual renewable-based heating, as well as increased electricity interconnection and a more intelligent electricity system. The role that each of these building blocks will come to play in the energy system of the future depends on devel-opments in technology (e.g. electric vehicles, cost reductions in solar photovoltaic (PV) and carbon capture and storage (CCS)), relative prices of energy and greenhouse gas emis-sions, and economic growth. The flexibility of the strategy allows for its adaptation along the way to its realisation.
3.2.2 the Energy Agreement 2012: Intermediate milestones for 2020
The Energy Agreement 2012 (Energiaftale 2012) followed up on the ambitious targets set forth by the Social Democratic-Radikale Venstre-Socialistisk Folkeparti coalition govern-ment that was formed in autumn 2011. The agreement was concluded with broad support from the other liberal and conservative parties (blue block) in parliament.
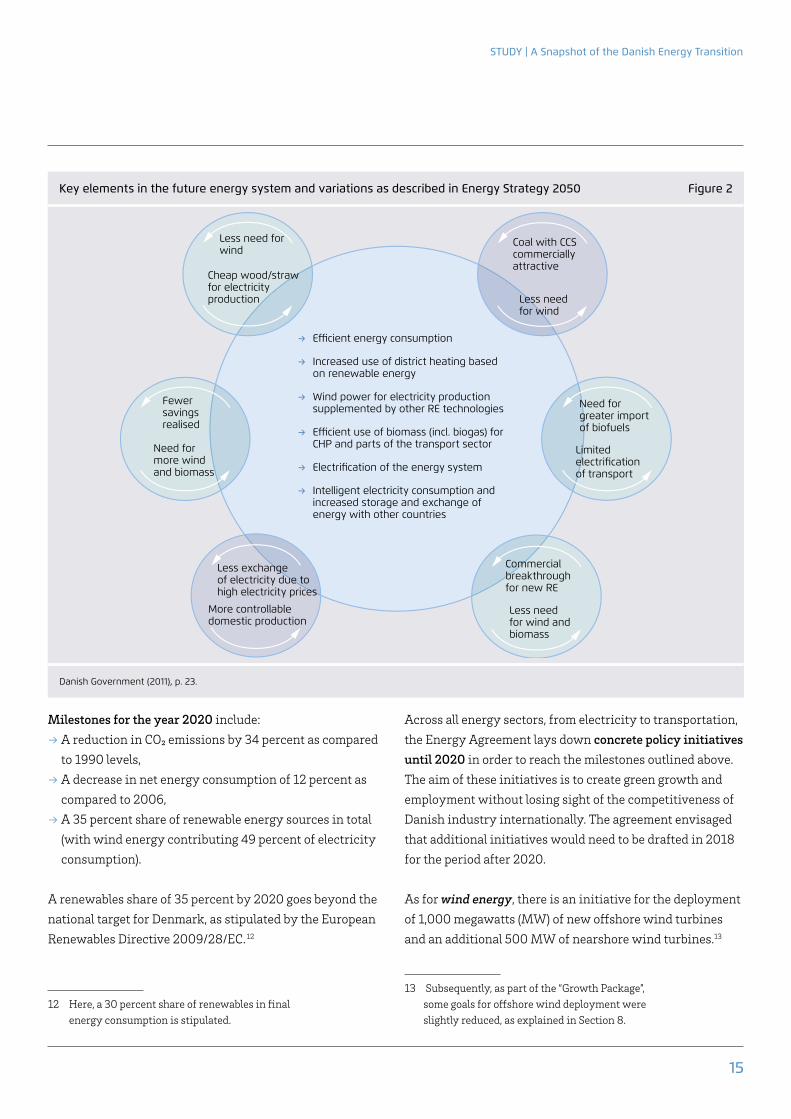
3.2.1 the Energy Strategy 2050At this point, it is impossible to say what exactly the optimal energy system will look like in 2050. The Energy Strategy 205011 accounts for this unknown. The strategy has a de-gree of built-in flexibility that includes possible variations across sectors. Figure 2 illustrates how different trends may influence one another. For example, if less energy savings are realised, there will be increased demand for wind and biomass in the electricity and heat sectors. If cheap wood and straw are available for electricity production, there is lower demand for electricity generation based on wind en-ergy.
The cross-sector approach of the Energy Strategy 2050 is reflected in the different elements that are considered cru-cial to a flexible strategy for a cost-efficient green transi-tion: efficiency and electrification of energy consumption, wind and renewables deployment, efficient application of biomass (such as biogas, for combined heat and power and
11 Danish Government (2011).
[PJ /
year
]
Effi ciency improvements
Illustrative: The two pillars of the Danish energy transition: energy effi ciency and increasing renewable energy (RE) according to Energy Strategy 2050. Figure 1
Danish Government (2011), p. 17.
Households
Waste
Trade and service
Production
Transport
Energy consumption 2009 Renewable energy consumption 2009
RE(possibly also CCS)
Other REBiogas
WoodStraw
Wind
400
800
Study | A Snapshot of the danish Energy transition
15
Across all energy sectors, from electricity to transportation, the Energy Agreement lays down concrete policy initiatives until 2020 in order to reach the milestones outlined above. The aim of these initiatives is to create green growth and employment without losing sight of the competitiveness of Danish industry internationally. The agreement envisaged that additional initiatives would need to be drafted in 2018 for the period after 2020.
As for wind energy, there is an initiative for the deployment of 1,000 megawatts (MW) of new offshore wind turbines and an additional 500 MW of nearshore wind turbines.13
13 Subsequently, as part of the “Growth Package”, some goals for offshore wind deployment were slightly reduced, as explained in Section 8.
Milestones for the year 2020 include: → A reduction in CO₂ emissions by 34 percent as compared to 1990 levels,
→ A decrease in net energy consumption of 12 percent as compared to 2006,
→ A 35 percent share of renewable energy sources in total (with wind energy contributing 49 percent of electricity consumption).
A renewables share of 35 percent by 2020 goes beyond the national target for Denmark, as stipulated by the European Renewables Directive 2009/28/EC.12
12 Here, a 30 percent share of renewables in final energy consumption is stipulated.
Key elements in the future energy system and variations as described in Energy Strategy 2050 Figure 2
Danish Government (2011), p. 23.
→ Effi cient energy consumption
→ Increased use of district heating based on renewable energy
→ Wind power for electricity production supplemented by other RE technologies
→ Effi cient use of biomass (incl. biogas) for CHP and parts of the transport sector
→ Electrifi cation of the energy system
→ Intelligent electricity consumption and increased storage and exchange of energy with other countries
Less need for wind
Fewer savings realised
Need for more wind and biomass
Commercial breakthrough for new RE
Need for greater import of biofuels
Less need for wind
Coal with CCS commercially attractive
Limited electrifi cation of transport
Less need for wind and biomass
Cheap wood/straw for electricity production
Less exchange of electricity due to high electricity prices
More controllable domestic production

Agora Energiewende | A Snapshot of the Danish Energy Transition
16
the buildings sector, no more oil burners and natural gas furnaces may be installed in new buildings as of 2013. As of 2016, it will no longer be possible to install oil burners in existing buildings in areas where district heating or natural gas exist as alternatives. Finally, a goal of a 10 percent share of biofuels in the transport sector by 2020 is stipulated as one key step in the conversion of this sector from fossil fuels to, for instance, electricity and biomass.1415
14 Cf. Ingeniøren (2014a).
15 Wittrup, S. (2015e).
Furthermore, replacing old onshore wind turbines with new higher-capacity ones (turbines with a total capacity of 1,800 MW) will increase wind-based electricity generation in spite of the decommissioning of older turbines. These ini-tiatives shall contribute to the goal of supplying 50 percent of electricity consumption with wind energy by 2020.
Along with more flexible demand and increased reliance on interconnections, an intelligent energy system will also be necessary in order to accommodate a high share of wind energy and to supply electricity during peak hours. Concrete initiatives are in place for an overall strategy for a smart grid and for the implementation of a smart meter roll-out.
There are also various initiatives in place that aim at facili-tating the conversion to green heating, such as measures to incentivise the shift from coal to biomass for large, cen-tral combined heat and power (CHP) stations and/or green electricity heat pumps. In order to phase out oil burners in
Info Box: Coal Phase-Out
→ The previous government adopted the objective to phase out the use of coal in Danish power stations by the year 2030. Now, under the new 2015 government, an Energy Commission will be established to examine and elaborate new proposals on policy objectives and measures for the period 2020–30. The possibility of reducing the “implementation speed” of the energy transition was discussed by some parties in the course of the election campaign. The coming months will determine which direction the future development of intermediate policy goals will take.
→ Within the coming decades, a portion of the conventional power plant fleet will reach the end of its lifetime. Instead of replacing these with new fossil fuel-based power plants, old capacity will be replaced by new production units based on renewable energy sources.
→ For the envisaged coal phase-out, combined heat and power stations will need to convert their power production from coal and natural gas to biomass by 2030. Existing power stations and infrastructure can be used when implementing the shift in fuel source. Biomass used for combustion in Danish CHP plants predominantly stems from wood pellets, wood chips and wheat straw (as well as waste).
→ In October 2014, the question was raised whether the Danish coal phase-out could be implemented as early as 2025.14 However, the discussion currently centres on maintaining the 2030 target or not.
→ At the end of June 2015, the Swedish power company Vattenfall sold its last coal-fired combined heat and power station in Denmark, Nordjyllandsværket. It was bought by the local district heating company Aalborg Forsyning, who intends to advance a strategy for its conversion to green energy supply. Previously, Vattenfall also sold two other power stations in Denmark, Amagerværket and Fynsværket.15

Study | A Snapshot of the danish Energy transition
17
The Danish electricity sector is characterised by a partially centralised, partially distributed generation structure, and contains approximately 6,000 electricity production units. These can be grouped into four major categories:19
→ Central power stations: Located at 16 production sites, with generation based on coal, natural gas, oil and bio-mass.
→ Decentralised power stations: Around 1,000 decentral-ised CHP, industrial and local plants, with generation based on natural gas, waste, biogas and biomass.
→ Wind turbines: 5,200 wind turbines. → Solar PV: 92,000 PV installations.
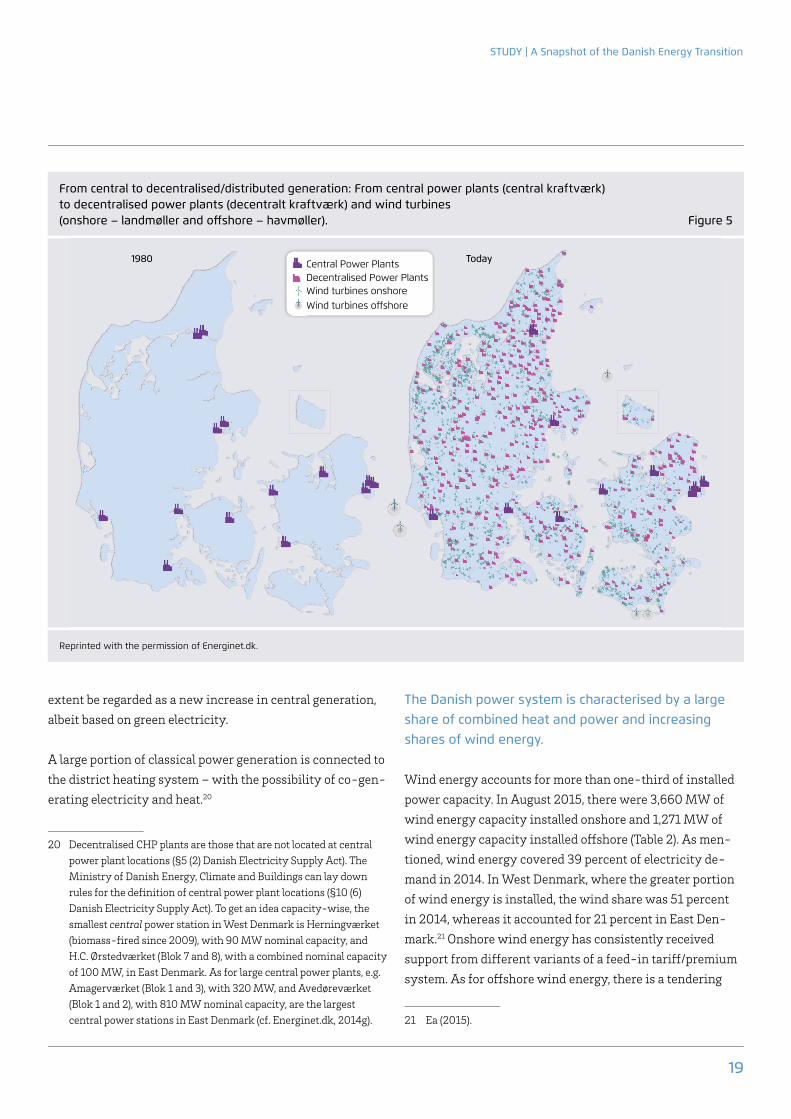
In 1980, the Danish electricity mix was dominated by large-scale, central thermal power plants (Figure 5). Over the years, there has been increased deployment of decentralised combined heat and power plants as well as wind turbines, leading to a more distributed generation structure. The in-stallation of large-scale offshore wind farms can to some
19 ENS (2014a).
4.1 The Danish electricity system today
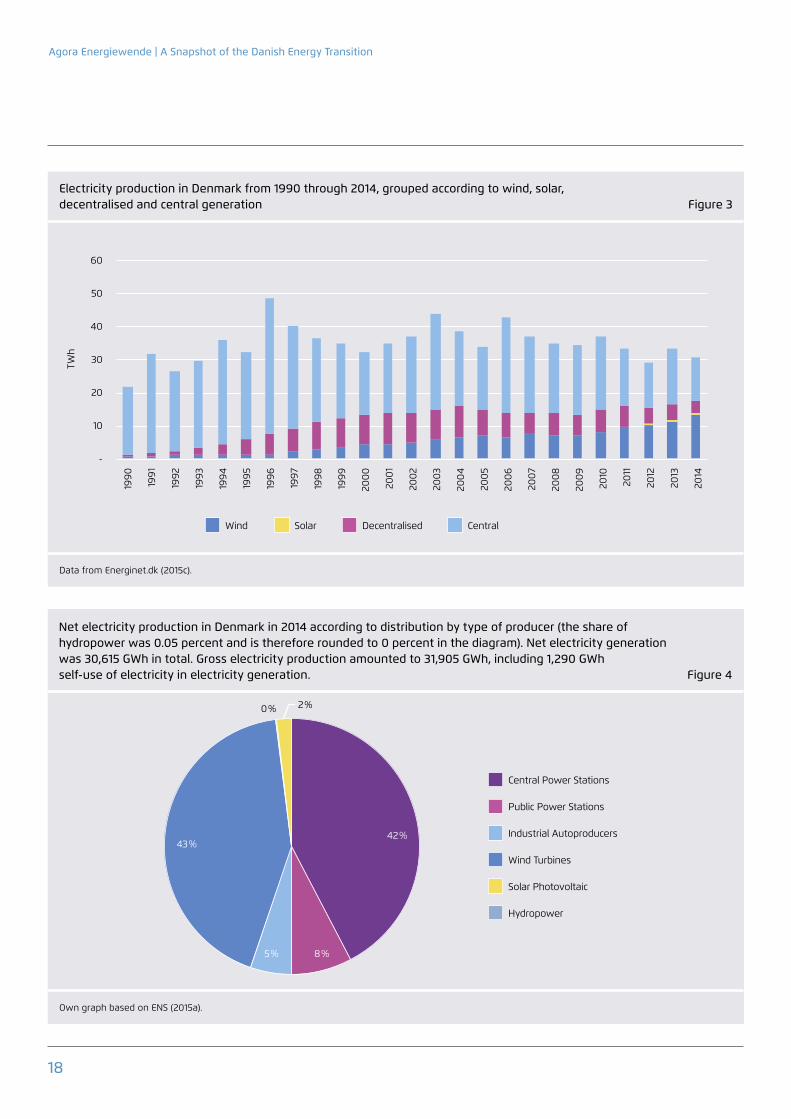
In the Danish power sector there are approximately 13.6 gi-gawatts (GW) of installed total generation capacity.16 Peak demand is equal to approximately 6 GW. In 2014, net elec-tricity production amounted to 30,615 gigawatt hours (GWh); Denmark was a net importer from neighbouring countries. Net imports amounted to 2,855 GWh.17 The high share of electricity covered by wind in Denmark has gar-nered a great deal of attention, both in the media and among the scientific community. In 2014, wind energy set a new record by supplying 39.1 percent of Danish electricity de-mand.18 These statistics notwithstanding, the bulk of power generation is still based on combined heat and power (CHP). Danish CHP units include central power stations as well as decentralised power stations and auto- producers.
16 ENS (2014e).
17 ENS (2015a).
18 KEBMIN (2015).
Major findings and lessons learned:
→ Combined heat and power (CHP) and wind energy play a major role in Danish electricity production. The Danish power sector is characterised by dispersed generation and several central power plants.
→ Wind energy supplied 39 percent of Danish electricity demand in 2014. The major fuel used by Danish power stations is still coal. However, the coal share is decreasing due to the conversion of coal-fired power stations to biomass and natural gas.
→ Wind energy and biomass are expected to play a major role in future electricity supply.
→ Shortly after 2020, scenario projections indicate that the Danish energy system will reach a crossroads with respect to the future development of wind energy and bioenergy. The challenge posed by a future wind-based system lies in its capacity to provide a reliable supply of electricity. The challenge posed by a future bioenergy-based system lies in its capacity to ensure sustainability and a secure fuel supply in the event that imported biomass becomes increasingly expensive.
4. The Danish electricity system: Current state and future scenarios
Agora Energiewende | A Snapshot of the Danish Energy Transition
18
TWh
Electricity production in Denmark from 1990 through 2014, grouped according to wind, solar, decentralised and central generation Figure 3
Data from Energinet.dk (2015c).
60
50
40
30
20
10
-
1990
1991
1992
1996
1995
1994
1993
2007
200
6
200
5
200
4
2003
2002
200
1
200
0
1999
1998
1997
2013
2012
2011
2010
200
9
200
8
2014
Wind Solar Decentralised Central
Net electricity production in Denmark in 2014 according to distribution by type of producer (the share of hydropower was 0.05 percent and is therefore rounded to 0 percent in the diagram). Net electricity generation was 30,615 GWh in total. Gross electricity production amounted to 31,905 GWh, including 1,290 GWh self-use of electricity in electricity generation. Figure 4
Own graph based on ENS (2015a).
Central Power Stations
Public Power Stations
Industrial Autoproducers
Wind Turbines
Solar Photovoltaic
Hydropower
42 %
8 %5 %
43 %
2 %0 %
STUDY | A Snapshot of the Danish Energy Transition
19
extent be regarded as a new increase in central generation, albeit based on green electricity.
A large portion of classical power generation is connected to the district heating system – with the possibility of co-gen-erating electricity and heat.20
20 Decentralised CHP plants are those that are not located at central power plant locations (§5 (2) Danish Electricity Supply Act). The Ministry of Danish Energy, Climate and Buildings can lay down rules for the defi nition of central power plant locations (§10 (6) Danish Electricity Supply Act). To get an idea capacity-wise, the smallest central power station in West Denmark is Herningværket (biomass-fi red since 2009), with 90 MW nominal capacity, and H.C. Ørstedværket (Blok 7 and 8), with a combined nominal capacity of 100 MW, in East Denmark. As for large central power plants, e.g. Amagerværket (Blok 1 and 3), with 320 MW, and Avedøreværket (Blok 1 and 2), with 810 MW nominal capacity, are the largest central power stations in East Denmark (cf. Energinet.dk, 2014g).
The Danish power system is characterised by a large share of combined heat and power and increasing shares of wind energy.
Wind energy accounts for more than one-third of installed power capacity. In August 2015, there were 3,660 MW of wind energy capacity installed onshore and 1,271 MW of wind energy capacity installed off shore (Table 2). As men-tioned, wind energy covered 39 percent of electricity de-mand in 2014. In West Denmark, where the greater portion of wind energy is installed, the wind share was 51 percent in 2014, whereas it accounted for 21 percent in East Den-mark.21 Onshore wind energy has consistently received support from diff erent variants of a feed-in tariff /premium system. As for off shore wind energy, there is a tendering
21 Ea (2015).
From central to decentralised/distributed generation: From central power plants (central kraftværk) to decentralised power plants (decentralt kraftværk) and wind turbines (onshore – landmøller and off shore – havmøller). Figure 5
Reprinted with the permission of Energinet.dk.
Central Power Plants Decentralised Power Plants Wind turbines onshore Wind turbines off shore
Today1980
Agora Energiewende | A Snapshot of the Danish Energy Transition
20
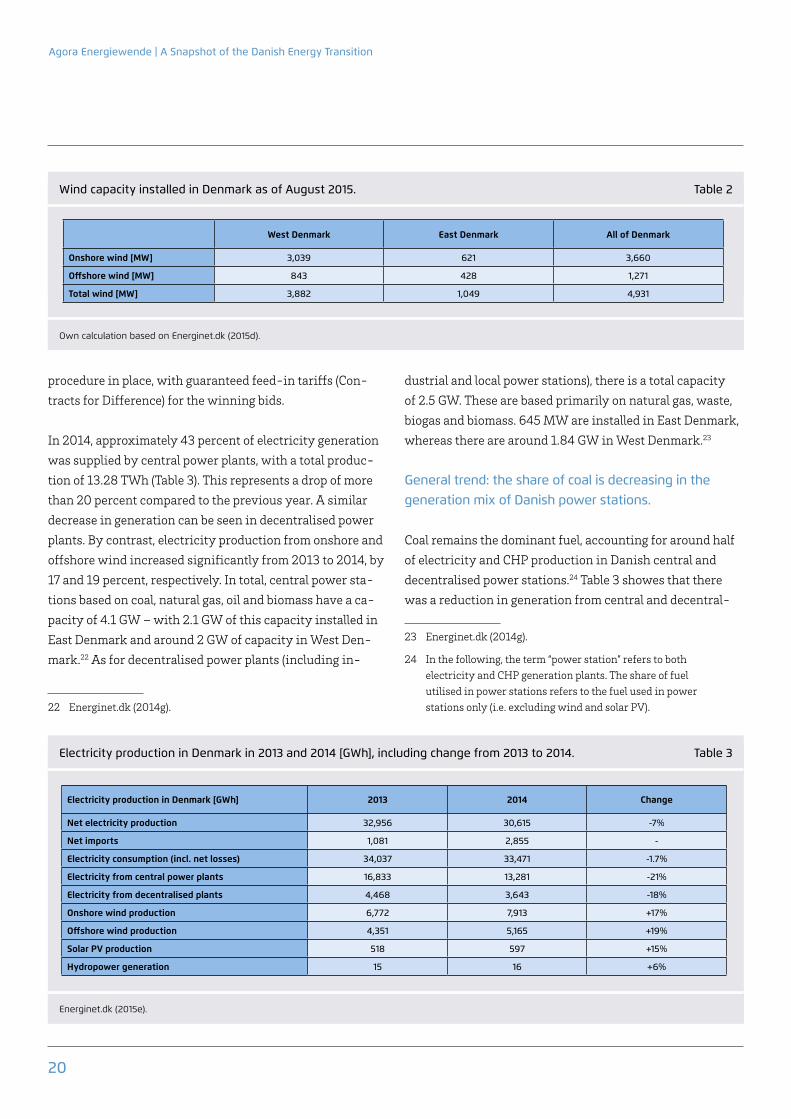
dustrial and local power stations), there is a total capacity of 2.5 GW. These are based primarily on natural gas, waste, biogas and biomass. 645 MW are installed in East Denmark, whereas there are around 1.84 GW in West Denmark.23
General trend: the share of coal is decreasing in the generation mix of Danish power stations.
Coal remains the dominant fuel, accounting for around half of electricity and CHP production in Danish central and decentralised power stations.24 Table 3 showes that there was a reduction in generation from central and decentral-
23 Energinet.dk (2014g).
24 In the following, the term “power station” refers to both electricity and CHP generation plants. The share of fuel utilised in power stations refers to the fuel used in power stations only (i.e. excluding wind and solar PV).
procedure in place, with guaranteed feed-in tariffs (Con-tracts for Difference) for the winning bids.
In 2014, approximately 43 percent of electricity generation was supplied by central power plants, with a total produc-tion of 13.28 TWh (Table 3). This represents a drop of more than 20 percent compared to the previous year. A similar decrease in generation can be seen in decentralised power plants. By contrast, electricity production from onshore and offshore wind increased significantly from 2013 to 2014, by 17 and 19 percent, respectively. In total, central power sta-tions based on coal, natural gas, oil and biomass have a ca-pacity of 4.1 GW – with 2.1 GW of this capacity installed in East Denmark and around 2 GW of capacity in West Den-mark.22 As for decentralised power plants (including in-
22 Energinet.dk (2014g).
Own calculation based on Energinet.dk (2015d).
Wind capacity installed in Denmark as of August 2015. Table 2
West denmark East denmark All of denmark
Onshore wind [MW] 3,039 621 3,660
Offshore wind [MW] 843 428 1,271
total wind [MW] 3,882 1,049 4,931
Energinet.dk (2015e).
Electricity production in Denmark in 2013 and 2014 [GWh], including change from 2013 to 2014. Table 3
Electricity production in denmark [GWh] 2013 2014 Change
Net electricity production 32,956 30,615 -7%
Net imports 1,081 2,855 -
Electricity consumption (incl. net losses) 34,037 33,471 -1.7%
Electricity from central power plants 16,833 13,281 -21%
Electricity from decentralised plants 4,468 3,643 -18%
Onshore wind production 6,772 7,913 +17%
Offshore wind production 4,351 5,165 +19%
Solar PV production 518 597 +15%
Hydropower generation 15 16 +6%
Study | A Snapshot of the danish Energy transition
21
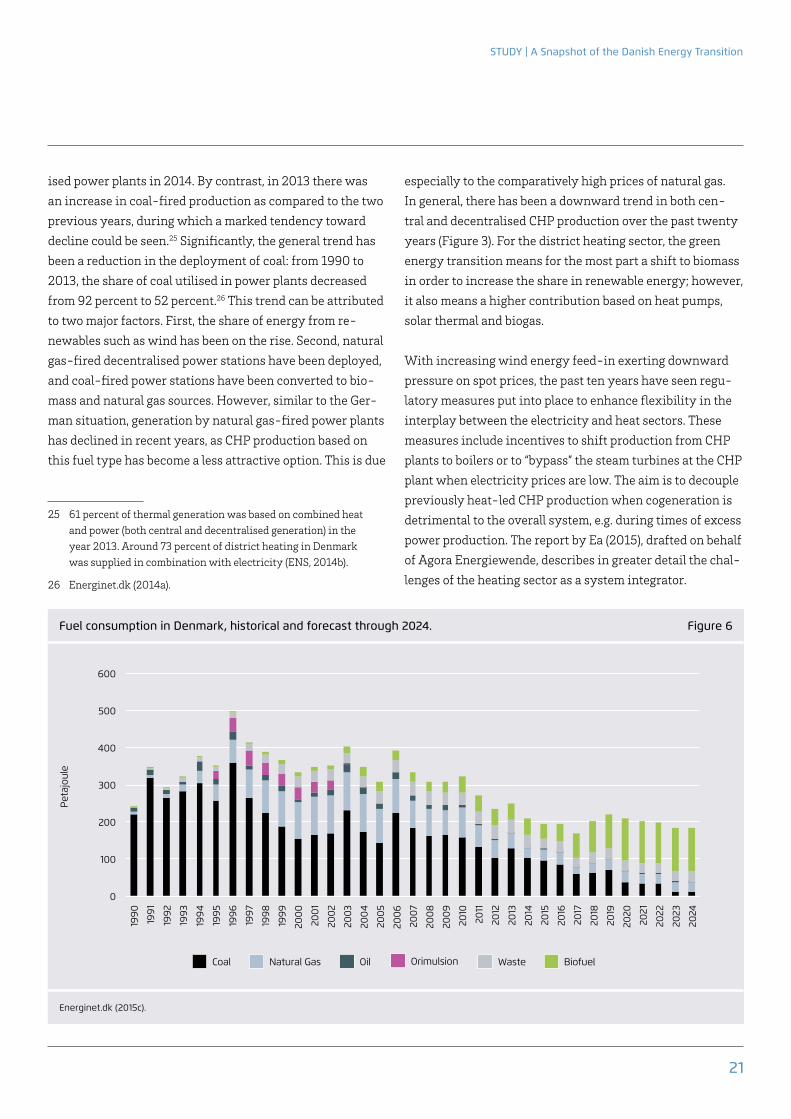
especially to the comparatively high prices of natural gas. In general, there has been a downward trend in both cen-tral and decentralised CHP production over the past twenty years (Figure 3). For the district heating sector, the green energy transition means for the most part a shift to biomass in order to increase the share in renewable energy; however, it also means a higher contribution based on heat pumps, solar thermal and biogas.
With increasing wind energy feed-in exerting downward pressure on spot prices, the past ten years have seen regu-latory measures put into place to enhance flexibility in the interplay between the electricity and heat sectors. These measures include incentives to shift production from CHP plants to boilers or to “bypass” the steam turbines at the CHP plant when electricity prices are low. The aim is to decouple previously heat-led CHP production when cogeneration is detrimental to the overall system, e.g. during times of excess power production. The report by Ea (2015), drafted on behalf of Agora Energiewende, describes in greater detail the chal-lenges of the heating sector as a system integrator.
ised power plants in 2014. By contrast, in 2013 there was an increase in coal-fired production as compared to the two previous years, during which a marked tendency toward decline could be seen.25 Significantly, the general trend has been a reduction in the deployment of coal: from 1990 to 2013, the share of coal utilised in power plants decreased from 92 percent to 52 percent.26 This trend can be attributed to two major factors. First, the share of energy from re-newables such as wind has been on the rise. Second, natural gas-fired decentralised power stations have been deployed, and coal-fired power stations have been converted to bio-mass and natural gas sources. However, similar to the Ger-man situation, generation by natural gas-fired power plants has declined in recent years, as CHP production based on this fuel type has become a less attractive option. This is due
25 61 percent of thermal generation was based on combined heat and power (both central and decentralised generation) in the year 2013. Around 73 percent of district heating in Denmark was supplied in combination with electricity (ENS, 2014b).
26 Energinet.dk (2014a).
Peta
joul
e
Fuel consumption in Denmark, historical and forecast through 2024. Figure 6
Energinet.dk (2015c).
Coal Natural Gas Orimulsion WasteOil Biofuel
1990
1991
1992
1996
1995
1994
1993
1999
1998
1997
2013
2012
2014
2015
2016
2017
2018
2019
2020
2021
2022
2023
2024
200
0
200
1
2002
2003
200
4
200
5
200
6
2007
200
8
200
9
2011
2010
600
500
400
300
200
100
0

Agora Energiewende | A Snapshot of the Danish Energy Transition
22
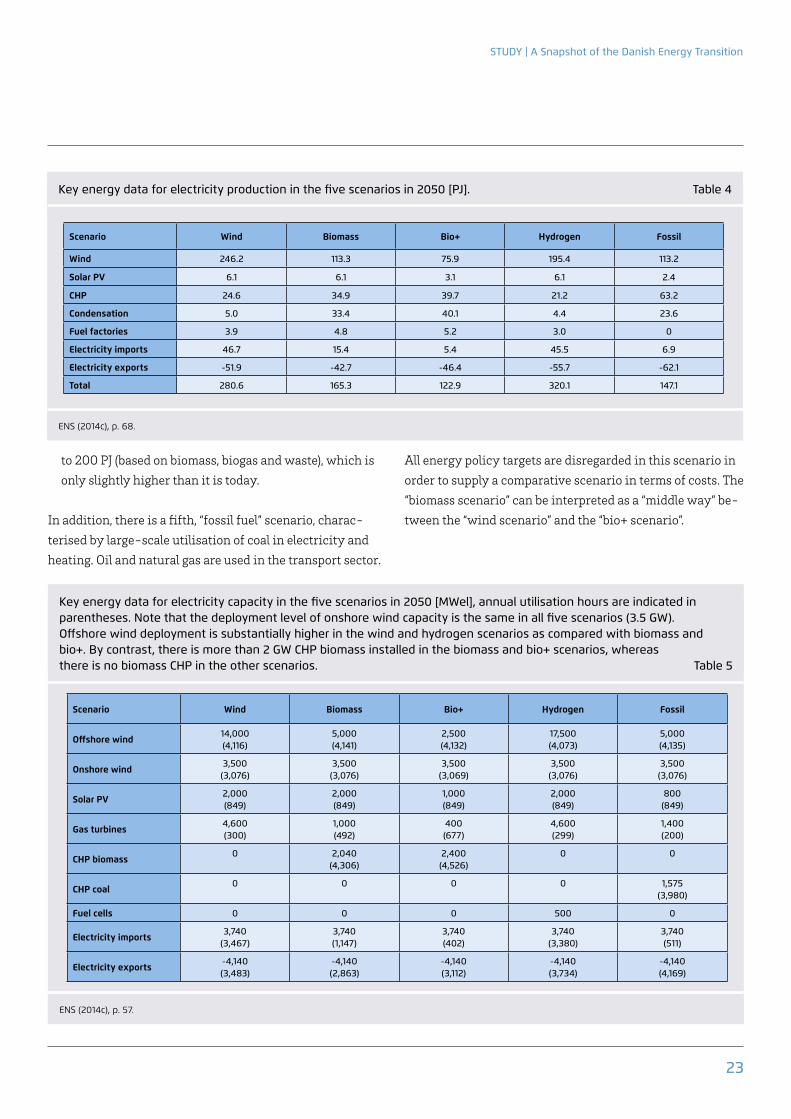
four different scenarios for the future. All of them are in keeping with the vision of becoming fossil-free by 2050 and adhere to the objective of obtaining 100 percent of elec-tricity and heat from renewables by 2035.31 The scenarios account for all sectors of the Danish energy system, includ-ing transportation. Each scenario is modelled in a techni-cally consistent way. The scenarios are not meant to serve as detailed projections of the future; rather, they are designed to illuminate existing challenges as well as the parameters that will be critical in choosing among the different paths toward a green energy future.
The following four scenarios outline options for the deploy-ment of wind and biomass as well as the implications of these options across all energy sectors:
→ “Wind scenario”: primarily wind, solar PV and CHP de-ployment, including massive electrification of the heat and transport sectors. Bioenergy is limited to 250 peta-joule (PJ) so that it can be supplied domestically.
→ “Biomass scenario”: electricity and district heating are based on CHP, with less wind deployment than in the wind scenario. Bioenergy consumption amounts to around 450 PJ, accounting for waste and potential con-version losses that could result from imports from abroad. Inherently, there is less electrification than in the “wind scenario”. Transport is based on biofuels.
→ “Bio+ scenario”: a “traditional” scenario in which coal, oil and natural gas are replaced by bioenergy (bioenergy consumption of around 700 PJ). Wind energy remains at the 2020 level, according to which it would supply 50 percent of electricity. Heat is based on biomass and electricity via heat pumps where feasible.
→ “Hydrogen scenario”: this scenario entails hydrogen production and even higher wind deployment than in the “wind scenario”. Bioenergy consumption is limited
31 The time frame of the scenarios is the year 2050, with intermedi-ate time steps in 2020 and 2035. Based on a model with hourly time resolution, necessary capacities and the annual use of fuels are calibrated. The model also includes costs accruing to the green energy transition, i.e. the sum of annualised investment cost, operational cost and fuel cost. Note that some of the intermediate policy goals might be subject to change in the future (Section 3).
In addition to wind energy, biomass is expected to play a major role in the green energy transition. This can be attributed primarily to the increasing use of biomass in CHP plants.
The advantage that biomass brings to a wind-dominated system is its ability, as a controllable generation source of renewable energy, to provide positive regulating power and ancillary services. The Biomass Agreement of 1993 was a policy milestone in the promotion of biomass. It was backed by a large majority in the Danish parliament. The agreement stipulated a clear objective for cogeneration plants: by 2000, these plants were to be using, on an annual basis, 1.4 mil-lion tons of straw and chips (wood biomass) for electricity and district heat production. This stimulated the utilisation of biomass both in central CHP plants as well as in decen-tralised CHP units. In 2013, biomass was being deployed in nine central CHP plants, i.e. in more than half of the central power stations, 17 decentralised CHP units were using bio-mass as their primary fuel source and, in 14 CHP plants, bio-mass contributed with lower shares as a fuel to waste power plants.27 By 2023, an increase in biofuels (biomass and bi-ogas) is expected to provide up to 54 percent of total elec-tricity and CHP production28 in Danish power stations.29
4.2 The Future Danish energy mix – Possible paths for wind and biomass
The Danish energy transition strives to implement a coher-ent approach across sectors. Interdependencies between sectors must be leveraged if the 2050 objective of becoming independent from fossil fuels is to be fulfilled. In its report “Energiscenarier frem mod 2020, 2035 og 2050”,30 the Dan-ish Energy Agency outlined a range of technical possibili-ties, under a variety of different assumptions, for the con-struction of the future energy system. The report describes
27 Energinet.dk (2014b).
28 Energinet.dk (2014a).
29 For more detailed information on the general application of biomass in Denmark, a comprehensive overview on the Danish experience with biomass is provided e.g. by Gregg et al. (2014).
30 ENS (2014c).
Study | A Snapshot of the danish Energy transition
23
All energy policy targets are disregarded in this scenario in order to supply a comparative scenario in terms of costs. The “biomass scenario” can be interpreted as a “middle way” be-tween the “wind scenario” and the “bio+ scenario”.
to 200 PJ (based on biomass, biogas and waste), which is only slightly higher than it is today.
In addition, there is a fifth, “fossil fuel” scenario, charac-terised by large-scale utilisation of coal in electricity and heating. Oil and natural gas are used in the transport sector.
ENS (2014c), p. 68.
Key energy data for electricity production in the five scenarios in 2050 [PJ]. Table 4
Scenario Wind Biomass Bio+ Hydrogen Fossil
Wind 246.2 113.3 75.9 195.4 113.2
Solar PV 6.1 6.1 3.1 6.1 2.4
CHP 24.6 34.9 39.7 21.2 63.2
Condensation 5.0 33.4 40.1 4.4 23.6
Fuel factories 3.9 4.8 5.2 3.0 0
Electricity imports 46.7 15.4 5.4 45.5 6.9
Electricity exports -51.9 -42.7 -46.4 -55.7 -62.1
total 280.6 165.3 122.9 320.1 147.1
ENS (2014c), p. 57.
Key energy data for electricity capacity in the five scenarios in 2050 [MWel], annual utilisation hours are indicated in parentheses. Note that the deployment level of onshore wind capacity is the same in all five scenarios (3.5 GW). Offshore wind deployment is substantially higher in the wind and hydrogen scenarios as compared with biomass and bio+. By contrast, there is more than 2 GW CHP biomass installed in the biomass and bio+ scenarios, whereas there is no biomass CHP in the other scenarios. Table 5
Scenario Wind Biomass Bio+ Hydrogen Fossil
Offshore wind14,000(4,116)
5,000(4,141)
2,500(4,132)
17,500(4,073)
5,000(4,135)
Onshore wind3,500(3,076)
3,500(3,076)
3,500(3,069)
3,500(3,076)
3,500(3,076)
Solar PV2,000(849)
2,000(849)
1,000(849)
2,000(849)
800(849)
Gas turbines4,600(300)
1,000(492)
400(677)
4,600(299)
1,400(200)
CHP biomass0 2,040
(4,306)2,400(4,526)
0 0
CHP coal0 0 0 0 1,575
(3,980)
Fuel cells 0 0 0 500 0
Electricity imports3,740
(3,467)3,740(1,147)
3,740(402)
3,740(3,380)
3,740(511)
Electricity exports-4,140(3,483)
-4,140(2,863)
-4,140(3,112)
-4,140(3,734)
-4,140(4,169)
Agora Energiewende | A Snapshot of the Danish Energy Transition
24
This crossroads will be reached and is unavoidable given the fact that the implementation of transition measures (e.g. wind deployment, conversion to biomass) will take time. The challenge inherent in the wind-based system has to do with the provision of reliable electricity supply. By contrast, the bioenergy-based system is faced with the challenge of fuel supply security and sustainability, should the cost of imported biomass rise. One way to cope with high-priced biomass imports could be to shift to fossil fuels; however, this alternative is undesirable, as it would not be in line with the vision of a “fossil-free” future. By contrast, the “wind scenario” relies on extensive electrification in order to in-crease flexibility so that high wind energy shares can be integrated.
At present, Denmark imports 35 percent of the biomass it consumes, two-thirds of which are in the form of wood pellets.32
32 Gregg et al. (2014).
One of the main conclusions of the scenario report is that it is indeed technically feasible to construct a Danish energy system that is not based on fossil fuels. Estimates for the additional cost of the transition to a fossil fuel-free system, as compared with a system that continues to use fossil fuels, amount to between 6 and 29 billion DKK in 2050 - around 0.81 to 3.92 billion euros. More than half of the costs will accrue to the transport sector.
There are different paths - wind and biomass - that the future Danish energy system could take: shortly after 2020, the Danish energy system will reach a crossroads and will have to decide on a direction for further development.
In 2020, a policy choice will need to be made concerning
→ whether the Danish energy system should evolve to a fuel-based biomass system,
→ or to an electricity-based wind energy system, with only limited deployment of bioenergy at a level that Denmark can supply itself.
Study | A Snapshot of the danish Energy transition
25
central power stations based on coal and natural gas: they are within the cost range of offshore wind at about 8 ct/kWh. As for onshore wind energy, there is the long-term trend for less, but larger wind turbines. When old wind tur-bines get decommissioned, they are replaced by taller ones with higher capacity and energy yield. This trend has im-portant implications for securing wind sites and for gaining the acceptance of residents living nearby.
Increasing shares of renewable energy create a need for system flexibility, on both the demand and the supply side – simultaneously, power plants with controllable generation are facing decreased profitability on the market. A new market model is required to cope with these challenges.
Physically, maintaining security of supply requires an in-stantaneous balancing of demand and supply at all times. For the design of the electricity market, this raises questions concerning how to enable the participation of ever-in-creasing shares of variable supply and flexible demand, and how to provide price signals that incentivise investments in flexibility, both for consumers and producers. Furthermore, the question arises as to how generation capacity sufficient for the provision of power might be secured even during ex-treme market situations (e.g. peak load and no wind). Thus far, the current Danish market design has done very well in providing electricity with high reliability. Nevertheless, for the future development of the electricity system, Danish stakeholders are in agreement that a new market model is needed. A new market model will be key in bringing about a cost-efficient energy transition while at the same time cre-ating economic growth and supplying electricity at com-petitive prices. Finally, the interaction between markets and grids is important. Grid expansion, such as more intercon-nectors to neighbouring countries, may additionally en-hance the flexibility of the Danish electricity system as part of the European energy market
On the road to an energy system independent from fossil fuels, a number of present trends may influence future de-velopments:
Already today, new onshore wind turbines deliver power more cheaply than natural gas or coal fired CHP plants.
In July 2014, the Danish Energy Agency analysed the pro-jected cost of electricity production from ten selected gener-ation technologies, with operation timelines spanning from 2016 to 2035.33 The results were straightforward: onshore wind energy is cheaper than any other generation technol-ogy, including central CHP based on coal and natural gas. Renewable energy-based production can be grouped into four categories, in order of increasing cost: 34
→ Onshore wind energy: the cheapest technology with a production cost of 4 ct/kWh (30 øre/kWh).
→ Offshore wind energy: the second cheapest renewable technology, with costs about twice as high that of wind onshore, at around 8 ct/kWh (60 øre/kWh).
→ New central wood-chip-fired plants and the conversion of already existing central coal-fired plants to wood chips are the third cheapest technologies.
→ The most expensive technologies are solar PV and decen-tralised biomass-fired CHP plants.
Of course, caution must be exercised in interpreting this ranking as it is sensitive to the underlying assumptions (e.g. low interest rates). However, the conclusion that onshore wind energy is the cheapest production technology is ro-bust. Notably, with the exception of onshore wind energy, all renewable technologies have a cost above the average elec-tricity spot market price of 4 ct/kWh. The same goes for new
33 ENS (2014d).
34 Costs include fuel cost, operational and maintenance costs, capital cost as well as CO₂ cost. A low interest rate is prerequisite for the analysis (assumed at 4 percent in the basic calculation).
5. Major trends influencing future development
Agora Energiewende | A Snapshot of the Danish Energy Transition
26
cles and transportation fuels produced by renewable power such as ethanol.
The Danish energy system is influenced by devel-opments in neighbouring countries. This influence extends to interconnectors, policy decisions and market design.
Due to its geographical location and relative size, the Danish energy system is strongly influenced by developments in neighbouring countries. Denmark is part of both the Nor-dic and the continental European power systems. Increased interconnection allows for more cross-border trade and power balancing across regions. The use of interconnec-tors is a major flexibility option for the integration of wind energy. The degree of Denmark’s future physical integration depends on how long it takes to plan and commission new interconnectors, such as the COBRAcable (to the Nether-lands), the Viking Link (to the UK) and Kriegers Flak (Baltic 2 to Germany). There are also plans in place to upgrade the Danish-German interconnection from Jutland (West Den-mark) to northern Germany. Danish electricity prices will be impacted by the future power mixes prevalent in Ger-many, Sweden and Norway. Germany is striving for an 80 percent share of renewables in electricity by 2050. In Ger-many, wind energy, both on- and offshore, is predominantly deployed in the north of the country, which means near to Denmark. Progress in internal German grid expansion, par-ticularly with a view to transmission corridors between the north and south of the country, has therefore received a lot of attention recently in Denmark. Likewise, policy deci-sions, e.g. concerning strategic reserves or capacity mecha-nisms in adjacent countries, have direct implications for prices and the security of electricity supply in Denmark.
There is increasing integration of national electricity markets on the road to implementing a single Euro-pean electricity market. European network codes lay down common connection, operational and market rules.
With the establishment of a European Internal Electricity Market (IEM), there is increased market coupling between
The flexibility challenge concerns not only the electricity sector but the heat, transport and gas sectors in equal measure – the different energy sectors will take on new, interactive roles.
Developments in the heat, gas and transport sectors signifi-cantly influence the flexibility of the entire energy sys-tem (e.g. interaction between the power system and dis-trict heating, installation of heat pumps, electric vehicles, etc.). These sectoral developments have a direct impact on the green transition in the electricity sector. To this end, the “Systemplan” by Energinet.dk has identified possible future roles for the different energy sectors.35 The future power system will take on a role as a supplier of renewable energy in the form of renewable electricity. The future gas system will contribute to security of supply throughout the en-tire energy system by linking the power, the heat and the transport sectors. The gas system is the natural candidate for storage. Its role is important for the increasing utilisa-tion of biogas, electrolysis (e.g. power-to-gas conversion in order to accommodate fluctuating wind power feed-in) and the conversion of the transport sector. This will enable the shift from natural gas to biogas as well as provide flexibil-ity for the integration of more wind energy. The future heat sector will take on a “bridging role” between the electric-ity producer and consumer. The high share of CHP brings on the challenge of maintaining high energy efficiency, even though the baseload needed for future electricity production will be lower. Heat demand will be the driving factor behind the operation of CHP plants. The flexibility of the heat sec-tor is particularly important for the conversion of the elec-tricity sector. There will be a fuel shift from coal to biomass in central CHP power plants. Integration of heat pumps in district heating, utilisation of process heat and the flexible use of individual heating installations, in combination with an increased interplay of cooling processes, are just a few examples of trends one can expect to see in the heat sector. The role of the future transport system will be to provide energy efficient mobility. This involves a fuel shift – one that incorporates wind-based electricity for electric vehi-
35 Energinet.dk (2013a), pp. 16-21.

Study | A Snapshot of the danish Energy transition
27
previously national and regional electricity markets. Mar-ket coupling between Germany and Denmark was initi-ated in 2008 and, after some initial hurdles, successfully relaunched at the end of 2009. In order to achieve pan-European harmonisation, the so-called EU “Target Model” covers forward, day-ahead, intraday and balancing mar-kets as well as the calculation of cross-border capacity. The Target Model serves as a blueprint (or reference) model for a common European electricity market. It has been devel-oped in parallel with regional market integration initiatives. To tackle cross-border issues, ENTSO-E (European Net-work of Transmission System Operators for Electricity) has taken charge of developing network codes. These network codes set connection, operational and market rules for the European electricity sector. They will replace pre-existing national or regional rules (e.g. in the Nordic countries). The aim is to build a common framework as European energy markets become increasingly interlinked. The integration of renewable energy sources and ensuring the security of supply are important goals when establishing a coherent set of rules for Europe. Network codes need to be implemented nationally, and so they are crucial for the further develop-ment and operation of grids and markets in the individual Member States.

Agora Energiewende | A Snapshot of the Danish Energy Transition
28

STUDY | A Snapshot of the Danish Energy Transition
29
this has implications for market integration (e.g. imports and exports), new market models, balancing, support schemes, the grid and, ultimately, public acceptance and costs.
The box in the centre column (Figure 7) illustrates the as-pects discussed in this paper for the three segments on the left: generation, the grid and electricity consumers. Each segment encompasses various aspects, as broken down be-low:
→ Electricity production: •EarlymarketintegrationwithintheNordicpowermar-
ket of which Denmark is a part and utilisation of com-plementary generation mixes across Nordic countries.
•TheconsensualapproachforanewMarketModel2.0.
The following sections provide an overview of regulatory responses and lessons learned in coping with some of the challenges posed by the energy transition in Denmark. At the same time, new challenges that have arisen only recently are also addressed. These emergent challenges are important issues in the exchange of energy policy expertise between Germany and Denmark. As some of the challenges facing both countries are rather similar, cross-border dialogue and cooperation may aid in fi nding solutions.
The order in which the lessons learned from the Danish en-ergy transition will be presented in the following chapters is inspired by the structure of the electricity sector. This also refl ects how the trends identifi ed in the previous section af-fect the entire system. For example, as wind energy becomes more cost competitive with increasing rates of deployment,
6. Lessons learned and regulatory responses – An overview
Overview of structure of challenges and regulatory responses addressed in this paper. The structure here has been inspired by the structure of the power sector Figure 7
Own illustration.
Electricity Production
Electricity Transmission
Electricity Consumers
Market integration Cost competitiveness of wind energy
Need for increased system fl exibility
Developments in other sectors
European energy market integration
Developments in neigh-bouring countries
Trends
Market Model 2.0
Balancing market
Support schemes
Interconnectors
Cost issue of support
Principles of inner Danish grid expansion
Participation & acceptance
Agora Energiewende | A Snapshot of the Danish Energy Transition
30
•Low-hangingfruit:openingtheregulatingpower (balancing) market for wind power producers.
•DesignofDanishsupportschemes,includingtenderingfor offshore wind energy.
→ Electricity transmission (and distribution): •PrinciplesofinternalDanishgridexpansion:
undergrounding and “beautification” measures. •Interconnectorsforimportsandexportsto
neighbouring countries. → Electricity consumers:
•Publicacceptanceandlegalstipulationsforenablingparticipation of local citizens.
•Financingandthecostofsupportingrenewable deployment (so-called PSO tariff).
The selection of topics is not exhaustive but has been chosen based on what may be of particular interest in light of cur-rent challenges and discussions in the electricity sector.

Study | A Snapshot of the danish Energy transition
31
link between West Denmark (the area of Jutland and Funen) and East Denmark (the area of Zealand, including Copenha-gen). It was not until August 2010 that the Great Belt Power Link (Storebælt HVDC) went operational, connecting the East and West Danish power systems. The Great Belt Power Link is a 400 kV direct current (DC) connection with a transmission capacity of 600 MW. Still today, the transmis-sion systems of the two Danish regions remain separate in the sense that they are not synchronised.
As part of Nord Pool, Denmark functions like a hub, “bridg-ing” the Nordic and the continental European power sys-tems. West Denmark (DK 1) is synchronised with the German system and, thereby, with the continental syn-chronous area of Europe (former UCTE). The Jutland-Ger-many connection consists of four alternating current (AC)
7.1 Early grid and market integration as a cross-border flexibility option
The Nordic countries are some of the first movers in terms of regional electricity market integration. Nord Pool ASA was founded as early as 1996, when Norway and Sweden established a joint power exchange. Two years later, Finland entered the Nordic electricity market. In July 1999, the day-ahead market Elspot went operational. Elspot handles the auction of hourly power contracts for physical delivery the following day. Denmark joined the power exchange in the year 2000, leading to full integration of the Nordic power markets.36 Notably, at that time, there was no transmission
36 Nord Pool Spot (2015a). Note that West Denmark joined in July 1999, and East Denmark in October of the following year.
7. Lessons learned from the power market: Early integration and a new power market design
Major findings and lessons learned:
→ Cross-border balancing of Danish power production with the other Nordic countries has worked very effectively as a flexibility option. Denmark has 6.4 GW interconnectors linking it with other countries (as compared with Danish peak demand of 6 GW). The history of interconnection is also the history of early market integration between Nordic power markets.
→ Hydropower in Sweden and Norway can be used for importing electricity to Denmark. Sufficient interconnection capacity for export to neighbouring countries, including Germany, becomes increasingly important during times of high wind energy feed-in.
→ Influx into Nordic hydropower reservoirs has traditionally influenced Danish power prices. Now wind energy exerts downward pressure on prices. This not only poses a challenge for conventional power stations but in the future will also be of issue for renewable power producers such as wind power.
→ There is need for a new market model in order to ensure adequate flexibility and capacity in the future. Throughout the Market Model 2.0 process, initiated by Energinet.dk, stakeholders will work together to find a consensual approach.
→ The Danish regulating power – or balancing – market provides favourable conditions for the participation of wind energy, such as asymmetric bids, short gate closure times and a market split up into an availability market and an activation market (with energy only bids).
→ Electricity based on renewables has priority access. Despite high wind shares, there is hardly any curtailment of onshore wind energy. For offshore wind farms, a special rule for downward regulation applies.
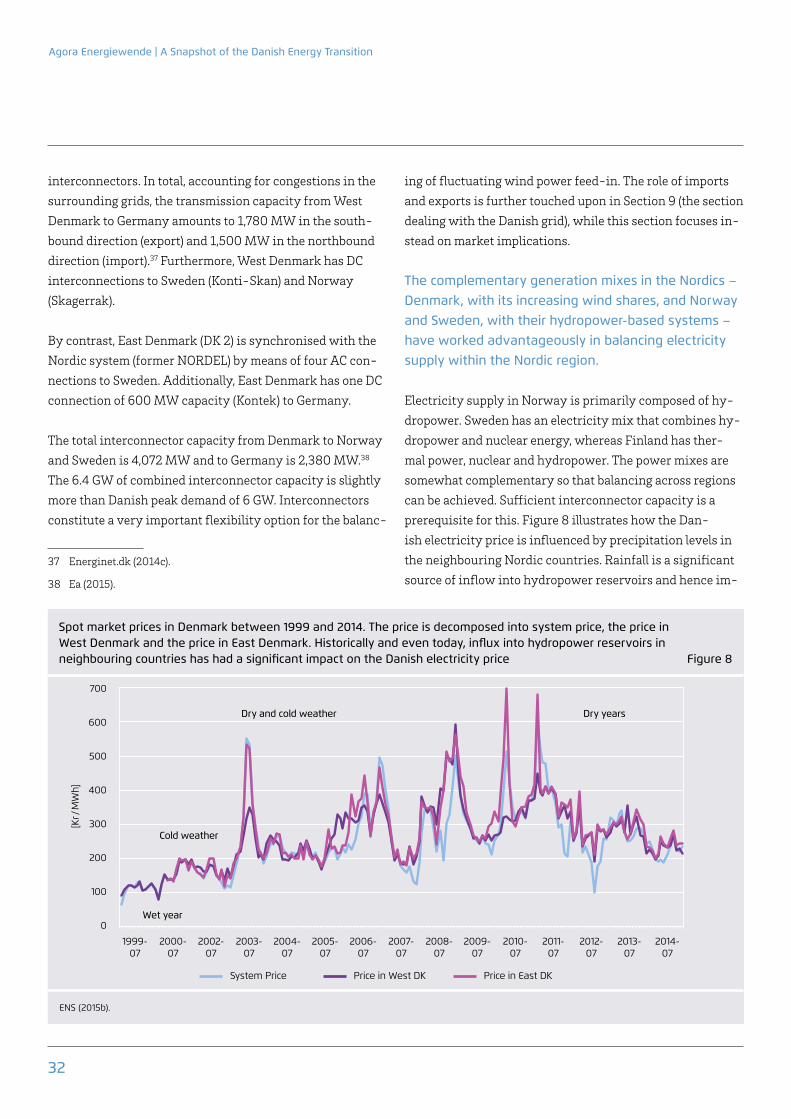
Agora Energiewende | A Snapshot of the Danish Energy Transition
32
ing of fluctuating wind power feed-in. The role of imports and exports is further touched upon in Section 9 (the section dealing with the Danish grid), while this section focuses in-stead on market implications.
The complementary generation mixes in the Nordics – Denmark, with its increasing wind shares, and Norway and Sweden, with their hydropower-based systems – have worked advantageously in balancing electricity supply within the Nordic region.
Electricity supply in Norway is primarily composed of hy-dropower. Sweden has an electricity mix that combines hy-dropower and nuclear energy, whereas Finland has ther-mal power, nuclear and hydropower. The power mixes are somewhat complementary so that balancing across regions can be achieved. Sufficient interconnector capacity is a prerequisite for this. Figure 8 illustrates how the Dan-ish electricity price is influenced by precipitation levels in the neighbouring Nordic countries. Rainfall is a significant source of inflow into hydropower reservoirs and hence im-
interconnectors. In total, accounting for congestions in the surrounding grids, the transmission capacity from West Denmark to Germany amounts to 1,780 MW in the south-bound direction (export) and 1,500 MW in the northbound direction (import).37 Furthermore, West Denmark has DC interconnections to Sweden (Konti-Skan) and Norway (Skagerrak).
By contrast, East Denmark (DK 2) is synchronised with the Nordic system (former NORDEL) by means of four AC con-nections to Sweden. Additionally, East Denmark has one DC connection of 600 MW capacity (Kontek) to Germany.
The total interconnector capacity from Denmark to Norway and Sweden is 4,072 MW and to Germany is 2,380 MW.38 The 6.4 GW of combined interconnector capacity is slightly more than Danish peak demand of 6 GW. Interconnectors constitute a very important flexibility option for the balanc-
37 Energinet.dk (2014c).
38 Ea (2015).
[Kr /
MW
h]
Spot market prices in Denmark between 1999 and 2014. The price is decomposed into system price, the price in West Denmark and the price in East Denmark. Historically and even today, infl ux into hydropower reservoirs in neighbouring countries has had a signifi cant impact on the Danish electricity price Figure 8
ENS (2015b).
700
600
500
400
300
200
100
0
1999-07
2000-07
2002-07
2003-07
2004-07
2005-07
2006-07
2007-07
2008-07
2009-07
2010-07
2011-07
2012-07
2013-07
2014-07
System Price Price in West DK Price in East DK
Wet year
Dry and cold weather Dry years
Cold weather

Study | A Snapshot of the danish Energy transition
33
price is determined where the supply curve and the demand curve (consumption) intersect. Gas turbines are at the up-per end of the merit order curve, as they incur high variable costs upon activation. This means their bids will be activated only in hours of very high prices. By contrast, wind energy, solar PV and hydropower are at the lower end of the merit order as they are very capital-intensive but incur virtually zero marginal cost (no fuel costs upon activation).
Wind energy produces electricity depending on the weather situation. In times of high wind energy feed-in, the larger wind share moves the merit order curve to the right, which consequently results in lower spot prices. In the future, the development of power mixes in neighbouring countries may also impact prices in Denmark. In Sweden, for instance, the current government intends to close some older nu-clear plants in the vicinity of Ringhals and to set new goals for renewable energy deployment. These closures and new deployment goals could result in less controllable generation capacity in the Nordic market and may also induce down-
pacts the amount of hydropower available. Lower levels in the hydro reservoirs translate into higher electricity prices, since more costly sources of electricity generation than hy-dropower then need to be activated.
Historically, hydropower in Norway and Sweden has had a significant influence on the Danish electricity price from wet year to dry year – however, with higher shares of wind power installed, wind energy feed-in plays an increasing role in exerting downward pressure on prices in certain hours.
The Danish day-ahead market Elspot is based on marginal pricing rules. This means that the last bid activated deter-mines the market price. Wind energy is a rather capital-in-tensive technology and incurs nearly zero operating costs. In order to derive the aggregated electricity supply curve, the different production technologies may be ranked in order of ascending price, reflected by their respective marginal cost. This is the so-called merit order curve (Figure 9). The market
Ea (2015), study on behalf of Agora Energiewende.
Merit order curve in the Nordic Countries. Stylised supply curve for the Scandinavian and German electricity markets. Figure 9
The y-axis depicts cost per MWh in Danish crowns (Kr.). Wind power farms would most likely bid in at the lowest costs in the electricity market, as they do not have any fuel costs to cover. The same applies in principle to hydroelectricity; however, hydroelectric plants with storage capacity can hold back their production and thereby optimise production in accordance with the expected market prices for electricity. Next in terms of cost are nuclear energy, coal plants and biomass plants, which are more expensive than hydro and wind but also have relatively low fuel costs. Gas and oil-fired plants usually come in last.
Wind
Hydro
Nuclear
Hard Coal
Biomass
Gas
Oil
Kr./M
wh
MW
Day price
Night price
Agora Energiewende | A Snapshot of the Danish Energy Transition
34
In the Danish system, the annual number of hours with negative market prices, i.e. where supply exceeds demand, have grown over the years. In 2011, there were negative electricity prices in 15 hours; in 2012, in 33 hours; in 2013, in 39 hours; and in 2014, in 46 hours. These prices apply to West Denmark, where the large portion of wind energy is deployed. East Denmark typically experiences shorter pe-riods with negative prices because of its higher degree of interconnection with Sweden.40 Moreover, during peri-ods of high wind energy feed-in, the situation on the Ger-man market may exert additional downward pressure on the Danish electricity price. With increasing wind deploy-ment in the north of Germany, there may be simultaneous excess supply in the north of Germany and in Denmark. It is no longer an option to simply export Danish wind power to Germany during these hours of excess production. To il-lustrate: During the night of 2/3 January 2015, both Ger-many and Denmark experienced negative prices. Theoreti-cally, wind power imported from Germany could in turn be exported from Denmark to Norway. However, in the course of this same night, the interconnectors between Denmark and Norway/Sweden were congested.41 On Sunday morning, 4 January 2015, electricity prices were lower in Germany than in Denmark. Consequently, electricity was exported from Germany to Denmark, and then exported again from Denmark to Norway. Typically, negative prices occur during winter months with lots of wind and in periods of low elec-tricity consumption, but they are not that frequent during the rest of the year.42
This example makes evident the common challenge that Denmark and northern Germany face during periods of high wind energy production, especially in the winter. The im-portance of grid expansion becomes obvious. This concerns both interconnector capacity as well as internal grid expan-sion within Germany to transport electricity from the north to the south of the country. Notably, internal German grid expansion could contribute to increased Danish-German integration by enabling further exports from Denmark to
40 Wittrup, 2015a.
41 Cf. Anders Kofoed-Wiuff, Ea Energy Analysis, in: Wittrup (2015a).
42 Cf. Klaus Thostrup, Energinet.dk, in: Wittrup (2015b).
ward pressure on the Nordic – and Danish – electricity price as more renewables enter the Nordic system as a whole.39
7.2 Market Model 2.0: Current challenges and a consensual approach to finding a new market design
The existing market design is under increasing pressure. This is apparent both during extreme situations, such as hours with negative prices, and at times of lower price levels in general, especially as higher wind shares enter the Nordic system.
For conventional power plants, for gas in particular, the combination of overall lower price levels and fewer hours of activation can exert serious economic pres-sure – in the future, renewable power producers will also feel this pressure.
Because gas turbines and conventional generation are run fewer hours, they have less time in which to recover their investments. With high shares of fluctuating renewable energy feed-in, the classical notion of baseload and peak load power plants no longer applies. Instead, flexibility and fast ramping are the new attributes placed on power plants. The value of flexibility, however, is not reflected in the cur-rent market design. Under the current design and into the foreseeable future, renewable electricity producers will be faced with the question of how to cover their fixed costs. At present, Danish wind power producers still receive sup-port from a feed-in tariff/price premium system (and, for offshore wind, from a tendering scheme combined with Contracts for Difference). With a higher penetration of wind energy, the market, with its current marginal cost-based design, is increasingly put under pressure.
The hours with negative electricity prices have signifi-cantly increased during the past four years – this chal-lenge will most likely persist into the future. Electricity imports from Germany could exacerbate the situation.
39 Energinet.dk and Quartz+CO (2014), p. 9.

Study | A Snapshot of the danish Energy transition
35
ing degrees, adjustments or more significant changes to the present market design: 45
→ Clear price signals, providing an improved framework for investments in flexibility.
→ Strategic reserve in order to secure capacity in extreme situations.
→ Capacity market, implying direct payment for capacity.
There is a trade-off between the degree of regulatory inter-vention and the securing of sufficient capacity in the future. The final product of Phase 2 of the project will be a catalogue of different market models detailing the combination of so-lutions that each provides.
There are five working groups associated with the project: 46
→ “Clear price signals” (main track), → “Capacity markets” (main track), → “Flexible consumption” (analysis group), → “Flexibility from wind turbines and other renewable energy” (analysis group),
→ “Heating” (analysis group).
The structure of these groups illustrates how interdepend-encies between electricity production, flexible demand and the heating sector are taken into account.
In order to establish a framework for the development of market solutions, the Markedsmodel 2.0 project group has identified design criteria for the new market design. It is worth highlighting that these criteria prioritise the de-mand side, as flexible consumption needs to be integrated in all markets. The market model should be as technologi-cally neutral as possible and value energy and other types of supply independent of any given applied technology. The production and consumption side, including large and small actors, must compete on equal terms.
45 Energinet.dk and Quartz+CO (2014).
46 Energinet.dk (2015b).
Germany during times of high wind energy feed-in in the Danish system. A prerequisite for this is sufficient inter-connector capacity. At the same time, internal German grid expansion will facilitate Nordic-German market integration in general, especially with respect to interconnector capac-ity to the other Nordic countries such as Norway, where the NordLink interconnector is planned.
In order to address the market challenge in Denmark, the Danish transmission system operator Energinet.dk initiated a market redesign process in spring 2014. The new market design, called Markedsmodel 2.0, is being developed in collaboration with a broad array of stake-holders representing many sides of the energy sector.
The implementation of the new market model is envisaged for 2016. The vision for the future electricity market in-volves the creation of a long-term framework, an appropri-ate investment climate and attractive business models that would facilitate the energy transition while also ensuring security of supply.43 The process is divided in two phases:44
→ Phase 1 – Market scenarios (June through October 2014): focus on prerequisites and challenges to solutions, match-ing stakeholder assumptions. This phase concluded with a report based on four workshops and two seminars held with stakeholders as well as quantitative and qualitative analyses and the contributions of experts.
→ Phase 2 – Refinement of market regulations (ult. 2014 through mid-2015): focus on distribution of roles, gov-ernance and product definition as well as processes.
Based on challenges identified in the current market design, possible market solutions to incentivise flexibility and/or capacity have been mapped out.
A further narrowing down of future market options has led to the identification of three major market solutions rel-evant to the Danish context. Each of these involves, to vary-
43 Sommer (2014).
44 Energinet.dk (2015a).
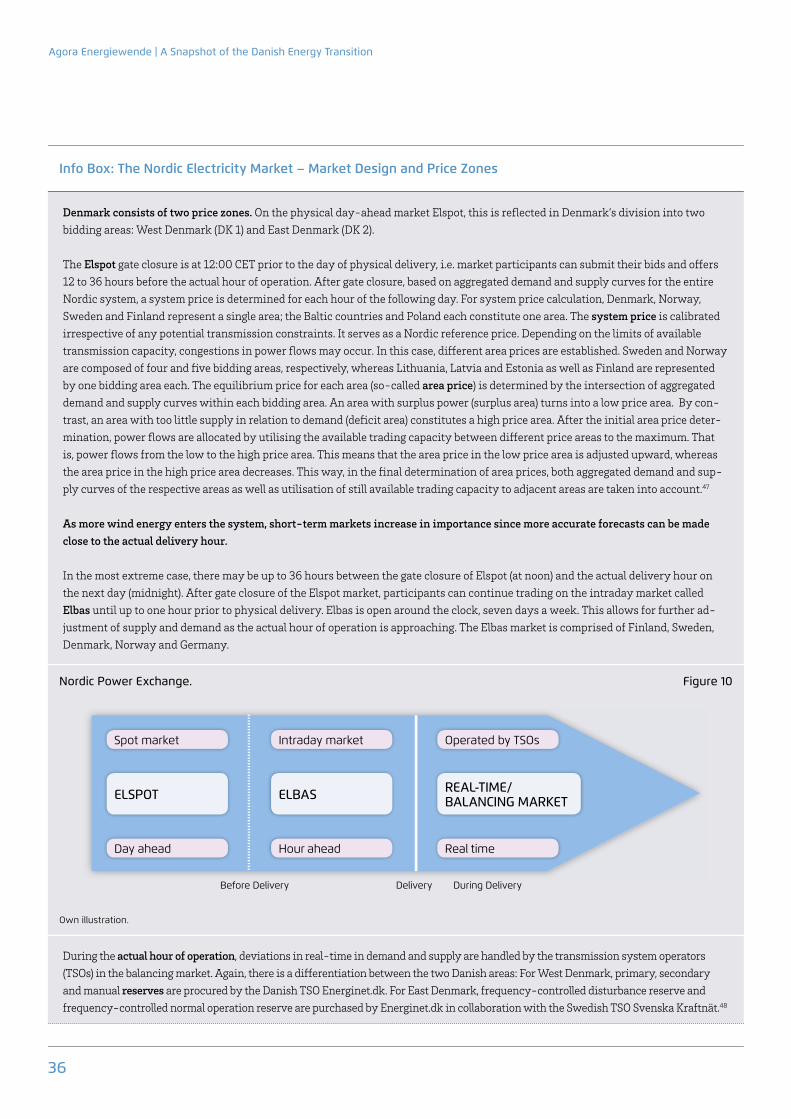
Agora Energiewende | A Snapshot of the Danish Energy Transition
36
Info Box: The Nordic Electricity Market – Market Design and Price Zones
Denmark consists of two price zones. On the physical day-ahead market Elspot, this is refl ected in Denmark’s division into two bidding areas: West Denmark (DK 1) and East Denmark (DK 2).
The Elspot gate closure is at 12:00 CET prior to the day of physical delivery, i.e. market participants can submit their bids and off ers 12 to 36 hours before the actual hour of operation. After gate closure, based on aggregated demand and supply curves for the entire Nordic system, a system price is determined for each hour of the following day. For system price calculation, Denmark, Norway, Sweden and Finland represent a single area; the Baltic countries and Poland each constitute one area. The system price is calibrated irrespective of any potential transmission constraints. It serves as a Nordic reference price. Depending on the limits of available transmission capacity, congestions in power fl ows may occur. In this case, diff erent area prices are established. Sweden and Norway are composed of four and fi ve bidding areas, respectively, whereas Lithuania, Latvia and Estonia as well as Finland are represented by one bidding area each. The equilibrium price for each area (so-called area price) is determined by the intersection of aggregated demand and supply curves within each bidding area. An area with surplus power (surplus area) turns into a low price area. By con-trast, an area with too little supply in relation to demand (defi cit area) constitutes a high price area. After the initial area price deter-mination, power fl ows are allocated by utilising the available trading capacity between diff erent price areas to the maximum. That is, power fl ows from the low to the high price area. This means that the area price in the low price area is adjusted upward, whereas the area price in the high price area decreases. This way, in the fi nal determination of area prices, both aggregated demand and sup-ply curves of the respective areas as well as utilisation of still available trading capacity to adjacent areas are taken into account.47
As more wind energy enters the system, short-term markets increase in importance since more accurate forecasts can be made close to the actual delivery hour.
In the most extreme case, there may be up to 36 hours between the gate closure of Elspot (at noon) and the actual delivery hour on the next day (midnight). After gate closure of the Elspot market, participants can continue trading on the intraday market called Elbas until up to one hour prior to physical delivery. Elbas is open around the clock, seven days a week. This allows for further ad-justment of supply and demand as the actual hour of operation is approaching. The Elbas market is comprised of Finland, Sweden, Denmark, Norway and Germany.
During the actual hour of operation, deviations in real-time in demand and supply are handled by the transmission system operators (TSOs) in the balancing market. Again, there is a diff erentiation between the two Danish areas: For West Denmark, primary, secondary and manual reserves are procured by the Danish TSO Energinet.dk. For East Denmark, frequency-controlled disturbance reserve and frequency-controlled normal operation reserve are purchased by Energinet.dk in collaboration with the Swedish TSO Svenska Kraftnät.48
Nordic Power Exchange. Figure 10
Own illustration.
Before Delivery Delivery During Delivery
Spot market
Day ahead
Intraday market
Hour ahead
Operated by TSOs
Real time
ELSPOT ELBAS REAL-TIME/ BALANCING MARKET

Study | A Snapshot of the danish Energy transition
37
7.3 Low hanging fruit: Participation of wind power producers in the regulating power market4748
In general, ancillary services must be procured in order to secure system reliability. Regulating power is necessary to balance deviations in demand and supply during the actual hour of market operation. Reactive power is essential for voltage control. A challenge for a new market design is the future provision of ancillary services. Traditionally, ancil-lary services have been provided by large-scale, controlla-ble central power plants. With increasing shares of renewa-bles, there is need for new procurement mechanisms for the provision of ancillary services by new actors (e.g. renew-able generators, grid operators or other parties) as there are fewer classical must-run baseload plants in the system.
The specific characteristics of the Danish regulating power market account for increased flexibility: these
47 More detailed information can be found at: http://www.nordpoolspot.com/TAS/Day-ahead-market-Elspot/
48 More information can be found on Energinet.dk’s website: http://energinet.dk/EN/El/Systemydelser-for-el/Sider/default.aspx
include an availability market and an activation market, asymmetrical bids and short gate closure times.
In Denmark there are two control zones: DK 1/West Den-mark and DK 2/East Denmark. These two control zones pro-cure different types of products for the delivery of ancillary services (Table 6). The Danish transmission system operator (TSO) Energinet.dk contracts reserves via bilateral agree-ments with a production or consumption balancing respon-sible party for a predefined period.
The largest share of reserve procurement in Denmark con-sists of manual reserves, i.e. capacity that is available for manual balancing of the system according to an agree-ment between Energinet.dk and the relevant market actors. Market actors that provide manual reserves are obliged to submit capacity bids for activation in the regulating power market.49 The actors receive a capacity payment and, upon activation, an energy price. For activation, a marginal pric-ing method is applied, that is, the most costly activated bid sets the price.
In addition to this “classical approach” of a combined avail-ability and activation market, there is also the possibility for
49 Energinet.dk (2013c).
Energinet.dk (2013c), p. 3.
Overview of types of reserves in West and East Denmark. Table 6
Function terminology
ENtSO-E West dK East dK
Primary reserve (Frequency stability) Frequency containment reserves (FCR)
Primary reserve(Primær reserve)
Frequency-controlled disturbance reserve (Frekvensstyret driftsforstyrrelsesreserve /FDR)
¨¨¨¨¨¨¨¨¨¨¨¨¨¨¨¨¨¨¨¨¨¨¨¨Frequency-controlled reserve for normal operation (Frekvensstyret normaldriftsreserve/FNR)
Secondary reserve Frequency Restoration Reserves (aFRR)
Load Frequency Control (LFC)---
tertiary reserve Frequency Restoration Reserves (mFRR)
Manual reserve Manual reserve
Replacement Reserves (RR) --- ---
Agora Energiewende | A Snapshot of the Danish Energy Transition
38
submitting only energy bids. This means that for balancing responsible parties there are two possibilities for partici-pation in the regulating power market/mFRR for tertiary reserves:50
→ 1) Capacity for activation: The market actor can sign an agreement with Energinet.dk to provide manual re-serves for upward and downward regulation. The ac-tor is then obliged to submit bids for activation in the pre-defined period for the corresponding capacity (as referred to above as the “classical approach”).
•Income: The actor receives a capacity payment and, upon activation, an energy payment.
•Gate closure: 17:00 on the day prior to the delivery day.
→ 2) Energy bids: The market actor can choose to provide only energy bids whenever this is economically attractive.
•Income: The actor receives an energy payment only upon activation.
•Gate closure: 45 minutes prior to the actual operating hour.
Notably, the market design is asymmetric: it is possible to submit bids for only upward or downward regulation.
Wind energy producers can proactively contribute to the system balance by providing downward regulation during times of excess production.
Traditionally, wind operators feed electricity into the grid whenever the wind is blowing, as production incurs virtu-ally no marginal cost. The fluctuating wind energy feed-in is accommodated by other generation units adjusting their output – or by alternative flexibility options, such as elec-tricity exports via interconnectors. However, when a proac-tive operation philosophy is applied, the flexibility of wind turbines allows wind generators to contribute to system balancing directly. By reducing their output during times of excess production in the system, wind turbines can provide downward regulation and thereby reduce the system imbal-
50 Energinet.dk (2013c).
ance.51 A prerequisite for this is a regulating power market design that enables wind generators to participate in this way.
In 2011, the Danish TSO Energinet.dk adopted changes to existing regulation that enabled wind power producers to participate with activation bids in the Nordic regulating power market.52 Energy only products (activation market) and short gate closure times are crucial factors given that the forecast error for wind energy feed-in decreases closer to the actual operating hour. The minimum bid size for the individual operating hours in Denmark is +/-10 megawatts. For wind energy producers, this implies the necessity of pooling wind turbines in order to participate in the regulat-ing power market.
During the hour of operation Energinet.dk activates the necessary upward or downward regulating power bids. Denmark is part of the Nordic Operational Information System (NOIS), the Nordic regulating power market. Price formation takes place in a similar fashion to that of the Els-pot market (see also Info Box: The Nordic Electricity Market): the marginal bid sets the price (marginal pricing principle). The marginal hourly price is determined by the highest ac-tivated regulating power bid. It is the same across all Nordic price areas, provided that there are no bottlenecks.53 In the case of bottlenecks, the regulating power market is split, and the area affected by the bottleneck will have its own regu-lating power price.54
So far, there is hardly any curtailment of onshore wind energy. For offshore wind energy deployed with the tendering scheme, there is a special regulation for downward regulation.
51 A more extensive case study on market integration of wind power in electricity system balancing has been carried out by Sorknæs et al. (2013).
52 Energinet.dk (2011).
53 Cf. Energinet.dk (2013c).
54 Energinet.dk (2008).
Study | A Snapshot of the danish Energy transition
39
Curtailment – that is, the “forced” shedding production - of wind turbines is a last resort option during times of over-supply to maintain system balance or to alleviate network constraints.55 Danish regulations stipulate priority access to the grid for electricity production based on renewable energy sources or waste as well as for decentralised CHP plants (§27c (5), Danish Electricity Supply Act). If it is nec-essary for maintaining security of supply, the Danish TSO Energinet.dk can reduce or fully curtail output of prioritised electricity production. This only applies in the event that reducing electricity production from other power plants proves insufficient for maintaining the technical quality and balance within the entire power system (ibid). Despite the high wind share, so far there has only been very limited curtailment of onshore wind turbines in Denmark.
An increasing number of onshore wind power producers participate in the regulating power market. In their bids, market participants can indicate the price (i.e. how low the spot price shall be) at which they offer to cease production of their wind turbines. By offering regulating power during hours with negative spot prices, wind power producers can still receive income while helping to mitigate the negative price effect on the spot market. Note that this incentive is partially driven by the design of the Danish support scheme. Depending on the year that a given power producer ob-tained grid connection, some onshore wind power produc-ers are entitled to a fixed premium on top of the electricity wholesale price, as opposed to a Contract for Difference or fixed feed-in tariff scheme. It is also important to mention that in Denmark, the duration of support for wind energy onshore (price premium) is paid for a certain number of full load hours (e.g. for 22,000 full load hours). Furthermore, two of the more recently tendered offshore wind farms – An-holt and in the future Horns Rev 3 – receive support only during hours with positive electricity wholesale prices. For these types of onshore and offshore wind power producers, supplying negative regulating power thus leads to deferred though not forfeited support income.
55 For a more detailed overview of different types of curtailment, see e.g. Jacobsen and Schröder (2012).
Notably, there is one exception in terms of priority access. This exception applies to offshore wind energy producers (§34 (3), Danish Renewable Energy Act): the TSO can re-quire downward regulation by means of reducing or stop-ping production from offshore wind turbines that have been awarded contracts by means of the tendering procedure (a further explanation of tendering is given in Section 8). Downward regulation may be necessary:
→ due to the malfunction or necessary maintenance of transmission equipment for transporting electricity to land or to the rest of the transmission grid, or
→ due to other capacity limits in the transmission grid that can be alleviated by downward regulation.
These offshore wind power producers are financially com-pensated as stipulated by §35 of the Danish Renewable En-ergy Act. The compensation payment is determined based on the loss in income, if electricity had been sold during this period, according to the type of support granted to the indi-vidual offshore wind farm (which may either be the sum of the market price and price premium or fixed price, depend-ing on the offshore wind farm – or according to the market price when the offshore wind farm is no longer entitled to support; see Chapter 8).56 Notably, the compensation pro-cedure is different for newly installed offshore wind farms such as Anholt. During hours with negative market prices – where the Anholt offshore wind farm does not receive sup-port – there is also no payment for curtailment on behalf of the TSO (§35 (3), Danish Renewable Energy Act).
56 This is applicable for 25 years after obtaining the permit for deploying offshore wind energy on sea territory or in the exclusive economic zone (EEZ). Note that there is no financial compensation in case of force majeure. There is no compensation for the Anholt offshore wind farm during hours where the fixed market price is not positive and there is no price premium.

Agora Energiewende | A Snapshot of the Danish Energy Transition
40
Study | A Snapshot of the danish Energy transition
41
newable Energy Act/EEG surcharge”). A discussion con-cerning the financing of renewable energy deployment and its impact on industry, similar to the ongoing discussion in Germany, has arisen lately in Denmark as well. This will further be elaborated upon in Section 10.2.
The two most important support instruments are feed-in premiums and fixed feed-in tariffs at various levels. The latter are provided as Contracts for Differ-ence determined in tendering procedures for offshore wind. The duration of support is either based on full load hours, on a predefined number of years, or both.
Generally, the Danish system is comprised of four different types of renewable energy support schemes:57
→ Fixed premium case: Eligible producers obtain a price premium (e.g. 25 øre/kWh) independent of the spot mar-ket price. This premium is fixed and paid on top of the
57 ENS (2015e) and ENS (2015f).
Danish energy policy has been promoting renewable energy for a long time. The country already features a broad range of regulations, voluntary agreements as well as planning and economic instruments, including financial support of vari-ous kinds.
Traditionally, renewable energy policy evolved from regu-lation of CHP development and the biomass (straw) used in central power plants, as well as public planning to facili-tate the deployment of wind energy. This planning/regula-tory framework has been backed by incentives for private engagement in investment in renewable generation (Section 10). The support level as well as the support regime depends on the technology and on the year when the renewable en-ergy installation was connected to the grid.
Generally, funding for the support of renewables is financed by means of a special surcharge included in consumer elec-tricity bills, called the PSO (Public Service Obligation) sur-charge. To some extent, the PSO surcharge can be regarded as the Danish equivalent of the German “EEG-Umlage” (“Re-
8. Promotion of renewable energy sources
Major findings and lessons learned:
→ The support for Danish onshore wind energy includes different variants of feed-in tariff and fixed premium schemes, including compensation for balancing cost. The support is either paid for a number of years or for full load hours.
→ For offshore wind energy, there are two procedures: the tendering procedure and the “open door” procedure in areas not desig-nated for tendering. The outcome of previous tenders for offshore wind reveals large differences in the tendered price level and resulting costs.
→ There are three crucial support scheme design elements for the participation of investors in the tendering procedure: Contracts for Difference as financial support, guaranteed grid connection and a one-stop-shop authority (Danish Energy Agency).
→ Multi-site tendering is applied in six designated areas for awarding contracts to nearshore wind farms (350 MW). The less stringent conditions for nearshore projects facilitate the entry of newcomers to the Danish offshore segment.
→ The regulations concerning consumer ownership – with 20 percent offered to local citizens – also apply to nearshore tenders. Furthermore, there is a special regulation for offshore demonstration projects with a guaranteed level of support.

Agora Energiewende | A Snapshot of the Danish Energy Transition
42
ate more flexibly on the power market, this system was re-placed by an annual grant determined partly by the support level of previous years and meant to continue until 2018.
A more detailed overview of the history of CHP support and the increased flexibilisation of CHP plants is provided by Ea (2015).
8.1 Supporting onshore wind energy
In the very beginning and prior to the electricity market reform in 1999, onshore wind power producers received a fixed feed-in tariff. The 1999 reform liberalised the Danish electricity sector and also reformed the support paid to wind power producers. For wind turbines connected between 2000 and 2002, support was still based on a fixed feed-in tariff. However, this support was granted for a restricted period of time depending on full load hours. Once 22,000 full load hours were reached, there was a shift to a fixed pre-mium of 1.3 ct/kWh paid on top of the spot market price. Furthermore, the fixed premium scheme featured a total cap at 4.8 ct/kWh.
When feed-in premiums for wind energy onshore were at very low levels after 2000, this resulted in a rather slow expansion of onshore wind energy in subsequent years. Thereafter, regulation on support has been changed again.
Feed-in premiums were at relatively low levels after 2000. This resulted in a rather slow expansion of onshore wind energy from that point on. Recently, the level of support has slightly increased – in contrast with the trends observed in many other countries.
New onshore wind capacity receives a premium of 3.4 ct/kWh on top of the market price. The sum of the market price and the premium is capped at 7.8 ct/kWh. This means that the premium is correspondingly reduced if this level is reached. Support is provided for a limited amount of elec-tricity generation calculated according to the following formula:
electricity wholesale price. This type of support can be granted with or without a cap. If there is a cap, at a cer-tain market price the (otherwise fixed) price premium will be reduced or no longer provided once the upper limit is reached.
→ Fixed feed-in tariff case with variable premium: Eligible producers are entitled to a fixed total support income (e.g., 60 øre/kWh). The support premium (price supplement) that an eligible producer obtains from the TSO Energinet.dk corresponds to the difference between the spot market price and the fixed support income. Hence, the amount of the premium is variable, depending on the level of the spot market price (Nord Pool) in the price area that the renew-able production unit is grid-connected to.
→ Contract for Difference (CfD) with tendering scheme: Offshore wind farms participating in the tendering scheme sell the electricity on the market themselves. They obtain variable support based on the difference between the spot market price and the price at which they have been awarded the tender. This support scheme resem-bles the fixed feed-in tariff case with a variable premium described above. The major difference is that a tendering procedure is used in order to determine the level of sup-port for an individual offshore wind farm.
→ Basic support payment: Support is given as a fixed annual amount.
Frequently, price premium payments are accompanied by additional compensation for balancing costs. Several other instruments are used in addition to the four described above, but they are more limited in terms of funds available and in terms of the technologies and developers that are eli-gible.
For wind energy onshore, different variants of the feed-in premium scheme are applied. Fixed feed-in tariffs (as CfDs) have been used in the tendering for offshore wind farms and to promote some of the small-scale production technolo-gies such as solar PV, household wind turbines and biogas. Investment support plays a much smaller role but has been used to a limited extent for biogas. Previously decentralised CHP plants were subsidised by a three part, time-divided feed-in tariff, but in order to make CHP technology oper-

Study | A Snapshot of the danish Energy transition
43
is less than might be inferred from the numbers in the table. Due to the limitation of full load hours, in practice the actual amount paid needs to be considered. When comparing wind to other technologies, this difference may be even more pro-nounced.
8.2 Offshore tender results and conditions for existing wind farms
Denmark was one of the first movers in offshore wind en-ergy deployment. The first Danish offshore wind project (Vindeby) dates back to 1991. Due to geographical con-ditions, there is a differentiation between offshore and nearshore wind farms.
There are two types of procedures for offshore wind projects in Denmark: the “open door procedure” (åben dør) and the government tendering procedure (udbud).
Turbine capacity in MW x (6,600 hours + rotor area in m2 x 5.6 MWh/m2)
Calculated in this way, the average amount of support for onshore wind turbines corresponds to approximately 25,000 full load hours.
In addition to the premium, all turbines receive a compen-sation of 0.3 ct/kWh to account for the average costs for balancing, which the turbine owners are responsible for and have to cover.
For onshore wind capacity installed earlier than 2014 there are a variety of support levels and conditions still in place. Table 7 illustrates the differences applied over the years, which still determine a major portion of the support pro-vided today. For a comparison of the levels of support, it is vital to include the duration of the support either in full load hours or limited support time (e.g. 20 years). In real-ity, the level of support for the expected lifetime generation
ENS (2015f).
Support schemes and levels of support for new and existing onshore and offshore wind capacity. Table 7
Fixed premiumcase
Cap on premium + market
Feed-in tariff case
Expiration of support
c€/kWh c€/kWh c€/kWh
New onshore wind turbines grid connected as of 1 January 2014 and offshore without tender that have applied for feasibility study after 15 June 2013
0.3 (bal.) Premium: 3.4Total cap: 7.8
Eligible for the sum of 6,600 full load hours and an electricity production of 5.6 MWh per m2 rotor area, corresponding in total to around 25,000 full load hours depending on the type of wind turbine
Onshore turbines connected 21 February 2008 through 31 December 2013
3.4 + 0.3 (bal.) Eligible for 22,000 full load hours
Offshore wind turbines not covered by tenders connected as of 21 February 2008, with application for preliminary assess-ment prior to 15 June 2013
3.4 + 0.3 (bal.) Eligible for 22,000 full load hours
Wind turbines outside tenders connected 1 January 2005 through 20 February 2008
1.3 + 0.3 (bal.) For 20 years
Wind turbines outside tenders connected before 2000 and 2003-2004
0.3 (bal.) Premium: 1.3Total cap: 4.8
For 20 years
Wind turbines connected 2000-2002…
…Up to 22,000 full load hours 0.3 (bal.) 5.8 Eligible for 22,000 full load hours
…After 22,000 full load hours 0.3 (bal.) Premium: 1.3Total cap: 4.8
Price + cap applies after expiration of support for 22,000 full load hours

Agora Energiewende | A Snapshot of the Danish Energy Transition
44
of support is based both on the amount of production (e.g. 10 or 20 TWh) as well as on a maximum number of years, typi-cally 20. This means that financial support ceases, at the lat-est, after a certain time, even if the production amount has not yet been reached (Table 8).
Irrespective of the procedure applied, three licences are re-quired for the deployment of an offshore wind farm:
→ License for preliminary investigations (1), → License for establishment (2), → License for electricity production (3).
A license for establishing an offshore wind farm is only granted if the initial assessments carried out under the first license for preliminary investigations have been success-fully completed. It must be demonstrated that the offshore wind farm in question is compatible with relevant interests at sea. Likewise, the license for electricity production will only be granted if the conditions laid out in the license for establishment are met. The Danish Energy Agency is in this respect a “one-stop-shop” authority for granting all three licenses. In addition, an Environmental Impact Assessment (EIA) is required if the project is likely to have an impact on the environment.
For projects that fall under the tendering procedure such as Horns Rev 3 or Kriegers Flak, the TSO Energinet.dk carries out geophysical and geotechnical investigations in advance of the call for tenders. Along with technical background reports supporting the EIA, this material is publicly avail-able on Energinet.dk’s website. In this way, offshore wind developers can inform themselves in greater detail with respect to the tendering site in question. In doing so, they can thoroughly assess the cost of the project before submit-ting a quotation for the fixed feed-in tariff (CfD) level under the tendering procedure. For example, for Horns Rev 3, all licenses for the construction and operation of the project were already included in the package for the award-win-ning bid.
Under the open door procedure, the project developer se-lects a water area for the offshore or nearshore wind farm himself and submits an unsolicited application for a license to conduct the necessary site investigations. For the open door procedure, one may choose only those areas that have not already been designated for the deployment of offshore wind farms as part of the tendering procedure.
Six designated areas were pointed out by the Danish Energy Agency on behalf of the Ministry for offshore wind tenders in order to secure sites for large-scale offshore wind pro-jects even after 2020:58 Jammerbugt, Ringkøbing, Horns Rev, Store Middelgrund, Kriegers Flak and Rønne Banke. In ad-dition, six designated areas were announced for nearshore projects: 59 Bornholm, Smålandsfarvandet, Sejerø Bugt, Sæby, Vesterhav Syd and Vesterhav Nord. “Open door” offshore wind projects are excluded from these areas. Upon positive preliminary assessment demonstrating the approval of an “open door” project, the project developer obtains a license to implement the project and is entitled to support by means of a premium scheme (Table 7).
By contrast, under the government tendering procedure, the Danish Energy Agency, Energistyrelsen, selects a site for which interested developers can participate as bid-ders in the tender. The level of support is determined by the winning bid of the tender. It is paid as a fixed settlement (feed-in tariff) under a Contract for Difference scheme. The price level of the winning bid may differ depending on the conditions of any given individual project as well as condi-tions such as wind speeds, water depths, specificities of the ground and seabed sediments. The idea behind the tender-ing scheme is to implement new offshore wind farms at specific sites in the most cost efficient way. Both the geo-graphical location and the specific size of the project [MW] for which project developers can submit their bids are de-termined ex ante by the Danish Energy Agency. Importantly, the bid of each applicant needs to include the price (pro-vided as a CfD) for a certain amount of production at which the project developer would deploy the project. The duration
58 ENS (2015g).
59 ENS (2015i).
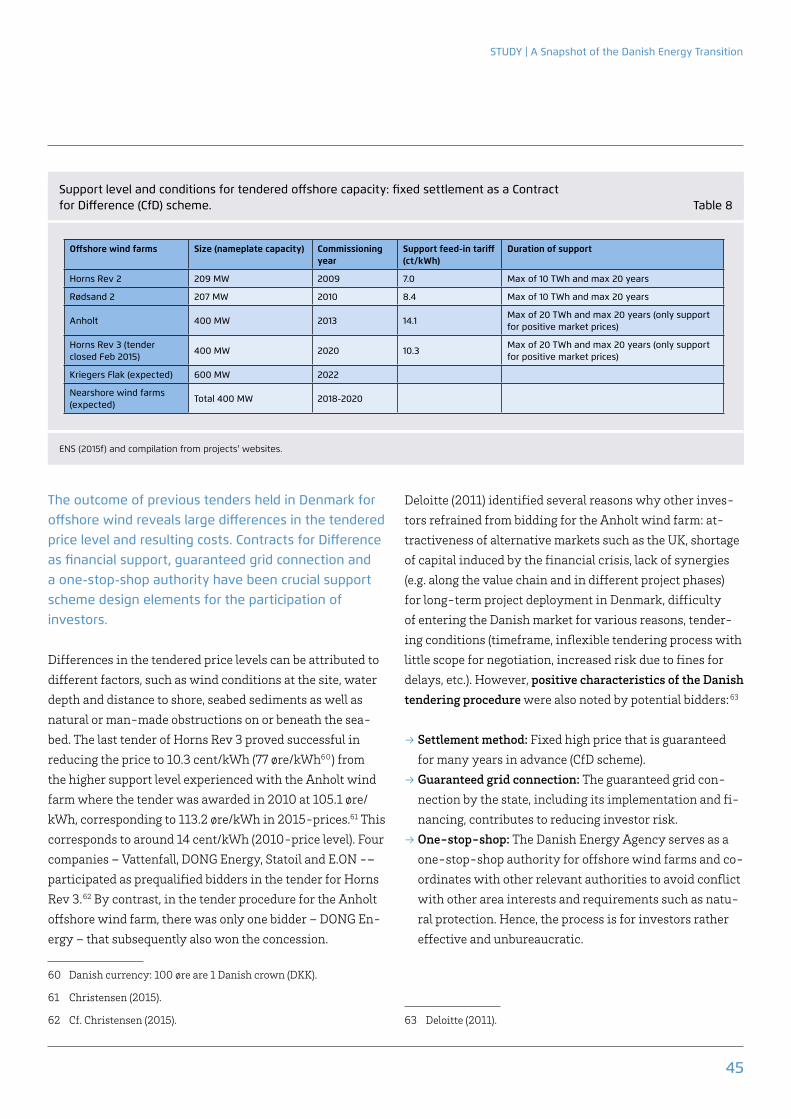
Study | A Snapshot of the danish Energy transition
45
Deloitte (2011) identified several reasons why other inves-tors refrained from bidding for the Anholt wind farm: at-tractiveness of alternative markets such as the UK, shortage of capital induced by the financial crisis, lack of synergies (e.g. along the value chain and in different project phases) for long-term project deployment in Denmark, difficulty of entering the Danish market for various reasons, tender-ing conditions (timeframe, inflexible tendering process with little scope for negotiation, increased risk due to fines for delays, etc.). However, positive characteristics of the Danish tendering procedure were also noted by potential bidders: 63
→ Settlement method: Fixed high price that is guaranteed for many years in advance (CfD scheme).
→ Guaranteed grid connection: The guaranteed grid con-nection by the state, including its implementation and fi-nancing, contributes to reducing investor risk.
→ One-stop-shop: The Danish Energy Agency serves as a one-stop-shop authority for offshore wind farms and co-ordinates with other relevant authorities to avoid conflict with other area interests and requirements such as natu-ral protection. Hence, the process is for investors rather effective and unbureaucratic.
63 Deloitte (2011).
The outcome of previous tenders held in Denmark for offshore wind reveals large differences in the tendered price level and resulting costs. Contracts for Difference as financial support, guaranteed grid connection and a one-stop-shop authority have been crucial support scheme design elements for the participation of investors.
Differences in the tendered price levels can be attributed to different factors, such as wind conditions at the site, water depth and distance to shore, seabed sediments as well as natural or man-made obstructions on or beneath the sea-bed. The last tender of Horns Rev 3 proved successful in reducing the price to 10.3 cent/kWh (77 øre/kWh60) from the higher support level experienced with the Anholt wind farm where the tender was awarded in 2010 at 105.1 øre/kWh, corresponding to 113.2 øre/kWh in 2015-prices.61 This corresponds to around 14 cent/kWh (2010-price level). Four companies – Vattenfall, DONG Energy, Statoil and E.ON -– participated as prequalified bidders in the tender for Horns Rev 3.62 By contrast, in the tender procedure for the Anholt offshore wind farm, there was only one bidder – DONG En-ergy – that subsequently also won the concession.
60 Danish currency: 100 øre are 1 Danish crown (DKK).
61 Christensen (2015).
62 Cf. Christensen (2015).
ENS (2015f) and compilation from projects' websites.
Support level and conditions for tendered offshore capacity: fixed settlement as a Contract for Difference (CfD) scheme. Table 8
Offshore wind farms Size (nameplate capacity) Commissioning year
Support feed-in tariff (ct/kWh)
duration of support
Horns Rev 2 209 MW 2009 7.0 Max of 10 TWh and max 20 years
Rødsand 2 207 MW 2010 8.4 Max of 10 TWh and max 20 years
Anholt 400 MW 2013 14.1Max of 20 TWh and max 20 years (only support for positive market prices)
Horns Rev 3 (tender closed Feb 2015)
400 MW 2020 10.3Max of 20 TWh and max 20 years (only support for positive market prices)
Kriegers Flak (expected) 600 MW 2022
Nearshore wind farms (expected)
Total 400 MW 2018-2020
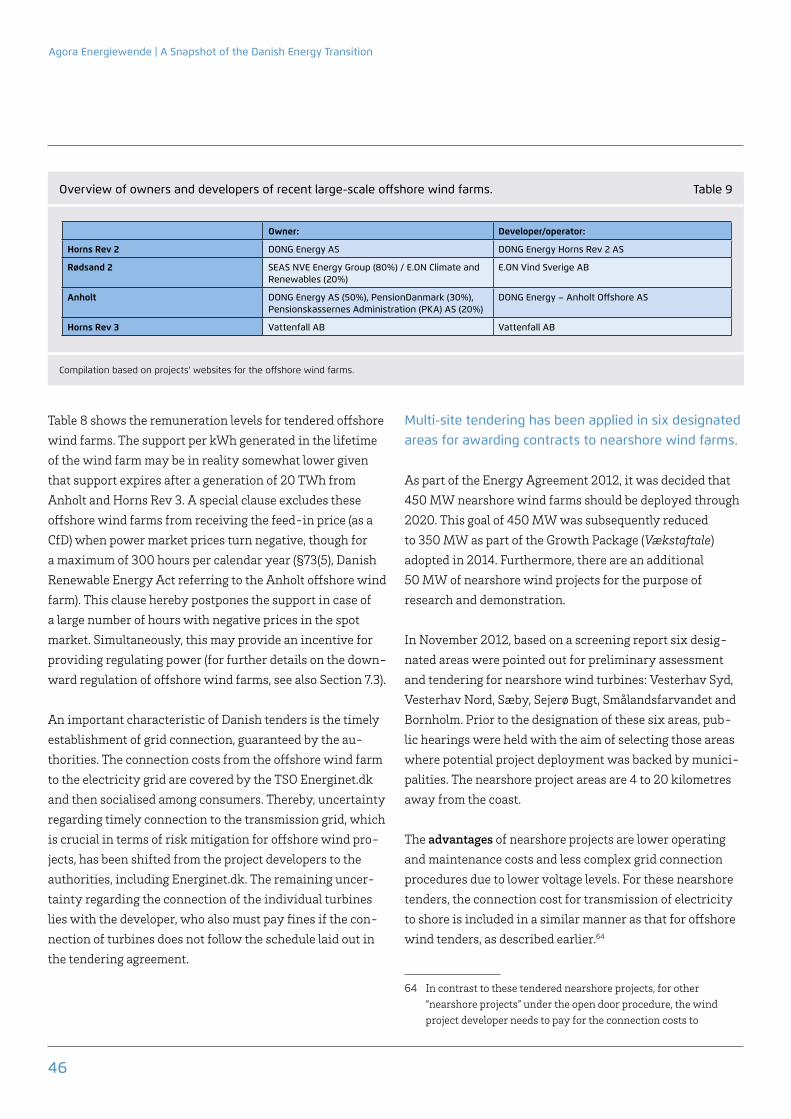
Agora Energiewende | A Snapshot of the Danish Energy Transition
46
Multi-site tendering has been applied in six designated areas for awarding contracts to nearshore wind farms.
As part of the Energy Agreement 2012, it was decided that 450 MW nearshore wind farms should be deployed through 2020. This goal of 450 MW was subsequently reduced to 350 MW as part of the Growth Package (Vækstaftale) adopted in 2014. Furthermore, there are an additional 50 MW of nearshore wind projects for the purpose of research and demonstration.
In November 2012, based on a screening report six desig-nated areas were pointed out for preliminary assessment and tendering for nearshore wind turbines: Vesterhav Syd, Vesterhav Nord, Sæby, Sejerø Bugt, Smålandsfarvandet and Bornholm. Prior to the designation of these six areas, pub-lic hearings were held with the aim of selecting those areas where potential project deployment was backed by munici-palities. The nearshore project areas are 4 to 20 kilometres away from the coast.
The advantages of nearshore projects are lower operating and maintenance costs and less complex grid connection procedures due to lower voltage levels. For these nearshore tenders, the connection cost for transmission of electricity to shore is included in a similar manner as that for offshore wind tenders, as described earlier.64
64 In contrast to these tendered nearshore projects, for other “nearshore projects” under the open door procedure, the wind project developer needs to pay for the connection costs to
Table 8 shows the remuneration levels for tendered offshore wind farms. The support per kWh generated in the lifetime of the wind farm may be in reality somewhat lower given that support expires after a generation of 20 TWh from Anholt and Horns Rev 3. A special clause excludes these offshore wind farms from receiving the feed-in price (as a CfD) when power market prices turn negative, though for a maximum of 300 hours per calendar year (§73(5), Danish Renewable Energy Act referring to the Anholt offshore wind farm). This clause hereby postpones the support in case of a large number of hours with negative prices in the spot market. Simultaneously, this may provide an incentive for providing regulating power (for further details on the down-ward regulation of offshore wind farms, see also Section 7.3).
An important characteristic of Danish tenders is the timely establishment of grid connection, guaranteed by the au-thorities. The connection costs from the offshore wind farm to the electricity grid are covered by the TSO Energinet.dk and then socialised among consumers. Thereby, uncertainty regarding timely connection to the transmission grid, which is crucial in terms of risk mitigation for offshore wind pro-jects, has been shifted from the project developers to the authorities, including Energinet.dk. The remaining uncer-tainty regarding the connection of the individual turbines lies with the developer, who also must pay fines if the con-nection of turbines does not follow the schedule laid out in the tendering agreement.
Compilation based on projects' websites for the offshore wind farms.
Overview of owners and developers of recent large-scale offshore wind farms. Table 9
Owner: developer/operator:
Horns Rev 2 DONG Energy AS DONG Energy Horns Rev 2 AS
Rødsand 2 SEAS NVE Energy Group (80%) / E.ON Climate and Renewables (20%)
E.ON Vind Sverige AB
Anholt DONG Energy AS (50%), PensionDanmark (30%), Pensionskassernes Administration (PKA) AS (20%)
DONG Energy – Anholt Offshore AS
Horns Rev 3 Vattenfall AB Vattenfall AB
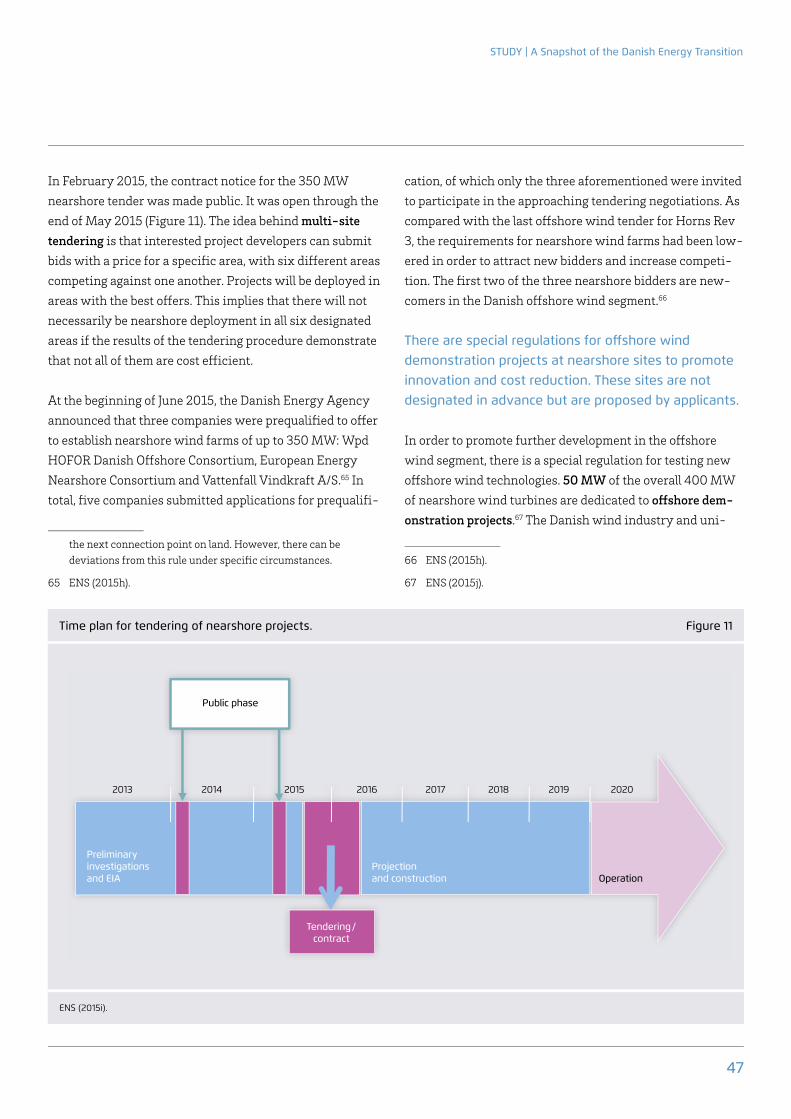
STUDY | A Snapshot of the Danish Energy Transition
47
cation, of which only the three aforementioned were invited to participate in the approaching tendering negotiations. As compared with the last off shore wind tender for Horns Rev 3, the requirements for nearshore wind farms had been low-ered in order to attract new bidders and increase competi-tion. The fi rst two of the three nearshore bidders are new-comers in the Danish off shore wind segment.66
There are special regulations for off shore wind demonstration projects at nearshore sites to promote innovation and cost reduction. These sites are not designated in advance but are proposed by applicants.
In order to promote further development in the off shore wind segment, there is a special regulation for testing new off shore wind technologies. 50 MW of the overall 400 MW of nearshore wind turbines are dedicated to off shore dem-onstration projects.67 The Danish wind industry and uni-
66 ENS (2015h).
67 ENS (2015j).
In February 2015, the contract notice for the 350 MW nearshore tender was made public. It was open through the end of May 2015 (Figure 11). The idea behind multi-site tendering is that interested project developers can submit bids with a price for a specifi c area, with six diff erent areas competing against one another. Projects will be deployed in areas with the best off ers. This implies that there will not necessarily be nearshore deployment in all six designated areas if the results of the tendering procedure demonstrate that not all of them are cost eff icient.
At the beginning of June 2015, the Danish Energy Agency announced that three companies were prequalifi ed to off er to establish nearshore wind farms of up to 350 MW: Wpd HOFOR Danish Off shore Consortium, European Energy Nearshore Consortium and Vattenfall Vindkraft A/S.65 In total, fi ve companies submitted applications for prequalifi -
the next connection point on land. However, there can be deviations from this rule under specifi c circumstances.
65 ENS (2015h).
2013 2014 2015 2016 2017 2018 2019 2020
Time plan for tendering of nearshore projects. Figure 11
ENS (2015i).
Public phase
Tendering/contract
Preliminary investigations and EIA
Projection and construction Operation
Agora Energiewende | A Snapshot of the Danish Energy Transition
48
There are two main criteria for awarding support:
→ Potential for development: Does the new technology being demonstrated represent an innovation in the field? Will this technology aid in driving down costs?
→ Commercialisation of innovation for future offshore wind farms: As opposed to purely research oriented pro-jects, demonstration projects ask whether new products and services can be commercialised subsequent to their successful demonstration (diffusion of new products).
There is a limit set at a maximum of eight offshore wind turbines that can apply for support as part of a demonstra-tion project. Support is granted only for the number of wind turbines necessary to demonstrate the object of research. The offshore wind test turbines installed as part of these demonstration projects are eligible for the following types of support: 70
→ A CfD scheme that guarantees support of 70 øre/kWh (around 9.5 ct/kWh) for the sum of an electricity produc-tion of 15,000 full load hours plus rotor area in m2 times 12.7 MWh/m2. For a typical wind turbine design, this cor-responds to a support payment duration of 50,000 full load hours, which is about twice as long as for regular on-shore wind turbines.
→ Electricity is sold on the Danish day-head market (spot market).
→ During hours with negative spot prices, there is no support payment.
→ There is no compensation for balancing costs.
70 ENS (2015k).
versities had asked that there be an option to receive sup-port for demonstration projects in order to take advantage of the potential for further cost reductions for electricity gen-erated by offshore wind farms.68
Generally speaking, these offshore demonstration projects comprise the last step in the development of new offshore wind turbines or components for these turbines. By way of contrast, the initial steps in the development of demonstra-tion projects and the testing of offshore wind turbine proto-types is not carried out on sea, but rather on land. Advanced test centres, for example the Lindø Offshore Renewables Centre, exist for testing components (e.g. blades and na-celles). After component testing, prototype test sites host the first wind turbine units of a new type (e.g. the Østerild test facility). The final step of an offshore demonstration project comprises the first offshore deployment of a wind turbine designed to “prove” the technology in the intended environ-ment, namely at sea. There are no designated areas for the demonstration projects. Instead, it is left to the developers of these offshore wind projects to apply for relevant sites that have the most suitable conditions for testing foundations and turbines. Typically, the demonstration projects are car-ried out in collaboration by wind turbine producers, compo-nent producers and project developers. Applicants need to have the capacity to establish offshore wind generation, in-cluding the capacity to carry out preliminary investigations and EIAs. The research and demonstration activities may involve operational aspects related to offshore wind farms, new types of foundations or other offshore wind farm ele-ments, electricity transmission as well as new types of in-stallation and service principles.69
68 ENS (2015k).
69 Cf. ENS (2015k).
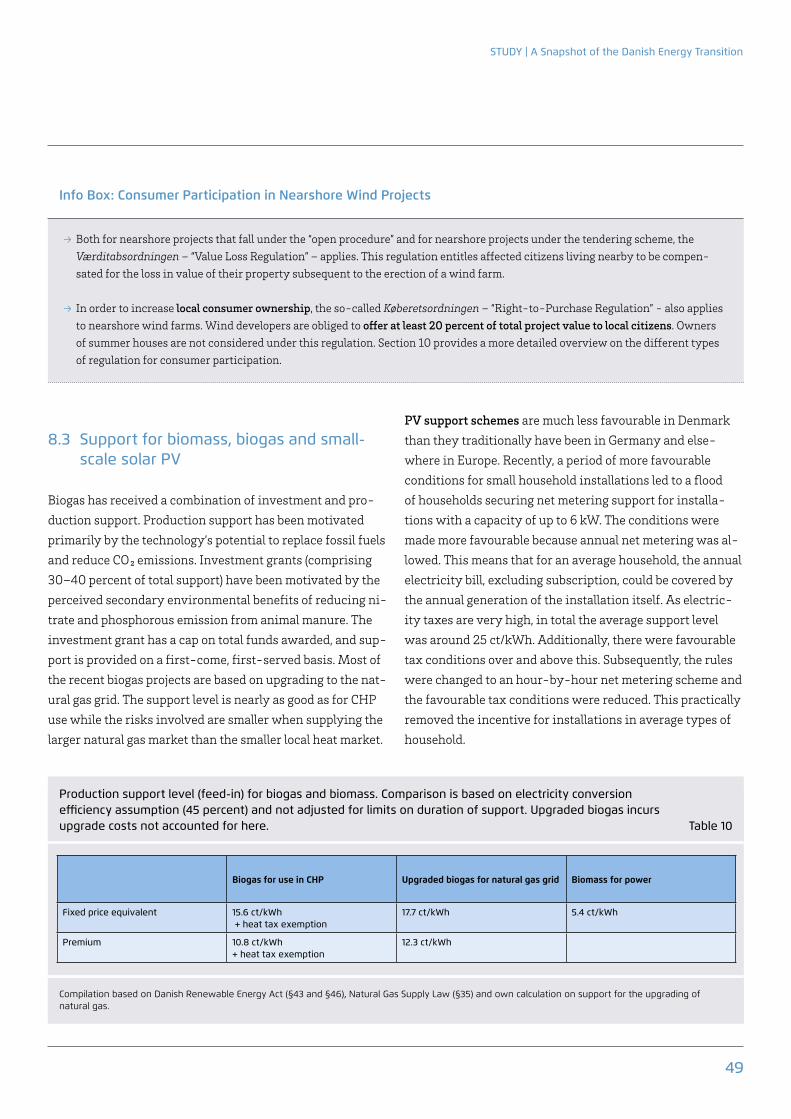
Study | A Snapshot of the danish Energy transition
49
PV support schemes are much less favourable in Denmark than they traditionally have been in Germany and else-where in Europe. Recently, a period of more favourable conditions for small household installations led to a flood of households securing net metering support for installa-tions with a capacity of up to 6 kW. The conditions were made more favourable because annual net metering was al-lowed. This means that for an average household, the annual electricity bill, excluding subscription, could be covered by the annual generation of the installation itself. As electric-ity taxes are very high, in total the average support level was around 25 ct/kWh. Additionally, there were favourable tax conditions over and above this. Subsequently, the rules were changed to an hour-by-hour net metering scheme and the favourable tax conditions were reduced. This practically removed the incentive for installations in average types of household.
8.3 Support for biomass, biogas and small-scale solar PV
Biogas has received a combination of investment and pro-duction support. Production support has been motivated primarily by the technology’s potential to replace fossil fuels and reduce CO₂ emissions. Investment grants (comprising 30–40 percent of total support) have been motivated by the perceived secondary environmental benefits of reducing ni-trate and phosphorous emission from animal manure. The investment grant has a cap on total funds awarded, and sup-port is provided on a first-come, first-served basis. Most of the recent biogas projects are based on upgrading to the nat-ural gas grid. The support level is nearly as good as for CHP use while the risks involved are smaller when supplying the larger natural gas market than the smaller local heat market.
Info Box: Consumer Participation in Nearshore Wind Projects
→ Both for nearshore projects that fall under the “open procedure” and for nearshore projects under the tendering scheme, the Værditabsordningen – “Value Loss Regulation” – applies. This regulation entitles affected citizens living nearby to be compen-sated for the loss in value of their property subsequent to the erection of a wind farm.
→ In order to increase local consumer ownership, the so-called Køberetsordningen – “Right-to-Purchase Regulation” - also applies to nearshore wind farms. Wind developers are obliged to offer at least 20 percent of total project value to local citizens. Owners of summer houses are not considered under this regulation. Section 10 provides a more detailed overview on the different types of regulation for consumer participation.
Compilation based on Danish Renewable Energy Act (§43 and §46), Natural Gas Supply Law (§35) and own calculation on support for the upgrading of natural gas.
Production support level (feed-in) for biogas and biomass. Comparison is based on electricity conversion efficiency assumption (45 percent) and not adjusted for limits on duration of support. Upgraded biogas incurs upgrade costs not accounted for here. Table 10
Biogas for use in CHP upgraded biogas for natural gas grid Biomass for power
Fixed price equivalent 15.6 ct/kWh + heat tax exemption
17.7 ct/kWh 5.4 ct/kWh
Premium 10.8 ct/kWh + heat tax exemption
12.3 ct/kWh
Agora Energiewende | A Snapshot of the Danish Energy Transition
50
For larger scale PV support, a feed-in tariff of 8.1 ct/kWh is paid for 10 years, followed by a support level of 5.4 ct/kWh.
Installations that qualify under certain criteria and that can be included in total annual allowances for new capacity (20 MW annually) may be entitled to receive higher support. This is provided on a sliding scale depending on the year of commissioning. The level is quite high for commissioning in 2014 and 2015 (17.2 and 14.9 ct/kWh, respectively), but in 2017, which is the last year this support will be provided, it will be reduced to 10 ct/kWh.
After an initial boom in residential PV installation, in 2012/13 the change in the net metering conditions practi-cally eliminated this market, but common PV installations on the rooftops of apartment blocks and commercial build-ings have continued to attract investment up to the 20 MW annual limit.

Study | A Snapshot of the danish Energy transition
51
The transmission network at the highest voltage level is comprised of 400 kV lines connecting large power plants to one another and interconnectors to abroad, with the Dan-ish grid at lower voltage levels. It is owned by Energinet.dk. The regional transmission network is at 132 kV East of the Big Belt and at 150 kV West of the Big Belt. It connects the 400 kV grid with the distribution grid (Figure 12). Usually, offshore wind farms are also connected to this voltage level (except for Anholt, which is connected via a 220 kV cable). Local grid companies own the distribution grid at 60 to 10 kV that transports electricity from the higher voltage levels to final household consumers.
In terms of system kilometres, the transmission grid owned by Energinet.dk is comprised of approximately 4,900 kilo-metres of overhead lines and approximately 1,900 kilome-tres of cables, with 185 stations.71
71 Energinet.dk (2014f).
9.1 Danish grid expansion: Coherent planning across voltage levels and undergrounding for the beautification of the landscape
Until now, grid expansion poses no obstacle to the imple-mentation of the Danish energy transition. This can be at-tributed in large part to the role of interconnectors (see Sec-tion 9.2). Even within Denmark, grid expansion has been sufficient to accommodate rising shares of wind energy and changes in the overall energy system. For internal Danish grid expansion there is a coherent and holistic planning ap-proach across different energy sectors.
The TSO Energinet.dk owns both the Danish gas and elec-tricity transmission systems. The electrical transmission system owned by Energinet.dk is comprised of lines over 100 kilovolt (kV). Energinet.dk is a state-owned enterprise that was established in December 2004, subsequent to the merger of the four previous transmission companies Eltra, Elkraft System, Elkraft Transmission and Gastra.
9. Grid expansion as a cornerstone of the green energy transition
Major findings and lessons learned:
→ Interconnectors are the most important flexibility option for integrating Danish wind energy. Denmark is the hub between the Nordic and the German electricity systems, with interconnectors to Norway, Germany and Sweden. Internal bottlenecks caused by deferred grid expansion in neighbouring countries may impact Danish market integration and electricity export opportunities.
→ Internal Danish grid expansion has been sufficient so far to accommodate rising shares of wind energy.
→ There is a multitude of plans that act in concert as a coherent and holistic planning approach for the future, including the Grid Expansion Plan; the Kabelhandlingsplan for undergrounding overhead lines; and the System Plan, which addresses cross-sectoral effects with other energy sectors.
→ The Danish network expansion principle is based on: •Layingnew400kVlinesasundergroundcablesasageneralrule. •Undergroundingofnewandexisting132/150kVlinesby2030. •“Beautification”ofthealreadyexisting400kVoverheadlinesthroughpartialundergroundingormeasuressuchas
new transmission towers with lower impact on the surrounding landscape.
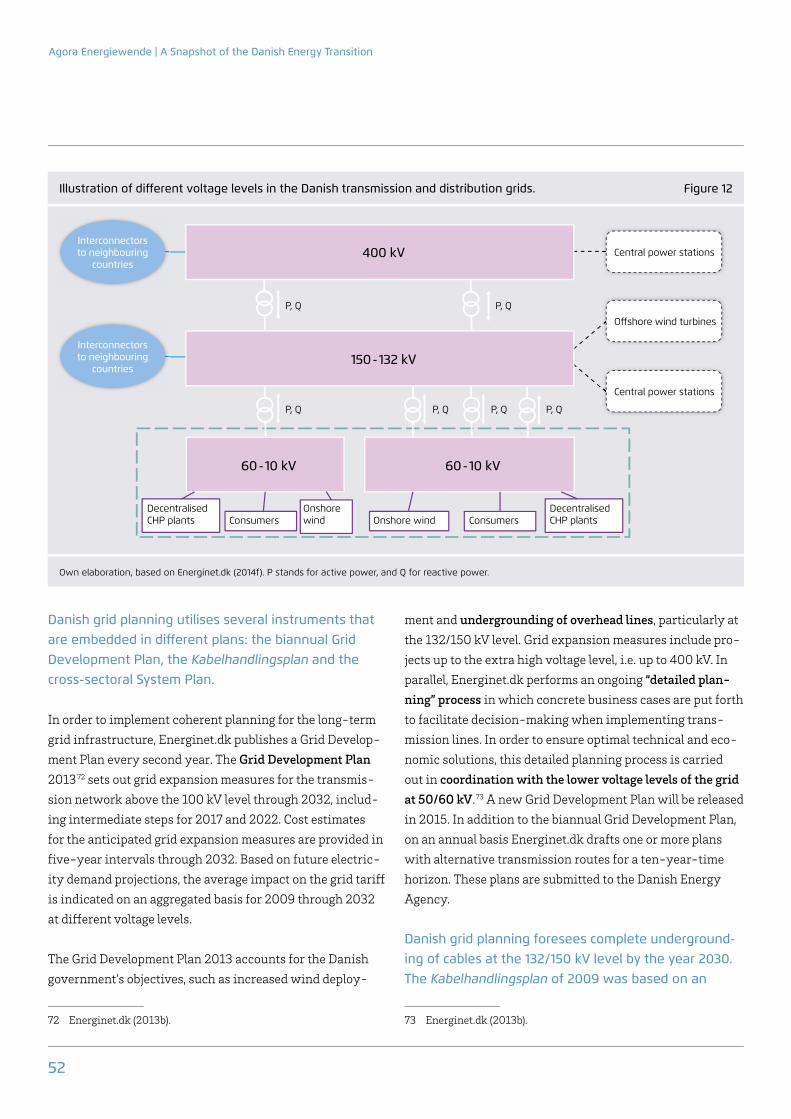
Agora Energiewende | A Snapshot of the Danish Energy Transition
52
ment and undergrounding of overhead lines, particularly at the 132/150 kV level. Grid expansion measures include pro-jects up to the extra high voltage level, i.e. up to 400 kV. In parallel, Energinet.dk performs an ongoing “detailed plan-ning” process in which concrete business cases are put forth to facilitate decision-making when implementing trans-mission lines. In order to ensure optimal technical and eco-nomic solutions, this detailed planning process is carried out in coordination with the lower voltage levels of the grid at 50/60 kV.73 A new Grid Development Plan will be released in 2015. In addition to the biannual Grid Development Plan, on an annual basis Energinet.dk drafts one or more plans with alternative transmission routes for a ten-year-time horizon. These plans are submitted to the Danish Energy Agency.
Danish grid planning foresees complete underground-ing of cables at the 132/150 kV level by the year 2030. The Kabelhandlingsplan of 2009 was based on an
73 Energinet.dk (2013b).
Danish grid planning utilises several instruments that are embedded in diff erent plans: the biannual Grid Development Plan, the Kabelhandlingsplan and the cross-sectoral System Plan.
In order to implement coherent planning for the long-term grid infrastructure, Energinet.dk publishes a Grid Develop-ment Plan every second year. The Grid Development Plan 2013 72 sets out grid expansion measures for the transmis-sion network above the 100 kV level through 2032, includ-ing intermediate steps for 2017 and 2022. Cost estimates for the anticipated grid expansion measures are provided in fi ve-year intervals through 2032. Based on future electric-ity demand projections, the average impact on the grid tariff is indicated on an aggregated basis for 2009 through 2032 at diff erent voltage levels.
The Grid Development Plan 2013 accounts for the Danish government’s objectives, such as increased wind deploy-
72 Energinet.dk (2013b).
Illustration of diff erent voltage levels in the Danish transmission and distribution grids. Figure 12
Own elaboration, based on Energinet.dk (2014f). P stands for active power, and Q for reactive power.
Interconnectors to neighbouring
countries
Interconnectors to neighbouring
countries
400 kV
150 - 132 kV
60 - 10 kV 60 - 10 kV
Central power stations
Central power stations
Off shore wind turbines
Decentralised CHP plants Consumers
P, Q
P, Q P, Q P, Q P, Q
P, Q
Onshore wind Onshore wind Consumers
Decentralised CHP plants

Study | A Snapshot of the danish Energy transition
53
In general, the Kabelhandlingsplan goes far beyond the un-dergrounding of existing overhead transmission lines. The proposed measures also include the restructuring of the transmission grid and construction of new substations.77
Reassessments of both the Grid Development Plan and the Kabelhandlingsplan are undertaken every other year in order to account for changes in the system. These changes may include expected interconnector capacity to neigh-bouring countries, political goals with respect to offshore and nearshore wind turbines, and development of Danish production capacity in general, but they also may reflect other political circumstances such as financing concerns.
As a general rule, new 400 kV transmission lines are laid as underground cables.
Figure 13 shows different network expansion principles that were identified as possible options for the Danish elec-tricity grid.78 For the extra high voltage level (400 kV), there exists a range of options from complete cable underground-ing of all transmission routes to undergrounding only new transmission lines. Principle C serves as the basis for the planning of the future transmission grid. Under Principle C, the following planning measures are applied:
→ As a general rule, new 400 kV transmission lines are laid as underground cables. Furthermore, new transmission towers can be erected along already existing overhead transmission routes.
→ Undergrounding of cables is foreseen for the 132/150 kV grid.
→ The “beautification” of existing 400 kV overhead transmission lines.
77 Energinet.dk (2013b).
78 Elinfrastrukturudvalget (2008).
Energy Agreement from 2008 that called for a cable undergrounding plan for the 132/150 kV level and a “beautification plan” for the 400 kV level.
The first Kabelhandlingsplan was elaborated by Energinet.dk in cooperation with regional TSOs,74 including contribu-tions from environmental centres, in 2009.75 In general, the Kabelhandlingsplan 2009 set out undergrounding meas-ures for the entire 132/150 kV grid. After its release, it was backed by most Danish political parties, with the excep-tion of Enhedslisten. The “basis plan” sets out complete undergrounding of the entire 132/150 kV grid by the year 2040. Additionally, the plan includes two scenarios with an “accelerated implementation route”: 76
→ Scenario 1: Partially accelerated undergrounding of ca-bles: Overhead lines in areas around larger cities are pri-oritised within the first 10 years. Overhead lines in natu-ral areas or landscapes that are of national interest will be prioritised for undergrounding within the first 20 years.
→ Scenario 2: Accelerated undergrounding of cables: All overhead lines are removed within a 20 year period.
The political parties supported the “accelerated under-grounding of cables” scenario. The removal of all overhead lines in the 132/150 kV grid within a period of twenty years means that undergrounding at this voltage level will be completed by 2030. In addition, the parties were in favour of a prioritisation of the undergrounding of overhead lines that are close to residential areas and urban areas as early as 2020.
The initial Kabelhandlingsplan 2009 set out the under-grounding of the 3,200 kilometres of 132/150 kV overhead transmission lines then in existence. It further foresaw the undergrounding of newly planned 132/150 kV cables. The estimated cost was 14.5 billion Danish crowns (DKK), which is slightly less than 2 billion euros.
74 At that time, there were still regional TSOs that owned the high voltage levels.
75 Energinet.dk (2009).
76 Energinet.dk (2009).

Agora Energiewende | A Snapshot of the Danish Energy Transition
54
viewpoint, particular attention is paid to impacts on people (buildings and urban areas), international natural protec-tion areas and national parks as well as impacts on valuable landscape (coastal zones, protected areas). However, the list of positive impacts of cable undergrounding also takes vari-ous other aspects into account, such as the increased rec-reational value when there are no more overhead transmis-sion lines along national bicycle routes.81
As for grid expansion, 2,350 kilometres of new cables need to be laid at the 132/150 kV level by 2030.82
Aggregated cost estimates for the long-term 132/150 kV grid amount to 12.3 billion Danish crowns,83 which translates to approximately 1.66 billion euros.84
81 Energinet.dk (2009), p. 13.
82 The total goal is 2,600 kilometres of new cables by 2030, of which around 250 kilometres have been laid so far.
83 Energinet.dk (2013b).
84 Note that the Grid Development Plan and the Kabelhandlingsplan
Prior to 2008, Principle E had been in line with guidelines existing previously.79 The switch to Principle C meant mov-ing away from erecting new overhead lines to laying only underground cables as the standard approach to grid expan-sion.
Undergrounding of 132/150 kV lines and “beautifica-tion” of existing overhead transmission lines at the 400 kV level constitute the other two cornerstones for Danish grid expansion.
As of today, 2,900 kilometres of overhead lines at the 132/150 kV level still need to be replaced by underground cables by 2030. 300 kilometres of overhead lines have been removed thus far. The prioritisation of lines is based on a variety of criteria, such as remaining life span, proximity to residential areas, technical need for transmission capac-ity and prices for reinvestment.80 From an environmental
79 ENS (2012).
80 Energinet.dk (2013b).
Network expansion principles for the electricity grid. Principle C is currently in eff ect for future grid planning. Figure 13
Own translation based on Elinfrastrukturudvalget (2008), p. 7.
A
Complete cable undergrounding
Undergrounding of cables in existing 132/150 kV-grid as laid down by separate Kabelhandlingsplan
“Beautifi cation“ of existing 400 kV-grid by means of transmission towers with lower impact on the landscape + undergrounding of cables in especially selected routes
B
New lines as underground
cables
C
New lines as underground cables
and new transmission towers in already
existing transmission routes
D
New overhead transmission lines where there are
already overhead lines
E
Newoverhead
transmission lines
F
No expansion of electricty
grid400 kV
400 kV
132 kV/150 kV

Study | A Snapshot of the danish Energy transition
55
der exchange by means of interconnectors to neighbouring countries. From an economic and security of supply point of view, Energinet.dk’s analyses find that the wind based development track for the Danish energy transition is the most feasible solution (for a description of the wind sce-nario, see Section 4.2). The advantage of the wind-based track is that it can be implemented independently of the speed at which the energy transition takes place in other countries.87 With respect to biomass, increasing deployment entails higher sensitivity to global biomass products as well as prices. Furthermore, Energinet.dk (2014d) points out that the goal of achieving a fossil fuel-free heat sector by 2035 may undermine the integration of wind power and the flex-ibility required for integration if the utilisation of biomass is the major instrument for realising the target.88 For both the electricity and gas sectors, the System Plan 2014 includes chapters on security of supply, the grid, the market, and Eu-ropean regulations such as European network codes, thus taking interdependencies into account.
9.2 Interconnectors from Denmark to neighbouring countries: The major flexibility option for wind integration
Denmark has electricity interconnectors to Norway, Swe-den and Germany. These interconnectors are a physi-cal prerequisite for achieving Nordic as well as European market integration. By the same token, they can be used for smoothing variable renewable power production at the re-gional level by enabling cross-border exchanges of electric-ity. For the integration of Danish wind energy, the “green battery” afforded by the use of Nordic hydropower has con-stituted one of the most important flexibility options since the very beginning of Nordic market integration. With 6.4 GW of net transfer capacity (and peak demand of 6 GW), Denmark is able to sell electricity during times of high wind power production and to import during times of low wind power feed-in. This is further analysed in Ea (2015), a study undertaken on behalf of Agora Energiewende.89
87 Energinet.dk (2014d).
88 Energinet.dk (2014d).
89 An in-depth overview of the utilisation of inter-
In order to monitor progress, the Grid Development Plan provides an overview of the current status of the under-grounding of cables. The Kabelhandlingsplan serves as a reference for progress in implementation.
The “beautification” of the landscape with overhead trans-mission lines at the 400 kV level is implemented either by: 85
→ replacing existing overhead lines by partial under-grounding over shorter distances,
→ or by short-distance adjustments to existing transmis-sion line routes – for example, by erecting transmission towers with lower impact on the landscape.
The first six areas where these “beautification measures” will be carried out are Aggersund, Vejle Ådal, Lillebælt, Årslev Engsø, Roskilde Fjord and Kongernes North Zealand. Originally, all measures were scheduled for implementa-tion within five years. However, implementation has been postponed for the latter three sites. This delay is due to fi-nancing issues. A portion of the projected budget was real-located to help finance the Energy Agreement 2012 and to finance the Agreement on the Strategy for Solar PV of 2012. The projected total cost for all six beautification measures amounts to 1.6 billion Danish crowns,86 which translates to approximately 0.22 billion euros.
Security of supply plays a large role in the develop-ment of the future gas and electricity grid, as shares of fluctuating wind power production increase.
The “System Plan” reflects a coherent and holistic plan-ning approach to finding solutions across sectors, actors, authorities and interconnections to neighbouring coun-tries. The plan is released each December by Energinet.dk. The central question for future planning is how to optimally coordinate increasing wind deployment, domestic thermal production, utilisation of biomass and greater cross-bor-
2013 indicate the length of overhead transmission lines in system kilometres (as opposed to route length).
85 ENS (2012).
86 Energinet.dk (2013b).
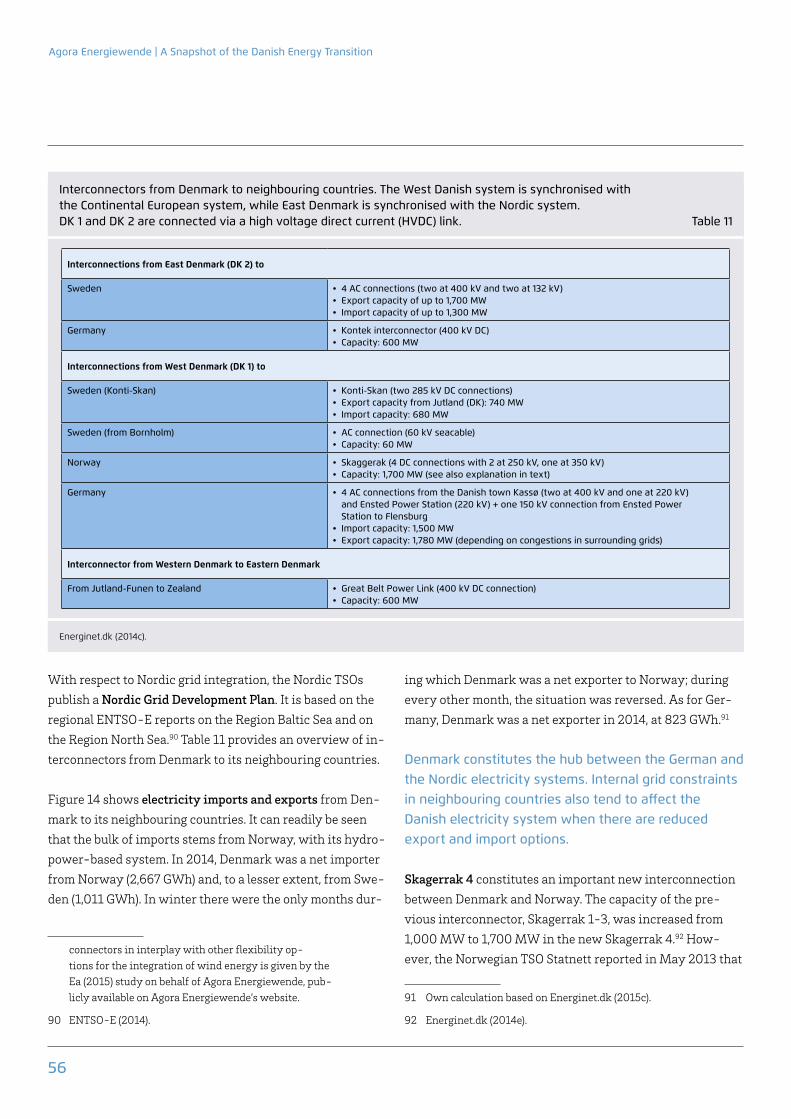
Agora Energiewende | A Snapshot of the Danish Energy Transition
56
ing which Denmark was a net exporter to Norway; during every other month, the situation was reversed. As for Ger-many, Denmark was a net exporter in 2014, at 823 GWh.91
Denmark constitutes the hub between the German and the Nordic electricity systems. Internal grid constraints in neighbouring countries also tend to affect the Danish electricity system when there are reduced export and import options.
Skagerrak 4 constitutes an important new interconnection between Denmark and Norway. The capacity of the pre-vious interconnector, Skagerrak 1-3, was increased from 1,000 MW to 1,700 MW in the new Skagerrak 4.92 How-ever, the Norwegian TSO Statnett reported in May 2013 that
91 Own calculation based on Energinet.dk (2015c).
92 Energinet.dk (2014e).
With respect to Nordic grid integration, the Nordic TSOs publish a Nordic Grid Development Plan. It is based on the regional ENTSO-E reports on the Region Baltic Sea and on the Region North Sea.90 Table 11 provides an overview of in-terconnectors from Denmark to its neighbouring countries.
Figure 14 shows electricity imports and exports from Den-mark to its neighbouring countries. It can readily be seen that the bulk of imports stems from Norway, with its hydro-power-based system. In 2014, Denmark was a net importer from Norway (2,667 GWh) and, to a lesser extent, from Swe-den (1,011 GWh). In winter there were the only months dur-
connectors in interplay with other flexibility op-tions for the integration of wind energy is given by the Ea (2015) study on behalf of Agora Energiewende, pub-licly available on Agora Energiewende’s website.
90 ENTSO-E (2014).
Energinet.dk (2014c).
Interconnectors from Denmark to neighbouring countries. The West Danish system is synchronised with the Continental European system, while East Denmark is synchronised with the Nordic system. DK 1 and DK 2 are connected via a high voltage direct current (HVDC) link. Table 11
Interconnections from East denmark (dK 2) to
Sweden • 4 AC connections (two at 400 kV and two at 132 kV)• Export capacity of up to 1,700 MW• Import capacity of up to 1,300 MW
Germany • Kontek interconnector (400 kV DC)• Capacity: 600 MW
Interconnections from West denmark (dK 1) to
Sweden (Konti-Skan) • Konti-Skan (two 285 kV DC connections)• Export capacity from Jutland (DK): 740 MW• Import capacity: 680 MW
Sweden (from Bornholm) • AC connection (60 kV seacable)• Capacity: 60 MW
Norway • Skaggerak (4 DC connections with 2 at 250 kV, one at 350 kV) • Capacity: 1,700 MW (see also explanation in text)
Germany • 4 AC connections from the Danish town Kassø (two at 400 kV and one at 220 kV) and Ensted Power Station (220 kV) + one 150 kV connection from Ensted Power Station to Flensburg
• Import capacity: 1,500 MW• Export capacity: 1,780 MW (depending on congestions in surrounding grids)
Interconnector from Western denmark to Eastern denmark
From Jutland-Funen to Zealand • Great Belt Power Link (400 kV DC connection)• Capacity: 600 MW
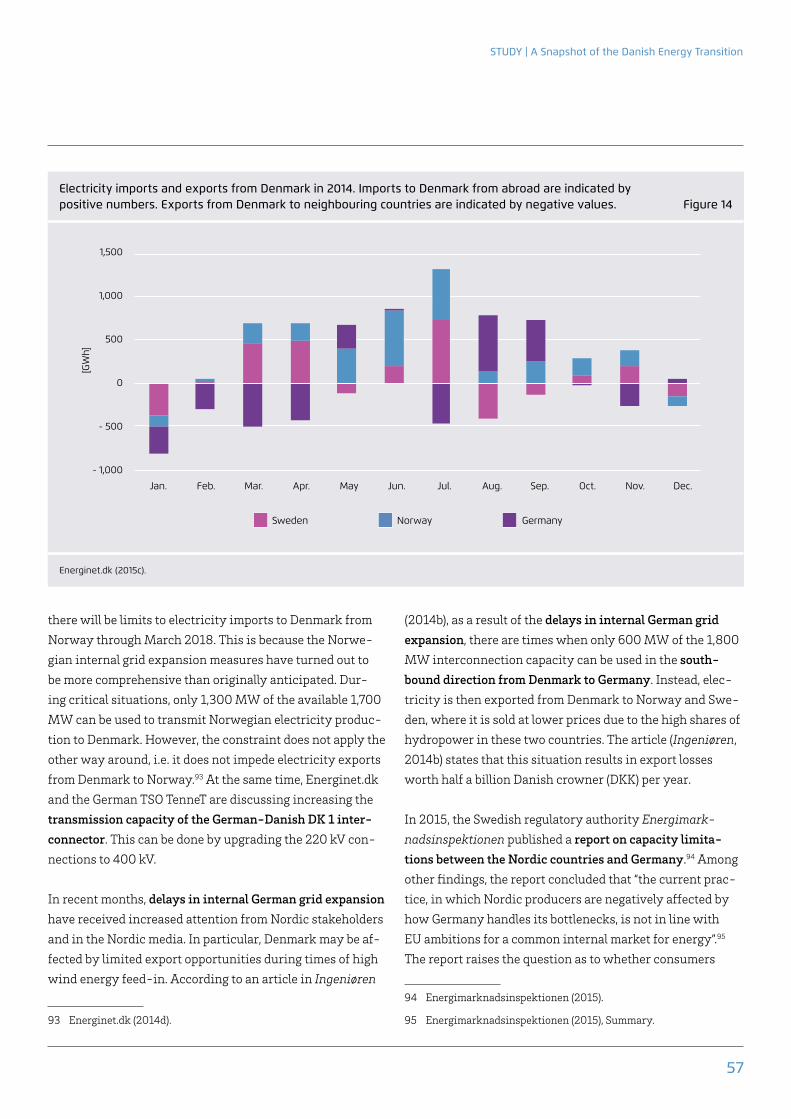
Study | A Snapshot of the danish Energy transition
57
(2014b), as a result of the delays in internal German grid expansion, there are times when only 600 MW of the 1,800 MW interconnection capacity can be used in the south-bound direction from Denmark to Germany. Instead, elec-tricity is then exported from Denmark to Norway and Swe-den, where it is sold at lower prices due to the high shares of hydropower in these two countries. The article (Ingeniøren, 2014b) states that this situation results in export losses worth half a billion Danish crowner (DKK) per year.
In 2015, the Swedish regulatory authority Energimark-nadsinspektionen published a report on capacity limita-tions between the Nordic countries and Germany.94 Among other findings, the report concluded that “the current prac-tice, in which Nordic producers are negatively affected by how Germany handles its bottlenecks, is not in line with EU ambitions for a common internal market for energy”.95 The report raises the question as to whether consumers
94 Energimarknadsinspektionen (2015).
95 Energimarknadsinspektionen (2015), Summary.
there will be limits to electricity imports to Denmark from Norway through March 2018. This is because the Norwe-gian internal grid expansion measures have turned out to be more comprehensive than originally anticipated. Dur-ing critical situations, only 1,300 MW of the available 1,700 MW can be used to transmit Norwegian electricity produc-tion to Denmark. However, the constraint does not apply the other way around, i.e. it does not impede electricity exports from Denmark to Norway.93 At the same time, Energinet.dk and the German TSO TenneT are discussing increasing the transmission capacity of the German-Danish DK 1 inter-connector. This can be done by upgrading the 220 kV con-nections to 400 kV.
In recent months, delays in internal German grid expansion have received increased attention from Nordic stakeholders and in the Nordic media. In particular, Denmark may be af-fected by limited export opportunities during times of high wind energy feed-in. According to an article in Ingeniøren
93 Energinet.dk (2014d).
[GW
h]
Electricity imports and exports from Denmark in 2014. Imports to Denmark from abroad are indicated by positive numbers. Exports from Denmark to neighbouring countries are indicated by negative values. Figure 14
Energinet.dk (2015c).
1,500
1,000
500
0
- 500
- 1,000
Jan. Feb. Mar. Apr. Jun. Jul. Aug. Sep. Oct. Dec.Nov.May
NorwaySweden Germany

Agora Energiewende | A Snapshot of the Danish Energy Transition
58
reliable network operation - and the connection of offshore wind power farms, respectively.97 The drafting process in-cludes multiple rounds with public consultations for active stakeholder involvement. The central importance of inter-nal German grid expansion has also been affirmed in the White Paper released by the German Ministry for Economic Affairs and Energy: strong grids are prerequisite for a well-functioning electricity market so that market actors can act as if there were no bottlenecks within the single German price zone.98
97 More information is available in English on this website: http://www.netzentwicklungsplan.de/en
98 BMWi (2015).
in northern Germany and Nordic producers should have to suffer from the way that Germany manages its internal bottlenecks. One proposal put forth by the report for recti-fying this situation is the division of Germany into bidding zones.96
An explanation of the German policy on grid expansion would exceed the scope of this paper. However, at this point it should be mentioned that Germany has undertaken various measures for accelerating and facilitating its grid expansion. The four German TSOs draft an annual Grid De-velopment Plan as well as an Offshore Grid Development Plan. These plans indicate all effective measures for the necessary optimisation, development and expansion of the network for the next ten years in order to ensure safe and
96 Energimarknadsinspektionen (2015), p. 28. Other sources addressing the issue (also partially representing the views of the Danish and Swedish Energy Associations) are, e.g. Energiwatch (2015a and 2015b) and Dansk Energi (2015a and 2014a).

Study | A Snapshot of the danish Energy transition
59
10.1 Consumer participation and wind projects
Prior to liberalisation, there had been a long tradition of consumer ownership in Denmark. Consumer-owned coop-eratives and municipalities established and jointly oper-ated large power stations and transmission lines.101 Early on – as early as 1999 – the new Danish Electricity Supply Act stipulated a gradual opening of the market, including the unbundling of generation and trade from the transmission and distribution segments. While introducing liberalisation, the Electricity Supply Act of 1999 (§40) also included provi-sions on obligatory consumer influence with respect to the appointment or election of representatives in grid compa-nies within their supply area.
This tradition of consumer influence still prevails today. Notably, consumer influence also extends to the deploy-ment of renewable energy. Since the beginning of the 1980s, cooperatives have been developing wind projects with joint ownership. The Danish Renewable Energy Act, which was first adopted in 2009, contains several measures (§§ 6–21) that support the deployment of wind turbines from a con-
101 Olsen and Skytte (2002).
Consumer acceptance, possibly even participation, is crucial for the implementation of the energy transition. In gen-eral, there is broad support for the green energy transition among the Danish population. While yielding environmen-tal benefits, the energy transition also provides opportuni-ties for a green growth economy and domestic development of green solutions that in turn may yield an opportunity for Denmark to take the lead in global technological innovation.
According to one survey conducted by YouGov on behalf of the Danish Energy Association, even half of the Danes would be willing to pay more for the green energy transition than they are paying today.99 Nevertheless, the issues of ac-ceptance and rising costs are gaining increasing attention as of late; Danish industry is particularly concerned about ris-ing costs. This section will focus on consumer participation, notably in wind projects, and on the financing of support, as reflected in the final consumers’ electricity bills. 100
99 Aagaard (2014).
100 This section focuses on the cost and participation/acceptance issue. Demand side flexibility is covered by the study carried out by Ea (2015) on behalf of Agora Energiewende.
10. Consumers: Acceptance, participation and costs of the green energy transition
Major findings and lessons learned:
→ In general, there is broad public support for the Danish energy transition. As sites for new wind projects grow scarcer and more renewables are deployed, the question of acceptance and the cost debate have become more pronounced.
→ Denmark has a long tradition of consumer ownership. Consumer participation and support for measures to increase acceptance of new local wind projects are also reflected in different types of regulations contained in the Renewable Energy Act.
→ Especially for Danish industry, the cost debate on financing renewables (by means of the so-called PSO tariff as part of the final electricity price) has been gaining attention across Denmark over the past few years. In 2014, a reduction of the PSO component was introduced by shifting some of the funding to the federal budget.

Agora Energiewende | A Snapshot of the Danish Energy Transition
60
cal wind projects. Wind project developers are required at the minimum to announce the project in the local newspa-per and to offer shares of at least 20 percent of the project’s value (cost price). One share corresponds to the price of around 1,000 kWh, which amounts to approximately 400–536 euros.103 The calculation of the value of a wind energy project is based on the average production over a period of 20 years. Energinet.dk is the administrator of this regula-tion.
As laid out in the Værditabsordningen (“Value loss regula-tion”, §§6–12), a project developer of wind turbines is obliged to compensate residents for the loss in value of real estate induced by the deployment of wind turbines. The assess-ment is conducted by an outside agency but, alternatively, real estate owners can also conclude a voluntary agree-ment with the wind project developer on their own. If the loss in value is greater than one percent, then the loss needs to be fully compensated. Generally, claims for compensa-tion need to be made before the wind turbine has been in-stalled. The wind project developer is required to present the consequences of a new wind project and to inform affected stakeholders during a public meeting held within the hear-ing period of the Danish Planning Law and, at the latest, four weeks before the municipal planning process is concluded.
In order to provide information on wind energy to stake-holders and the interested public, various authorities have jointly established a website called vindinfo.dk (also avail-able in English). The information portal can be accessed by means of three different channels for citizens, municipali-ties and wind project developers; in this way, information is tailored to the interests of each group, from the perspective of planning, financing, environmental impact and legislation to possibilities for consumer involvement.
With the high deployment rates of wind turbines, the creation of public acceptance for new wind projects has also become a growing challenge in Denmark in recent years.
103 ENS (2015d).
sumer participation and acceptance point of view. A number of provisions have been adopted in this respect.
Four different regulations contained in the Renewable Energy Act aim at ensuring consumer partici pation and compensation regarding wind projects.
Based on Den grønne ordning (“Green regulation” §§18–20), municipalities can apply at Energinet.dk for financial sup-port for projects that increase public acceptance of the de-ployment of wind turbines. The projects may include the enhancement of the landscape and potential recreational development within the municipality as well as the pro-motion of cultural and educational activities. The amount of the support depends on the wind project in place, based on the number and size of wind turbines installed and their full load production hours (0.4 øre/kWh for 22,000 full load hours). Depending on its size, support corresponds to ap-proximately 200,000 DKK per wind turbine,102 which is around 26,800 euros.
With the Garantifonden (“Guarantee fund” §21), Energinet.dk can decide whether to guarantee a loan to local initiative groups, such as wind energy cooperatives. The loan can be used for carrying out assessments related to the site or for technical and economic analyses; the loan may also be used to prepare applications for local wind energy projects. How-ever, the regulation does not apply to onshore wind farms that are connected to their own consumption installation or to offshore wind farms that participate in the tender-ing scheme. Eligible initiative groups must be comprised of at least ten members, of which more than half must live in the municipality where the project is to be deployed – or, for offshore wind farms that do not participate in the tender-ing scheme, where the community is within 16 kilometres of the coast line where the offshore wind farm is to be con-structed.
Under the Køberetsordningen (“Purchase right regulation” §§13-17), citizens living up to 4.5 kilometres away from new wind turbines are eligible to participate in ownership of lo-
102 ENS (2015c).

Study | A Snapshot of the danish Energy transition
61
10.2 Financing of support and effects on consumer tariffs
In Denmark, the support costs for renewables have been fi-nanced primarily by a so-called PSO (Public Service Obliga-tion) surcharge that all electricity consumers have to pay as part of their electricity bill. The PSO tariff includes support payments – such as for renewables – as well as a smaller portion related to research activities initiated by the TSO Energinet.dk. In this way, the public budget has only been responsible for a minor part of the total financing of support payments for renewables. This may change in the future, as there is increasing pressure to reduce the PSO tariff on in-dustrial electricity bills, just like in Germany.
In general, the electricity price for final consumers consists of the following elements:
→ Payment for electricity, → Transport costs (network tariffs),
A particular challenge involves local protest against individ-ual projects, which could lead to the postponement or even suspension of projects. The situation differs widely among municipalities. The installation of new wind turbines has generally been met by greater acceptance in West Jutland. This may be attributed to different factors, such as lower land prices, employment of local residents in the wind in-dustry or participation by means of consumer ownership.104 The situation is becoming more complex as installation sites for new onshore wind farms grow increasingly scarce. An unusual step was taken by Vattenfall at the beginning of 2015. In order to establish a new onshore wind farm, Vat-tenfall bought twenty properties from residents of Nørrekær Enge nearby Løgstør at the Limfjord.105
104 Kokkegård (2014).
105 Kokkegård (2015).
[ct
/ kW
h]
Composition of electricity retail price in August 2015 for fi nal electricity household consumers (4,000 kWh) in [ct/kWh]. Figure 15
Own elaboration based on data by Dansk Energi (2015b), with conversion rate DKK 7.45662 = 1 euro (calculated as of 30.08.2015).
35
30
25
20
15
10
5
0
Subscription
Commercial electricity
Local network tariff
Higher voltage levels
Subscription (network)
Grid and system tariff
Electricity and supplement charge
PSO
VAT

Agora Energiewende | A Snapshot of the Danish Energy Transition
62
the past few years. Figure 16 illustrates the evolution of the PSO as the rising tariff element for customers in West Den-mark through 2014/15. Notably, the PSO tariff has been ris-ing in parallel with the expansion of renewable generation capacity. This trend can be attributed in particular to the in-creased deployment of wind power capacity. In recent years, offshore wind energy has been the major driver for rising support payments. The increase in the quarterly PSO tariff observed in Figure 16 is caused by additional offshore wind capacity and, to some extent, newly installed PV capacity. The connection of the Anholt offshore wind farm increased the support payments substantially. This is reflected in the rising PSO tariff concomitant with the first connections of Anholt in the fall of 2012 through its completion in June 2013 – though with a slight delay in impact on the PSO tariff.
For large industrial customers that pay the full PSO component (though they are exempted from the electricity tax and the value added tax), the PSO tariff corresponds to around 25 per-cent of total electricity costs. Including the PSO surcharge and network charges, the final electricity price for industrial cus-
→ PSO surcharge, and → other charges by the government and value added tax (VAT).
The PSO tariff is determined on a quarterly basis and regu-larly published on the TSO Energinet.dk’s website. The PSO component of 2.9 ct/kWh in the third quarter of 2015 accounts for nearly 10 percent of the retail price that a resi-dential customer incurs for electricity, including all tax elements (Figure 15). By comparison, the German levy for renewable energy (the so-called “EEG-Umlage”) currently amounts to approximately 6.2 ct/kWh and is more than twice as high as the PSO.
Similarly to the situation in Germany, the debate over the cost of financing the energy transition is gaining momentum in Denmark. This concerns industrial electricity consumers in particular.
The discussion concerning cost of support in Denmark was triggered by a considerable increase of the PSO tariff over
Quarterly PSO tariff for customers in Western Denmark 2005-Q2-2015 Figure 16
Energinet.dk.
4
3
2
1
0
[c€
/ kW
h]
2005 2006 2007 2008 2009 2010 2011 2012 2013 20152014
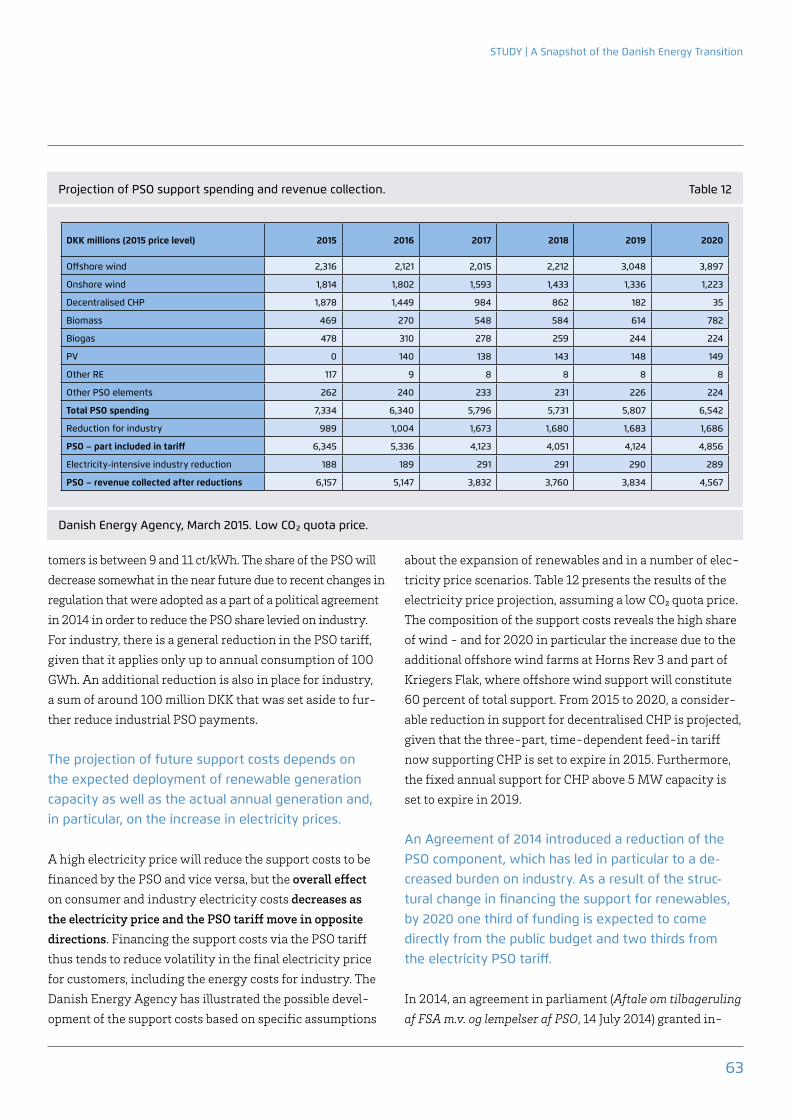
Study | A Snapshot of the danish Energy transition
63
about the expansion of renewables and in a number of elec-tricity price scenarios. Table 12 presents the results of the electricity price projection, assuming a low CO₂ quota price. The composition of the support costs reveals the high share of wind - and for 2020 in particular the increase due to the additional offshore wind farms at Horns Rev 3 and part of Kriegers Flak, where offshore wind support will constitute 60 percent of total support. From 2015 to 2020, a consider-able reduction in support for decentralised CHP is projected, given that the three-part, time-dependent feed-in tariff now supporting CHP is set to expire in 2015. Furthermore, the fixed annual support for CHP above 5 MW capacity is set to expire in 2019.
An Agreement of 2014 introduced a reduction of the PSO component, which has led in particular to a de-creased burden on industry. As a result of the struc-tural change in financing the support for renewables, by 2020 one third of funding is expected to come directly from the public budget and two thirds from the electricity PSO tariff.
In 2014, an agreement in parliament (Aftale om tilbageruling af FSA m.v. og lempelser af PSO, 14 July 2014) granted in-
tomers is between 9 and 11 ct/kWh. The share of the PSO will decrease somewhat in the near future due to recent changes in regulation that were adopted as a part of a political agreement in 2014 in order to reduce the PSO share levied on industry.For industry, there is a general reduction in the PSO tariff, given that it applies only up to annual consumption of 100 GWh. An additional reduction is also in place for industry, a sum of around 100 million DKK that was set aside to fur-ther reduce industrial PSO payments.
The projection of future support costs depends on the expected deployment of renewable generation capacity as well as the actual annual generation and, in particular, on the increase in electricity prices.
A high electricity price will reduce the support costs to be financed by the PSO and vice versa, but the overall effect on consumer and industry electricity costs decreases as the electricity price and the PSO tariff move in opposite directions. Financing the support costs via the PSO tariff thus tends to reduce volatility in the final electricity price for customers, including the energy costs for industry. The Danish Energy Agency has illustrated the possible devel-opment of the support costs based on specific assumptions
Danish Energy Agency, March 2015. Low CO₂ quota price.
Projection of PSO support spending and revenue collection. Table 12
dKK millions (2015 price level) 2015 2016 2017 2018 2019 2020
Offshore wind 2,316 2,121 2,015 2,212 3,048 3,897
Onshore wind 1,814 1,802 1,593 1,433 1,336 1,223
Decentralised CHP 1,878 1,449 984 862 182 35
Biomass 469 270 548 584 614 782
Biogas 478 310 278 259 244 224
PV 0 140 138 143 148 149
Other RE 117 9 8 8 8 8
Other PSO elements 262 240 233 231 226 224
total PSO spending 7,334 6,340 5,796 5,731 5,807 6,542
Reduction for industry 989 1,004 1,673 1,680 1,683 1,686
PSO – part included in tariff 6,345 5,336 4,123 4,051 4,124 4,856
Electricity-intensive industry reduction 188 189 291 291 290 289
PSO – revenue collected after reductions 6,157 5,147 3,832 3,760 3,834 4,567

Agora Energiewende | A Snapshot of the Danish Energy Transition
64
Agreement of July 2014 postponed the Kriegers Flak off-shore wind farm of 600 MW for approximately two years and reduced the nearshore wind power expansion from 500 to 400 MW. This also means a reduction in the expected PSO tariff and is accounted for in the projections in Table 12.
At the same time, the PSO component for gas was abolished as of 2015. The production-based support for biogas up-graded to the natural gas grid was to be financed by a PSO payment uniformly exacted from all customers with the purchase of gas. Through the PSO reduction Agreement in July 2014, the gas PSO was removed and these support costs (200–500 million DKK annually) are now covered by the public budget.
dustry a reduction in their share of the PSO expenditure for renewable energy support. This reduction amounts to 1–1.7 billion DKK annually between 2015 and 2020. The reduction is the same for residential customers as it is for industry, but residential customers face a corresponding increase in the electricity tax in order to balance the reduction in the PSO tariff. Effectively, from 2015 onward, industry pays a lower PSO contribution, while the residential sector (for the most part) will make up the difference with a higher electricity tax, the latter being a part of the public budget (Finansloven). Concerns regarding the impact of high energy and electric-ity costs on Danish industry’s competitiveness with trading partners such as Germany have led to a modification of the financing of renewable energy support costs. Also, most in-dustry is exempt from the electricity tax. Additionally, the
Info Box: PSO for Financing Research
→ Subsequent to the unbundling of electricity generation, transmission and supply adopted in 1998, the Danish TSO Energinet.dk assumed responsibility for the necessary coordination of research and development (R&D). In doing so, Energinet.dk is active in research and development for both the gas and the electricity systems.
→ ForskEL for external research projects: Energinet.dk supports external research, development and demonstration projects by means of the ForskEL fund. They aim at developing solutions for a green transition of the energy system by means of environ-mentally friendly generation technologies. ForskEL is financed via the PSO component, which is also used for financing support schemes for renewable energy. The timeframe for implementation of ForskEL-funded activities is 10 to 20 years.
→ Other programmes: From 2008 through 2015, the preliminary funding programme ForskVE worked to enhance the diffusion of small-scale renewable energy technologies – notably, solar PV, wave power and biogas supply. ForskVE is also financed by the PSO tariff, though the programme will be discontinued after 2015. ForskNG is a programme that focuses on the gas sector.
→ ForskIN for own TSO research projects: Energinet.dk conducts its own R&D activities under its ForskIN programme. ForskIN funds both large and small R&D activities toward the continued development of the Danish power system within a timeframe of 5 to 10 years. The activities are carried out in cooperation with external partners and research institutions. ForskIN is financed by means of the grid tariff.

Study | A Snapshot of the danish Energy transition
65
A striking feature of the Danish energy transition is its in-tegrated approach across sectors. Under the previous gov-ernment, this cross-sectoral integration materialised in the stated target of a coal phase-out by 2030 and the goal of attaining 100 percent renewables in the electricity and heat sectors by 2035, both of which represented interme-diate objectives on the way to a fossil fuel-free system by 2050. The integrated approach is also reflected in the en-ergy scenarios through 2050 – scenarios developed by the Danish Energy Agency that take all energy sectors into ac-count. For the future coal phase-out, it is worth noting the large portion of combined heat and power in Denmark and the strong interdependency between the electricity and the heat sectors (district heating). The role of wind and biomass will become central in the policy paths chosen for the future transition. This applies not only to the conversion of (CHP) power plants to biomass but also to the degree of electrifi-cation and interplay with the transport sector when there are high shares of wind energy in the system. Future policy paths raise questions of import dependency and guaran-teeing sustainability of biomass imports, as well as electric system reliability with a wind-based electricity system. The Systemplan developed by the Danish TSO Energinet.dk equally addresses interdependencies and the future roles the various energy sectors will have to play.
However, changes may also occur along the way. The com-ing months following the recent election will reveal how and to what extent new plans for targets in the period between 2020 and 2030/35 will develop and whether the present framework will be maintained or modified. This concerns in particular the “implementation speed” of the energy transi-tion.
Thus far, in terms of renewable integration, the Danish grid has accommodated increasing renewable energy feed-in very well. In no way has the grid produced a bottleneck effect for the green energy transition. In terms of both intercon-nector utilisation and market integration, Denmark is an in-teresting and innovative example as an early mover. Impor-
With ambitious targets across all energy sectors and con-tinuous deployment of renewable energy sources, Denmark is one of the first movers in implementing the green energy transition. From a central power system at the beginning of the 1980s, the Danish electricity sector developed toward a system with a lot of distributed generation, including in particular wind power and decentralised combined heat and power plants. The recent installation of offshore wind farms can, in a sense, be understood as a new centralised – albeit green – form of generation.
As part of Nord Pool, Denmark belongs to the forerunners of market integration and liberalisation. The Nordic power exchange facilitated the integration of rising shares of wind energy, reaching a share of 39 percent of Danish electricity consumption in 2014. The Danish experience of a transition from a coal-based electricity sector toward the increasing deployment of renewables can serve as inspiration for other countries experiencing similar developments in the years to come when implementing “greener” energy mixes.
One key element in the Danish energy transition has been relatively stable and continuous political conditions for the basic aim of becoming fossil fuel-free. Although there have been minor modifications by means of new energy agree-ments and initiatives set up by newly elected governments, on the whole there has been broad social consensus on im-plementing the energy transition as such. This consensus proved to be crucial in providing a stable regulatory frame-work in the midst of changing (minority) governments over the years. The bulk of measures for accomplishing the 2020 targets are already well underway. The measures include, among others, attaining a 50 percent share of wind energy in electricity consumption. In many cases, the system tran-sition is driven by consensus-based processes that involve the different stakeholders in the energy sector. For example, in order to tackle the challenge of designing a new Mar-ket Model 2.0, the Danish TSO Energinet.dk set up a process with working groups and invited stakeholders to participate in order to address the challenge together.
11. Conclusions

Agora Energiewende | A Snapshot of the Danish Energy Transition
66
in nearby wind projects, compensation for loss in real estate value and loans for local initiative groups in setting up wind projects. They also apply to some nearshore wind projects.
Despite its historical track record, Denmark is facing in-creasing challenges as the energy transition proceeds. Some of the challenges bear striking resemblances to the policy debates taking place in other countries, including Germany. In light of European energy cooperation, these similari-ties may inspire the further exchange of expertise between the two countries – and, by the same token, the sharing of know-how with other countries that are moving to adopt green energy systems.
For one thing, in Denmark issues surrounding a new or refined Market Design 2.0 have arisen. The key question is how to enhance flexibility while securing enough generation capacity. As for the deployment of renewables, questions con-cerning local acceptance for renewable generation and infra-structure projects await answers. The issue of how to finance support and its impact on industry have been on the agenda for a couple of years. Last but not least, in an interdepend-ent European grid, the progress – and delays – in grid expan-sion in one country also affect the surrounding countries. At the same time, developments in Germany may have an effect on the Danish electricity system. Danish power prices, and therefore investment incentives in Denmark, depend on Ger-many with regard to expansion of transmission capacity and the share of wind and solar PV deployed there. In this way, both investment in generation capacity and the financing of support for renewables expansion in Denmark are consider-ably affected by developments in Germany. Decisions with regard to future market and regulatory design, with continued reliance on energy day-ahead markets or capacity mecha-nisms, will also influence Danish policy decisions.
Certain challenges may be encountered in one country ear-lier than another, while other challenges may appear later. The mutual exchange of expertise will be crucial, then, in taking the variety of experiences into consideration when attempting to cope with similar challenges facing each country, albeit on different timelines, in their respective efforts to usher in a fossil-free world.
tantly, Denmark has a special role of being the “hub” between the German and the Nordic systems, with 6.4 GW of inter-connectors linking it to its neighbours (by comparison: Den-mark’s own peak demand of 6 GW). Denmark experiences hardly any (unplanned) curtailment of wind energy. A special compensation regime for downward regulation applies to offshore wind farms installed under the tendering procedure: in case of capacity limits in the grid or technical malfunc-tion/maintenance of transmission equipment, wind energy production can be curtailed and the producers will receive financial compensation (except, in some cases for newer off-shore wind farms, during hours with negative prices).
Comparatively early, a regulating power – or balancing – market (tertiary reserve) consisting of a capacity and an activation market enabled the participation of wind energy. Asymmetric bids and short gate closure times close to the actual hour of operation provide favourable conditions that wind power producers can submit their bids.
For further internal Danish grid expansion, new 400 kV transmission lines will be laid as underground cables. At the 132/150 kV level, complete undergrounding is foreseen by 2030. Also, a plan with “beautification measures” of the existing 400 kV grid is in place, albeit there may be post-ponements in implementation due to financing reasons in other areas.
Financial support for renewables has been provided through different variants of feed-in tariff or fixed premium schemes since market liberalisation – notably, in the form of Contracts for Differences under the tendering procedure for offshore wind. The integrated approach taken in the tendering proce-dure for offshore wind energy, including a one-stop-shop au-thority for licensing and guaranteed grid connection, may also be of interest for other countries, such as Germany, that like-wise intend to implement tendering schemes. Valuable expe-rience from the Danish tendering experience may cover both factors contributing to success and the lessons learned from missteps or oversights for the sake of further improvements.
The long tradition of consumer ownership in Denmark is reflected in regulations on the participation of consumers
67
References
The Danish Government, 2011. Energy Strategy 2050 – from coal, oil and gas to green energy. February 2011.
Danish Renewable Energy Act. Lov om fremme af vedvarende energi. LBK nr 122 af 06/02/2015 (Gældende). Klima-, Energi- og Bygningsmin., Energistyrelsen, j.nr. 6004/6018-0011.
Dansk Energi (Danish Energy Association), 2015a. Norden dybt afhængig af Tyskland. http://www.danskenergi.dk/Aktuelt/Arkiv/2015/April/15_04_17B.aspx
Dansk Energi (Danish Energy Association), 2015b. Energifakta.http://www.danskenergi.dk/AndreSider/Energifakta.aspx
Dansk Energi (Danish Energy Association), 2014a. Flaskehals til Tyskland stadigvæk uløst. http://www.danishenergyassociation.dk/Aktuelt/Arkiv/2014/April/14_04_01B.aspx
Deloitte, 2011. Jørgensen, C, Enevoldsen, M. Analyse vedrørende fremme af konkurrence ved etablering af store havmølleparker i Danmark. Sammenfatning. Klima- og Energiministeriet. 28. April 2011.
Directive 2009/28/EC of the European Parliament and of the Council of 23 April 2009 on the promotion of the use of energy from renewable sources and amending and subsequently repealing Directives 2001/77/EC and 2003/30/EC. OJ L 140/16-62.
Ea Energy Analysis, 2015. Kofoed-Wiuff, A., Hethey, J., Togeby, M., Sawatzki, S., Persson, C. The Danish Experience with Integration of Variable Renewable Energy. Lessons learned and options for improvement. Study on behalf of Agora Energiewende.
Aagaard, L., 2014. Kommentar: Vi vil gerne betale for den grønne omstilling. Berlingske Tidende. 10. juni 2014. http://www.b.dk/kommentarer/vi-vil-gerne-betale-for-den-groenne-omstilling
Aftale om tilbageruling af FSA m.v. og lempelser af PSO, July 2014. 14. juli 2014. http://www.fm.dk/nyheder/pressemeddelelser/2014/07/aftale-om-tilbagerulning-af-fsa-mv,-d-,-og-lempelser-af-pso
Agreement on the Strategy for Solar PV of 2012. Aftale mellem regeringen (Socialdemokraterne, Det Radikale Venstre, Socialistisk Folkeparti) og Venstre, Dansk Folkeparti, Enhedslisten og Det Konservative Folkeparti om strategi for solcelleanlæg og øvrige små vedvarende energi (VE)-anlæg. 15. November 2012.
Biomass Agreement of 1993. Aftale mellem regeringen, Det Konservative Folkeparti, Venstre og Socialistisk Folkeparti om øget anvendelse af biomasse i energiforsyningen og til industrielle formål. 14. juni 1993.
BMWi (Bundesministerium für Wirtschaft und Energie), 2015. Ein Strommarkt für die Energiewende. Ergebnispapier des Bundesministeriums für Wirtschaft und Energie (Weißbuch).http://www.bmwi.de/BMWi/Redaktion/PDF/Publikationen/weissbuch,property=pdf,bereich=bmwi2012,sprache=de,rwb=true.pdf
Christensen, T.B., 2015. Vattenfall skal opføre Horns Rev 3. Energiwatch 26.02.2015. http://energiwatch.dk/Energinyt/Renewables/arti-cle7487416.ece
Danish Electricity Supply Act. Lov om Elforsyning. LBK nr 1329 af 25/11/2013 (Gældende). Klima-, Energi- og Bygningsmin., Energistyrelsen, j.nr. 2203/1190-0136.
Danish Electricity Supply Act, 1999. Lov om Elforsyning. LOV nr 375 af 02/06/1999 (Historisk).
68
References
Energinet.dk, 2014c. Electricity interconnections. Website: http://www.energinet.dk/EN/ANLAEG-OG-PROJEKTER/Generelt-om-elanlaeg/Sider/Elforbindelser-til-udlandet.aspx
Energinet.dk, 2014d. Systemplan 2014.http://energinet.dk/SiteCollectionDocuments/Danske%20dokumenter/Om%20os/Systemplan%202014.pdf
Energinet.dk, 2014e. Søkabel til Norge – Skagerrak 4. http://www.energinet.dk/da/anlaeg-og-projekter/anlaegsprojekter-el/soekabel-til-norge-skagerrak4/sider/soekabel-til-norge-skagerrak-4.aspx
Energinet.dk, 2014f. Generelt om elanlæg. http://energinet.dk/DA/ANLAEG-OG-PROJEKTER/Generelt-om-elanlaeg/Sider/default.aspx
Energinet.dk, 2014g. Energinet.dk’s analyseforudsætninger 2014-2035. 2. maj 2014. Notat.
Energinet.dk, 2015a. Ny markedsmodel. Aktørinddragelse. Accessed: 29.06.2015. http://energinet.dk/DA/El/Engrosmarked/Ny%20markedsmodel/Aktoerinddragelse/Sider/default.aspx
Energinet.dk, 2015b. Ny markedsmodel. Fase 2. Accessed: 29.06.2015. http://energinet.dk/DA/El/Engrosmarked/Ny%20markedsmodel/Sider/Fase-2.aspx
Energinet.dk, 2015c. Baggrundsdata til Miljørapport 2015.http://www.energinet.dk/DA/KLIMA-OG-MILJOE/Miljoerapportering/Baggrundsdokumenter/Sider/default.aspx
Energinet.dk, 2015d. Statistik og udtræk for VE anlæg.http://www.energinet.dk/DA/El/Engrosmarked/Udtraek-af-markedsdata/Sider/Statistik.aspx
Elinfrastrukturudvalget, 2008. Teknisk redegørelse om fremtidig udbygning og kabellægning i eltransmissionsnettet. April 2008. https://www.energinet.dk/SiteCollectionDocuments/Danske%20dokumenter/El/Elinfrastrukturrapporten%202008.pdf
Energimarknadsinspektionen, 2015. Capacity limitations between the Nordic countries and Germany. Ei R2015:12.http://www.energimarknadsinspektionen.se/Documents/Publikationer/rapporter_och_pm/Rapporter%202015/Ei_R201512.pdf
Energinet.dk, 2008. Regulation C2: The balancing market and balance settlement. December 2008. Rev. 2.
Energinet.dk, 2009. Kabelhandlingsplan 2009.
Energinet.dk, 2011. Regulation C3 Handling of Notifications and Schedules – Daily Procedures. Nov. 2011. Rev. 3.
Energinet.dk 2013a. Systemplan 2013. November 2013.
Energinet.dk, 2013b. Netudviklingsplan 2013. May 2013.http://energinet.dk/SiteCollectionDocuments/Danske%20dokumenter/El/Netudviklingsplan%202013.PDF#page=5&zoom=auto,-107,747
Energinet.dk, 2013c. Introduktion til systemydelser. 28. February 2013.https://www.energinet.dk/SiteCollectionDocuments/Danske%20dokumenter/El/43532-13_v1_Introduktion%20til%20systemydelser.PDF
Energinet.dk, 2014a. Brændsler. http://energinet.dk/DA/KLIMA-OG-MILJOE/Miljoerapportering/Sider/Braendsler.aspx
Energinet.dk, 2014b. http://energinet.dk/DA/KLIMA-OG-MILJOE/Miljoerapportering/VE-produktion/Sider/Biomasse.aspx

69
References
ENS (Energistyrelsen – Danish Energy Agency), 2015d. Køberetsordningen.http://www.ens.dk/undergrund-forsyning/vedvarende-energi/vindkraft-vindmoller/vindmoller-pa-land/koberetsordningen
ENS (Energistyrelsen – Danish Energy Agency), 2015e. Støtte til vedvarende energi. http://www.ens.dk/undergrund-forsyning/el-naturgas-varmeforsyning/elforsyning/elproduktion/stotte-vedvarende-energi
ENS (Energistyrelsen – Danish Energy Agency), 2015f. Oversigt over støtteregler mv. for elproduktion baseret på vedvarende energi og anden miljøvenlig elproduktion. Notat. 24. juni 2015.
ENS (Energistyrelsen – Danish Energy Agency), 2015g. Handlingsplaner, statslige reservationer, screeninger mv. http://www.ens.dk/undergrund-forsyning/vedvarende-energi/vindkraft-vindmoller/havvindmoller/planlaegning-fremtidens#hav
ENS (Energistyrelsen – Danish Energy Agency), 2015h. 09.06.2015: Tre selskaber er prækvalificeret til at bygge kystnære havvindmøller. http://www.ens.dk/info/nyheder/nyhedsarkiv/tre-selskaber-praekvalificeret-bygge-kystnaere-havvindmoeller
ENS (Energistyrelsen – Danish Energy Agency), 2015i. Kystnære havvindmøller. http://www.ens.dk/undergrund-forsyning/vedvarende-energi/vindkraft-vindmoller/havvindmoller/kystnaere-havmolleparker
ENS (Energistyrelsen – Danish Energy Agency), 2015j. 50 MW forsøgsordning for ny havvindteknologi. http://www.ens.dk/50-mw-forsoegsordning-ny-havvindteknologi
Energinet.dk, 2015e. Elproduktion.http://energinet.dk/DA/KLIMA-OG-MILJOE/Miljoerapportering/Termisk-produktion/Sider/Termisk-produktion.aspx
Energinet.dk and Quartz+CO, 2014. Markedsmodel 2.0. Rapport for Fase 1.
Energiwatch, 2015a. Svensk energitilsyn retter skarp kritik af tyske Tennet. http://energiwatch.dk/secure/Energinyt/Energiselskaber/article7846444.ece
Energiwatch, 2015b. Svensk energichef: Danmark burde sagsøge Tyskland for el-flaskehals. http://energiwatch.dk/Energinyt/Energiselskaber/article7649471.ece
Energiaftale 2012 (Energy Agreement 2012). Aftale mellem regeringen (Socialdemokraterne, Det Radikale Venstre, Socialistisk Folkeparti) og Venstre, Dansk Folkeparti, Enhedslisten og Det Konservative Folkeparti om den danske energipolitik 2012 – 2020. Den 22. marts 2012.
ENS (Energistyrelsen – Danish Energy Agency), 2015a. Månedsstatistik. Elforsyning. Online regneark. Version April 2015. Accessed: 28.06.2015.http://www.ens.dk/info/tal-kort/statistik-nogletal/manedsstatistik
ENS (Energistyrelsen – Danish Energy Agency), 2015b. Månedlige elrpiser. Online regneark. Version with latest update from Dec. 2014. Accessed: 28.06.2015. http://www.ens.dk/info/tal-kort/statistik-nogletal/energipriser-afgifter/elpriser
ENS (Energistyrelsen – Danish Energy Agency), 2015c. Den grønne ordning. http://www.ens.dk/undergrund-forsyning/vedvarende-energi/vindkraft-vindmoller/vindmoller-pa-land/gronne-ordning

70
References
Gregg, J.S., Bolwig, S., Solér, O., Vejlgaard , L., Holst Gundersen, S., Grohnheit, P.E., 2014. Experiences with biomass in Denmark. Systems Analysis Division, Technical University of Denmark. http://orbit.dtu.dk/files/97912187/Experiences_with_biomass_in_Denmark.pdf
Ingeniøren, 2014a. Nordstrøm Mortensen, H. Minister vil forbyde kulbrug allerede om ti år. 29. okt. 2014. http://ing.dk/artikel/minister-vil-forbyde-kulbrug-allerede-om-ti-aar-171909
Ingeniøren, 2014b. Høj Rühne, F. Flaskehals i tysk el-net koster dansk vindeksport. 2. juni 2014. http://ing.dk/artikel/flaskehals-i-tysk-el-net-koster-dansk-vindeksport-168767
Jacobsen, H., Schröder, S.T., 2012. Curtailment of renewable generation: Economic optimality and incentives. Energy Policy, Vol. 49, pp. 663-675.
KEBMIN (Klima-, Energi- og Bygningsministeriet – Danish Ministry of Climate, Energy and Building), 2015. Vindmøller slog rekord i 2014. Press release from 6th January 2015.
Kokkegård, H., 2015. Vindmølle-forsker: Genialt at Vattenfall køber landejendomme. DR Viden. http://www.dr.dk/nyheder/viden/miljoe/vindmoelle-forsker-genialt-vattenfall-koeber-landejendomme
Kokkegård, H., 2014. Vindmølle-modvind skal vendes til medvind. DR Viden. http://www.dr.dk/nyheder/viden/miljoe/vindmoelle-modvind-skal-vendes-til-medvind
Nord Pool Spot, 2015a. History. http://www.nordpoolspot.com/About-us/History/ and EMCC, 2015. The Nordic Market. http://www.marketcoupling.com/market-coupling/nordic-market .
ENS (Energistyrelsen – Danish Energy Agency), 2015k. Indkaldelse af ansøgninger til forsøgsordning for ny havvindteknologi. 14 juli 2015. Center for Energiressourcer.
ENS (Energistyrelsen - Danish Energy Agency), 2014a. Data November 2014. Elproduktion. http://www.ens.dk/undergrund-forsyning/el-naturgas-varmeforsyning/elforsyning/elproduktion
ENS (Energistyrelsen - Danish Energy Agency), 2014b. Energistatistik 2013. Data, tabeller, statistikker og kort. December 2014. http://www.ens.dk/sites/ens.dk/files/info/tal-kort/statistik-noegletal/aarlig-energistatistik/energistatistik2013.pdf
ENS (Energistyrelsen – Danish Energy Agency), 2014c. Energiscenarier. Energiscenarier frem mod 2020, 2015 og 2050. March 2014. www.ens.dk/analyser
ENS (Energistyrelsen – Danish Energy Agency), 2014d. Elproduktionsomkostninger for 10 udvalgte teknologier. Notat. 1st of July 2014. J.nr. 4005/4007-0015. and http://www.ens.dk/info/nyheder/nyhedsarkiv/ny-analyse-vind-billigst
ENS (Energistyrelsen – Danish Energy Agency), 2014e. Danske nøgletal. http://www.ens.dk/info/tal-kort/statistik-nogletal/nogletal/danske-nogletal
ENS (Energistyrelsen – Danish Energy Agency), 2012. Kabellægning af eltransmissionsnettet – udsættelse eller lavere ambitionsniveau? Notat. 18. January 2012. J.nr. 3401/1001-3799. Ref. AHK.
ENTSO-E (European Network of Transmission System Operators for Electricity), 2014. Ten-Year Network Development Plan 2014. Regional Investment Plan Baltic Sea and Regional Investment Plan North Sea are available here: https://www.entsoe.eu/major-projects/ten-year-network-development-plan/tyndp-2014/Pages/default.aspx

71
References
Wittrup, S., 2015b. Så skete det igen: Egon gav seks timer med negative priser. Ingeniøren, 12. Jan. 2015. http://ing.dk/artikel/saa-skete-det-igen-egon-gav-seks-timer-med-negative-elpriser-173428
Wittrup, S., 2015c. Regeringen: Ny energikommission skal gøre grøn omstilling billigere. Ingeniøren, 2. Juli 2015. http://ing.dk/artikel/regeringen-ny-energikommission-skal-goere-groen-omstilling-billigere-177281
Wittrup, S., 2015d. Blå blok vil neddrosle tempoet på den grønne omstilling. Ingeniøren, 4. Juni 2015. http://ing.dk/artikel/blaa-blok-vil-neddrosle-tempoet-paa-den-groenne-omstilling-176574
Wittrup, S., 2015e. Vattenfall sælger sit sidste kulfyrede kraftværk i Danmark. Ingeniøren, 24. juni 2015. http://ing.dk/artikel/vattenfall-saelger-sit-sidste-kulfyrede-kraftvaerk-i-danmark-177069
Nord Pool Spot, 2015b. How does it work. http://www.nordpoolspot.com/How-does-it-work/The-market-members/Producers/
Olsson, O.J., Skytte, K., 2002. Consumer Ownership in Liberalized Electricity Markets. The Case of Denmark. Annals of Public and Cooperative Economics. Vol. 73 (1), 2002. pp. 69-88.
Regeringen (Danish Government), 2011. Sammenfatning. Energistrategi 2050 – fra kul, olie og gas til grøn energi. Februar 2011:6. http://www.ens.dk/sites/ens.dk/files/forbrug-besparelser/energispareraadet/moeder-energispareraadet/moede-energispareraadet-16-marts-2011/Energistrategi2050_sammenfatning.pdf
Regeringsgrundlaget, 2011. Et Danmark der står sammen. October 2011.
Regeringsgrundlaget, 2015. Sammen for fremtiden. June 2015.
Sommer, M., 2014. Markedsmodel 2.0 – proces og tidsplan. Presentation held at Elaktørforum 7. maj 2014.https://www.energinet.dk/SiteCollectionDocuments/Danske%20dokumenter/El/12.%20Markedsmodel%202.0%20proces%20og%20tidsplan.pdf
Sorknæs, P., Andersen, A. N., Tang, J., Strøm, S., 2013. Market integration of wind power in electricity system balancing. Energy Strategy Reviews, Vol. 1 (2013), pp. 174-180.
Vores Energi, 2011. Regeringen, November 2011. http://www.kebmin.dk/sites/kebmin.dk/files/klima-energi-bygningspolitik/dansk-klima-energi-bygningspolitik/vores%20energi%20-%20web.pdf
Wittrup, S., 2015a. Elkunder betalte 37,7 millioner kr. til overflødig grøn strøm i 2014. Ingeniøren, 16. Feb. 2015. http://ing.dk/artikel/elkunder-betalte-377-millioner-kr-til-overfloedig-groen-stroem-i-2014-174129
72
IN ENglISh
12 Insights on Germany’s EnergiewendeAn Discussion Paper Exploring Key Challenges for the Power Sector
A radically simplified EEG 2.0 in 2014Concept for a two-step process 2014-2017
Benefits of Energy Efficiency on the German Power SectorFinal report of a study conducted by Prognos AG and IAEW
Comparing Electricity Prices for IndustryAn elusive task – illustrated by the German case
Comparing the Cost of Low-Carbon Technologies: What is the Cheapest Option?An analysis of new wind, solar, nuclear and CCS based on current support schemes in the UK and Germany
Cost Optimal Expansion of Renewables in GermanyA comparison of strategies for expanding wind and solar power in Germany
Increased Integration of the Nordic and German Electricity SystemsModelling and Assessment of Economic and Climate Effects of Enhanced Electrical Interconnection and the Additional Deployment of Renewable Energies
Power Market Operations and System ReliabilityA contribution to the market design debate in the Pentalateral Energy Forum
IN gERMAN
12 Thesen zur Energiewende Ein Diskussionsbeitrag zu den wichtigsten Herausforderungen im Strommarkt (Lang- und Kurzfassung)
Aktionsplan LastmanagementEndbericht einer Studie von Connect Energy Economics
Auf dem Weg zum neuen Strommarktdesign: Kann der Energy-only-Markt 2.0 auf Kapazitätsmechanismen verzichten?Dokumentation der Stellungnahmen der Referenten für die Diskussionsveranstaltung am 17. September 2014
Ausschreibungen für Erneuerbare EnergienWelche Fragen sind zu prüfen?
Das deutsche Energiewende-Paradox. Ursachen und HerausforderungenEine Analyse des Stromsystems von 2010 bis 2030 in Bezug auf Erneuerbare Energien, Kohle, Gas, Kernkraft und CO₂-Emissionen
Die Energiewende im Stromsektor: Stand der Dinge 2014Rückblick auf die wesentlichen Entwicklungen sowie Ausblick auf 2015
Die Entwicklung der EEG-Kosten bis 2035Wie der Erneuerbaren-Ausbau entlang der langfristigen Ziele der Energiewende wirkt
Die Rolle des Emissionshandels in der EnergiewendePerspektiven und Grenzen der aktuellen Reformvorschläge
Die Rolle der Kraft-Wärme-Kopplung in der EnergiewendeStatus quo, Perspektiven und Weichenstellungen für einen sich wandelnden Strom- und Wärmemarkt
Publications of Agora Energiewende
All publications are available on our website: www.agora-energiewende.de
73
Der Spotmarktpreis als Index für eine dynamische EEG-UmlageVorschlag für eine verbesserte Integration Erneuerbarer Energien durch Flexibilisierung der Nachfrage
Die Sonnenfinsternis 2015: Vorschau auf das Stromsystem 2030Herausforderung für die Stromversorgung in System mit hohen Anteilen an Wind- und Solarenergie
Effekte regional verteilter sowie Ost-/West-ausgerichteter SolarstromanlagenEine Abschätzung systemischer und ökonomischer Effekte verschiedener Zubauszenarien der Photovoltaik
Ein Kraftwerkspark im Einklang mit den KlimazielenHandlungslücke, Maßnahmen und Verteilungseffekte bis 2020
Ein robustes Stromnetz für die ZukunftMethodenvorschlag zur Planung – Kurzfassung einer Studie von BET Aachen
Erneuerbare-Energien-Gesetz 3.0Konzept einer strukturellen EEG-Reform auf dem Weg zu einem neuen Strommarktdesign
Energieeffizienz als GeschäftsmodellEin marktorientiertes Integrationsmodell für Artikel 7 der europäischen Energieeffizienzrichtlinie
Kapazitätsmarkt oder Strategische Reserve: Was ist der nächste Schritt?Eine Übersicht über die in der Diskussion befindlichen Modelle zur Gewährleistung der Versorgungssicherheit in Deutschland
Klimafreundliche Stromerzeugung: Welche Option ist am günstigsten?Stromerzeugungskosten neuer Wind- und Solaranalagen sowie neuer CCS- und Kernkraftwerke auf Basis der Förderkonditionen in Großbritannien und Deutschland
Kostenoptimaler Ausbau der Erneuerbaren Energien in DeutschlandEin Vergleich möglicher Strategien für den Ausbau von Wind- und Solarenergie in Deutschland bis 2033
Lastmanagement als Beitrag zur Deckung des Spitzenlastbedarfs in SüddeutschlandEndbericht einer Studie von Fraunhofer ISI und der Forschungsgesellschaft für Energiewirtschaft
Negative Strompreise: Ursache und WirkungenEine Analyse der aktuellen Entwicklungen – und ein Vorschlag für ein Flexibilitätsgesetz
Netzentgelte in DeutschlandHerausforderungen und Handlungsoptionen
Positive Effekte von Energieeffizienz auf den deutschen StromsektorEndbericht einer Studie von der Prognos AG und dem Institut für Elektrische Anlagen und Energiewirtschaft (IAEW)
Power-to-Heat zur Integration von ansonsten abgeregeltem Strom aus Erneuerbaren EnergienHandlungsvorschläge basierend auf einer Analyse von Potenzialen und energiewirtschaftlichen Effekten
Reform des KonzessionsabgabenrechtsGutachten vorgelegt von Raue LLP
Stromexport und Klimaschutz in der EnergiewendeAnalyse der Wechselwirkungen von Stromhandel und Emissionsentwicklung im fortgeschrittenen europäischen Strommarkt
Stromspeicher für die EnergiewendeUntersuchung zum Bedarf an neuen Stromspeichern in Deutschland für den Erzeugungsausgleich, Systemdienstleistungen und im Verteilnetz
Transparenzdefizite der NetzregulierungBestandsaufnahme und Handlungsoptionen
Publications of Agora Energiewende

Agora Energiewende is a joint initiative of the Mercator Foundation and the European Climate Foundation.
Agora Energiewende
Rosenstrasse 2 | 10178 Berlin | Germany
T +49 (0)30 284 49 01-00
F +49 (0)30 284 49 01-29
www.agora-energiewende.de
084/17-S-2015/EN
How do we accomplish the Energiewende? Which legislation, initiatives, and measures do we need to make it a success? Agora Energiewende helps to prepare the ground to ensure that Germany sets the course towards a fully decarbonised power sector. As a think-&-do-tank, we work with key stakeholders to enhance the knowledge basis and facilitate convergence of views.


