Page 1
A SOFTWARE BENCHMARKING METHODOLOGY
FOR EFFORT ESTIMATION
A THESIS SUBMITTED TO
THE GRADUATE SCHOOL OF INFORMATICS
OF
THE MIDDLE EAST TECHNICAL UNIVERSITY
BY
MINA NABI
IN PARTIAL FULFILLMENT OF THE REQUIREMENTS FOR THE DEGREE
OF
MASTER OF SCIENCE
IN
THE DEPARTMENT OF INFORMATION SYSTEMS
SEPTEMBER 2012
Page 2
A SOFTWARE BENCHMARKING METHODOLOGY
FOR EFFORT ESTIMATION
Submitted by Mina Nabi in partial fulfillment of the requirements for the degree of
Master of Science in Information Systems, Middle East Technical University by,
Prof. Dr. Nazife Baykal
Director, Informatics Institute
Prof. Dr. Yasemin Yardımcı Çetin
Head of Department, Information Systems
Prof. Dr. Onur Demirörs
Supervisor, Information Systems, METU
Examining Committee Members:
Prof. Dr. Semih Bilgen
EEE, METU
Prof. Dr. Onur Demirörs
IS, METU
Dr. Ali Arifoğlu
IS, METU
Assist. Prof. Dr. Banu Günel
IS, METU
Assoc. Prof. Dr. Altan Koçyiğit
IS, METU
Date: 14.09.2012
Page 3
iii
I hereby declare that all information in this document has been obtained and
presented in accordance with academic rules and ethical conduct. I also declare
that, as required by these rules and conduct, I have fully cited and referenced
all material and results that are not original to this wok.
Name, Last name: Mina Nabi
Signature: _________________
Page 4
iv
ABSTRACT
A SOFTWARE BENCHMARKING METHODOLOGY
FOR EFFORT ESTIMATION
Nabi, Mina
M.Sc., Department of Information Systems
Supervisor: Prof. Dr. Onur DEMİRÖRS
September 2012, 122 pages
Software project managers usually use benchmarking repositories to estimate effort,
cost, and duration of the software development which will be used to appropriately
plan, monitor and control the project activities. In addition, precision of
benchmarking repositories is a critical factor in software effort estimation process
which plays subsequently a critical role in the success of the software development
project. In order to construct such a precise benchmarking data repository, it is
important to have defined benchmarking data attributes and data characteristics and
to have collected project data accordingly. On the other hand, studies show that data
characteristics of benchmark data sets have impact on generalizing the studies which
are based on using these datasets. Quality of data repository is not only depended on
quality of collected data, but also it is related to how these data are collected.
In this thesis, a benchmarking methodology is proposed for organizations to collect
benchmarking data for effort estimation purposes. This methodology consists of
Page 5
v
three main components: benchmarking measures, benchmarking data collection
processes, and benchmarking data collection tool. In this approach results of previous
studies from the literature were used too. In order to verify and validate the
methodology project data were collected in two middle size software organizations
and one small size organization by using automated benchmarking data collection
tool. Also, effort estimation models were constructed and evaluated for these projects
data and impact of different characteristics of the projects was inspected in effort
estimation models.
Keywords: Benchmarking methodology, benchmarking data, Effort Estimation
Models, Functional Similarity
Page 6
vi
ÖZ
İŞ GÜCÜ KESTİRİMİ İÇİN BİR YAZILIM REFERANS
VERİ KÜMESİ YÖNTEMİ
Nabi, Mina
M.Sc., Department of Information Systems
Supervisor: Prof. Dr. Onur DEMİRÖRS
Eylül 2012, 122 sayfa
Yazılım proje yöneticileri genellikle iş gücü, maliyet ve yazılım geliştirme süresini
tahmin etmek için referans veri kümelerini kullanırlar. Bu tahminler proje
faaliyetlerinin uygun planlama, izleme, ve kontrolü için kullanılır. İş gücü kestirimi
yazılım geliştirme projesinin başarısında önemli bir rol oynamaktadır ve referans veri
kümesinin kalitesi yazılım proje iş gücü kestirim sürecinde kritik bir faktördür.
Güvenilir bir referans veri kümesi oluşturmak amacıyla, kestirim veri niteliklerinin
ve veri özelliklerinin tanımlı olması önemlidir. Öte yandan, çalışmalar referans veri
kümelerinin veri özellikleri bu veri kümelerine dayalı çalışmaların yaygınlaştırılması
üzerinde etkili olduğunu göstermektedir. Referans veri kümelerin kalitesi sadece
toplanan veri niteliğine bağlı değildir, aynı zamanda bu verilerin nasıl toplandığıyla
da ilgilidir.
Bu tezde, organizasyonlarda iş gücü kestirim amacıyla referans veri kümesine veri
toplamak için bir metodoloji önerilmiştir. Bu metodoloji, üç ana bölümden
oluşmuştur: referans veri kümesinin ölçüleri, referans veri kümesinin veri toplama
süreçleri, referans veri kümesi için veri toplama aracı. Bu yaklaşımda literatürde
önceki çalışmaların sonuçlarından da yararlanılmıştır. Metodolojiyi doğrulamak ve
Page 7
vii
geçerlemek amacıyla, iki orta boy yazılım organizasyonundan proje verileri otomatik
referans veri kümesi veri toplama aracını kullanarak toplandı. Ayrıca, iş gücü
kestirim modelleri oluşturuldu ve bu projelerin verileri ve projelerin farklı
özelliklerinin etkisi iş gücü kestirimi için değerlendirildi.
Anahtar Kelimeler: Referans Veri Kümesi Oluşturma Metodolojisi (Benchmarking
Metodolojisi), Referans Veri , İş Gücü Kestirim Modeli, Fonksiyonel Benzerlik.
Page 9
ix
ACKNOWLEDGEMENTS
I would like to offer my special thanks and gratitude to Prof. Dr. Onur Demirors for
his supervision, encouragement, patience and continuous support throughout my
thesis study.
I would like to give great thanks to Baris Ozkan for his supports and patience. He
always helped me without hesitating whenever I had question in my thesis, specially
related to Cubit.
I would grateful to express my special thanks to Ozden Ozcan Top and Seckin
Tunalilar for their contributions and supports during my thesis. Without their helps it
would be very difficult to solve problems I had encountered in my thesis.
I am thankful to my dear friend Gokcen Yilmaz who helped me on different stages of
my thesis study. I would also want to thank to my best friends Deniz Emeksiz, Puren
Guler, and Arezo Abrishhami for their moral support. They were always there for me
whenever I had problem and I will never forget their kindness.
I would like to express my special thanks to my dear friend Bahram Lotfi Sadigh for
his continuous encouragement, help, patience and moral support.
Finally, I would like to express my special gratitude to my parents (Ahad Nabi and
Farideh Abdi) for their support, sacrifices, patience, and endless love throughout my
life. I am also grateful to my dear brother Babak Nabi, and my lovely sister Roxana
Nabi for their love and emotional support. I am proud to have such a supportive and
lovely family.
Page 10
x
TABLE OF CONTENTS
ABSTRACT ............................................................................................................... iv
ÖZ ............................................................................................................... vi
ACKNOWLEDGEMENT .......................................................................................... ix
TABLE OF CONTENTS ............................................................................................. x
LIST OF TABLES .................................................................................................... xiii
LIST OF FIGURES................................................................................................... xiv
LIST OF ABBREVIATIONS AND ACRONYMS ................................................... xv
CHAPTER 1 ................................................................................................................ 1
INTRODUCTION........................................................................................................ 1
1.1.Background of the problem ................................................................................. 1
1.2.Statement of the Problem .................................................................................... 2
1.3.The Purpose of the Study .................................................................................... 4
1.4.Significance of the Study .................................................................................... 5
1.5.Research Questions ............................................................................................. 6
1.6.Road Map ............................................................................................................ 6
CHAPTER 2 ................................................................................................................ 7
BACKGROUND AND RELATED RESEARCH ....................................................... 7
2.1.Synthesis of the Literature................................................................................... 7
2.1.1.Data repository and accuracy of data repository ........................................... 7
2.1.2.Developed estimation models and improvement opportunities for effort
estimation ............................................................................................................. 12
CHAPTER 3 .............................................................................................................. 17
SOFTWARE BENCHMARKING APPROACH FOR EFFORT ESTIMATION .... 17
3.1.Benchmarking Measures ................................................................................... 17
3.1.1.Submission Attributes ................................................................................. 18
3.1.2.Project Attributes ......................................................................................... 19
3.1.3.Product Attributes ........................................................................................ 23
3.1.4.Size Attributes ............................................................................................. 27
Page 11
xi
3.1.5.Effort Attributes........................................................................................... 29
3.1.6.Productivity Factors..................................................................................... 36
3.2.Benchmarking Data Collection Processes ......................................................... 37
3.2.1.Infrastructure Definition Process ................................................................. 40
3.2.2.Cubit Infrastructure Definition Process ....................................................... 41
3.2.3.Data Collection Process ............................................................................... 41
3.2.3.1. Project Data Collection Process ........................................................... 41
3.2.3.2. Product Data Collection Process .......................................................... 42
3.2.3.3. Software Size Data Collection Process ................................................ 42
3.2.3.3.1. Software Functional Size Measurement Process ............................ 42
3.2.4.Effort Data Collection Process .................................................................... 43
3.2.4.1. Data Collection Process for Project Management Effort Data ............. 43
3.2.4.2. Data Collection Process for Requirements Activities‘ Effort Data ...... 44
3.2.4.3. Data Collection Process for Design Activities‘ Effort Data ................. 44
3.2.4.4. Data Collection Process for Integration Activities‘ Effort Data........... 44
3.2.4.5. Data Collection Process for Test Activities‘ Effort Data ..................... 45
3.2.4.6. Data Collection Process for Quality Activities‘ Effort Data ................ 45
3.3.Benchmarking Tool ........................................................................................... 46
CHAPTER 4 .............................................................................................................. 56
APPLICATION OF THE MODEL AND AUTOMATED BENCHMARKING
DATA COLLECTION............................................................................................... 56
4.1.Research Questions ........................................................................................... 56
4.2.Case Study Design ............................................................................................ 57
4.2.1.Case Selection Criteria and Background of these selected cases ................ 58
4.3.Case study 1: Exploratory Case Study .............................................................. 58
4.3.1.Case Study 1 Plan ........................................................................................ 59
4.3.2.Case Study 1 Conduct ................................................................................. 59
4.3.3.Case study 1 Results .................................................................................... 66
4.4.Case study 2: Validation of the Benchmarking Methodology and Automated
Benchmarking Data Collection Tool....................................................................... 67
4.4.1.Case Study 2 Plan ........................................................................................ 67
4.4.2.Case Study 2 Conduct ................................................................................. 68
Page 12
xii
4.4.3.Case study 2 Results .................................................................................... 78
4.5.Validity Threats ................................................................................................. 80
CHAPTER 5 .............................................................................................................. 81
CONCLUSIONS ........................................................................................................ 81
5.1.Conclusions ....................................................................................................... 81
5.2.Future Work ...................................................................................................... 86
REFERENCES ........................................................................................................... 87
APPENDIX .............................................................................................................. 92
EPC Diagrams for Benchmarking Data Collection Processes ................................... 92
1.Infrastructure Definition Process ............................................................................ 92
2.Cubit Infrastructure Definition Process .................................................................. 94
3.Data Collection Process .......................................................................................... 96
3.1.Submission Attributes Data Collection Process ................................................ 98
3.2.Project Attributes Data Collection Process ....................................................... 99
3.3.Product Attributes Data Collection Process .................................................... 102
3.4.Software Attributes Data Collection Process size ........................................... 104
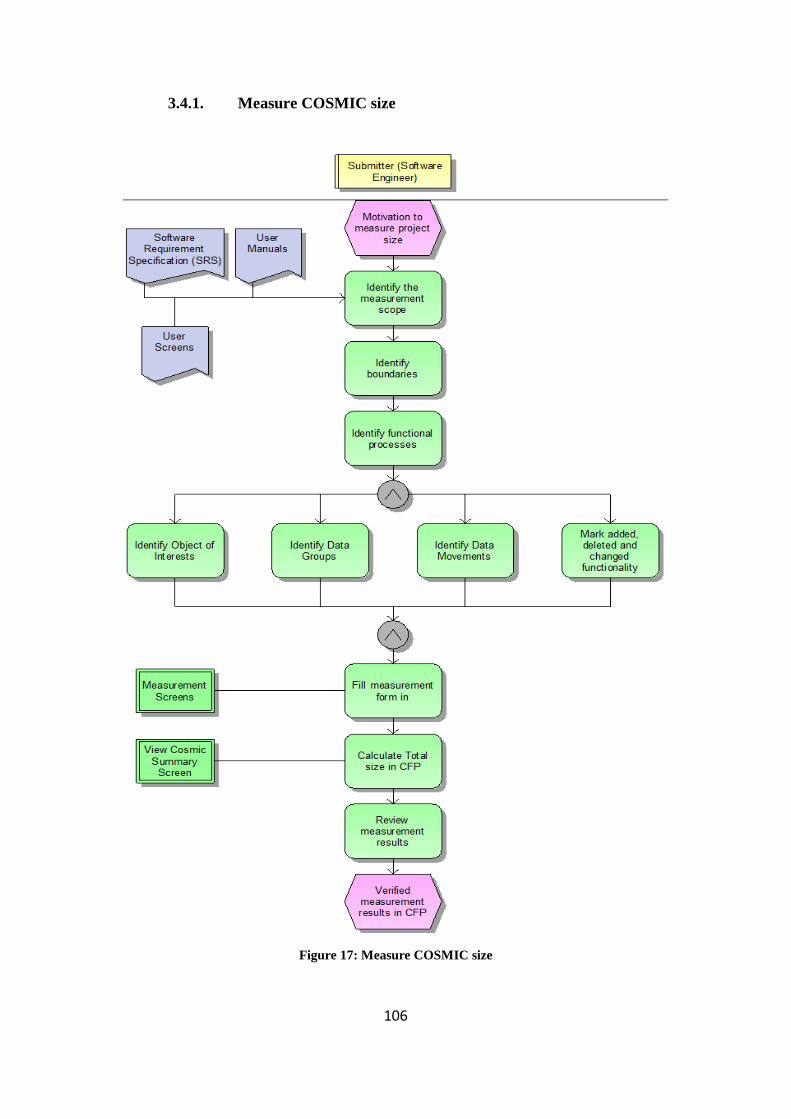
3.4.1.Measure COSMIC size ................................................................................... 106
4.Effort Attributes Data Collection Process ............................................................. 107
4.1.Data Collection Process for Project Management Effort Data ....................... 111
4.2.Data Collection Process for Requirements‘ Activities Effort Data ................. 114
4.3.Data Collection Process for Design Activities‘ Effort Data ........................... 116
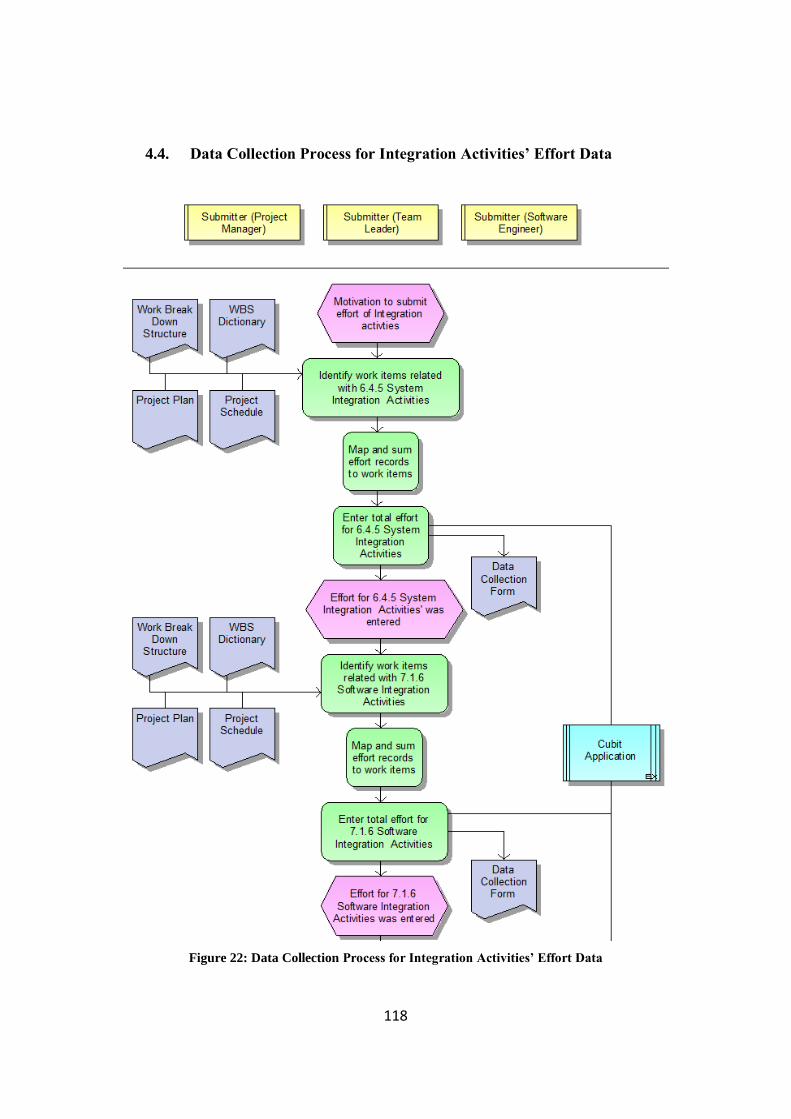
4.4.Data Collection Process for Integration Activities‘ Effort Data ..................... 118
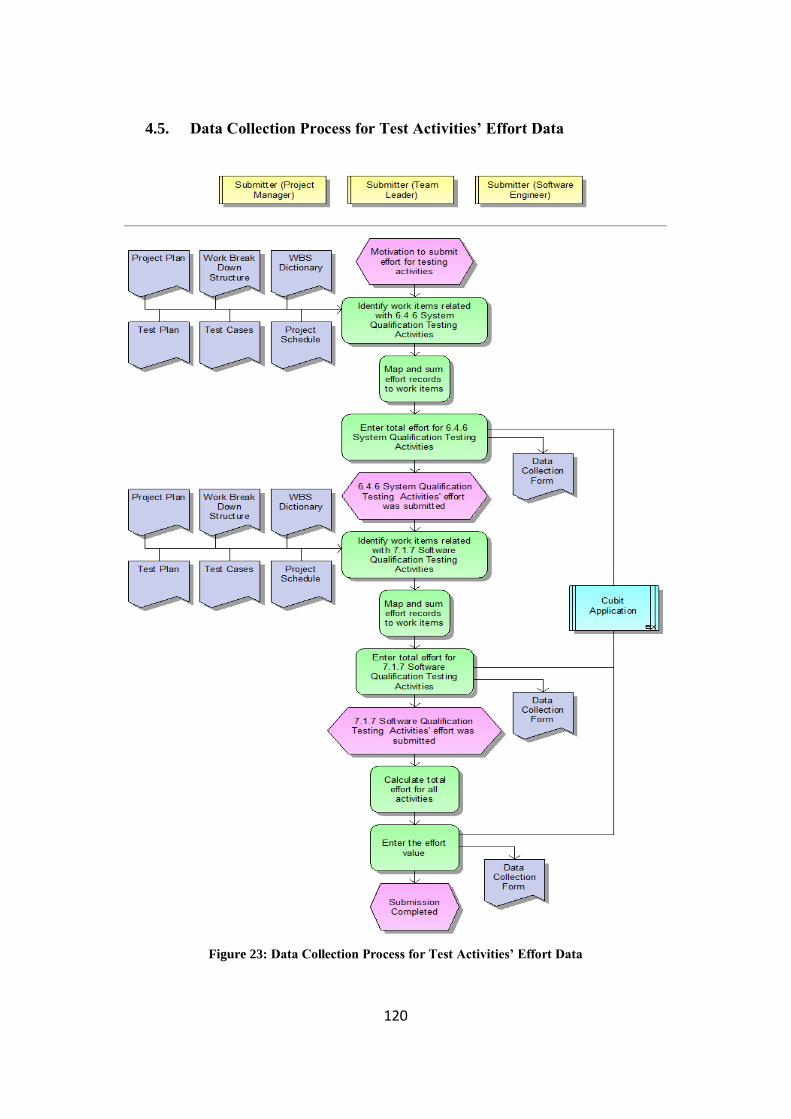
4.5.Data Collection Process for Test Activities‘ Effort Data ................................ 120
4.6.Data Collection Process for Quality Activities‘ Effort Data ........................... 121
Page 13
xiii
LIST OF TABLES
Table 1: EPC model objects used in benchmarking data collection processes (Davis
& Brabander 2007) .................................................................................................... 39
Table 2: Data Repositories Evaluated in This Study ................................................. 60
Table 3: Project Attribute Existence of the Repositories ........................................... 62
Table 4: Productivity ratio (Person-hours/FP) ........................................................... 64
Table 5: Size/Effort ratio for functional similarity consideration .............................. 69
Table 6: Estimation model of 7 discussed data repositories and case study projects
data .............................................................................................................. 73
Table 7: MMRE and PRED (30) values for comparison of accuracy of effort
estimation models for total and development effort .................................................. 75
Table 8: MMRE and PRED (30) values for comparison of accuracy of effort
estimation models for software development activity efforts .................................... 76
Table 9: MMRE and PRED(30) values for comparison of accuracy of effort
estimation models for software development activity efforts by considering BFC of
size data .............................................................................................................. 77
Page 14
xiv
LIST OF FIGURES
Figure 1: Use case model for cubit benchmarking part ............................................. 47
Figure 2: Benchmarking Home .................................................................................. 48
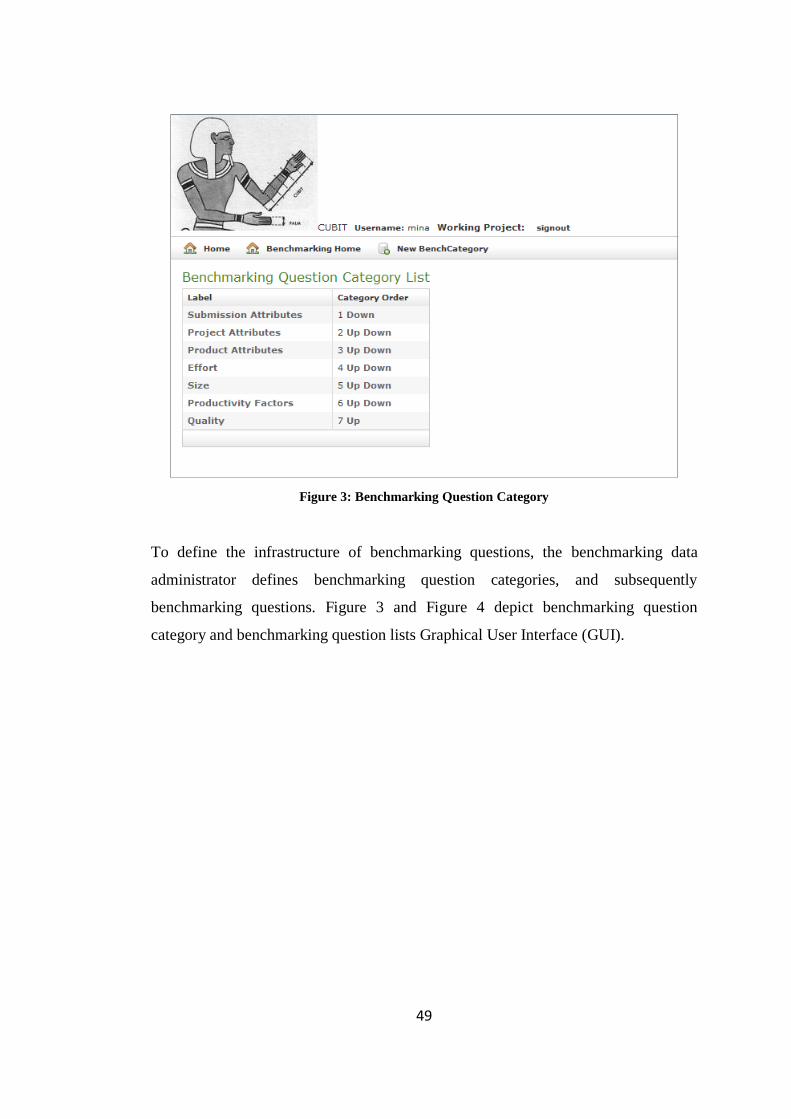
Figure 3: Benchmarking Question Category.............................................................. 49
Figure 4: Benchmarking Question List ...................................................................... 50
Figure 5 Define Single Textbox Question ................................................................. 51
Figure 6 : Define MultipleTextbox Question ............................................................. 52
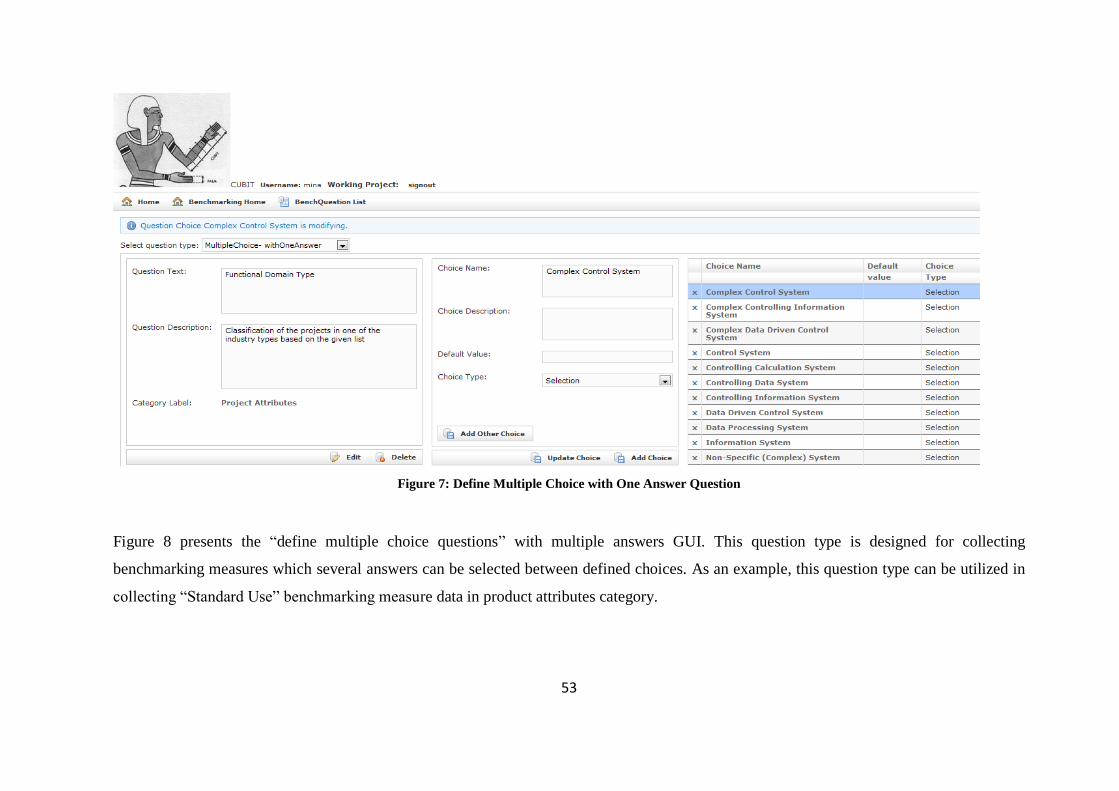
Figure 7: Define Multiple Choice with One Answer Question.................................. 53
Figure 8: Define Multiple Choice with Multiple Answer Question .......................... 54
Figure 9: Answer benchmarking questions ................................................................ 55
Figure 10: Infrastructure Definition Process .............................................................. 92
Figure 11: Cubit Infrastructure Definition Process .................................................... 94
Figure 12: Data Collection Process ............................................................................ 96
Figure 13: Submission Attributes Data Collection Process ....................................... 98
Figure 14: Project Attributes Data Collection Process .............................................. 99
Figure 15 : Product Attributes Data Collection Process .......................................... 102
Figure 16: Software Attributes Data Collection Process size .................................. 104
Figure 17: Measure COSMIC size ........................................................................... 106
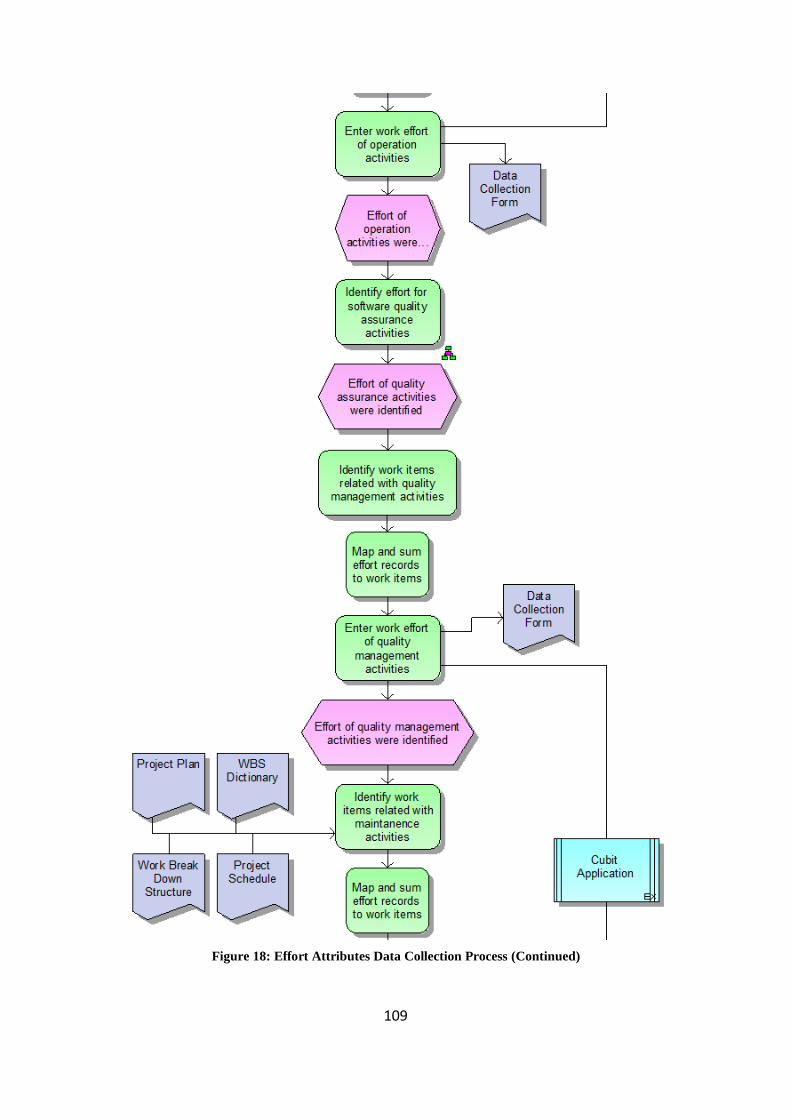
Figure 18 : Effort Attributes Data Collection Process ............................................. 107
Figure 19: Data Collection Process for Project Management Effort Data ............... 111
Figure 20: Data Collection Process for Requirements‘ Activities Effort Data ........ 114
Figure 21: Data Collection Process for Design Activities‘ Effort Data ................... 116
Figure 22: Data Collection Process for Integration Activities‘ Effort Data ............. 118
Figure 23: Data Collection Process for Test Activities‘ Effort Data ....................... 120
Figure 24: Data Collection Process for Quality Activities‘ Effort Data .................. 121
Page 15
xv
LIST OF ABBREVIATIONS AND ACRONYMS
ARIS : Architecture of Integrated Information Systems
BFC : Base Functional Component
COSMIC : The Common Software Measurement International Consortium
CSBSG : Chinese Software Benchmarking Standards Group
EPC : Event-driven Process Chain
FSM : Functional Size Measurement
GUI : Graphical User Interface
IPA/SEC : Information-Technology Promotion Agency/Software Engineering
Center
ISBSG : International Software Benchmarking Research Group
LOC : Line of Code
MMRE : Mean Magnitude of Relative Error
MRE : Magnitude of Relative Error
PRED : Prediction Level Parameter
PROMISE : Predictor Models in Software Engineering
SLOC : Source Line of Code
SRS : Software Requirement Specification
WBS : Work Breakdown Structure
Page 16
1
CHAPTER 1
INTRODUCTION
1.1. Background of the problem
For software organizations it is important to deliver a software product on time
within expected quality to their customers. For the purpose of allocating appropriate
resource and making reasonable schedule in project planning phase, reliable and
accurate effort estimation is important (Huang & Chiu, 2006). Software effort
estimation is crucial input for monitoring and controlling the allocated resources
during project management activities. Also, the accuracy of the development effort
estimation plays an important role in success of the maintenance activities in the
software development of the project (Huang, Chiu, & Liu, 2008).
Many effort estimation methods have been suggested by researchers during the last
decade. Among these methods estimation by expert judgment, analogy based
estimation, and parametric (algorithmic) estimation are widely used (Huang & Chiu,
2006), (Huang, et al., 2008), (Mendes, 2009). Expert estimation is an estimation
method which is conducted by a person who is expert in the task. In this estimation
method expert follows a non-explicit and non-recoverable process to estimate
required development effort (Jorgenson & Sjoberg, 2004). In analogy based
estimation similar projects to the one to be estimated are found from historical data
and then estimation is derived from the valued of selected projects (Jorgenson,
Indahl, & Sjoberg 2003). Algorithmic effort estimation methods are based on using
statistical analysis to predicate the effort estimation equations. Constructive cost
model (COCOMO), and ordinary least square (OLS) regression model are most
commonly used methods among the parametric effort estimation techniques
(Kaczmarek & Kucharski, 2004), (Huang et al., 2008). All of these estimation
models rely on historical (benchmarking) datasets. Benchmarking dataset is
Page 17
2
reference for making decision in start phase of the project, and in order to establish a
reliable estimation model and predicting required effort and cost, accurate and
sufficient historical project data are needed. Since new software organizations do not
have enough project data and also most of the organizations ignore the need for data
collection, there is a strong need for external benchmark datasets. International
Software Benchmarking Standards Group (ISBSG) dataset (2007), Chinese Software
Benchmarking Standards Group (CSBSG) dataset (2006), Information Technology
Promotion Agency (IPA/SEC) dataset (2004), Predictor Models in Software
Engineering (PROMISE) Dataset (2008), Laturi/Finnish software metrics association
(FISMA) Experience dataset (2009) are common datasets provided by research
groups for this propose.
Benchmarking process is defined by Bundschuh and Dekkers (2008) as the process
of identifying and using knowledge of best practices to improve in any given
business, also the most important point is that benchmarking is not a standalone
action. It is also defined by Dekkers (2007) as a continuous and repeatable process of
measuring and comparing with other best practices. Benchmarking can be
distinguished as internal and external benchmarking. In internal benchmarking the
comparison takes place with projects which belong to the same or a different
enterprise. But in contrast, external benchmarking cope with market-related
comparisons, and its data is from outside of the organization (Bundschuh & Dekkers
2008). A secondary classification of benchmarking is based on the availability of the
dataset. The dataset can be public, semi-public or private benchmark repository.
When the data itself is available like data in ISBSG (2007) it is called public. In other
cases the data is not available but the analysis results are open to the public as
IPA/SEC (2004) dataset it is semi-public. Finally, it is private when the repository is
not accessible since the data is integrated within a software estimation tool as in SPR
(2010).
1.2. Statement of the Problem
Researches show that data characteristics of benchmark data sets have impact on
studies based on using these datasets. Unfair and unbalanced datasets have potential
effects on the performance of effort estimation techniques, and these problems in the
Page 18
3
datasets raise threats in generalizing the effort estimation techniques, algorithms and
tools used by these methods (Bachmann & Bernstein, 2010), (Bachmann &
Bernstein, 2009). Accurate benchmark data repository is a crucial key factor for
improving accuracy of effort estimation. Many studies have been conducted to
propose effective effort estimation methods, but in those studies distribution of the
historical data, which has a impact on effort estimation accuracy, have not been
considered (Seo, Yoon, & Bae, 2009). So the inaccuracy and noise in benchmark
data repository is an important problem which should be considered.
Benchmarking data repositories suffer from some problems: collection of the data are
expensive and difficult; they are limited in collected project numbers, outliers in the
dataset can have misleading influence in the estimation result, academics have
limited access to industrial project datasets, and finally the missing data is significant
in the datasets. Also in order to validate these data sets, the correlation among the
variables should be considered. When for example 10 variables are measured, 45
correlations should be considered. Obviously, by increasing the number of variables,
the number of correlations rises rapidly and the systematically large correlation
metrics are needed (Liu & Mintram, 2006). Another problem of benchmark datasets
is that, there is low rate data submission in software industry and because of the lack
of publicly available benchmarking datasets and limitation of their size, effort
estimation models cannot be validated truly (Cukic, 2005).
On the other hand, number of data attributes collected in multi organizational
benchmarking data set is high, for example in ISBSG version 11 there are 118
attributes, and the task of collecting such a number of attribute is not possible. So,
the number of missing data is high in these data repositories. As it is mentioned
missing data influences the accuracy of estimated effort. Furthermore, some of the
techniques for imputation of these missing data results in loss of data and
subsequently inaccurate estimation (Sentas & Angelis, 2006). On the other hand
software repositories contain heterogeneous project data, so parametric effort
estimation methods encounter with poor adjustment and predictive accuracy. So,
heterogeneity is another problem of data repositories (Cuadrado, Rodriguez, Sicilia,
Rubio, & Crespo, 2007) (Huang et al., 2008). Unbalanced data also have impact on
Page 19
4
the accuracy of effort estimation methods, and it imposes a validity threat to the
validation of effort estimation techniques (Bachmann & Bernstein, 2010).
Researchers propose to use single company data repository, rather than cross
company data repository. The studies show that benchmarking using single company
dataset produces more accurate data in comparison to multi-company dataset, but
organizations face three problems when using within company project data: the time
required for collecting data from a single company can be excessively high,
technologies used in the company can change and older projects will not be
representative any more for new projects, and data care is needed to guaranty the
consistency of the dataset. So, many organizations tend to use cross company
datasets, which on the other hand suffers from other problems: again care for keeping
consistency of dataset is needed, and difference in process and used technologies of
different companies may cause trend through different companies (Mendes, Lokan,
Harrison, & Triggs, 2005), (Mendes & Lokan, 2007). In cross company
benchmarking data set project data is collected from different companies with
different application domains and technologies. Since mostly large scale companies
contribute in this process, the sample in these data sets is not random and not
representative, as in CSBSG dataset (Wang, Wang, & Zhang, 2008). Therefore these
data sets cannot result in accurate estimation.
In addition, there is not an international standard for developing benchmark dataset,
and different repositories are developed in different countries which include different
attributes and categories. Thus, mapping between attributes of diverse data
repositories is not possible, and estimation result from different repositories cannot
be compared to verify and generalize the findings (Gencel, Buglione, & Abran,
2009).
1.3. The Purpose and Scope of the Study
The purpose of this study is to develop an approach for data collection which
includes meta-data model of project attributes for benchmark data repository, data
collection process, and tool support for data collection according to defined
benchmarking attributes and processes. Firstly, in this study the characteristics of
available benchmark data sets were evaluated and the core factor drivers of effort
Page 20
5
estimation were identified. Also, a survey was performed in the literature for finding
benchmarking attributes. In order to define a data model with correct and not noisy
data, project attributes was categorized as core project attributes and extended project
attributes. Core project attributes are sufficient for an accurate and reliable
estimation, and meanwhile the extended attributes elaborate more precise
characteristics of software business domain. In this case, data collection process will
be more precise from viewpoint of completeness and high fill in ratio.
Secondly, previously defined benchmarking data collection processes were refined
for automation purpose. Implementation of collecting benchmarking dataset was the
next target of this study. This automated benchmarking data collection tool with
considering defined benchmarking methodology and data collection processes will
ease the data collection process.
1.4. Significance of the Study
One important reason for this study is that current external benchmark datasets
include missing and noisy data, and they contain heterogeneous project data.
Existence of such noisy data leads to inaccuracy in effort estimation methods.
Meanwhile, the number of attributes in these benchmark datasets is too much hence
it is difficult for data provider to submit all these attributes, so this phenomena lead
to constructing benchmark dataset with missing and dirty data. In this study by
proposing meta-model key project attributes will be determined and by eliminating
unnecessary attributes more accurate data without noise will be collected from
providers. The core project attributes will guarantee reliable effort drivers to estimate
the required development effort. On the other hand, by integrating defined
benchmarking attributes, benchmarking data collection processes, and tool support it
will be a substantial improvement for constructing benchmarking data repository.
In addition, tool support will be very useful in decreasing consumed time and effort
for data collection and it will be efficient for the usage of accurate effort estimation
in project management. Also, since it can be customized within organizations it will
be a useful tool in benchmarking data collection for organizations.
Page 21
6
1.5. Research Questions
In order to overcome the problems described in the ―Purpose of the Study‖ section,
these research questions will be explored:
Q1: What are project attributes of a benchmarking meta-model which can be used in
establishing reliable effort estimation models?
Q2: For the purpose of software benchmarking which measures can be collected in
organizations in practice?
Q3: What are the requirements of automated benchmarking data collection processes
which improves benchmarking data repositories?
Q4: Is this benchmarking methodology applicable to other organizations?
Q5: Does data collected by this methodology lead to better effort estimation?
1.6. Road Map
In chapter 2, a review of relevant literature on benchmarking, effort estimation
models are described.
In chapter 3, proposed benchmarking methodology is described in detail. It includes
three subsections: benchmarking measures, benchmarking data collection processes,
and benchmarking data collection tool Cubit (http://smrg.ii.metu.edu.tr/cubit/). As an
attachment to this chapter, refined benchmarking data collection processes are given
in APPENDIX.
In chapter 4, the implementation of the approach which is used in this study and its
design is described. The chapter describes two case studies conducted in this thesis;
the explanatory case study, and the validation case study.
In chapter 5, conclusions and contributions of this research are presented briefly, and
suggestions for future work are made.
Page 22
7
CHAPTER 2
BACKGROUND AND RELATED RESEARCH
2.1. Synthesis of the Literature
The word ―benchmark‖ has been used in the past in different ways. One of the usages
of this word is the ability of a software organization to determine the competitiveness
in a given business area, and required productivity improvement for sustaining a
specific business. From this viewpoint benchmarking is a data intensive process,
which means for benchmarking it is necessary to have a benchmarking database.
Such a database contains performance measures and other characteristics for a set of
projects. Then similar projects will be found and performance of these projects will
be compared with the target project (Beitz & Wieczorek, 2000).
According to Meli (1998) a benchmarking dataset is a collection of technical and
management data for the software to develop forecasts for the future and evaluation
of the productivity of present project. They contain actual and anticipated data of
projects for organizations, and they are collected according to proven security and
refinement model. For benchmarking the dataset can be filtered by similar projects,
then the selected projects data can be analyzed individually or by respect to statistical
dispersion and correlation indicators.
2.1.1. Data repository and accuracy of data repository
The quality of a benchmark data set is relative to the quality of the data in the data
set. There are studies which evaluated the data quality of the benchmark data. Herzog
(2007) suggested most seven cited properties of quality as (1) relevance, (2)
accuracy, (3) timeliness, (4) accessibility and clarity of results, (5) comparability, (6)
coherence, and (7) completeness. Liebchen and Shepperd (2008) examined the
Page 23
8
quality of the data with accuracy and noise of the data with objective of assessing the
techniques used in quality management of software engineering. Noise was described
as incorrect and inaccurate data. They evaluated the studies which address the
accuracy of data in datasets. Surprisingly they observed that only the total of 23
studies directly address this problem at that time, and in comparison to other
empirically based disciplines it is not studied enough. Among these studies 73% of
the evaluated articles claimed data noise is a significant problem. Empirical analysts
address this problem by the approach of manual inspection and prevention
techniques such as tool support for data collection.
Data values can be absent from a benchmark data repository because of various
reasons, like inability to measure a specific benchmark attribute. Many research for
handling missing data have been done. A comprehensive experimental analysis of
five techniques of handling and imputation of missing data which were conducted by
Van Hulse and Khoshgoftaar (2007) is one of these studies. Deleting data from a
dataset can cause in loss of potentially valuable data. In this study also impact of
noise on the imputation process were examined and high impact of noisy data on the
effectiveness of imputation techniques observed. Bayesian multiple imputation and
regression imputation reported as most effective techniques, and mean imputation
reported as extremely poor performance technique.
Strike, Emam, and Madhavji (2001) also performed a comprehensive simulation to
evaluate the techniques for dealing with missing data in software cost estimation
modeling. Three techniques of listwise deletion, mean imputation, and eight different
of hot-deck imputation were assessed in this study. They observed that all these
techniques are well performed, and they suggested listwise deletion as reasonable
choice. But they also state that this technique does not provide best performance
necessarily, so using hot-deck imputation suggested as a method which produce best
performance with minimal bias and highest precision.
Similarly, Sentas and Angelis (2006) conducted a comparative study on missing data
techniques (multinomial logistic regression (MLR), list wise deletion (LD), mean
imputation (MI), expectation maximization, and regression imputation) and
suggested multinomial logistic regression (MLR) for using imputation on databases
with missing data. In this experimental research, ISBSG version 7 was used, which
Page 24
9
contained 1238 projects information at that time. Since they want to observe the
difference in efficiency of these MLR methods, they first selected projects which
have complete data with no missing values. They resulted in 166 project data. Then
by using three different mechanisms they create missing data. These mechanisms
were: missing completely at random (MCAR), non-ignorable missingness (NIM),
and missing at random (MAR). For analyzing the difference between missing data
techniques, analysis of variance (ANOVA) was used. This statistical method was
applied by using SPSS program. The results show that in small percentage of missing
data, the purposed method (MLR) gives satisfactory results like other methods, but in
high percentage of missing data it performs better than other methods. Although LD
approach is more used as missing data imputation techniques, but the loss of
precision and bias are major problems of this method. Determining when LD method
is unsuitable method, problem of missing data from other aspects is stated as future
work in this paper.
Moses and Farrow (2005) also used Bayesian statistical simulation program BUGS
to impute missing data. The ISBSG Data Repository (2003) is analyzed, and used for
reexamining a statistical model for work effort. Different distributions were used to
model missing data: categorical distribution applied to language type (LT),
imputation regressions used for imputing maximum team size (MTS), and also
Gamma distribution used for imputing MTS. Differences between 2 and 4GLs, 3 and
4GLs, APG and 4GLs, 5 and 4GLs, 3GLs and APGs were observed. Imputing MTS
for missing data revealed differences in required effort for development of systems
with different LDs, and development types. After imputation the author observed that
the model derived from this model imputation is likely to be useful than model which
using deletion strategy.
There are also studies which evaluate the benchmark data repository, and possible
improvement in data repositories. Gencel, Buglione, and Abran (2009) mentioned
some reasons which cause disagreement in relating effort and cost drivers. Not
existing an international standard for creating benchmarking data repository and
difficulty in mapping attributes of different repository, are stated as a major problem.
Improvements opportunities for benchmarking and using benchmarking repositories
are suggested in this paper. Developing a standard definition and categorizing
Page 25
10
benchmarking attributes which are used in data repositories, is one of important
improvement opportunities mentioned here, and supported by giving examples from
ISBDG data repository. This allows benchmarking repositories to be unified and
mapped to an internationally accepted standard. Another improvement suggestion for
data repositories stated as reporting effort and duration based on software
development life cycle phases. An improvement and refining way of classifying the
application types in software engineering based on classifications in civil engineering
and two software practice standards of ISO 12182 and ISO 14143-5 has purposed
too.
Distribution of benchmark data is an important issue which influences the accuracy
of software effort estimation. Seo, Yoon, and Bae (2009) proposed a data
partitioning model by using Magnitude of Relative Error (MRE) and Magnitude of
Error Relative (MER) values which subsequently will improve the weak points of
effort estimation models based on least square regression (LSR). They stated that
MRE and MER are usually used in effort estimation accuracy measurement by
considering deviation of data point from LSR. The authors conducted an empirical
experimental study by using two industry data sets: ISBSG Release 9 and a bank data
set which consists of project data from a bank in Korea. In this experimentation by
comparison between estimation accuracy of a single LSR without using partitioning,
and LSR with data partitioning using fuzzy clustering and also proposed partitioning
approach, an improvement in software effort estimation observed. Also the boundary
values for MRE and MER were proposed to be between 0.1 and 0.5 which can
ensure better effort estimation accuracy.
In another study an estimation process proposed by Cuadrado et al. (2007) for
improving predictive accuracy of datasets and overcoming the problem of
heterogeneous projects data in data set. One possible way of overcoming to the
problem of such datasets was proposed to use mathematical equations derived from
partitioning dataset according to different parameters and subsequently clustering
these partitions for finding more accurate model. They used ISBSG release 8 for
validating proposed process. The steps of proposed effort estimation process were:
first according to importance of attributes data repository were divided to partitions,
then by using EM algorithm partitions were clustered, then for each cluster
Page 26
11
regression equation was calculated, and finally in order to perfume new estimation
according to available data a regression equation should be selected. In addition, in
this study a tool support for effort estimation was presented to facilitate the
estimation process.
However in another study Huang et al. (2008) investigated the accuracy of the effort
estimation models which are derived from data clustered by diverse effort drivers.
Ordinary least square (OLS) regression method, which is a popular method in
creating software effort estimation models, is used to establish effort estimation
model in each dataset clustered by effort derivers. Next, difference of accuracy in
effort estimates are compared between clustered and not clustered data. In this
research Pearson Correlation, and one way ANOVA were used to identify the effort
drives for utilizing in software estimation model. Then, k-means and Scheffe‘s
method are used to cluster effort drivers which obtained from previous stage. After
clustering effort drivers, by using OLS method, effort estimation model was
established for each group. ISBSG repository version 7 was used in this study.
Projects with quality rating ―C‖ and ―D‖ were excluded from the study, and data
which had International Function Point User Group (IFPUG) counting approach are
selected. Among these selected data there were projects with missing data, after
excluding them a remaining 171 projects were selected to be used in this research.
They selected six effort drivers as function points (FP), max team size (MTS),
development type (DT), development platform (DP), language type (LT), and
methodology acquired (MA). The results of their study show that software effort
estimation models based on homogeneous and inhomogeneous datasets do not differ
in producing accurate effort estimates.
The impact of development type, and used language as project factors are examined
by Moses, Farrow, Parrington, and Smith (2006) on effort estimation and
productivity. The aim of this study was to provide a comparison of productivity rates
of a company with productivity rates of international data repositories. In this study,
projects data of ISBSG (2003) data repository and projects data used in Reifer in a
paper were used. In Reifer‘s paper 500 projects from 38 organizations are utilized.
They examined three productivity measures: Hours per Line of Code HR/SLOC,
Source Lines of Code per Staff month SLOC/SM, and Hours per Function Points
Page 27
12
HR/FP. This study showed that the productivity rate for the studied company is
higher than ISBSG and Reifer Consultants Incorporated data repository. The reasons
behind this outperforming are indicated by several factors. Firstly, in the company
projects were led by company staff that had wide company knowledge of both
systems and business processes. Secondly, the company had an optimized
development process, and those activities which do not add any value were
eliminated from development process of the company. Thirdly, the company is data
model driven and it supports Rapid Application development and reuse code. Lastly,
in this company a programming language and a DBMS were used for developing
which developers had several years of experience in them within the organization.
The study shows that ignoring projects data can result in inaccurate productivity
rates.
2.1.2. Developed estimation models and improvement opportunities for effort
estimation
Many effort estimation models have been suggested by researchers based on using
benchmark data repositories. There are many studies which evaluate the accuracy of
these methods. Jeffery, Ruhe, and Wieczorek (2000) investigated accuracy difference
between two estimation models of ordinary least squares (OLS) regression as
parametric technique and analogy-based estimation as non-parametric technique.
They used magnitude of relative error (MRE) for evaluation of estimation models.
Also, the difference of estimation accuracy between estimation derived from multi-
company data and company-specific data is explored. They used multi organization
data of ISBSG and compared the accuracy results of estimation with the results of
using company-specific data from an Australian company which at that time did not
contribute to ISBSG data repository. As a result they observed that estimation
accuracy in estimates using company specific data is higher than estimates using the
ISBSG data repository. They observed that in using company data both OLS
regression and analogy can be considered, but in using ISBSG data set for a non-
contributing company OLS regression should be considered rather than analogy
based estimation.
Neural networks are one of software effort estimation methods which are often
selected because of their capability to approximate any continuous function with
Page 28
13
arbitrary accuracy. Setiono, Dejaeger, Verbeke, Martens, and Baesens (2010) applied
a comprehensible if-then rules derived from neural networks trainings in software
effort estimation based on rule extraction method. For validating this proposed
method, they used ISBSG release 11. They compared the neural network extraction
algorithm with three other methods: ordinary least square (OLS) regression, radial
basis function networks, and Classification and Regression Trees (CART). They
observed that CART method results in most accurate estimations, but because of
CART tree size the obtained model did not have comprehensibility. The authors
stated that, by considering comprehensibility, the neural network by role extraction is
more suitable for effort estimation.
In another study Liu, Qin, Mintram, and Ross (2008) applied the framework which
has been proposed by Liu and Mintram in 2005 to ISBSG data repository release 9 to
with the purpose of demonstrating practical utility of this framework. This
framework applies statistical analysis to a publicity dataset, in order to remove
outlier variables and identify the dominate variables. As evaluation metrics they used
Mean Magnitude of Relative Error (MMRE), Median of Magnitude of Relative Error
(MdMRE), balanced MMRE (BMMRE), Magnitude of Error Relative (MER), mean
MER (MMER), median of MER (MdMER), and prediction at level 1. They results
show that removing outliers, and removing inter-correlated predictor variables will
improve accuracy of effort estimation. Also, they came up with conclusions: a few
variables in this case study contributed the most effort prediction, and the models
using parametric techniques (ordinary least squares regression and Robust
Regression Model) have estimation accuracy higher than non-parametric techniques.
Bourque, Oligny, Abran, and Fournier (2007) proposed a model for software
engineering project duration based on project effort. They used ISBSG data
repository fourth release for their analysis. Models for developed projects for
personal computer, midrange, mainframe platforms, and for entire project types are
created. Also different models are built for projects with required effort fewer and
more than 400 person-hours. Meanwhile, investigating was conducted to opportunity
of constructing model directly from project functional size, and results revealed that
estimation can be derived from project size, and also it gives better estimation.
Lastly, the impact of maximum number of resources on duration of project was
Page 29
14
examined, and using this attribute increased 10% more duration variance.
Observations showed that relation between effort and duration of project is not
linear, and there is an exponential in the range of 0.3 and 0.4. The developed models
show that ―first order‖ estimation from effort values can be used for estimating
duration of the project.
On the other hand, different techniques have been utilized for improvement of effort
estimation models. Huang and Chiu (2006) investigated the appropriate weighted
similarity measures for each effort drivers in analogy based effort estimation model
by using genetic algorithm in order to observe improvement on effort estimation
accuracy. Three different analogy methods which studied in this paper are: unequally
weighted, linearly weighted, and nonlinearly weighted methods. ISBSG dataset
release 8 and IBM DP services databases are used to in experimental study. They
observed that the weighted analogy methods generated higher software effort
estimation accuracy rather than traditional unweighted approach, and this
demonstrates that using genetic algorithm for finding weights for effort derives
provide better results in compare to subjective weights assigned by experts.
Software engineering research community presented many models for effort
estimation which function point (FP) is one of them. FP method is a useful software
estimation methodology to improving project estimation accuracy. A study was
conducted by Ahmed, Salah, Serhani, and Khalil (2008) to adjusting the complexity
weight metric of function point (FP). In order to adjust the complexity weight
metrics of FP, genetic algorithm based approach is used. They consider a
chromosome as a vector of real parameters, and a gene as a real number representing
one FP complexity weight. They also used 40% two-cut point, 20% uniform, and
20% arithmetic crossover operations by 0.7 probabilities, and random mutation
operation by 0.2 probabilities to find better results. They used MMRE as fitness
function in their genetic algorithm. Also, ISBSG data repository release 9 was used
in this research, and they selected 600 data from ISBSG by considering quality rating
of ―A‖ and ―B‖ and also new development projects with IFPUG counting approach.
As a result, by using information and integration of past projects FP structural
elements and using genetic algorithm, they observed an average of 50%
improvement in MMRE.
Page 30
15
Lokan and Mendes (2009) investigated the difference of effort estimation accuracy
between project by project split and date based split against each other. Accordingly,
by considering project by project chronological splitting and date based splitting, and
using multivariate regression estimation models were built, and evaluated using
training set (from which the model is built) and testing set (which the model
accuracy is assessed). ISBSG release 10 is used in this study, which contained 4106
projects. They excluded projects with quality rating not equal to ―A‖ and ―B‖, and
projects with measurement approach not equal to IFPUG. They also excluded
projects which their unadjusted function points, and development team effort are
unknown, and projects which had extremely influential, so they come up with 906
projects. As a result they stated in their study, estimation accuracy using a simple
date based split seems to be the same as estimation accuracy sing a project by project
split. But because of the threats to validity which they stated themselves (ISBSG is
not a random sample project, and assumptions they take in order to build models
automatically, and not stabling their results) they didn‘t generalize their findings, and
they stated it needs further study.
In most effort estimation researches all assumptions are on the fact that software size
is a primary predictor, so it should not be underestimated. So, Gencel and Demirors
(2008) revisit the function size measurement (FSM) methods in order to find
improvement opportunity for FSM, and subsequently improvement in benchmarking
and effort estimation. They used International Software Benchmarking Standards
Group (ISBSG) for their empirical study. Among their findings, the convertibility of
size among different functional size methods, considering the target functional
domain type of FSM methods, developing methods for size estimation in earlier
stages of life cycle before availability of FURs, and convertibility of size for later
phases in life cycle are more effective in later effort estimation improvements.
There are many studies which investigate new size estimation techniques and effort
estimation models to improve effort estimation accuracy, but a few of studies pay
attention to quality of historical data which were used in constructing estimation
models (Tunalilar, S., 2011). Tunalilar (2011) proposed an effort estimation
methodology for organization in order to manage effort estimation processes within
the organizations. In this methodology, all necessary steps of effort estimation
Page 31
16
processes are defined which include data collection, size measurement, data analysis,
calibration, effort estimation processes. Also, effect of functional similarity, and
application domain of project are investigated in this study. The results of this study
showed that considering functional similarity, a Base Functional Components (BFC),
and classifying projects by application domains of them improve correlation between
effort and size.
Page 32
17
CHAPTER 3
SOFTWARE BENCHMARKING APPROACH FOR EFFORT
ESTIMATION
In this chapter a software benchmarking methodology is proposed for effort
estimation. This approach consists of three parts; benchmarking measures,
benchmarking data collection processes, and benchmarking tool. In the section 3.1 of
this chapter benchmarking measures are explained in detail. In the section 3.2,
benchmarking processes are introduced. Finally, section 3.3 presents the developed
benchmarking tool for automating the methodology.
3.1. Benchmarking Measures
There are many benchmarking measures which are collected in benchmarking data
repositories. However in most of the organizations projects data is not kept in such a
detail and this leads to sparseness of the benchmarking data repositories. As
discussed earlier in the literature review, although International Software
Benchmarking Standards Group (ISBSG) initiated benchmarking standardization
studies in 2008, there is not a benchmarking standard yet.
The aim of benchmarking measures in our methodology is to define projects‘ data
attributes which should be collected in organizations to build an effective
benchmarking data repository. In defining these attributes several points were taken
into account. Firstly, these attributes were chosen based on compatibility with project
attributes of ISBSG data repository. This compatibility will let organizations to
follow the same standardization efforts which ISBSG tries to make. Secondly,
projects attributes which includes important information for organizations were
selected as benchmarking measures in this methodology. Thirdly, we examined each
Page 33
18
selected benchmarking measure to find out if they can be collected in practice in
other organizations or not. Also, applicability of each of these measures was
inspected in three different organizations.
In our study 49 attributes are considered for the purpose of benchmarking data
collection. These attributes are classified into 6 groups of attributes which are
Submission Attributes, Project Attributes, Product Attributes, Size Attributes, Effort
Attributes, and Productivity Factors. Following are the definition of these groups and
included attributes:
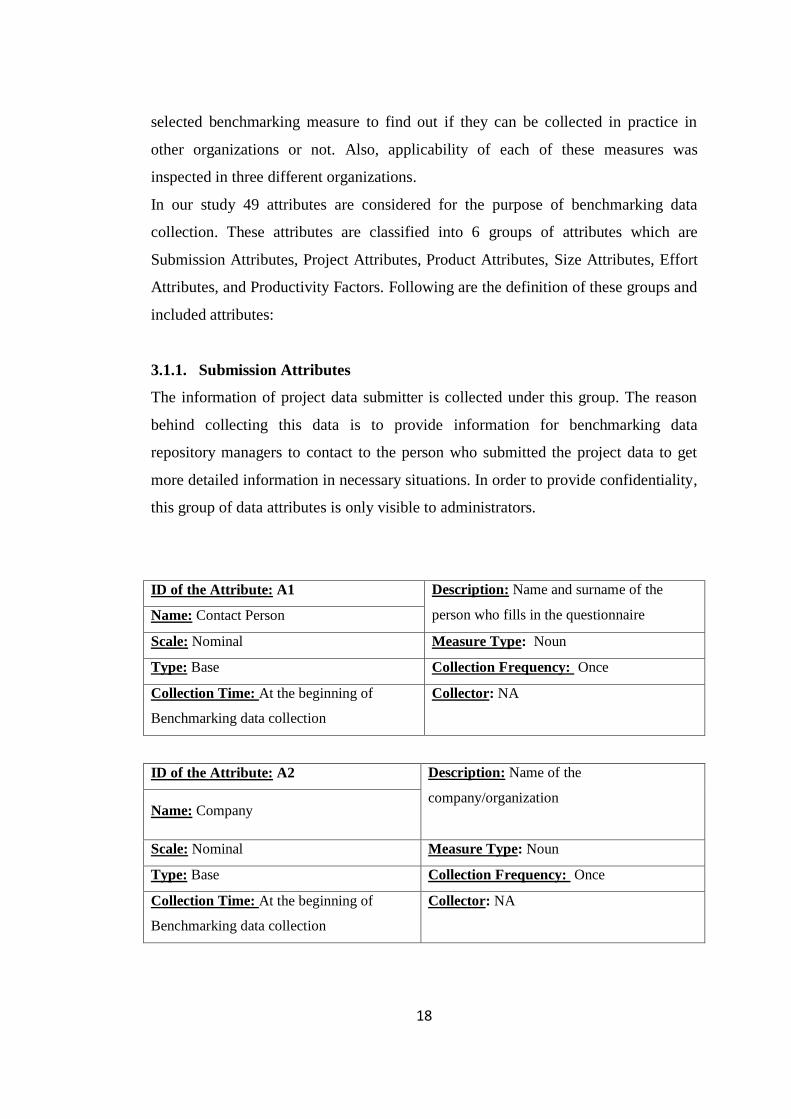
3.1.1. Submission Attributes
The information of project data submitter is collected under this group. The reason
behind collecting this data is to provide information for benchmarking data
repository managers to contact to the person who submitted the project data to get
more detailed information in necessary situations. In order to provide confidentiality,
this group of data attributes is only visible to administrators.
ID of the Attribute: A1 Description: Name and surname of the
person who fills in the questionnaire Name: Contact Person
Scale: Nominal Measure Type: Noun
Type: Base Collection Frequency: Once
Collection Time: At the beginning of
Benchmarking data collection
Collector: NA
ID of the Attribute: A2 Description: Name of the
company/organization
Name: Company
Scale: Nominal Measure Type: Noun
Type: Base Collection Frequency: Once
Collection Time: At the beginning of
Benchmarking data collection
Collector: NA
Page 34
19
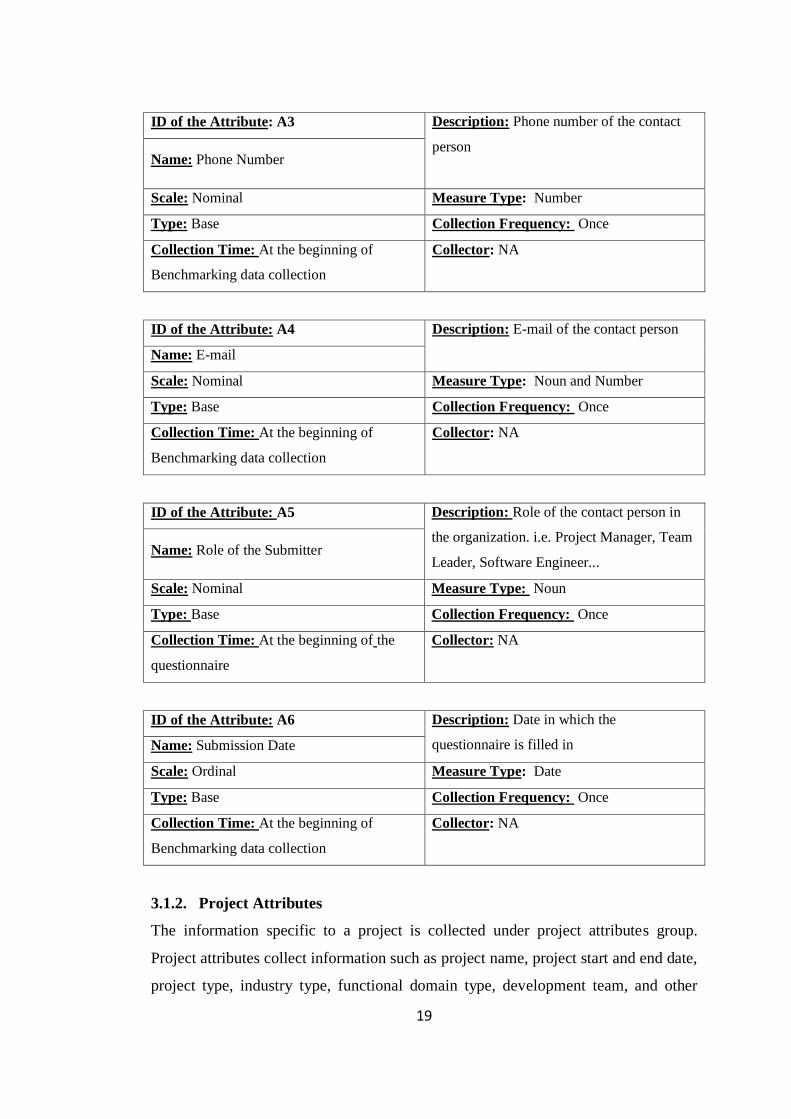
ID of the Attribute: A3 Description: Phone number of the contact
person
Name: Phone Number
Scale: Nominal Measure Type: Number
Type: Base Collection Frequency: Once
Collection Time: At the beginning of
Benchmarking data collection
Collector: NA
ID of the Attribute: A4 Description: E-mail of the contact person
Name: E-mail
Scale: Nominal Measure Type: Noun and Number
Type: Base Collection Frequency: Once
Collection Time: At the beginning of
Benchmarking data collection
Collector: NA
ID of the Attribute: A5 Description: Role of the contact person in
the organization. i.e. Project Manager, Team
Leader, Software Engineer... Name: Role of the Submitter
Scale: Nominal Measure Type: Noun
Type: Base Collection Frequency: Once
Collection Time: At the beginning of the
questionnaire
Collector: NA
ID of the Attribute: A6 Description: Date in which the
questionnaire is filled in Name: Submission Date
Scale: Ordinal Measure Type: Date
Type: Base Collection Frequency: Once
Collection Time: At the beginning of
Benchmarking data collection
Collector: NA
3.1.2. Project Attributes
The information specific to a project is collected under project attributes group.
Project attributes collect information such as project name, project start and end date,
project type, industry type, functional domain type, development team, and other
Page 35
20
information about the project. These attributes will be used in selecting homogenous
projects data for effort estimation.
ID of the Attribute: B1 Description: Name of the project
Name: Name of the Project
Scale: Nominal Measure Type: Date
Type: Base Collection Frequency: Once
Collection Time: At the beginning of the
project
Potential Collector: Project Manager
ID of the Attribute: B2 Description: Start date of the project in the
format of DD/MM/YY. If the exact date is
not known MM/YY is acceptable Name: Project Start Date
Scale: Ordinal Measure Type: Date
Type: Base Collection Frequency: Once
Collection Time: At the beginning of the
project
Potential Collector: Project Manager
ID of the Attribute: B3 Description: End date of the project in the
format of DD/MM/YY. If the exact date is
not known MM/YY is acceptable Name: Project End Date
Scale: Ordinal Measure Type: Date
Type: Base Collection Frequency: Once
Collection Time: At the end of the project Potential Collector: Project Manager
ID of the Attribute: B4 Description: Classification of the project
based on whether it is New Development,
Enhancement, Maintenance or
Redevelopment
Name: Project Type
Scale: Nominal Measure Type: Noun
Type: Base Collection Frequency: Once
Collection Time: At the beginning of the
project
Potential Collector: Project Manager
Detailed Description: (a) New Development—At least %90 of the system is developed
Page 36
21
from scratch or totally new. (b) Maintenance— The system is in use, however, functions
added, updated or deleted. At least % 90 of the system is protected; % 10 of the system is
new developed. (c) Enhancement —Modification percentage on an existing system can be
from %10 to % 90. (d) Redevelopment---- The system is rebuild based on an existing system
without making any changes on functional requirements. (ref. IPA/SEC)
ID of the Attribute: B5 Description: Classification of the projects
in one of the industry types based on the
given list. Name: Industry Type
Scale: Nominal Measure Type: Noun
Type: Base Collection Frequency: Once
Collection Time: At the beginning of the
project
Potential Collector: Project Manager
Detailed Description: (a) Information Systems and Communications, (b) Finance,
(c)Transport, (d) Wholesale and Trail, (e) Manufacturing, (f)Medical, Healthcare,
(g)Education and Learning, (h)Government (i) Insurance (adopted from IPA/SEC)
ID of the Attribute: B6 Description: Classification of the projects
in one of the industry types based on the
given list. Name: Functional Domain Type
Scale: Nominal Measure Type: Noun
Type: Base Collection Frequency: Once
Collection Time: At the beginning of the
project
Potential Collector: Project Manager
Detailed Description: Char Method ISO/IEC 14143-5
Functional Domain Type
Control- and
Communication-
Rich
Data-
Rich
Manipulation-
and Algorithm-
Rich
Pure Data Handling System negligible dominant negligible
Information System negligible dominant present
Data Processing System negligible present present
Controlling Information System present dominant negligible
Controlling Data System present present negligible
Complex Controlling Information present dominant present
Page 37
22
System
Non-Specific (Complex) System present present present
Simple Control System dominant negligible negligible
Control System present negligible present
Complex Control System dominant negligible present
Data Driven Control System dominant present negligible
Complex Data Driven Control System dominant present present
Pure Calculation System negligible negligible dominant
Controlling Calculation System present negligible dominant
Scientific Information System negligible present dominant
Scientific Controlling Data
Processing System present present dominant
ID of the Attribute: B7 Description: It is new business if the project
is new in one of the industry or functional
domain types Name: New Business Area or not
Scale: Nominal Measure Type: Noun
Type: Base Collection Frequency: Once
Collection Time: At the beginning of the
project
Potential Collector: Project Manager
ID of the Attribute: B8 Description: Weather new technology is
used in the project or not. Architecture,
platform, programming language and DBMS
should be considered.
Name: New Technology or not
Scale: Nominal Measure Type: Noun
Type: Base Collection Frequency: Once
Collection Time: At the beginning of the
project
Potential Collector: Project Manager
ID of the Attribute: B9 Description: What kind of tool support has
been used during development process? i.e.
IDE, CVS, CASE Tools Name: Tools‘ Use
Scale: Nominal Measure Type: Noun
Page 38
23
Type: Base Collection Frequency: Once
Collection Time: After the project planning
phase
Potential Collector: Project Manager, Team
Leader
ID of the Attribute: B10 Description: Programming and tool skills,
experiences of the development team
members on average in years. i.e: 2 years
Name: Experiences of the development
team members
Scale: Ratio Measure Type: Noun
Type: Base Collection Frequency: Once
Collection Time: At the initiation phase of
the project
Potential Collector: Project Manager, Team
Leader
ID of the Attribute: B11 Description: Number of the people who
involved in the one of the phases of the
project.
Name: Number of the team members
Scale: Ratio Measure Type: Number
Type: Base Collection Frequency: Once
Collection Time: At the end of the project Potential Collector: Project Manager, Team
Leader
ID of the Attribute: B12 Description: Degree of the team member
change for the whole software life cycle. Name: Stability of the team
Scale: Ratio Measure Type: Number
Type: Derived Collection Frequency: Once
Collection Time: At the end of the project Potential Collector: Project Manager, Team
Leader
Formula: (Number of the changed members)/Total numbers of team members
3.1.3. Product Attributes
The information related to products is collected under this category. Product
attributes include programming language, data base management system,
architecture, software development methodology, information related to platform,
Page 39
24
and reuse rate. These attributes will also be used in selecting homogenous projects
data for effort estimation.
ID of the Attribute: C1 Description: Name of the programming
language used in the project Name: Programming Language
Scale: Nominal Measure Type: Noun
Type: Base Collection Frequency: Once
Collection Time: After the project planning
phase
Potential Collector: Project Manager, Team
Leader
Detailed Description: (a) Assembly language, (b) COBOL, (c) PL/I, (d) C++, (e) Visual
C++, (f) C, (g) VB,(h)Excel (VBA), (i)PL/SQL, (j): C#, (k) ABAP, (l): Visual Basic.NET,
(m) Java, (n) Perl, (o) Shell script, (p) Delphi, (r)HTML, (s) XML. (ref. IPA/SEC)
ID of the Attribute: C2 Description: Name of the data base
management system used in the project Name: DBMS
Scale: Nominal Measure Type: Noun
Type: Base Collection Frequency: Once
Collection Time: After the project planning
phase
Potential Collector: Project Manager, Team
Leader
Detailed Description: a: Oracle, b: SQL Server, c: PostgreSQL, d: MySQL, e: Sybase, f:
Informix, g: ISAM, h: DB2, i: Access, j: HiRDB, k: IMS, l: Other (description), m: None.
(ref. IPA/SEC)
ID of the Attribute: C3 Description: Name of the architecture type
used in the developed project. Name: Architecture
Scale: Nominal Measure Type: Noun
Type: Base Collection Frequency: Once
Collection Time: After the project planning
phase
Potential Collector: Project Manager, Team
Leader
Detailed Description: a: Stand-alone b: Client/Server Model (2 tier, 3 tier...) c: Search
Oriented Architecture d: Service Oriented Architecture e: Distributed Computing f:Peer to
Peer g: Other
Page 40
25
ID of the Attribute: C4 Description: Name of the life cycle model
followed in the project. i.e. Waterfall,
Iterative, Evolutionary, Spiral, Agile, Object
Oriented other.
Name: Software Development Methodology
Scale: Nominal Measure Type: Noun
Type: Base Collection Frequency: Once
Collection Time: After the project planning
phase
Potential Collector: Project Manager, Team
Leader
ID of the Attribute: C5 Description: Does the organization has
CMM, CMMI, SPICE certification or not. Name: Process improvement standard
existence
Scale: Nominal Measure Type: Noun
Type: Base Collection Frequency: Once
Collection Time: After the project planning
phase
Potential Collector: Project Manager, Team
Leader
ID of the Attribute: C6 Description: If the project is conducted
based on standards or not. IEEE-830-1998,
IEEE-1058-1998,etc. Name: Standard Use
Scale: Nominal Measure Type: Noun
Type: Base Collection Frequency: Once
Collection Time: After the project planning
phase
Potential Collector: Project Manager, Team
Leader
ID of the Attribute: C7 Description: What is the target operating
system? i.e. Linux, Unix, .Net, Java Name: Platform Use
Scale: Nominal Measure Type: Noun
Type: Base Collection Frequency: Once
Collection Time: After the project planning
phase
Potential Collector: Project Manager, Team
Leader
Page 41
26
ID of the Attribute: C8 Description: What is the Algorithm
complexity level which is used in project? Name: Algorithm Complexity Level
Scale: Ordinal Measure Type: Noun
Type: Base Collection Frequency: Once
Collection Time: After requirements and
design phase
Potential Collector: Project Manager, Team
Leader
Detailed Description: These three levels of complexity is interpretation of algorithm
complexity in subjective way.
1. Basic Algorithms (Level 1): Small algorithms include only basic mathematical
calculations and simple data manipulations which are: Derived data creation by
transforming existing data, Mathematical formulas/calculations, Condition analysis
to determine which are applicable, Data validation, Equivalent-value conversion,
and Data filtering/selection by specified criteria. This classification of data
manipulation is adopted from action type list defined in Santillo & Abran (2006).
2. Medium complex algorithms (Level 2): Algorithms in this level include medium
complex algorithms which have different operations than defined action type above
(defined in the basic algorithms), and in these algorithms there isn‘t any integration
with other algorithms in the system. Also, in this kind of algorithms there isn‘t
parallel and multitasking usage of processes. In this level the input of algorithms
are a group of parameters, and the result of medium complexity operation can be
one or several outputs.
3. Very complex algorithms (Level 3): Algorithms which includes very complex
operations, and there is integration with other algorithms. In this kind of algorithms
extra hardware are involved. In addition, in this kind of algorithms, there are real
time criteria as limitation factors.
ID of the Attribute: C9 Description: Percentage of reused LOC of
software components. Name: Reuse rate of source code
Scale: Ratio Measure Type: Number
Type: Derived Collection Frequency: Once
Collection Time: At the end of the project Potential Collector: Project Manager, Team
Leader
Formula: %software component reused
By reuse we mean the percentage of effort consumed for reusing.
Page 42
27
3.1.4. Size Attributes
The size of software projects are measured by using the COSMIC function size
measurement according to ISO/IEC as an international standard. Project size data is
collected in BFC level, and not only numerical information is kept, but also
functional requirements, data groups, object of interests, and data movements are
collected under this attribute group. In this case it is possible to calculate functional
similarity which reflects the project size better.
ID of the Attribute: D1 Description: Detailed size data in COSMIC
(functional requirements, data groups, object
of interest, and data movements) Name: Detailed Size Data in COSMIC
Scale: ratio Measure Type: number
Type: Base Collection Frequency: Once
Collection Time: In the project planning
phase
Potential Collector: Project Manager,
software engineer
Detailed Description: Project size is measured by using COSMIC method, and detailed size
data of the project is collected.
ID of the Attribute: D2 Description: Number of Entries in
COSMIC measurement Name: Number of Entries
Scale: Ratio Measure Type: Number
Type: Base Collection Frequency: Once
Collection Time: In the project planning
phase
Potential Collector: Project Manager,
software engineer
ID of the Attribute: D3 Description: Number of Exits in COSMIC
measurement Name: Number of Exits
Scale: Ratio Measure Type: Number
Type: Base Collection Frequency: Once
Collection Time: In the project planning
phase
Potential Collector: Project Manager,
software engineer
Page 43
28
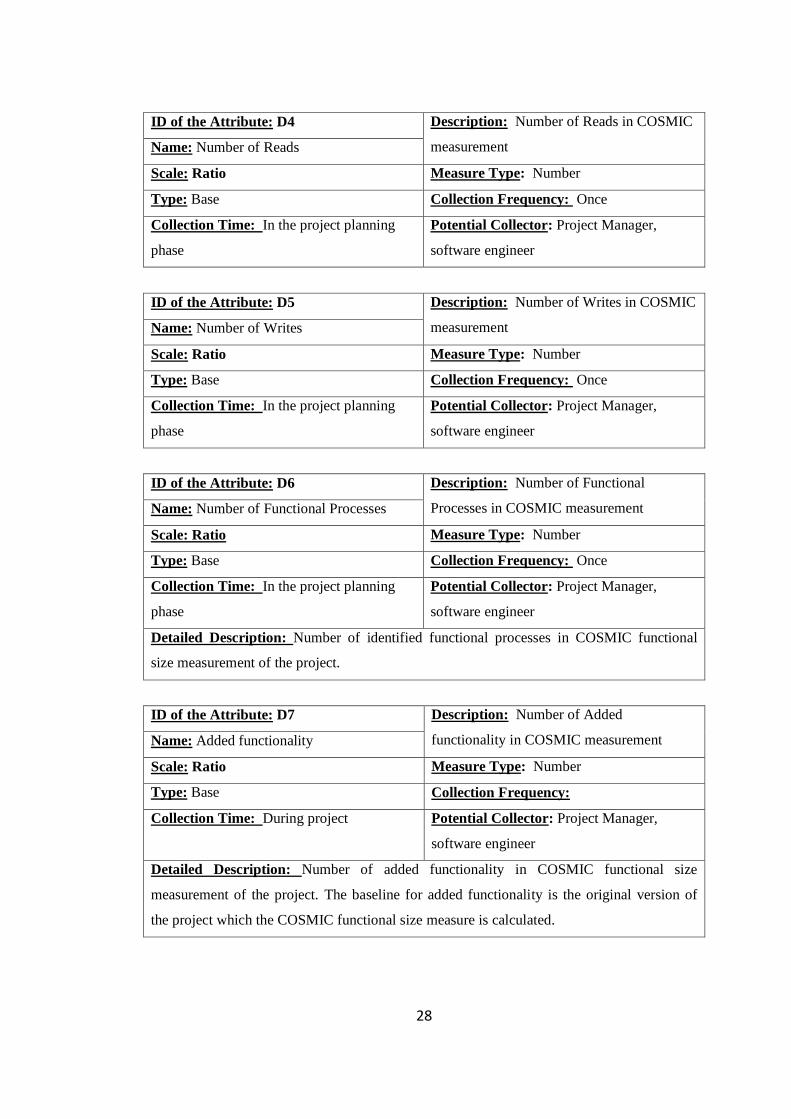
ID of the Attribute: D4 Description: Number of Reads in COSMIC
measurement Name: Number of Reads
Scale: Ratio Measure Type: Number
Type: Base Collection Frequency: Once
Collection Time: In the project planning
phase
Potential Collector: Project Manager,
software engineer
ID of the Attribute: D5 Description: Number of Writes in COSMIC
measurement Name: Number of Writes
Scale: Ratio Measure Type: Number
Type: Base Collection Frequency: Once
Collection Time: In the project planning
phase
Potential Collector: Project Manager,
software engineer
ID of the Attribute: D6 Description: Number of Functional
Processes in COSMIC measurement Name: Number of Functional Processes
Scale: Ratio Measure Type: Number
Type: Base Collection Frequency: Once
Collection Time: In the project planning
phase
Potential Collector: Project Manager,
software engineer
Detailed Description: Number of identified functional processes in COSMIC functional
size measurement of the project.
ID of the Attribute: D7 Description: Number of Added
functionality in COSMIC measurement Name: Added functionality
Scale: Ratio Measure Type: Number
Type: Base Collection Frequency:
Collection Time: During project Potential Collector: Project Manager,
software engineer
Detailed Description: Number of added functionality in COSMIC functional size
measurement of the project. The baseline for added functionality is the original version of
the project which the COSMIC functional size measure is calculated.
Page 44
29
ID of the Attribute: D8 Description: Number of Deleted
functionality in COSMIC measurement Name: Deleted functionality
Scale: Ratio Measure Type: Number
Type: Base Collection Frequency:
Collection Time: During project Potential Collector: Project Manager,
software engineer
Detailed Description: Number of Deleted functionality in COSMIC functional size
measurement of the project. The baseline for deleted functionality is the original version of
the project which the COSMIC functional size measure is calculated.
ID of the Attribute: D9 Description: Number of Changed
functionality in COSMIC measurement Name: Changed functionality
Scale: Ratio Measure Type: Number
Type: Base Collection Frequency:
Collection Time: During project Potential Collector: Project Manager,
software engineer
Detailed Description: Number of Changed functionality in COSMIC functional size
measurement of the project. The baseline for changed functionality is the original version of
the project which the COSMIC functional size measure is calculated.
ID of the Attribute: D10 Description: Reflective functional
similarity size
Name: Reflective functional similarity size
Scale: ratio Measure Type: number
Type: derived Collection Frequency: Once
Collection Time: In the project planning
phase, after completion of measurement
Potential Collector: Project Manager,
software engineer
Detailed Description: Project size is measured by using COSMIC method, and reflective
functional similarity is calculated using detailed size of project (OzanTop O., 2008)
3.1.5. Effort Attributes
Effort data is collected based on ISO 12207 Software life cycle processes standard
under 11 categories: Project management activities, requirements definition
activities, design activities, coding activities, software integration activities, Testing
Page 45
30
activities, system installation activities, operation activities, quality assurance
activities, quality management activities, and maintenance activities. As mentioned
before, these effort attributes are defined based on ISO 12207 standard, and in this
international standard the use of any particular life cycle model is not required. So,
by following various types of life cycle models such as waterfall, incremental
development, evolutionary development, and etc. it is possible to detect defined
efforts. Thus, categorization of effort data is life cycle independence. Moreover,
Effort data for each of these activities are kept in detailed level. Based on the level of
effort data and how these data is collected, quality of effort data is classified into
three levels.
ID of the Attribute: E1 Description: Total actual effort in person
hours for the whole project life cycle. Name: Actual Total Effort in person hours
Scale: Ratio Measure Type: Number
Type: Base Collection Frequency: Once
Collection Time: At the end of the project Potential Collector: Project Manager, Team
Leader
ID of the Attribute: E2.1 Description: Total actual effort in person
hours for the project management activities.
For details check detailed description.
Name: Total Actual Effort Project
Management Activities
Scale: Ratio Measure Type: Number
Type: Base Collection Frequency: Once
Collection Time: During the project life
cycle
Potential Collector: Project Manager, Team
Leader
Detailed Description: Project Management Activities include:
6.3.1 Project Planning Activities: to determine the scope of the project management and
technical activities, process outputs, project tasks and deliverables; to establish schedule for
project task conduct, including achievement criteria, and required resources to accomplish
project tasks.
6.3.2 Project Assessment and Control Activities: to determine the status of the project and
ensure that the project performs according to plans and schedules, and within projected
budgets, and that it satisfies technical objectives.
Page 46
31
6.3.3 Decision Management Activities: to select the most beneficial course of project action
where alternatives exist.
6.3.4 Risk Management Activities: to identify, analyze, treat and monitor the risks
continuously.
6.3.5 Configuration Management Activities: to establish and maintain the integrity of all
identified outputs of a project or process and make them available to concerned parties.
6.3.6 Information Management Activities: to provide relevant, timely, complete, valid and,
if required, confidential information to designated parties during and, as appropriate, after
the system life cycle
6.3.7 Measurement Activities: to collect, analyze, and report data relating to the products
developed and processes implemented within the organizational unit, to support effective
management of the processes, and to objectively demonstrate the quality of the products.
ID of the Attribute: E2.2 Description: Total actual effort in person
hours for the requirements definition
activities. For details check detailed
description.
Name: Total Actual Effort Requirements
Definition Activities
Scale: Ratio Measure Type: Number
Type: Base Collection Frequency: Once
Collection Time: At the end of the
requirement definition activities
Potential Collector: Project Manager, Team
Leader
Detailed Description: Requirements Definition Activities include:
6.4.1 Stakeholder Requirements Definition Activities: The purpose of the Stakeholder
Requirements Definition Process is to define the requirements for a system that can provide
the services needed by users and other stakeholders in a defined environment.
It identifies stakeholders, or stakeholder classes, involved with the system throughout its life
cycle, and their needs and desires. It analyzes and transforms these into a common set of
stakeholder requirements that express the intended interaction the system will have with its
operational environment and that are the reference against which each resulting operational
service is validated in order to confirm that the system fulfills needs.
6.4.2 System Requirements Analysis Activities: The purpose of System Requirements
Analysis is to transform the defined stakeholder requirements into a set of desired system
technical requirements that will guide the design of the system.
7.1.2 Software Requirements Analysis Activities: The purpose of Software Requirements
Analysis Process is to establish the requirements of the software elements of the system.
Page 47
32
ID of the Attribute: E2.3 Description: Total actual effort in person
hours for the design activities. For details
check detailed description. Name: Total Actual Effort Design Activities
Scale: Ratio Measure Type: Number
Type: Base Collection frequency: Once
Collection Time: At the end of the design
activities
Potential Collector: Project Manager, Team
Leader
Detailed Description:
Design Activities include:
6.4.3 System Architectural Design Process: The purpose of the System Architectural
Design Process is to identify which system requirements should be allocated to which
elements of the system.
7.1.3 Software Architectural Design Activities: The purpose of the Software Architectural
Design Process is to provide a design for the software that implements and can be verified
against the requirements
7.1.4 Software Detailed Design Process: The purpose of the Software Detailed Design
Process is to provide a design for the software that implements and can be verified against
the requirements and the software architecture and is sufficiently detailed to permit coding
and testing.
ID of the Attribute: E2.4 Description: Total actual effort in person
hours for the software coding activities. For
details check detailed description.
Name: Total Actual Effort Software Coding
Activities
Scale: Ratio Measure Type: Number
Type: Base Collection frequency: Once
Collection Time: At the end of the coding
activities
Potential Collector: Project Manager, Team
Leader
Detailed Description:
7.1.5 Software Construction Activities: This process includes the activities to produce
executable software units that properly reflect the software design.
Page 48
33
ID of the Attribute: E2.5 Description: Total actual effort in person
hours for the software integration activities.
For details check detailed description.
Name: Total Actual Effort Software
Integration Activities
Scale: Ratio Measure Type: Number
Type: Base Collection Frequency: Once
Collection Time: At the end of the
Software Integration Activities
Potential Collector: Project Manager, Team
Leader
Detailed Description: Software Integration Activities include;
6.4.5 System Integration Process: The purpose of the System Integration Process is to
integrate the system elements (including software items, hardware items, manual operations,
and other systems, as necessary) to produce a complete system that will satisfy the system
design and the customers‘ expectations expressed in the system requirements.
7.1.6 Software Integration Activities: This process is to combine the software units and
software components, produce integrated software items.
ID of the Attribute: E2.6 Description: Total actual effort in person
hours for the software testing activities. For
details check detailed description. Name: Total Actual Effort Testing Activities
Scale: Ratio Measure Type: Number
Type: Base Collection Frequency: Once
Collection Time: At the end of the
Software Testing Activities
Potential Collector: Project Manager, Team
Leader
Detailed Description: Testing Activities include;
6.4.6 System Qualification Testing Activities: Systems Qualification Testing Process
includes the activities to ensure that the implementation of each system requirement is tested
for compliance and that the system is ready for delivery.
7.1.7 Software Qualification Testing Activities: This process includes the activities to
confirm that the integrated software product meets its defined requirements.
ID of the Attribute: E2.7 Description: Total actual effort in person
hours for the system installation activities.
For details check detailed description.
Name: Total Actual Effort System
Installation Activities
Scale: Ratio Measure Type: Number
Type: Base Collection frequency: Once
Page 49
34
Collection Time: At the end of the
Software Installation and Acceptance
Activities
Potential Collector: Project Manager, Team
Leader
Detailed Description: System Installation Activities include;
6.4.7 System Installation Activities: The purpose of the Software Installation Process is to
install the software product that meets the agreed requirements in the target environment.
ID of the Attribute: E2.8 Description: Total actual effort in person
hours for the operation activities. For details
check detailed description.
Name: Total Actual Effort Operation
Activities
Scale: Ratio Measure Type: Number
Type: Base Collection frequency: Once
Collection Time: At the end of the
Operation Activities
Potential Collector: Project Manager, Team
Leader
Detailed Description: This process includes the activities to operate the software product in
its intended environment and to provide support to the customers of the software product.
ID of the Attribute: E2.9 Description: Total actual effort in person
hours for the software quality assurance
activities. For details check detailed
description.
Name: Total Actual Effort Software Quality
Assurance Activities
Scale: Ratio Measure Type: Number
Type: Base Collection frequency: Once
Collection Time: At the end of the
Software Quality Assurance Activities
Potential Collector: Project Manager, Team
Leader
Detailed Description: Software Quality Assurance Activities Include;
7.2.3 Software Quality Assurance Process: The purpose of the Software Quality Assurance
Process is to provide assurance that work products and processes comply with predefined
provisions and plans.
7.2.4 Software Verification Process: The purpose of the Software Verification Process is to
confirm that each software work product and/or service of a process or project properly
reflects the specified requirements.
7.2.5 Software Validation Process: The purpose of the Software Validation Process is to
confirm that the requirements for a specific intended use of the software work product are
Page 50
35
fulfilled.
7.2.6 Software Review Process: The purpose of the Software Review Process is to maintain a
common understanding with the stakeholders of the progress against the objectives of the agreement
and what should be done to help ensure development of a product that satisfies the stakeholders.
Software reviews are at both project management and technical levels and are held throughout the life
of the project.
7.2.7 Software Audit Process: The purpose of the Software Audit Process is to
independently determine compliance of selected products and processes with the
requirements, plans and agreement, as appropriate
ID of the Attribute: E2.10
Description: Total actual effort in person
hours for the quality management activities.
For details check detailed description. Name: Total Actual Effort Quality
Management Activities
Scale: Ratio Measure Type: Number
Type: Base Collection frequency: Once
Collection Time: At the end of the Quality
Management Activities
Potential Collector: Project Manager, Team
Leader
Detailed Description: This process includes the activities to assure that products, services
and implementations of life cycle processes meet organizational quality objectives and
achieve customer satisfaction
ID of the Attribute: E2.11
Description: Total actual effort in person
hours for the maintenance activities. For
details check detailed description. Name: Total Effort for Maintenance
Activities
Scale: Ratio Measure Type: Number
Type: Base Collection frequency: Once
Collection Time: At the end of the
Maintenance Activities
Potential Collector: Project Manager, Team
Leader
Detailed Description: 6.4.10 Software Maintenance Process: The purpose of the Software
Maintenance Process is to provide cost-effective support to a delivered software product.
Page 51
36
ID of the Attribute: E3 Description: This question addresses how
the actual effort data was collected in the
organization. Potential answers are –using
timesheets in daily bases, weekly bases, or at
the end of the month; using MS project...
Name: What kinds of procedures were used
for the record of the effort?
Scale: Nominal Measure Type: Noun Phrase
Type: Base Collection Frequency: Once
Collection Time: At the end of the project Potential Collector: Project Manager, Team
Leader
3.1.6. Productivity Factors
Productivity factors which have influence on productivity and effort of the project
are collected under this attribute group. These productivity factors are: reliability,
usability, maintainability, efficiency, and portability. Data related to these factors are
gathered in ordinal scale from a level of 1 to 5.
ID of the Attribute: F1 Description: Requirement volatility is a
measure of how much software requirements
change (added, deleted and modified) after
agreed on a set of requirements by both
client and supplier.
Name: Requirements volatility
Scale: Ratio Measure Type: Number
Type: Base Collection Frequency: Once
Collection Time: At the end of the project Potential Collector: Project Manager, Team
Leader
Detailed Description: Requirements Volatility Percentage=
(added+ deleted+ modified requirements)/(total Number of requirements in the specific
version)
ID of the Attribute: F1 Description: Does a standard or body
impose nonfunctional requirements in
software. Name: Nonfunctional requirements
Scale: Ordinal Measure Type: Number
Type: Base Collection Frequency: Once
Page 52
37
Collection Time: At the end of the project Potential Collector: Project Manager, Team
Leader
Detailed Description: Nonfunctional requirements:
Reliability: Ability of software to behave consistently in an acceptable manner Give a range
from 1 to 5 based on the intensity reliability intensity imposed in the project. 1 is the lowest,
5 is the highest reliability
Usability: Usability of user interface. Give a range from 1 to 5 based on the intensity of the
usability requirements in the project. 1 is the lowest, 5 is the highest usability
Maintainability Level of cohesion and coupling. Give a range from 1 to 5 based on the
intensity maintainability requirements in the project. 1 is the lowest, 5 is the highest
maintainability
Efficiency: The level at which software uses system resources. Give a range from 1 to 5
based on the intensity efficiency requirements in the project. 1 is the lowest, 5 is the highest
efficiency
Portability: The degree of ease to port software running on one system environment to
another one. Give a range from 1 to 5 based on the intensity portability requirements in the
project. 1 is the lowest, 5 is the highest portability.
ID of the Attribute: F3 Description Is the system Safety Critical or
not. What is the level of it? Name: Is the system Safety Critical or not.
What is the level
Scale: Nominal Measure Type: Number
Type: Base Collection frequency: Once
Collection Time: At the end of the project Potential Collector: Project Manager, Team
Leader
3.2. Benchmarking Data Collection Processes
For the purpose of constructing a reliable benchmarking data repository, not only
projects measures are important, but also data collection processes play critical role
in improving quality of benchmarking projects data (Ozantop, Nabi, & Demirors,
2011). So, in order to improve the accuracy and consistency of the benchmarking
data, data collection processes are defined and modeled based on software
development stages in our methodology. These processes are based on Ozcan Top
and Demirors (2011) technical report and refined in this section. In these data
Page 53
38
collection processes it is determined that in which stage of software development,
which data, and from where should be collected. The benchmarking data collection
processes are modeled in ARIS modeling tool by utilizing the Event-driven process
chain (EPC) notations. In the first level of these processes, data collection
infrastructure and Cubit infrastructure is defined, then in the next stage data
collection process begins, and projects data are collected in the subsequent stages of
the processes. These processes and sub processes are:
1. Infrastructure Definition Process
2. Cubit Infrastructure Definition Process
3. Data Collection Process
3.1. Submission Attributes Data Collection Process
3.2. Project Attributes Data Collection Process
3.3. Product Attributes Data Collection Process
3.4. Software Attributes Data Collection Process size
3.4.1. Measure COSMIC size
4. Effort Attributes Data Collection Process
4.1. Data Collection Process for Project Management Effort Data
4.2. Data Collection Process for Requirements‘ Activities Effort Data
4.3. Data Collection Process for Design Activities‘ Effort Data
4.4. Data Collection Process for Integration Activities‘ Effort Data
4.5. Data Collection Process for Test Activities‘ Effort Data
4.6. Data Collection Process for Quality Activities‘ Effort Data
EPC is a dynamic modeling notation to present flow of activities in processes by
unifying static resources of business such as systems, organizations, data, etc. (Davis
& Brabander 2007)
There are four basic type of objects used in EPC: Events, Functions, Rules, and
Resources like data, systems, organizations, etc. Events represent the external
changes which trigger the start of the process, internal changes of states by preceding
the process, and the final outcome of the process. They present the pre-conditions
and post-conditions for each step of processes. Functions represent the activities and
tasks which are executed as part of processes and they receive inputs, creates outputs,
Page 54
39
and use resources. An event can trigger a function, and a function creates one or
more events (Davis & Brabander 2007).
To illustrate the flow of process models, combination of rules with functions and
events are used. There are three types of rules: OR, XOR, and AND rules (Davis &
Brabander 2007). The object symbol and their descriptions which are used in the
benchmarking collection processes are given in Table 1.
Table 1: EPC model objects used in benchmarking data collection processes (Davis &
Brabander 2007)
Object Name Object Symbol Object Description
Function
A function represents the activities
and tasks.
Event
An event represents the external
changes which trigger the start of the
process, internal changes of states by
preceding the process, and the final
outcome of the process.
AND
Following a function, process flow
splits into two or more parallel paths.
Preceding a function, all events must
occur in order to trigger the following
function.
XOR
Following a function, one, but only
one, of the possible paths will be
followed. Preceding a function, one,
but only one, of the possible events
will be the trigger.
Carries out & Supports Carries out & Supports Carries out & Supports Carries out & Supports Carries out & Supports Carries out & Supports Carries out & Supports Carries out & Supports Carries out & Supports Carries out & Supports Other
Org
aniz
ationa...
.
Carries out & Supports Carries out & Supports Carries out & Supports Carries out & Supports Carries out & Supports Carries out & Supports Carries out & Supports Carries out & Supports Carries out & Supports Carries out & Supports Other
Org
aniz
ationa...
.
Page 55
40
Table 1: EPC model objects used in benchmarking data collection processes (Davis &
Brabander 2007) (Continued)
Object Name Object Symbol Object Description
OR
Following a function, one or many
possible paths will be followed as a
result of the decision. Preceding a
function, any one event, or
combination of events, will trigger the
function.
Position
A position is Role performed by
individual person.
Document
Document is an Information Carrier.
Application
System
A software system running on a
computer used to support the carrying
out of a function.
Screen
The design of a particular display
screen format (GUI) used by a system
to support functions requiring user
input or displaying information to
users.
3.2.1. Infrastructure Definition Process
Defining infrastructure is the first process in benchmarking data collection. In this
process project manager, quality manager, software engineer, or benchmarking data
manager is responsible for theoretical defining infrastructure for the organization.
This process begins by a motivation for data collection and the purpose of the
benchmarking data collection is identified in the first place. Subsequently, attributes
of data collection is identified and each attribute will be defined. In this stage the
Carries out & Supports Carries out & Supports Carries out & Supports Carries out & Supports Carries out & Supports Carries out & Supports Carries out & Supports Carries out & Supports Carries out & Supports Carries out & Supports Other
Org
aniz
ationa...
.
Page 56
41
reports and tools which will be used in data collection process, the frequency of data
collection, and also responsible people for data collection are identified.
3.2.2. Cubit Infrastructure Definition Process
Benchmarking data collection Cubit infrastructure is defined in this process.
Benchmark data manager defines Cubit infrastructure for a specific project. As a first
step, an account (user and password) is requested from Cubit manager for benchmark
data manager of the organization. After receiving Cubit account information,
benchmark data manager logs in to Cubit and defines users for benchmark
responsible persons in the organization, and send user information to responsible
persons. In order to collect benchmarking data, benchmarking questions, answer
types, and questions types are defined by benchmarking data manager as a Cubit
benchmarking infrastructure for target organization.
3.2.3. Data Collection Process
In this process, benchmarking data manager or benchmarking responsible person
define the project. Subsequently data related to projects attributes, product attributes,
software size measurement, project efforts, and productivity factors data are
collected. This process contains sub processes for collecting each benchmarking
attributes category.
3.2.3.1. Project Data Collection Process
In this process project attributes such as project name, project start and end date,
project type, industry type, functional domain type, development team, and other
information about the project are collected. Project attributes data are extracted by
data submitter from related reports or documents. First, project Charter is checked
for identifying project name, and project name is entered using answer benchmarking
questions screen of Cubit. The next steps are to check out project plan, Gantt chart,
and Work Breakdown Structure (WBS) to identify project start and end date, and
then submitting them to Cubit. In order to find project type and industry type of the
target project Software Requirement Specification (SRS) and attribute definition
document (or organization benchmark report) should be examined. Project
Page 57
42
management plan and human resource management record are other artifacts which
should be examined to extracting project attributes data.
3.2.3.2. Product Data Collection Process
Benchmarking data for product attributes category are collected in this process.
Product data should be extracted from relevant documents and reports, and then
submitted to the Cubit by using benchmarking screens. In order to identify
programming language attribute, submitter should refer to SRS, technical
management plan, and also attribute definition document. Software design and
architecture design are the next documents which should be checked for identifying
architecture type of the project. Following these, software development methodology
is identified by referring to project management plan and also attribute definition
document. Technical management plan and source code are other items which
should be used for identifying other product attributes in an organization.
3.2.3.3. Software Size Data Collection Process
Software size attributes data are collected in this process. As a first step, size
measurement tool should be identified, and then software size of the target project is
measured by using COSMIC measurement method. The number of Entries, Exits,
Reads, and Writes in COSMIC measurement of the project are counted, then total
size in COSMIC Function Point (CFP) is calculated. The number of functional
processes, new added functionalities, deleted functionalities, and modified
functionalities are identified and submitted to the CUBIT.
3.2.3.3.1. Software Functional Size Measurement Process
In this sub process, the process of functional size measurement of the project is
defined. First, measurement scope should be identified by referring to SRS, user
manuals, and user screens of the software. The boundaries should be identified in the
next step. Functional processes, object of interests, data groups, data movements,
added functionalities, deleted functionalities, and changed functionalities are
identified by using COSMIC measurement method. Finally, total size in CFP is
calculated, and size measurement is verified by Cubit.
Page 58
43
3.2.4. Effort Data Collection Process
Data Collection process for effort attributes are given in this process. In this process
effort for each effort attributes, which were identified in benchmarking measures
section (section 3.1) are collected (see APPENDIX). The first step is to identify
effort for project management activities which is done in ―Data Collection Process
for Project Management Effort Data‖ sub process. The next step is to identify effort
for requirement definition activities; this step is also elaborated in ―Data Collection
Process for Requirements‘ Activities Effort Data‖ sub process in section 3.2.4.2.
Following, effort of design activities is collected in ―Data Collection Process for
Design Activities‘ Effort Data‖ sub process. As the next task, in order to identify
effort for coding activities, work items related with coding activities are determined
by referring to project plan, WBS, WBS Dictionary, and project schedule. Then
effort records are mapped to work items of coding activities. Subsequently, effort for
Integration activities, and testing activities are identified by following ―Data
Collection Process for Integration Activities‘ Effort Data‖, and ―Data Collection
Process for Test Activities‘ Effort Data‖ sub processes respectively. The next steps
are identifying items related to installation activities, and operation activities to find
effort of each of these activities. These items should be extracted from project plan,
WBS, WBS Dictionary, and project schedule. After mapping and summing effort
records to work items, work effort for both installation, and operation activities are
collected. Next, effort for software quality assurance activities are collected by
following ―Data Collection Process for Quality Activities‘ Effort Data‖ sub process.
The next tasks are identifying effort for quality management and maintenance
activities similar to the tasks done for identifying effort of coding activities. As a last
task in this process, the procedures which were used for the record of effort are
identified.
3.2.4.1. Data Collection Process for Project Management Effort Data
In this Sub process, data collection process of effort data for project management
activities is elaborated. First step is to identify work items related to developing
Project Plan (6.3.1) by referring to Project Plan, WBS, WBS Dictionary, and project
schedule. Then, effort records are extracted from timesheet application (or any other
Page 59
44
effort record), and these records are mapped to identified work items, and the total
effort for project planning activities are calculated and submitted to Cubit. The next
tasks are identifying work items related with project assessment and control activities
(6.3.2), decision management activities (6.3.3), Risk management activities (6.3.4),
configuration management activities (6.3.5), information management activities
(6.3.6), and measurement activities (6.3.7) respectively in order to find effort
consumed for these activities. For all these tasks the same procedure which was done
for developing project plan will be pursued. At the end, total effort for project
management activities will be calculated and submitted to Cubit.
3.2.4.2. Data Collection Process for Requirements Activities’ Effort Data
Effort data for requirement activities are collected in this sub process. In this process
effort data for stakeholder requirement definition activities (6.4.1), system
requirement analysis activities (6.4.2), and software requirement analysis activities
(7.1.2) are collected. For this purpose, first work items related with each of these
activities are identified by referring to Project Plan, WBS, WBS Dictionary, and
project schedule. Then effort records are mapped to these work items and total effort
for each of these activities are found and submitted to Cubit. After finding effort data
for all of these activities the total effort for requirement phase is calculated and also
submitted.
3.2.4.3. Data Collection Process for Design Activities’ Effort Data
In this sub process, effort data for design activities are collected. In order to find
effort consumed for each design activity of system architectural design activities
(6.4.3), software architectural design activities (7.1.3), and software detailed design
activities (7.1.4), related work items should be identified. Then effort records which
are extracted from timesheet or other artifact are mapped to these work items. After
mapping effort record to work items, the sums of effort of each activity are submitted
to cubit. Lastly, total effort for all activities is calculated as effort of design phase.
3.2.4.4. Data Collection Process for Integration Activities’ Effort Data
Effort data for Integration activities are collected in this sub process. In this process
effort data for System Integration activities (6.4.5) and Software Integration activities
Page 60
45
(7.1.6) are collected. For this purpose, first work items related with each of these
activities are identified by referring to Project Plan, WBS, WBS Dictionary, and
project schedule. Then effort records are mapped to these work items and total effort
for each of these activities are found and submitted to Cubit. After finding effort data
for all of these activities the total effort for Integration phase is calculated and also
submitted to Cubit.
3.2.4.5. Data Collection Process for Test Activities’ Effort Data
Effort data for Test activities are collected in this sub process. In this process effort
data for System Qualification testing activities (6.4.6) and Software Qualification
Testing activities (7.1.7) are collected. For this purpose, first work items related with
each of these activities are identified by referring to Project Plan, WBS, WBS
Dictionary, project schedule, Test Plan, and Test Cases. Then effort records are
mapped to these work items and total effort for each of these activities are found and
submitted to Cubit. After mapping effort record to work items, the sums of effort of
each activity are submitted to cubit. Lastly, total effort for all activities is calculated
as effort of testing phase.
3.2.4.6. Data Collection Process for Quality Activities’ Effort Data
Data collection process for Quality activities‘ effort data is elaborated in this sub
process. The first task in this process is to identify work items related with Software
Quality Assurance activities (7.2.3) by referring to Quality Management Plan,
Project Plan, WBS, WBS Dictionary, and project schedule. Then in order to find
total effort of software quality assurance activities effort records which are extracted
from timesheets are mapped to these identified work items. The next step is to
identify effort data of Software Verification activities (7.2.4) by identifying related
work items. These work items are extracted from Project Plan, WBS, WBS
Dictionary, and project schedule artifacts. Once more effort records are mapped to
these work items to determine the amount of effort consumed for software
verification activities. The same procedure is followed for identifying effort data for
Software Validation Activities (7.2.5). As the next task, work items related with
Software Review activities (7.2.6) is identified by referring to Project Plan, WBS,
Page 61
46
WBS Dictionary, project schedule, and Review Schedules. Afterward, total effort for
software review activities are determined by mapping effort record to these identified
work items. Next, effort data for Software Audit activities (7.2.7) are identified
similarly by referring to Project Plan, WBS, WBS Dictionary, and project schedule
artifacts. After finding effort data for all of these activities the total effort for Quality
activities is calculated and also submitted to Cubit.
3.3. Benchmarking Tool
Considering benchmarking defined measures and data collection processes, an
automated benchmarking data collection tool was integrated on Cubit
(http://smrg.ii.metu.edu.tr/cubit/). The Cubit toolset is a web based application which
have Java technologies and Groovy as an upper level language for its infrastructure.
Cubit toolset is developed by using Grails framework and as DBMS the PostgreSQL
rational database is used. For development of Cubit an iterative and incremental
methodology was pursued. Cubit enables user to measure software projects, and
collect projects size measurements details, define infrastructure for data collection,
and collect benchmarking data in a reliable way.
System administrator of the Cubit is responsible to define an organization and an
administrator user for the organization. Subsequently, organizational administrator
can define several users within the organization.
Several projects can be defined within an organization, and then size measurement
data and benchmarking data of these projects can be collected.
Use case model diagram for Cubit benchmarking is given in Figure 1.
Page 62
47
Figure 1: Use case model for cubit benchmarking part
In the Cubit benchmarking part there are three kinds of user; system administrator,
benchmarking data manager (Benchmarking administrator), and benchmarking
responsible person. As mentioned before, benchmarking administrator is defined by
cubit administrators for an organization. Subsequently, benchmark data administrator
has the responsibility of defining users for persons who are responsible of
benchmarking in the organization.
There are two use cases defined in benchmarking part; Manage benchmarking
question (define cubit infrastructure), and collect benchmarking project data.
Page 63
48
Figure 2: Benchmarking Home
In manage benchmarking question use case, users define new Question Category,
modify and delete existing ones. Also, new benchmarking question can be defined,
modified, deleted, and ordered. It should be mentioned that, based on our
methodology there are questions defined by system administrator, but benchmarking
data manager can also add new questions to question lists. In collect benchmarking
project use case, user answers benchmarking questions and modify previous answers.
The screenshot of benchmarking home page is shown in Figure 2.
Page 64
49
Figure 3: Benchmarking Question Category
To define the infrastructure of benchmarking questions, the benchmarking data
administrator defines benchmarking question categories, and subsequently
benchmarking questions. Figure 3 and Figure 4 depict benchmarking question
category and benchmarking question lists Graphical User Interface (GUI).
Page 65
50
Figure 4: Benchmarking Question List
In order to define different questions, question types and choice types are used. There
are four different question types: multiple choice questions with single answer,
multiple choice questions with multiple answers, single textbox question, and
multiple textbox questions. Choice type is the type of the answer a benchmark
question can have, and it assesses defining different question types. It consists of:
Text, checked Text, and selection choice types. Text choice type is used for the
answers which has only text answer. Checked text choice type is used for the
answers which enable selection and text answer. Selection type is used for multiple
choice questions which the answer should be selected. In addition, validation formats
(String, Date Format DD/MM/YY or MM/YY, Integer, and Float) are defined for
each question and are used for validating the answer of each question. Also, a range
for string, integer and float were defined to collect valid data.
Page 66
51
Figure 5 presents the ―define single textbox question‖ GUI. This question type is
designed for benchmarking measures which has only one textual answer. As an
example, this question type can be utilized in collecting ―Project Name‖ data in
project attributes category.
Figure 5 Define Single Textbox Question
Figure 6 presents the ―define multiple textbox question‖ GUI. This question type is
designed for benchmarking measures which has multiple textual answers. As an
example, this question type can be defined for collecting benchmarking measures of
effort attributes.
Page 67
52
Figure 6 : Define MultipleTextbox Question
Figure 7 presents the ―define multiple choice questions‖ with one answer GUI. This question type is designed for collecting benchmarking
measures which one answer should be selected between several defined choices. In answer benchmarking questions the choices of this
question are displayed as radio buttons. For instance, this question type is used for collecting ―functional domain type‖ data which is depicted
in Figure 7.
Page 68
53
Figure 7: Define Multiple Choice with One Answer Question
Figure 8 presents the ―define multiple choice questions‖ with multiple answers GUI. This question type is designed for collecting
benchmarking measures which several answers can be selected between defined choices. As an example, this question type can be utilized in
collecting ―Standard Use‖ benchmarking measure data in product attributes category.
Page 69
54
Figure 8: Define Multiple Choice with Multiple Answer Question
In the second stage the data submitter logs into the Cubit with specified user and password to answer the questions related to benchmarking.
After selecting project from the list of projects, benchmarking questions are displayed according to question categories, and question orders.
After answering benchmarking questions of each category, users use Next or Back buttons to navigate to the next question category or to the
questions of previous question category respectively. In order to give information about each question, description of each benchmarking
question according to defined benchmarking measures (section 3.1) is provided as a tooltip text when the mouse moves over questions. The
Page 70
55
answers for benchmarking questions will be validated (according to validation
formats which explained) before saving them, and if any problem related to answers
is found, the system will warn the user. Figure 9 presents the answer benchmarking
questions GUI of Cubit benchmarking data collection tool.
Figure 9: Answer benchmarking questions
Page 71
56
CHAPTER 4
APPLICATION OF THE MODEL AND AUTOMATED
BENCHMARKING DATA COLLECTION
This chapter describes the two case studies which are utilized to develop and validate
the benchmarking methodology. In the first case study the requirements of
developing benchmarking methodology and benchmarking measures is explored.
Then, project data for the identified benchmarking measures are collected, and
improvement opportunities for these benchmarking measures are investigated. As the
result of this case study an automated benchmarking data collection tool is
developed. In the second case study, our purpose was to validate the proposed
methodology and benchmarking data collection tool. Benchmarking projects data for
another organization were collected for this purpose and fill in ratios of
benchmarking measures, productivity ratios of projects are examined. Also effort
estimation models are constructed and evaluated.
In this chapter, research questions and research methodology is explained. Then case
study design, plan, and case study results are described. Finally, in the last part the
threats to the validity of the study are discussed.
4.1. Research Questions
The purpose of this study is to investigate improvement opportunity for efficient
software benchmarking methodology by considering a meta-data model of project
attributes for benchmark data repository and defining data collection processes. In
this study the characteristics of available benchmark data sets were evaluated and the
benchmarking measures were identified. Then processes for collecting data for these
measures were identified. By considering identified benchmarking measures and
Page 72
57
benchmarking data collection processes, implementation of collecting benchmark
dataset was the next target of this study.
In order to cover these purposes the following research questions were explored:
Q1: What are project attributes of a benchmarking meta-model which can be used in
establishing reliable effort estimation models?
Q2: For the purpose of software benchmarking which measures can be collected in
organizations in practice?
Q3: What are the requirements of automated benchmarking data collection processes
which improves benchmarking data repositories?
Q4: Is this benchmarking methodology applicable to other organizations?
Q5: Does data collected by this methodology lead to better effort estimation?
We used qualitative research methodology to answer the research questions. There
are several approaches in qualitative research: case study, Ethnography, Ethology,
Ethnomethodology, Grounded theory, Phenomenology, Symbolic interaction, action
research, and historical research. Among these nine approaches for answering the
research questions, case study approach is selected in this study. We have selected
case study approach since we wanted to do detailed exploratory investigations to get
more insights for the causes of inaccuracy of benchmarking data repositories, and we
do not have any control on behavioral events and variables.
4.2. Case Study Design
Two case studies were conducted to explore the answers for the research questions.
In the first case study, an exploratory study was conducted to find the benchmarking
data attributes and benchmarking data collection processes in the literature. The first,
second, and third research questions were answered in this case study. In order to
find benchmarking measures available benchmarking data repositories were
examined and evaluated and benchmarking measures and benchmarking data
collection processes were identified for software benchmarking purpose.
Subsequently, in this case study projects data which were collected from an
organization based on these identified benchmarking measures were evaluated and
improvement possibilities for the identified measures and benchmarking data
Page 73
58
collection processes were investigated by using these data. Meanwhile, the third
research question was answered in this case study and as a result of this case study an
automated benchmarking data collection was integrated to Cubit. Also, a project data
were collected from another company in order to observe collection potential of
benchmarking measures and get more insight about quality of projects data.
At the end, in the second case study validation of the automated benchmarking data
collection tool was performed and fourth and fifth research questions were answered
in this case study. This automated tool is validated by using benchmarking project
data to investigate whether benchmarking project data leads to better effort
estimation or not.
4.2.1. Case Selection Criteria and Background of these selected cases
The cases which were used in the both case studies were gathered by researchers in
researches in Software Management Research group
(http://smrg.ii.metu.edu.tr/smrgp/). The first case projects data were from
organization projects data of banking domain and also a project from communication
domain. The second case was from project data of an organization in different
domain. These three organizations were selected in order to be able to generalize the
results of the study for organizations of wider domains. On the other hand since we
were conducting other projects with the organizations from these domains it was
easy to reach information of benchmarking project data in these three organizations.
4.3. Case study 1: Exploratory Case Study
In this case study software benchmarking measures which can be used in
constructing reliable effort estimation models, and requirements of benchmarking
data collection tool are explored. In order to find these measures and requirements
first literature review was conducted. As the result of this survey benchmarking
measures, and data collection processes were determined for benchmarking purpose.
Projects data were collected from three organizations to find improvement
opportunities for this identified approach. Lastly after refining these measures and
processes, benchmarking data collection tool is automated as a part of proposed
benchmarking methodology.
Page 74
59
4.3.1. Case Study 1 Plan
The activities which were included in case study 1 were determined in the case study
plan. Detailed activities of this plan are as follows;
Planning the literature survey to evaluate available benchmarking data
repositories.
Identifying benchmarking project attributes which were used in available
benchmarking data repositories, and selecting benchmarking measures which
can be collected from software organizations in practice.
Planning Literature survey to identify benchmarking data collection processes
used in data collection of available data repositories and refine these
processes in order to improve the quality and reliability of benchmarking data
set.
Selecting projects from an organization which includes benchmarking data
and applying measures on the selected projects to collect benchmarking
project data.
Analyzing benchmarking project data in order to find problems and biases
related to gathered data. In this step after detection of problems of
benchmarking project data, problem resolution will be done.
Tailor the benchmarking measures and processes based on results of analyzed
data and proposed problem resolutions.
Collecting a sample project data from another company to get inside about
quality of collecting data
Developing tool support for benchmarking measures and data collection
processes.
4.3.2. Case Study 1 Conduct
The first step in this case study was literature review on external software
benchmarking data repositories from effort estimation perspective. Benchmarking
data repositories which were utilized in software engineering research studies were
selected in this evaluation. The selection criteria for benchmarking datasets were the
accessibility of the repository data or availability of total software size and total
Page 75
60
project effort in the data repository. 14 data repositories which are shown in Table 2
were selected for this evaluation.
Table 2: Data Repositories Evaluated in This Study
Name of the Data
Repository Data Reference
1. ISBSG International Software Benchmarking Research Group
2. CSBSG Chinese Software Benchmarking Standards Group
3. IPA/SEC Information-Technology Promotion Agency/ Software
Engineering Center
4. Albrecht Repository By Yanfu and Keung
5. China Repository By Fang
6. Desharnais Repository By Desharnais
7. Finnish Repository By Keung
8. Maxwell Repository By Yanfu
9. Kemerer Repository By Keung
10. COCOMO81 by Barry Boehm
11. NASA93 By Jairus Hihn
12. COCOMO SDR In the form of COCOMO by SoftLab
13. Miyazaki94 By Amasaki
14. COCOMO_NASA In the form of COCOMO by NASA
Data repositories are evaluated from four different perspectives: general features,
properties of data collection processes, properties of data quality and data validation
processes, and project characteristics of data repositories (Ozantop, Nabi, &
Demirors, 2011). In general features point of view, general information such as
geographic origin, the initiated date, data availability, and other general information
about data repository are studied. Meanwhile, properties of data collection processes
provide information about how and from which sources data is collected. Properties
of data quality and data validation processes give information about reliability of
data in the data repository which is an indication of quality of data repository itself.
These properties are not kept in the data repository itself, but they give useful
information about data repository‘s features. Lastly, in project characteristics of data
repositories, attributes which are factor drivers for effort estimation were identified
Page 76
61
and examined in these datasets. Details about this study can be found in technical
report (Ozantop, Nabi, & Demirors, 2011).
In the project characteristics we examined existence of factor drivers for effort
estimation such as actual effort, size of software, duration of the project, team
experience, team size, software domain, programming language, hardware platform
and the usage of standards through the software development processes. All of the
data repositories contain size and effort data, but only half of these data repositories
provide information about team experience level. It can be observed that, although
software domain and effort data are important in effort estimation, only some of the
data repositories provide these data (Ozantop, Nabi, & Demirors, 2011).
Size and effort data are most important data in effort estimation, so we evaluated the
existence of detail level of these data in data repositories.
Size data in ISBSG has been collected in IFPUG, COSMIC, MarkII, NESMA,
FISMA, and LOC forms. BFC of IFPUG and COSMIC are available in ISBSG, but
just the total numbers are available. However, it was expected that all the
measurement data will be available to the users of the repository. Also, total effort
and phase effort data for each phase of software development lifecycle in person-
hours has been provided in ISBSG. Only for small numbers of projects the amount of
added, changed and deleted functions is available (Ozantop, Nabi, & Demirors,
2011).
Size data is collected in more details in IPA/SEC than ISBSG. Both planned and the
actual size and effort are available in IPA/SEC. Effort and size data is given for each
phase of software development life cycle. Besides, other data like numbers of pages
of documents, number of screens, number of data flow diagrams, and use cases are
given as a size indicator (Ozantop, Nabi, & Demirors, 2011).
Because raw data of CSBSG data repository is not available, it couldn‘t be evaluated
from project characteristics perspective. Among remaining 11 data repositories, only
Alberta and China data repositories includes functional size data in BFC level, and
other data repositories contain only single size data. Effort data in none of these 11
data repositories are given for phases of software development (Ozantop, Nabi, &
Demirors, 2011). Summary of existence of project attributes are given in table 3.
Page 77
62
Table 3: Project Attribute Existence of the Repositories
Nam
e of
the
Rep
osi
tori
es
Act
ual
Eff
ort
Siz
e
Tea
m
Exp
erie
nce
level
Du
rati
on
Dom
ain
of
SW
Pro
gra
mm
ing
Lan
gu
age
HW
Pla
tform
Std
. U
sage
Info
ISBSG + + + + + + + +
IPS/SEC + + + + + +
CSBSG + + + + +
Albrecht DS + +
China DS + + +
Desharnais DS + + + +
+
Finnish DS + +
Maxwell + + + + +
+ +
Kemerer + +
+ + +
COCOMO 81 + + +
COCOMO NASA + + +
COCOMO SDR + + +
Miyazaki 94 + +
NASA 93 + + + +
After literature survey, 11 projects were selected by researches from an organization
in order to investigate which benchmarking data attributes can be collected in
practice in the organizations considering project attributes of data repositories.
Project type of 5 projects out of these 11 projects, were ―New development‖ and the
remaining were ―enhancement‖.
Projects data was collected by interview and data collection forms in excel document
was utilized for this purpose. Initial collection forms are constructed by considering
ISBSG (2009) and IPA/SEC (2004) data repositories. Researchers attempted to
collect project data under about 70 project attributes in the first attempt, but we (as
researcher) found out that some of these benchmarking attributes cannot be collected
in practice from organizations, so these attributes were eliminated, or refined in order
to find more practical measures for benchmarking purpose. Based on these
observation researchers published a benchmarking attribute definition in Ozcan Top
and Demirors (2011) technical report. Benchmarking attributes of this benchmarking
attribute definition document were considered as a base in this study, and further
investigation and inspection were conducted to refine these measures.
Page 78
63
The next task in the case study was analyzing benchmarking project data in order to
improve benchmarking measures. Projects data were examined from several aspects
in this evaluation and also for further inspection we calculated the productivity ratios
of the projects. Some problems were detected during and after data collection, which
are listed below;
There were missing data in projects data.
Sum of number of Entries, Exits, Reads, and Writes were not equal to
total COSMIC functional size.
Sum of the effort data of phases was not equal to the total effort.
There were some effort records which were not in the identified effort
category of benchmarking attribute.
There were variances in productivity ratio of projects.
For solving these problems in the data base, we undertook some actions. First,
missing data of any benchmarking attributes were asked for resubmission. Second,
functional size measurement of these projects were examined by experts to detect
any problem in the measurement. In the case of any problem, the measurements of
these projects were corrected by experts who have COSMIC FSM certification and
three years measurement experiences. Then, functional size of the projects was
updated in benchmarking data. Third, effort data were examined for inaccuracy, and
we investigate the reasons of this inaccuracy. We found out that some effort data are
not kept in the organization in detail in the effort record, and only total effort of the
project is recorded. In some other cases effort records do not match any identified
effort category in the benchmarking attributes, and there was not any clear process
definition for effort data collection. Obviously, a need for defined data collection
process definition was observed in this problem. Finally, productivity values of these
projects were inspected and In order to find the reasons of variances in productivity
ratio, projects data were studied thoroughly in detail. Productivity ratios of projects
are given in table 4.
Page 79
64
Table 4: Productivity ratio (Person-hours/FP)
Project Project Type
Total Effort/Size
ratio
A Enhancement 3.887323944
B New Development 2.539325843
C Enhancement 13.66666667
D Enhancement 6.588235294
E Enhancement 1.473684211
F Enhancement 0.641975309
G Enhancement 3.151515152
H New Development 11.62189055
I New Development 8.342857143
J New Development 2.759358289
K New Development 5.388174807
As a first remark, large variances were observed in effort/size ratios. We detect
outliers by using plot box analysis (Field, 2009) by using SPSS program. In order to
inspect the reasons of these outliers, projects‘ data were examined more precisely.
There are some studies which depict functional similarity as significant impact on the
relation of functional size and software development effort (Santillo & Abran, 2006)
(Tunalilar et.al, 2008) (OzanTop O., 2008) (OzcanTop et.al, 2009) (Tunalilar, S.,
2011). So, functional similarity issue was taken into account in this inspection.
The first outlier had a large effort/size ratio, and the project was an enhancement
project and it was related to implementation of new electronic fund transfer standard
which had complicated business rules. This project was apparently different than
other projects of the organization, and it needed intense requirement analysis activity,
because in order to discuss business rules of this project a lot of meetings had to be
held. On the other hand, because of security issues for small changes in the system, a
long duration of testing activities had to be done. The second outlier had also large
effort/size ratio, and the reason behind this abnormal case was high amount of testing
activities which were performed for this project. The third outlier project had a small
effort/size ratio, because this project was an enhancement project which includes
Page 80
65
small changes and the functional similarity was very high in this project.
Consequently, functional similarity reflective size was very small and less effort was
required for this project. The forth outlier had also small effort/size ratio, and
similarly high functional similarity. So, functional size reflective size was small and
development effort for this project reduced intensively.
In order to improve benchmarking measures functional similarity reflective size was
considered as project attribute, and for finding this reflective size as mentioned
before it is important to make sure that details of COSMIC functional size
measurement are available. Also, in order to find more homogenous project in
benchmarking process, an explanation for project specific characteristic should be
collected during collecting benchmarking data. For instance, when a project has
different characteristic revealing them will help in selecting homogenous projects.
After these observations, all of these improvement opportunities were considered and
defined benchmarking measures were updated respectively.
A project data from a small size company was also collected. We observed that in
this company effort data is not recorded in daily or even in weekly bases, and during
interview data submitter only provided us with overall consumed time for main
phases of the project with best guess. As it is indicated before, quality of data play
critical role in quality of benchmarking data repository. So, we classified projects
data quality based on the quality of effort data. In the first data quality level (A)
effort data are recorded in daily bases by using effort data collection tool support,
time sheet, etc. In the second project data quality level (B) effort data are collected in
weekly or monthly level without using tool support. Finally, in the third quality level
(C) effort data are not recorded, and only by best guess of the project manager can be
collected.
Benchmarking data collection processes as well as quality of the data are beneficial
in insuring the quality of data. So, as another improvement of benchmarking, data
collection processes which were identified in OzcanTop and Demirors (2011)
technical report are selected, and refined in this study.
By considering defined benchmarking measures, and benchmarking data collection
processes which are given in chapter 3, a benchmarking data collection tool were
implemented in order to seize improvement opportunity for benchmarking. This
Page 81
66
benchmarking data collection tool is integrated on Cubit as a third and final part of
benchmarking methodology which is proposed in this study. The features of the tool
were discussed in chapter 3 section 3.
4.3.3. Case study 1 Results
In this case study our aim was identifying and defining requirements of
benchmarking methodology which includes benchmarking measures, benchmarking
data collection processes, and automated benchmarking data collection tool. By
using literature survey important benchmarking measures were identified and the
practicability of collecting these measures was investigated by examining 11 projects
from an organization. The problems and inconsistencies were identified to refine
benchmarking measures. Also, data collection processes which were defined in
Ozantop and Demirors (2011) technical report were selected as benchmarking data
collection processes. After refining measures and data collection processes finally,
automated benchmarking data collection tool were integrated on Cubit.
COSMIC functional size is used as size measurement method for measuring
functional size of these 11 projects, and projects‘ detailed functional measurements
were measured and collected by experts. We observed that collecting detailed
functional measurement were necessary in order to calculate functional similarity
which had very large impact on effort/size ratio variances. So by considering (Ozcan
Top O., 2008) and previous implementation of functional similarity measurement for
cosmic FSM method by B. Usgurlu (2010), reflective functional similarity
measurement was integrated to the new version of Cubit.
Also we observed that quality of effort data play critical role in quality of
benchmarking data repository by examining project data of another company. Since
in this company effort data are not collected in daily, or even weekly bases for each
defined activities and only approximated effort data are available, so we classified
this project data in C level.
It should be mentioned that effort data are considered in two levels: activities and sub
activities. Activities are defined as core benchmarking measures, and sub activities
are defined as extended benchmarking measures. We know that effort data are not
recorded in such a detail in most of companies, but we suggest that recording these
Page 82
67
effort data in sub activity bases will lead to more accurate effort data, and in result
we conclude in more accurate benchmarking data repositories.
Collecting data via this benchmarking tool enable the user to collect benchmarking
measures by following defined benchmarking process. In collecting benchmarking
data answers for benchmarking attribute data is validated by utilizing validation
format of each answer in Cubit. Besides, description of each benchmarking measure
is provided to the user as a tooltip text when the mouse moves over the
benchmarking questions. This feature provides users with extra information about the
benchmarking measures. In this case, projects data will be gathered in more reliable
and accurate way by validating both benchmarking data and size measurement of the
projects. Besides, collecting data via data collection forms and questionnaires takes a
lot of effort and time for both collecting and validating data, but collecting
benchmarking project data with tool support will reduce this time and effort.
4.4. Case study 2: Validation of the Benchmarking Methodology and
Automated Benchmarking Data Collection Tool
This case study is designed to investigate the validity of benchmarking methodology
and explore the answers for fourth and fifth research question. In this case study in
order to validate the benchmarking methodology, benchmarking projects data were
collected by using benchmarking data collection tool Cubit from an organization.
Subsequently, productivity ratio of collected projects were inspected in detail, and by
using linear regression models and multiple regression models effort models were
constructed to evaluate the benchmarking data which is collected by the support of
benchmarking data collection tool.
4.4.1. Case Study 2 Plan
The activities which were planned to be done in case study 2 were determined in the
case study plan. Detailed activities of this plan are as following;
Selecting projects from an organization for the purpose of collecting
benchmarking data
Collecting benchmarking data of selected projects by using Cubit,
considering defined benchmarking data collection processes.
Page 83
68
Analyzing and inspecting benchmarking projects data
Using collected projects data for constructing effort estimation models by
using regression models, and calculating MMRE and PRED values for
validation of the quality of the benchmarking project data.
4.4.2. Case Study 2 Conduct
In this case study 40 projects data from another organization utilized for the
validation purpose. Benchmarking data were collected by using benchmarking data
collection tool (Cubit) and interviewing with data submitter. These projects belong to
three different functional domain types: Simple Control System (SCS), Complex
Control System (CCS), and Complex Data Driven Control System (CDDCS). These
functional domain types are identified based on Char Method. Corresponding
software type of these projects based on ISO12182 standard for software
categorizations are real time embedded device driver, real time embedded avionics
message router, and process control system respectively. All project type of these
projects was ―New development‖.
Collected projects data was analyzed from several points and accuracy of these data
were evaluated. In order to perform data analyses, fill in ratio for the entire
benchmarking data attributes were calculated, and also derived attributes such as
productivity ratio and functional similarity were examined thoroughly.
We observed that fill in ratio for project type, industry type, functional domain type,
tool use, experience of team members, stability of team, all attributes in product
attributes category, Effort (for requirements, design, coding, and testing activities),
and detailed size data are 100%. Also there were some effort record which can be
used as an extension of our effort attributes.
Also we inspected size/effort ratio, and we observed that size/effort varies between
0.03 FP/Person-hours and 3.47 FP/Person-hours. When we consider functional
similarity as we expected, this variance decreased, and the size/effort ratio differed
from 0.01 FP/Person-hours to 1.66 FP/Person-hours. Because as mentioned before,
projects data was from three different application types, each of which were
developed under similar conditions by the same team. So, we expect size/effort ratio
values will be similar for each group of projects. When we consider functional
Page 84
69
similarity and recalculate the size/effort ratio, the variance in these values decreased.
In Table 5 the size/effort ratios before considering functional similarity and after
considering functional similarity are given for projects which had functional
similarity.
Table 5: Size/Effort ratio for functional similarity consideration
Project Name Size Total Effort
(person hours)
Size/Effort
before FS
Size/Effort
after FS
SCS 1 411 784 0.524235 0.512755
SCS 2 1730 3768 0.45913 0.429936
SCS 5 165 2192 0.075274 0.061588
SCS 7 319 1952 0.163422 0.099898
SCS 9 149 1848 0.080628 0.069264
SCS 10 249 808 0.308168 0.241337
CCS1 2040 2928 0.696721 0.556694
CCS 2 245 5568 0.044001 0.035022
CCS 3 361 1112 0.32464 0.258094
CCS 4 55 1736 0.031682 0.011521
CCS 5 38 1152 0.032986 0.028646
CCS 6 470 2872 0.163649 0.082869
CCS 8 271 1224 0.221405 0.215686
CCS 9 162 904 0.179204 0.167035
CCS 10 50 816 0.061275 0.042892
CDDCS 1 584 1020 0.572549 0.357843
CDDCS 2 1347 396 3.401515 0.997475
CDDCS 3 415 476 0.871849 0.684874
CDDCS 4 1303 376 3.465426 1.659574
CDDCS 5 129 232 0.556034 0.392241
CDDCS 6 76 248 0.306452 0.237903
CDDCS 7 986 536 1.839552 0.451493
CDDCS 8 1384 832 1.663462 0.25
Page 85
70
Table 5: Size/Effort ratio for functional similarity consideration (Continued)
Project Name Size Total Effort
(person hours)
Size/Effort
before FS
Size/Effort
after FS
CDDCS 9 132 96 1.375 0.125
CDDCS 10 277 208 1.331731 0.591346
CDDCS 11 193 224 0.861607 0.348214
CDDCS 12 377 792 0.47601 0.222222
CDDCS 13 291 356 0.817416 0.688202
CDDCS 14 328 1020 0.321569 0.191176
CDDCS 15 666 536 1.242537 0.225746
CDDCS 16 332 616 0.538961 0.387987
CDDCS 17 206 476 0.432773 0.344538
Variances 0.738 0.11
Although by considering functional similarity we were able to reduce the variance in
Size/Effort ratio, we still encounter some outliers in these data. In order to improve
our data quality, we inspected productivity ratios for all projects in more detail.
Examining outliers in these ratios revealed some facts about the projects‘
characteristics. Most of projects with outlier data had algorithms which could not be
measured by using COSMIC measurement size method. We hypothesized that the
existence of these algorithms increased the amount of effort used in these outlier
projects. Since we couldn‘t reach source code of these projects to indicate
Cyclomatic complexity or other complexities, we tried to classify algorithm
complexity to three levels;
1. Basic Algorithms (Level 1): Small algorithms include only basic
mathematical calculations and simple data manipulations which are: Derived
data creation by transforming existing data, Mathematical
formulas/calculations, Condition analysis to determine which are applicable,
Data validation, Equivalent-value conversion, and Data filtering/selection by
specified criteria. This classification of data manipulation is adopted from
action type list defined in Santillo & Abran (2006).
Page 86
71
2. Medium Complex algorithms (Level 2): Algorithms in this level include
medium complex algorithms which have different operations than defined
action type above (defined in the basic algorithms), and in these algorithms
there isn‘t any integration with other algorithms in the system. Also, in this
kind of algorithms there isn‘t parallel and multitasking usage of processes. In
this level the input of algorithms are a group of parameters, and the result of
medium complexity operation can be one or several outputs.
3. Very complex algorithms (Level 3): Algorithms which includes very complex
operations, and there is integration with other algorithms. In this kind of
algorithms extra hardware are involved. In addition, in this kind of
algorithms, there are real time criteria as limitation factors.
We requested from data submitter to classify algorithms of the projects and classify
projects based on these levels. It was observed that most of the outlier projects had
algorithms in very complex algorithms level.
Following these inspections, effort estimation models were constructed by using
IBM SPSS software, and simple linear regression models were utilized to determine
usability of proposed benchmarking data collection model. Effort data was
considered as dependent variable, and size data considered as independent variable.
The total and development effort of projects in this case study was estimated by
considering functional domain types, and functional similarity. Meanwhile, effort for
main activities in software development lifecycle was estimated. For creation of
these models we used total functional size of the projects. In order to evaluate
constructed effort estimation models, MMRE and prediction level parameter
PRED(30) values were used in this study as presented in Equation 1 through 3. There
are studies which uses PRED(30) to measure how well the estimation model is
performing (Menzies, et al., 2005). Meanwhile, PRED(30) can identify the prediction
models which are generally accurate (Menzies, et al., 2006). A low MMRE and high
PRED value indicate how well an effort estimation model can perform. PRED(N)
means the average percentage of the estimation values is within N percentage of
actual values. For instance, PRED(30) =50 means that 50% of the estimates are
within 30% of the actual values (Menzies et.al, 2006).
Page 87
72
∑ | |
(Equation 1)
∑ {
}
(Equation 2)
∑ | | (Equation 3)
We also used effort estimation models of 7 data repositories (Albrecht, China,
Desharnais, Finnish, Maxwell, Kemerer, and ISBSG) in order to compare accuracy
of estimations from our previous study (OzcanTop et.al, 2011). The selection criteria
for data repositories were related to availability of raw data, and also availability of
functional size and effort data. Among these data repositories ISBSG was the only
data repository which includes size data measured by COSMIC method.
Effort estimation models can differ based on selection of different subset of projects
data in data repositories which subsequently influence the accuracy of the model.
Also, pruning of the data can improve the effort estimation model (Maxwell, K.,
2001). In Ozcan Top et.al (2011) a systematic pruning was utilized to eliminate
unrelated data. The regression model of previous mentioned data repositories and
effort estimation model for total effort of our case study projects data are shown in
Table 6.
Page 88
73
Table 6: Estimation model of 7 discussed data repositories and case study projects data
Model Number of
Projects
Mean
of FP Regression Model MMRE PRED(30)
Albrecht 14 347 E= -1387.4+ (29.3*FP) 4006.6 0
China 398 189 E= 418.8+ (9.4*FP) 2167.3 0
Desharnais 73 243 E= 156.1+ (16.7*FP) 3802.5 0
Finnish 15 273 E= 553.3+ (7*FP) 426.2 0
Maxwell 40 274,5 E= -255.6+ (17.6*FP) 5277.8 0
Kemerer 4 317,3 E= 172.6+ (1.1*FP) 162.7 0
ISBSG 151 134,5 E= 2095.9+ (13.8*FP) 137.0 0
Case Study 2
Projects data 40 435.62 E= 1091.442 + (0.428*FP) 136.995429 22.5
Case Study 2
Projects data
(considering
functional
similarity)
40 287.19 E= 737.298 + (1.45*FP) 95.27 37.5
According to Table 8, linear models built by ISBSG, Albrecht, China, Desharnais,
Finnish, Maxwell and Kemerer repositories do not create models with acceptable
level of MMRE and PRED values. Also, our case study project data do not produce
acceptable results for estimating total effort because a good model is expected to
have PRED (30) higher than 60% (Tunalilar, S., 2011). Since the model which
produce highest PRED(30) and lowest MMRE is considered the best, using our case
study project data resulted better estimation model, and the effort model quality was
improved. Meanwhile by considering functional similarity, PRED value for total
effort was increased and MMRE value was decreased again.
We also constructed different effort estimation models for the selected organization
to observe effect of functional domain type, and functional similarity in quality of
estimation models. Both COSMIC size data without functional similarity
consideration, and reflective functional similarity size data was utilized in model
developments. The results of MMRE and PRED value for total and development
effort models are given in table 7.
Page 89
74
Obviously it can be seen that effort estimation models which were based on
development effort produced better estimation, since the PRED values are higher and
MMRE values are lower than those which were constructed using total effort. Also,
when projects data are grouped by similar functional domain type it results in better
estimation models. As discussed before, the projects of this case study belongs to
three different functional domain type; Simple Control System (SCS), Complex
Control System (CCS), and Complex Data Driven Control System (CDDCS) which
are identified based on CHAR method. In addition to these observations, it can be
distinguished from the table that considering reflective functional similarity size
improves quality of effort estimation models.
In this study effort data is proposed to be collected in activities bases, so in order to
validate this idea, effort estimation models were constructed for each activities in
software development lifecycle. Comparison table of MMRE and PRED values of
these models are given in table 8.
Page 90
75
Table 7: MMRE and PRED (30) values for comparison of accuracy of effort estimation models for total and development effort
Total Effort Development Effort
No FS Reflective FS No FS Reflective FS
MMRE PRED (30) MMRE PRED (30) MMRE PRED (30) MMRE PRED (30)
Total Projects in case study 136.99 22.5 95.27 37.5 110.04 27.5 93.5 35
Project data with Simple
Control System (SCS)
Functional domain type
45.13 45.45 46.40 45.45 31.11 54.54 28.54 55.55
Project data with Complex
Control System (CCS)
Functional domain type
54.30 33.33 55.86 33.33 39.74 30 38.42 33.33
Project data with Complex
Data Driven Control System
(CDDCS) Functional domain
type
63.22 41.17 51.21 31.25 54 41.17 46.13 52.94
Page 91
76
Table 8: MMRE and PRED (30) values for comparison of accuracy of effort estimation models for software development activity efforts
Requirements Activities Design Activities Coding
Activities
Testing Activities
No F
S
Ref
lect
ive
FS
No F
S
Ref
lect
ive
FS
No F
S
Ref
lect
ive
FS
No F
S
Ref
lect
ive
FS
MM
RE
PR
ED
MM
RE
PR
ED
MM
RE
PR
ED
MM
RE
PR
ED
MM
RE
PR
ED
MM
RE
PR
ED
MM
RE
PR
ED
MM
RE
PR
ED
All
Projects
in case
study
127.24 25 129.39 20 148.91 25 146.62 22.5 69.44 28.57 53.91 38.88 194.84 27.5 148.34 35
SCS
projects 59.98 45.45 59.02 45.45 118.45 36.36 109.59 40 37.36 55.55 37.12 60 27.68 54.54 24.45 66.66
CCS
projects 26.24 66.66 23.30 88.88 67.16 50 68 58.33 131.38 8.33 105.5 27.27 51 33.33 50.27 33.33
CDDCS
projects 67.89 35.29 65.40 35.29 79.22 23.52 76.06 23.52 51.11 47.05 35.02 50 104.06 35.29 82.35 41.17
Page 92
77
It can be easily seen that effort estimation based on software development activities
can improve the accuracy of effort estimation model. Also, considering functional
similarity and functional domain type are two other ways for increasing quality of
benchmarking projects ‗data.
We also constructed multiple regression models by considering base functional
components (Enter, Exit, Read, and Write) of COSMIC size as independent
variables, and effort of activities in software development lifecycle as dependent
variables. We categorized projects based on functional domain type. Here our
purpose was to observe impact of collecting effort data in activities bases, and size
data in base functional components, and considering functional domain type, and
functional similarity all together. Comparison table of MMRE and PRED values of
these models are given in table 9.
Table 9: MMRE and PRED(30) values for comparison of accuracy of effort estimation models
for software development activity efforts by considering BFC of size data
Requirements
Activities
Design
Activities
Coding
Activities
Testing
Activities
MMRE PRED MMRE PRED MMRE PRED MMRE PRED
All Projects
in case study 123.9 25 133.7 37.5 44.87 33.33 133.74 32.43
SCS
projects 26.89 72.72 88.49 36.36 18.78 81.81 17.56 81.81
CCS
projects 18.09 83.33 31.58 58.33 41.19 45.45 33.55 50
CDDCS
projects 42.88 50 54.69 33.33 29.09 62.5 53.22 47.05
As it can be seen in table, when we categorize projects by functional domain type we
can create better estimation models rather than constructing model for all projects in
the case study. We observed that MMRE values decreased and PRED(30) values
increased significantly by considering functional domain type, effort in activities
level, size in BFC level, and functional similarity.
Page 93
78
4.4.3. Case study 2 Results
In this case study in order to validate benchmarking data collection methodology 40
projects data were collected from an organization by using Cubit benchmarking data
collection tool. Then projects data were inspected thoroughly by considering
productivity ratios and fill in ratio of benchmarking attributes. Lastly, effort
estimation models of collected data were constructed by using simple linear
regression model, and compared to effort estimation models of other data
repositories. Also effort estimation models for total effort, development effort, and
each activities of software development (requirements, design, coding, and testing
activities) are constructed. Meanwhile, effect of functional domain type and
functional similarity were evaluated in effort estimation. In order to compare the
accuracy and quality of effort estimation models MMRE and PRED (30) values were
used. As it mentioned before, A high PRED (30) and low MMRE value can indicate
the quality of prediction model.
In productivity ratio examination, there were some outliers. Because projects data
were from three different functional domain types and they were developed by the
same team. In similar situations, we expected effort/size ratio for projects with same
functional domain type to be same. So, we investigated the reason of these
unexpected outliers. We found out that projects with outlier productivity ratio have
complex algorithm used in them. In order to interpret this fact, we tried to
categorized project data into three different complexity levels of Basic Algorithms,
Medium Complex Algorithms, and Very Complex Algorithms by interviewing the
data submitter. When projects data ranked to three level of complexity, we observed
that projects with outliers mostly have several algorithms with Very Complex
Algorithms level of complexity.
Continuing productivity ratio inspection, we encounter some projects which had
large total effort/size ratio. The reason behind these abnormal projects data were
from projects characteristics. Projects were from functional domain type in which
hardware is included, and they are designed for special control functions within a
larger system. In some of the projects, developer was not familiar with hardware
which is used in these systems and new hardware was used in these projects. The
Page 94
79
project submitters informed us that it takes more time to be familiar with setting of
new hardware, thus, developing these projects needed more effort.
In addition, in this organization there were some effort records which are not
classified under software development effort, and they include effort data for
documentation, ideal effort time, and standard application effort time. Ideal effort
includes the times when there is not any activity on the project, for example when
there is a problem with hardware and the developers wait for solving this problem.
Although there is no effort consumed on the project, but the developer records this
waiting time as ideal effort. Meanwhile, in some projects, projects should be
developed under a specific standard and applying this standard caused extra testing
effort which included in total effort of these projects. We observed that in outlier
projects these effort records resulted in large total effort, and accordingly large
effort/size ratio.
After these assessments, effort estimation models were evaluated. We observed that
constructing effort models for development effort and each activity in software
development lifecycle produces better estimation models than total effort. Also,
results showed that, classifying projects data based on functional domain type and
constructing effort models for projects with similar functional domain type produces
effort models with higher PRED(30) and lower MMRE values which means better
quality in effort estimation.
In addition, collecting size data in BFC level of COSMIC functional size
measurement method leads to creating better estimation models. As the last
observation, considering functional similarity and functional reflective size improved
the accuracy of effort estimation models.
The results of this case study showed that using benchmarking methodology, we can
improve benchmarking data repositories quality from effort estimation perspective. It
should be mentioned that, in this organization we collect data of finished projects by
considering benchmarking measures and using benchmarking data collection tool.
But benchmarking data collection processes were not pursued from the beginning of
projects to the end, so we believe if the defined benchmarking data collection were
followed in this organization, we would end up with better results.
Page 95
80
4.5. Validity Threats
During collecting benchmarking data collection, functional size measurement details
of the projects were collected in excels documents, and it may include some errors.
To detect the errors reviews were conducted by experts who have COSMIC FSM
certification and three years measurement experiences.
Projects data for effort attributes are collected by interviews and they are assumed to
be accurate. For the resolution of this threat using automated data collector is
considered as future work.
Finally, we only investigate impact of algorithm complexity in one organization, and
generalizing the impact of this measure should be investigated more.
Page 96
81
CHAPTER 5
CONCLUSIONS
This chapter summarizes the contributions of the study, and presents suggestions for
future works.
5.1. Conclusions
In order to plan, monitor, and control the project activities, effort estimation of
software projects is an essential step for success of projects. In all diverse estimation
methods, historical data (benchmarking data sets) are necessary elements for
developing estimation models. So, accuracy of benchmarking data is critical for
construction of reliable effort estimation models. In many studies effective effort
estimation methods were studied, but a few of them considered quality of historical
data as an impact on effort estimation accuracy.
We developed a benchmarking data collection methodology to improve quality of
benchmarking data repositories. This approach consisted of three main parts;
Benchmarking measures, benchmarking data collection processes, and automated
benchmarking data collection tool. In order to build reliable benchmarking data
repository, projects data attributes and characteristics were defined precisely. We
observed that quality of benchmarking data repositories does not only depend on
benchmarking measures, but also it depends on the way of collecting benchmarking
data. Therefore, generic benchmarking data collection processes were defined in
order to be applied in an organization to guarantee accurate and efficient
benchmarking data repository.
Meanwhile, collecting benchmarking data is an extensive and difficult task which
needs large effort. In organizations without defined benchmarking measures and data
collection procedures it is really hard and time consuming task to collect projects‘
Page 97
82
historical data. So, in order to facilitate this task, in this study after defining
benchmarking measures and data collection processes, a data collection tool was
implemented accordingly to support benchmarking data collection.
Two case studies were conducted in this research, the first case study was
exploratory case study, and the second one was for validation of benchmarking
methodology. In the first step of the exploratory case study, effort drivers and
important projects attributes which had to be collected in data repositories in an
organization were explored. Also, an extended comparison study of data repositories
from effort estimation perspective was conducted and important benchmarking
measures were identified. Then feasibility of these identified measures was
investigated in a software organization by inspecting 11 projects data and then
benchmarking measures were refined as a result. We observed large variances (from
1.47 Person-hours/ FP to 13.66 Person-hours/ FP) in size/ effort ratios of some
projects. In some projects the functional similarity rate was high, and by considering
reflective functional similarity size (OzanTop O., 2008) of these projects these
variances (from 1.42 Person-hours/ FP to 6.6 Person-hours/ FP) was decreased
significantly. Also, a project data from another company was collected in order to
study quality of data. Three level of data quality (level A, B, and C) were identified
considering quality of effort data and the frequency of effort data collection in the
organization.
In this study benchmarking data collection processes which were defined by
Ozcantop & Demirors (2011) are refined. Subsequently, a benchmarking data
collection tool was implemented and integrated on Cubit toolset by considering these
refined benchmarking measures and benchmarking data collection processes. This
tool supports all benchmarking data collection processes steps and enables users to
collect projects‘ data according to defined procedure. Using this tool decreased
collection time and effort consumed for data collection, and also it partially validated
the benchmarking data, and it increased accuracy of benchmarking data in the data
repository. Without using benchmarking data collection tool, data collection task was
difficult and time consuming because it had to be done by interview with data
submitter. Since benchmarking measures and data collection processes were not
identified clearly, in order to get accurate data from data submitter, data collector is
Page 98
83
supposed to spend an amount of time to give necessary information to data submitter.
Since Cubit provides users the feature of recording details of projects functional size
measurement, it is possible to calculate reflective functional similarity size of the
projects in a reliable and easier way.
Cubit benchmarking tool is utilized for collecting internal benchmarking data in
organizations. Our previous study showed that effort estimation based on internal
benchmarking data repositories produces more accurate results than external
benchmarking data repositories (OzcanTop et.al, 2011). So, we implemented internal
benchmarking data collection tool. However, as all organizations uses common data
base through web application, Cubit also has the potential to collect data for external
data repository.
In the second case study the proposed benchmarking methodology was validated. In
this case study 40 projects data were collected from a middle size software
organization by using Cubit benchmarking tool. Projects data were examined in
detail and we observed that fill in ratio for project type, industry type, functional
domain type, tool usage, experience of team members, stability of team, all attributes
in product attribute categories, effort attributes of requirements, design, coding and
testing activities, and details of size measurement and reflective functional size of
projects were 100%. Since in this organization we collected data of finished projects,
we couldn‘t collect remaining benchmarking attributes. But if the benchmarking data
collection processes were pursued then we would be able to collect these project
attributes.
Moreover, effort/size ratios for every project were also calculated for total effort,
development effort, and each of software development activities. Since projects
belonged to three different functional domain types, and projects in each of these
functional domain types were developed under same situations, we expected
productivity ratio to be in the same range for all projects in the same functional
domain type. But there were some outliers and productivity ratio variances revealed
some projects characteristics which can be the reasons for this unusual behavior of
effort/size ratios. First, there was some reuse rate in the terms of functional similarity
in some of collected projects data. Additionally, some of the projects include very
complex algorithms which cannot be measured by using COSMIC measurement
Page 99
84
method, and they were ignored during measurement. Since source code of these
projects were not available we couldn‘t reach any standard defined complexity
measure of these projects, therefore we classified algorithm complexity level of these
projects into three levels of Basic Algorithms, Medium Complex Algorithms, and
Very Complex Algorithms by interviewing to data submitter. It was observed that
most of the projects with outlier effort/size ratio were classified in Very Complex
Algorithms level. As a discussion it should be mentioned that, algorithm complexity
was defined as nominal scale, and classifying algorithms based on defined algorithm
complexity may be subjective.
In some other projects which had large total effort/size ratio, the software were
designed for control function of a new hardware, and unfamiliarity of the hardware
causes extra effort load for the project (especially for testing activities). Besides, in
this organization a special standard was applied for some projects which lead to
produce extra testing activities for these projects. Consequently the total effort for
these projects were increased and caused the unusual behavior of effort/size ratio.
After these observations, in order to evaluate collected data, effort estimation models
were constructed using simple regression models and considering MMRE and PRED
(30) values. In these models total effort was dependent variable, and size value was
independent variable. These estimation models were compared to similar models of
other data repositories in the literature. Although both MMRE and PRED values for
all effort estimation models were not in acceptable boundaries, we observed
improvements. In order to consider an effort estimation model as an accurate
prediction, PRED (30) value should be higher than 60% (Tunalilar, S., 2011). PRED
(30) value of our models for total effort estimation increased to 22.5% and by
considering functional similarity it increased to 37%.
Subsequently, we created effort estimation models by considering development
effort, and effort for each activity in software development lifecycle as dependent
variable, and size effort as independent variables. Results showed that considering
reflective functional similarity and functional domain type improved the accuracy of
benchmarking data in the data repositories, and more accurate effort estimation
models were constructed in this way. The prediction level parameter PRED (30)
increased to 45.45% for project data with Simple Control System (SCS) Functional
Page 100
85
domain type, 33.33% for project data with Complex Control System (CCS)
Functional domain type, and 41.17% for project data with Complex Data Driven
Control System (CDDCS) Functional domain type for total effort estimation models.
In addition PRED (30) value increased to 55.55% for SCS projects, 33.33% for CCS
projects, and 52.94% for CDDCS project for development effort estimation models.
Also, it is observed that estimation models for development effort produced more
accurate data in comparison to estimation models for total effort data.
We also created effort estimation models with multiple regression models by
considering effort data as dependent variable, and number of BFC of COSMIC
method (Enter, Exit, Read, and Write) as independent variables. We also take into
account functional similarity, and classification of projects based on their functional
domain type. The results show that, when we collect projects size data in BFC level
and projects‘ effort data in activity level we conclude in better estimation. PRED
(30) values for SCS projects increased to 72.72 % for requirements activities,
81.81% for coding activities, and 81.81% for testing activities. For CCS projects
these values were 72.72%, 45.45%, and 50% respectively. Also, it should be
reminded that functional similarity and functional domain type were also accounted.
As contribution of this study, it was the first time that all proposed benchmarking
improvements of benchmarking measure, benchmarking data collection processes,
and tool support were utilized together to improve quality of benchmarking data
repository. Also, reflective functional size was used in previous studies for effort
estimation research but it was the first time it was collected for the benchmarking
purpose in benchmarking data repositories. In addition, using algorithm complexity
suggested as an improvement to benchmarking attributes. The results show that,
some effort records are not classified under software development effort like ideal
effort, standard application effort, and also documentation effort which increase the
total effort of projects. So, these efforts should be considered as an extension of
collected effort.
Another contribution of our study is that the benchmarking tool can be tailored for an
organization, and it can benefit organizations for constructing an internal software
benchmarking repository.
Page 101
86
5.2. Future Work
In our study we observed improvements in the quality of benchmarking data
repository, but there are still improvement opportunities that can be explored.
The study conducted considering projects data of three software organizations, and it
can be investigated in other organizations in order to achieve more improvements for
benchmarking data repositories. In our study we collected data by using interviews,
and we assumed submitted data is reliable. Violation of this assumption can reduce
validity of our study. As future work automated effort data collector and other
measure collectors can be integrated to Cubit to improve the accuracy of collected
data. Also, the impact of missing data on the quality of the data in our dataset can be
investigated as a future work.
Page 102
87
REFERENCES
Ahmed, F., Salah, B., Serhani, A., Khalil, I. (2008). Integrating Function Point
Project Information for Improving the Accuracy of Effort Estimation.
Proceedings of the 2008 The Second International Conference on Advanced
Engineering Computing and Applications in Sciences, (PP. 193-198).
Washington, DC: IEEE Computer Society.
Field, A. (2009). Discovering Statistics Using SPSS (Third edition). SAGE
Publications Ltd.
Bachmann, A. & Bernstein, A. (2010). When process data quality affects the number
of bugs: correlations in softwaree datasets. MSR '10: Proceedings of the 7th
IEEE Working Conference on Mining Software Repositories, (pp. 62-71).
Cape Town, South Africa. IEEE
Backman, A. & Bernstein, A. (2009). Software process data quality and
characteristics – A historical view on open and closed source projects.
IWPSE-Evol'09, (pp.119-128). Amsterdam, Netherland. ACM.
Beitz, A. & Wieczorek, I. (2000). Applying benchmarking to learn from best
practices. In Bomarius, F. & Oivo, M. (Ed.), PROFES 2000, LNCS 1840, (pp.
59-72). Springer-Verlag Berlin Heidelberg.
Bourque, P., Oligny, S., Abran, A., Fournier, B. (2007). Developing project duration
models in software engineering. Journal of Computer Science and
Technology, 22, 348-357.
Bundschuh, M., & Dekkers, C. (2008). The IT measurement compendium:
Estimating and benchmarking success with functional size management.
Springer- Verlag Berlin Heidelberg.
Usgurlu, B., (2010). Automating Functional Similarity Measurement for Cosmic
FSM Method. (Tech. Rep. No. METU/II-TR-2010-19). Turkey: Middle East
Technical University, Information Systems.
Page 103
88
Cuadrado, J. J. C., Rodriguez, D., Sicilia, M. A., Rubio, M. G., Crespo, A. G. (2007).
Software project effort estimation based on multiple parametric models
generated through data clustering. Journal of Computer Science and
Technology, 22, 371-378.
Cukic, B. (2005). The promise of public software engineering data repositories, IEEE
software, (pp.20-22). IEEE.
Davis, R., and Brabander, E. (2007). ARIS Design Platform: Getting Started with
BPM, 1st ed. Springer.
Dekkers, T. (2007). Benchmarkıng is an essentıal control mechanism for
management, RPM- AEMES, Vol.4, 99-103.
Gencel, C., Buglione, L., Abran, A. (2009). Improvement Opportunities and
Suggestions for Benchmarking. 19th International Workshop on Software
Measurement/3rd International Conference on Software Process and Product
Measurement, (PP. 144-156). Berlin: Springer-Verlag.
Gencel, C., Demirors, O. (2008). Functional size measurement revisited. ACM
Transactions On Software Engineering And Methodology, 17, Article 15. doi:
10.1145/1363102.1363106.
Huang, S. J., Chiu, N. H., Liu, Y. J. (2008). A comparative evaluation on the
accuracies of software effort estimates from clustered data. Information and
Software Technology, 50, 879-888. doi: 10.1016/j.infsof.2008.02.005.
Huang, S. J., Chiu, N. H. (2006). Optimization of analogy weights by genetic
algorithm for software effort estimation. Information and Software
Technology, 48, 1034-1045. doi: 10.1016/j.infsof.2005.12.020.
INFORMATION-TECHNOLOGY PROMOTION AGENCY, IPA/SEC. (2007).
White Paper 2007 on Software Development Projects in Japan. Retrieved
from http://www.ipa.go.jp/english/sec/reports/20100507a_1.html
International Software Benchmarking Standardization Group (ISBSG). (1997).
http://www.isbsg.org
Jeffery, R., Ruhe, M., Wieczorek, I. (2000). A comparative study of two software
development cost modeling techniques using multi-organizational and
company-specific data. Information and Software Technology, 42, 1009-
1016.
Page 104
89
Jorgensen, M., & Sjoberg, D. (2004). The impact of customer expectation on
software development effort estimates, International Journal of Project
Management, 22, 317–325. doi: 10.1016/S0263-7863(03)00085-1
Jorgensen, M., Indahl, U., Sjoberg, D. (2003). Software effort estimation by analogy
and ―Regression toward the mean‖. The Journal of Systems and Software, 68,
253–262. doi: 10.1016/S0164-1212(03)00066-9
Kaczmarek, J. & Kucharski, M. (2004). Size and effort estimation for applications
written in Java, Information and Software Technology, 46, 589–601. doi:
10.1016/j.infsof.2003.11.001
Liu, Q. & Mintram, R. (2006). Using industry based data sets in software
engineering research. Proceedings of the 2006 International Workshop on
Software Engineering Education, Shanghai, China. ACM.
Liu, Q., Qin, W. Z., Mintram, R., Ross, M. (2008). Evaluation of preliminary data
analysis framework in software cost estimation based on ISBSG R9 Data.
Software Quality Journal, 16, 411-458. doi: 10.1007/s11219-007-9041-4.
Lokan, C., Mendes, E. (2009). Investigating the use of chronological split for
software effort estimation. IET Software, 3, 422-434. doi: 10.1049/iet-
sen.2008.0107.
Maxwell, K., (2001). Collecting Data for Comparability: Benchmarking Software
Development Productivity. IEEE Software, 18(5), 22-25.
Meli, R., (1998). Software reuse as a potential factor of database contamination for
benchmarking in Function Points, ISBSG Workshop.
Mendes, E. (2009). Web cost estimation and productivity benchmarking. In De
Lucia, A. & Ferrucci, F. (Ed.) Software Engineering, LNCS 5413, (pp.194-
222). Springer-Verlag Berlin Heidelberg.
Mendes, E., Lokan, C., Harrison, R., Triggs, C. (2005). A replicated comparison of
cross-company and within company effort estimation models using the
ISBSG database. 11th IEEE International Software Metrics Symposium (pp.
328-337). IEEE
Mendes, E., Lokan. C. (2008). Replicating studies on cross- vs single-company effort
models using the ISBSG Database, Empir Software Eng, 13, 3–37. doi:
10.1007/s10664-007-9045-5.
Page 105
90
Menzies, T., Port, D., Chen, Z., Hihn, J. (2005). Simple software cost analysis: safe
or unsafe? PROMISE '05 Proceedings of the 2005 workshop on Predictor
models in software engineering
Menzies,T., Port, D., Chen, Z., Hihn, J. (2005). Validation Methods for Calibrating
Software Effort Models, Proceedings of the 27th international conference on
Software engineering
Menzies, T., Zhihao C., Hihn, J., Lum, K. (2006). Selecting Best Practices for Effort
Estimation. IEEE Computer Society, 32, 883-895. Doi:
10.1109/TSE.2006.114.
Moses, J., Farrow, M. (2005). Assessing variation in development effort consistency
using a data source with missing data. Software Quality Journal, 13, 71-89.
doi: 10.1007/s11219-004-5261-z.
Moses, J., Farrow, M., Parrington, N., Smith, P. (2006). A productivity
benchmarking case study using Bayesian credible intervals. Software Quality
Journal, 14, 37-52. doi: 10.1007/s11219-006-6000-4.
Özcan Top, Ö. (2008), FUNCTIONAL SIMILARITY IMPACT ON THE RELATION
BETWEEN FUNCTIONAL SIZE AND SOFTWARE DEVELOPMENT
EFFORT, Middle East Technical University, Ankara, Turkey.
Özcan Top, Ö. & Demirörs, O. (2010). Software Project Benchmark Attribute
Definitions and Process Models. (Tech. Rep. No. METU/II-TR-2011-22).
Turkey: Middle East Technical University, Information Systems.
Özcan Top, Ö., Demirörs, O., Türetken, O. (2009). Making functional similarity
count for more reliable effort prediction models. ISCIS, pp 504-512
Ozcan Top, O., Nabi M, Demirors, O. (2011), Comparison of Software
Benchmarking Repositories from Effort Prediction Perspective. International
Conference on Software Metrics and Estimating, London
Özcan Top, O., Nabi, M., Demirörs, O. (2010). Assessment of Benchmarking
Repositories From Software Effort Prediction Perspective, (Tech. Rep. No.
METU/II-TR-2011-32). Turkey: Middle East Technical University,
Information Systems.
Page 106
91
Santillo, L., & Abran, A. (2006). Software Reuse Evaluation based on Functional
Similarity in COSMIC-FFP Size Components. Paper presented at the
Software Measurement European Forum, SMEF, Rome, Italy.
Sentas, P., Angelis, L. (2006). Categorical missing data imputation for software cost
estimation by multinomial logistic regression. The Journal of Systems and
Software, 79, 404-414. doi: 10.1016/j.jss.2005.02.026.
Seo, Y. S., Yoon, K. A., Bae, D. H. (2009). Improving the Accuracy of Software
Effort Estimation based on Multiple Least Square Regression Models by
Estimation Error-based Data Partitioning. Apsec 09: Sixteenth Asia-Pacific
Software Engineering Conference (PP. 3-10). Los Alamitos, CA: IEEE
Computer Society.
Setiono, R., Dejaeger, K., Verbeke, W., Martens, D., Baesens, B. (2010). Software
Effort Prediction using Regression Rule Extraction from Neural Networks.
22ND International Conference On Tools With Artificial Intelligence (PP. 45-
52). New York, NY: IEEE Computer Society.
Software Productivity Research Group. (2010). http://www.spr.com
The Common Software Measurement International Consortium (COSMIC):2007,
Method Overview v3.0.
Tunalilar S. (2011), EFES: AN EFFORT ESTIMATION METHODOLOGY, Middle
East Technical University, Ankara, Turkey.
Tunalilar S., & Demirors, O, (2008). Effect of Functional Similarity for Establishing
Relation Between Effort and Functional Size, Asia Pasific Software
Engineering Conference, SPACE Workshop, China.
Wang, H., Wang, H., Zhang, H. (2008). Software productivity analysis with CSBSG
data set, International Conference on Computer Science and Software
Engineering, (pp. 587-593). IEEE.
Page 107
92
APPENDIX
EPC Diagrams for Benchmarking Data Collection Processes
1. Infrastructure Definition Process
Figure 10: Infrastructure Definition Process
Page 108
93
Figure 10: Infrastructure Definition Process (Continued)
Page 109
94
2. Cubit Infrastructure Definition Process
Figure 11: Cubit Infrastructure Definition Process
Page 110
95
Figure 11: Cubit Infrastructure Definition Process (Continued)
Page 111
96
3. Data Collection Process
Figure 12: Data Collection Process
Page 112
97
Figure 12: Data Collection Process (Continued)
Page 113
98
3.1. Submission Attributes Data Collection Process
Figure 13: Submission Attributes Data Collection Process
Page 114
99
3.2. Project Attributes Data Collection Process
Figure 14: Project Attributes Data Collection Process
Page 115
100
Figure 14: Project Attributes Data Collection Process (Continued)
Page 116
101
Figure 14: Project Attributes Data Collection Process (Continued)
Page 117
102
3.3. Product Attributes Data Collection Process
Figure 15 : Product Attributes Data Collection Process
Page 118
103
Figure 15: Product Attributes Data Collection Process (Continued)
Page 119
104
3.4. Software Attributes Data Collection Process size
Figure 16: Software Attributes Data Collection Process size
Page 120
105
Figure 16: Software Attributes Data Collection Process size (Continued)
Page 121
106
3.4.1. Measure COSMIC size
Figure 17: Measure COSMIC size
Page 122
107
4. Effort Attributes Data Collection Process
Figure 18 : Effort Attributes Data Collection Process
Page 123
108
Figure 18: Effort Attributes Data Collection Process (Continued)
Page 124
109
Figure 18: Effort Attributes Data Collection Process (Continued)
Page 125
110
Figure 18: Effort Attributes Data Collection Process (Continued)
Page 126
111
4.1. Data Collection Process for Project Management Effort Data
Figure 19: Data Collection Process for Project Management Effort Data
Page 127
112
Figure 19: Data Collection Process for Project Management Effort Data (Continued)
Page 128
113
Figure 19: Data Collection Process for Project Management Effort Data (Continued)
Page 129
114
4.2. Data Collection Process for Requirements’ Activities Effort Data
Figure 20: Data Collection Process for Requirements’ Activities Effort Data
Page 130
115
Figure 20: Data Collection Process for Requirements’ Activities Effort Data (Continued)
Page 131
116
4.3. Data Collection Process for Design Activities’ Effort Data
Figure 21: Data Collection Process for Design Activities’ Effort Data
Page 132
117
Figure 21: Data Collection Process for Design Activities’ Effort Data (Continued)
Page 133
118
4.4. Data Collection Process for Integration Activities’ Effort Data
Figure 22: Data Collection Process for Integration Activities’ Effort Data
Page 134
119
Figure 22: Data Collection Process for Integration Activities’ Effort Data (Continued)
Page 135
120
4.5. Data Collection Process for Test Activities’ Effort Data
Figure 23: Data Collection Process for Test Activities’ Effort Data
Page 136
121
4.6. Data Collection Process for Quality Activities’ Effort Data
Figure 24: Data Collection Process for Quality Activities’ Effort Data
Page 137
122
Figure 24: Data Collection Process for Quality Activities’ Effort Data (Continued)
Page 138
TEZ FOTOKOPİ İZİN FORMU
ENSTİTÜ
Fen Bilimleri Enstitüsü
Sosyal Bilimler Enstitüsü
Uygulamalı Matematik Enstitüsü
Enformatik Enstitüsü
Deniz Bilimleri Enstitüsü
YAZARIN
Soyadı : ................................................................................................................................... Adı : ..................................................................................................................................... Bölümü : .................................................................................................................................
TEZİN ADI (İngilizce) : ............................................................................................................... .................................................................................................................................................. .................................................................................................................................................. .................................................................................................................................................. ..................................................................................................................................................
TEZİN TÜRÜ : Yüksek Lisans Doktora
1. Tezimin tamamı dünya çapında erişime açılsın ve kaynak gösterilmek şartıyla tezimin bir kısmı veya tamamının fotokopisi alınsın.
2. Tezimin tamamı yalnızca Orta Doğu Teknik Üniversitesi kullancılarının erişimine açılsın. (Bu
seçenekle tezinizin fotokopisi ya da elektronik kopyası Kütüphane aracılığı ile ODTÜ dışına dağıtılmayacaktır.)
3. Tezim bir (1) yıl süreyle erişime kapalı olsun. (Bu seçenekle tezinizin fotokopisi ya da
elektronik kopyası Kütüphane aracılığı ile ODTÜ dışına dağıtılmayacaktır.)
Yazarın imzası ............................ Tarih .............................