1308 Volume 58, Number 11, 2004 APPLIED SPECTROSCOPY 0003-7028 / 04 / 5811-1308$2.00 / 0 q 2004 Society for Applied Spectroscopy A Spectral Identity Mapper for Chemical Image Analysis JOHN F. TURNER II,* JING ZHANG, and ANNE O’CONNOR Department of Chemistry, Cleveland State University, Cleveland, Ohio 44115 Generating chemically relevant image contrast from spectral image data requires multivariate processing algorithms that can catego- rize spectra according to shape. Conventional chemometric tech- niques like inverse least squares, classical least squares, multiple linear regression, principle component regression, and multivariate curve resolution are effective for predicting the chemical composi- tion of samples having known constituents, but they are less effec- tive when a priori information about the sample is unavailable. We have developed a multivariate technique called spectral identity mapping (SIM) that reduces the dependence of spectral image anal- ysis on training datasets. The qualitative SIM method provides en- hanced spectral shape specificity and improved chemical image con- trast. We present SIM results of spectral image data acquired from polymer-coated paper substrates used in the manufacture of pres- sure sensitive adhesive tapes. In addition, we compare the SIM re- sults to results from spectral angle mapping (SAM) and cosine cor- relation analysis (CCA), two closely related techniques. Index Headings: Chemical imaging; Spectral imaging; Multivariate analysis; Chemometric analysis; Data mining. INTRODUCTION Advances in spectral imaging instrumentation during the last two decades has lead to higher image fidelity, tighter spatial resolution, narrower spectral resolution, and improved signal-to-noise ratios. In addition, the com- mercial availability of turnkey spectral imaging systems and powerful desktop computers has lead to the wide- spread use of spectral imaging techniques in industrial, private, and academic laboratories. Raman scattering, in- frared absorption, fluorescence emission, near-infrared absorption and reflectance, and ultraviolet-visible absorp- tion and reflectance spectral imaging instruments are commercially available. 1 Reduced sample preparation and high fidelity data acquisition across the spatial extent of the sample are the chief advantages of spectral imaging techniques. Currently, diffraction-limited spatial and spectral resolutions represent the highest level of fidelity in far-field spectral imaging systems. Although optical diffraction limits the theoretically achievable far-field res- olution, spectral imaging can be performed in the near- field using scanning probe methods. 2–6 In addition to point-mapping, which is well suited to near-field scanning probe imagers, far-field methods typically utilize either line-scanning (push-broom) or wide-field (global) spec- tral imagers. 7,8 While point-mapping, line-scanning, and wide-field methods are the most common spectral imag- ing modalities, specialized techniques such as Hadamard transform spectral imaging have also been demonstrat- ed. 9–13 Regardless of the methods employed, high fidelity spectral imagers enable detailed maps of sample hetero- Received 13 March 2003; accepted 14 July 2004. * Author to whom correspondence should be sent. geneity to be constructed from the image data. An im- portant subclassification of spectral imaging is chemical imaging, in which the sought-after information from the sample is its chemical composition. Consequently, chem- ical imaging can be thought of as a two-step process, spectral image acquisition and the subsequent processing of the spectral image data to generate chemically relevant image contrast. Like spectral imaging, chemical imaging is well suited to the analysis of complex heterogeneous samples and combines the resolving power of an optical microscope or telescope with the wavelength specificity of a monochromator. The acquired data consists of a se- ries of diffraction-limited images, one for each wave- length band employed. While chemical imaging systems that provide turnkey data acquisition are increasingly widespread, better strat- egies to analyze the vast datasets they produce are need- ed. For example, a 100 wavelength band imaging exper- iment employing a charge-coupled device (CCD) detector having 1 million pixels will generate 1 3 10 8 data points. Many of the conventional data processing strategies are assisted methods that require user guidance, often by a trained analyst. The vast quantity of data that typifies spectral image datasets makes assisted methods time con- suming and increases the likelihood of user error. Con- sequently, there is a strong impetus for automated data processing strategies that provide chemically relevant im- age contrast and quantitative estimates of sample com- position. Conventional multivariate techniques such as factor analysis (FA), least squares fitting, principal com- ponents analysis (PCA), principal components regression (PCR), discriminant analysis, and multivariate curve res- olution are effective for determining the composition and concentration of samples with known constituents. 14–22 In addition, artificial neural networks (ANN), data segmen- tation strategies, pattern recognition, and learning algo- rithms have also been used successfully. 17,23–27 The dis- advantage of these techniques for spectral imaging is their reliance on training datasets or learned algorithms that can be difficult and time intensive to generate. While these techniques are suitable for samples having relative- ly simple chemical architectures, they become less effec- tive when the sample composition increases from several components to many components. The difficulty is in the formation of training samples that adequately span the data space. For example, generating training samples that include the range of chemical constituents in biological tissues is not presently practical. Nevertheless, the inves- tigation of biological samples is an important application area that would benefit from enhanced data processing strategies that do not rely on a priori information about sample composition. In many applications the constitu- ents of a sample may be unknown. Because spectral im- aging techniques are frequently employed to examine
Transcript
1308 Volume 58, Number 11, 2004 APPLIED SPECTROSCOPY0003-7028 / 04 / 5811-1308$2.00 / 0q 2004 Society for Applied Spectroscopy
A Spectral Identity Mapper for Chemical Image Analysis
JOHN F. TURNER II,* JING ZHANG, and ANNE O’CONNORDepartment of Chemistry, Cleveland State University, Cleveland, Ohio 44115
Generating chemically relevant image contrast from spectral imagedata requires multivariate processing algorithms that can catego-rize spectra according to shape. Conventional chemometric tech-niques like inverse least squares, classical least squares, multiplelinear regression, principle component regression, and multivariatecurve resolution are effective for predicting the chemical composi-tion of samples having known constituents, but they are less effec-tive when a priori information about the sample is unavailable. Wehave developed a multivariate technique called spectral identitymapping (SIM) that reduces the dependence of spectral image anal-ysis on training datasets. The qualitative SIM method provides en-hanced spectral shape specificity and improved chemical image con-trast. We present SIM results of spectral image data acquired frompolymer-coated paper substrates used in the manufacture of pres-sure sensitive adhesive tapes. In addition, we compare the SIM re-sults to results from spectral angle mapping (SAM) and cosine cor-relation analysis (CCA), two closely related techniques.
Index Headings: Chemical imaging; Spectral imaging; Multivariateanalysis; Chemometric analysis; Data mining.
INTRODUCTION
Advances in spectral imaging instrumentation duringthe last two decades has lead to higher image fidelity,tighter spatial resolution, narrower spectral resolution,and improved signal-to-noise ratios. In addition, the com-mercial availability of turnkey spectral imaging systemsand powerful desktop computers has lead to the wide-spread use of spectral imaging techniques in industrial,private, and academic laboratories. Raman scattering, in-frared absorption, fluorescence emission, near-infraredabsorption and reflectance, and ultraviolet-visible absorp-tion and reflectance spectral imaging instruments arecommercially available.1 Reduced sample preparation andhigh fidelity data acquisition across the spatial extent ofthe sample are the chief advantages of spectral imagingtechniques. Currently, diffraction-limited spatial andspectral resolutions represent the highest level of fidelityin far-field spectral imaging systems. Although opticaldiffraction limits the theoretically achievable far-field res-olution, spectral imaging can be performed in the near-field using scanning probe methods.2–6 In addition topoint-mapping, which is well suited to near-field scanningprobe imagers, far-field methods typically utilize eitherline-scanning (push-broom) or wide-field (global) spec-tral imagers.7,8 While point-mapping, line-scanning, andwide-field methods are the most common spectral imag-ing modalities, specialized techniques such as Hadamardtransform spectral imaging have also been demonstrat-ed.9–13
Regardless of the methods employed, high fidelityspectral imagers enable detailed maps of sample hetero-
Received 13 March 2003; accepted 14 July 2004.* Author to whom correspondence should be sent.
geneity to be constructed from the image data. An im-portant subclassification of spectral imaging is chemicalimaging, in which the sought-after information from thesample is its chemical composition. Consequently, chem-ical imaging can be thought of as a two-step process,spectral image acquisition and the subsequent processingof the spectral image data to generate chemically relevantimage contrast. Like spectral imaging, chemical imagingis well suited to the analysis of complex heterogeneoussamples and combines the resolving power of an opticalmicroscope or telescope with the wavelength specificityof a monochromator. The acquired data consists of a se-ries of diffraction-limited images, one for each wave-length band employed.
While chemical imaging systems that provide turnkeydata acquisition are increasingly widespread, better strat-egies to analyze the vast datasets they produce are need-ed. For example, a 100 wavelength band imaging exper-iment employing a charge-coupled device (CCD) detectorhaving 1 million pixels will generate 1 3 108 data points.Many of the conventional data processing strategies areassisted methods that require user guidance, often by atrained analyst. The vast quantity of data that typifiesspectral image datasets makes assisted methods time con-suming and increases the likelihood of user error. Con-sequently, there is a strong impetus for automated dataprocessing strategies that provide chemically relevant im-age contrast and quantitative estimates of sample com-position. Conventional multivariate techniques such asfactor analysis (FA), least squares fitting, principal com-ponents analysis (PCA), principal components regression(PCR), discriminant analysis, and multivariate curve res-olution are effective for determining the composition andconcentration of samples with known constituents.14–22 Inaddition, artificial neural networks (ANN), data segmen-tation strategies, pattern recognition, and learning algo-rithms have also been used successfully.17,23–27 The dis-advantage of these techniques for spectral imaging istheir reliance on training datasets or learned algorithmsthat can be difficult and time intensive to generate. Whilethese techniques are suitable for samples having relative-ly simple chemical architectures, they become less effec-tive when the sample composition increases from severalcomponents to many components. The difficulty is in theformation of training samples that adequately span thedata space. For example, generating training samples thatinclude the range of chemical constituents in biologicaltissues is not presently practical. Nevertheless, the inves-tigation of biological samples is an important applicationarea that would benefit from enhanced data processingstrategies that do not rely on a priori information aboutsample composition. In many applications the constitu-ents of a sample may be unknown. Because spectral im-aging techniques are frequently employed to examine
APPLIED SPECTROSCOPY 1309
FIG. 1. Image spectra cast as spectral vectors in p-dimensional wave-length space. (A) The heads of spectral vectors Di and Dj are positionedaccording to the wavelength intensities of their corresponding spectraand their tails reside at the origin. (B) The angular separation betweenthe reference vector, R, and spectral vectors, Di and Dj, is u2. Spectralvectors laying along the periphery of a cone about R have similar valuesfor u and are referred to as symmetrical spectral vectors.
chemically complex samples that are difficult to studyusing other techniques, the lack of a priori informationabout the identity of sample constituents is common. Inaddition, chemical imaging experiments often reveal thepresence of unanticipated chemical species. Some con-ventional techniques, such as PCA, have been adaptedfor qualitative analyses employing little or no trainingdata.28,29 The disadvantage of principal component anal-yses and related methods based on matrix decomposition,however, is that the initial factors represent weightedcombinations of the wavelength space and are not strictlylinked to chemical identity, but rather to data variability.The results are often difficult to interpret and require datatransformation before returning pure component esti-mates.18 Because the optimal number of principal com-ponent axes required for a particular analysis varies, mi-nor chemical constituents can be easily missed by auto-mated principal component strategies.
To address these problems, we have developed a non-parametric technique called spectral identity mapping(SIM) that extends the capabilities of spectral angle map-ping (SAM), a technique widely employed in remotesensing applications, and cosine correlation analysis(CCA), the immediate predecessor of SIM.30–32 The prin-ciple aim of SIM is to rapidly evaluate pixel similaritiesin chemical image datasets based on the shape of theircorresponding spectra. The result of the SIM method isa single image that exhibits chemically relevant imagecontrast, free of the artifacts arising from data symmetrythat can adversely afflict shape specificity in SAM and,to a lesser extent, in CCA.31,32 While SIM is scale in-variant and produces qualitative estimates of sample com-position based on spectral shape, it can be extended toprovide quantitative estimates of relative concentrationby utilizing spectral intensity. The theory and implemen-tation of SIM is described here for the first time. Thisintroduction to SIM focuses on the generation of chem-ically relevant image contrast and explores SIM as a qual-itative analytical tool for spectral image analysis. Infraredspectral image data from a model system of polymer-coated adhesive tapes is utilized to demonstrate the effi-cacy of the SIM method.
EXPERIMENTAL
Polymer-Coated Pressure Sensitive Adhesive Tape.Model systems consisting of polymer domains on papersubstrates similar to those used for commercial pressuresensitive adhesive (PSA) tapes are mounted in a paraffin-based embedding media and examined in thick cross-sec-tion. Spectral image acquisition is performed using aninfrared line-scanning microscope (PerkinElmer Spec-trum Spotlight 300 IR Imaging System). Spectral identitymapping of the image data is performed using routineswritten in Matlab 5.0 (The Mathworks, Inc.).
THEORY
Spectral Identity Mapping. After Fourier transfor-mation, the FT-IR spectral image data consists of a seriesof images, one for each wavelength band in the experi-ment. The data can alternatively be thought of as a col-lection of spectra, one for each image pixel. The first stepin SIM is to reorganize the image dataset into an n 3 p
matrix, D, where n is the number of pixels in each imageframe and p is the number of frames. Since each imageframe represents a different wavelength band, p is alsothe number of wavelengths (l1, l2, . . . , lp). The detectoroffset, consisting mostly of dark counts, is removed fromeach spectrum so that the theoretical minimum spectralintensity is zero. In order to compare the spectral shapesin the dataset, it is convenient to cast the data in p-di-mensional wavelength space so that each spectrum is rep-resented by a point in space whose position from theorigin along each wavelength axis corresponds to the in-tensity value of the spectrum at that wavelength. Castingthese points as the heads of vectors whose tails reside atthe origin (Fig. 1A), the magnitude of each vector cor-responds to the sample concentration at a particular im-age pixel. The direction of each vector, which is a man-ifestation of spectral shape, corresponds to sample com-position. Because the tail of each spectral vector residesat the origin, parallel spectral vectors lie on top of oneanother and represent sample volumes having similar rel-ative compositions, regardless of total concentration. Theangular separation between any two vectors in the dataset
1310 Volume 58, Number 11, 2004
is a measure of their compositional dissimilarity. Becausethe angle between any two vectors is independent of thevector magnitudes, SIM is scale invariant. Vectors sepa-rated by small angles represent spectra that are more sim-ilar than vectors pointing in very different directions.
Like SAM and CCA, the SIM method produces a mapof sample composition based on a set of scores describingthe spectral similarity of each spectrum to a referencespectrum. Its chief advantage is that it is nearly immuneto angular symmetries that occur when two non-identicalspectral vectors have the same angular separation withthe reference vector (Fig. 1B). These kinds of data sym-metries can avert the generation of chemically accurateand chemically meaningful image contrast. The immunityto data symmetry is accomplished in SIM by comparingthe results from three separate CCA analyses of the spec-tral image data. In two of the analyses, the spectral imagedata is recast into nearly orthogonal data sets. The SIMresult is a single full-color image in which the contrastis a direct consequence of spectral shape and, therefore,indicative of chemical composition.
Assignment of a Reference Vector. Before performingthe CCA analyses that comprise SIM, it is necessary toassign one spectrum as a reference spectrum. The onlyrequirement of the reference spectrum is that it must con-tain the same number of intensity values as there areframes ( p) in the image data set. While an artificiallygenerated spectrum having p randomly selected intensityvalues is mathematically suitable, the degree of visualcontrast in the displayed image can vary with the choiceof reference vector. Consequently, the apparent contrastbetween two or more chemical domains of interest canbe visually enhanced by carefully selecting the appropri-ate reference vector. This can be especially importantwhen the resulting image is viewed on a computer mon-itor or as a computer generated printout. In these instanc-es, the size of the color palette may be significantly small-er than the dynamic range of the data. While contem-porary computer monitors are capable of displaying mil-lions of colors, modern operating systems typically limitthe display palette to 256 simultaneously displayed colors(8-bits worth). The visual contrast worsens when the re-sulting image is viewed using a grayscale palette havingshades of gray that are nearly indistinguishable with thenaked eye. Consequently, the visual contrast between twochemical domains in the resulting SIM image depends onthe dynamic range of the displayed image and the angularseparation between the spectral vectors of interest and thereference vector. There are many methods that can beemployed to generate contrast enhancing reference vec-tors. While SAM, CCA, and SIM leave this process tothe discretion of the analyst, we present one methodbased on Gram–Schmidt orthogonalization. Tailoring thereference vector in SIM is important only in the first CCAcalculation and simply serves to provide greater visualcontrast between the chemical domains of interest. Con-sequently, reference vector optimization is not necessaryand can be eliminated from the procedure. In the absenceof reference vector optimization, the SIM method re-mains well suited to automated data processing strategiesbased on the numerical values of the SIM scores.
Spectral Image Data Perturbation in Spectral IdentityMapping. Three CCA analyses are performed in SIM.
The first CCA analysis is performed on the offset-cor-rected unperturbed spectral image data and returns thecosines of the angles separating each spectral vector fromthe reference vector. The values of the cos u scores aredependent on the choice of reference vector. Undesireddata symmetries may exist at this stage but will be re-moved in the two subsequent CCA analyses. Because thecos u scores are intuitive measures of similarity betweenthe trajectory of each spectral vector and the referencevector, this first CCA step provides SIM with easily in-terpreted chemically relevant contrast. Spectral vectorslying along the peripheries of hypothetical concentriccones about the reference vector are assigned a scorebased on the cosine of their angular separation from thereference vector. Spectral vectors lying along the samecone produce identical scores.
The second and third CCA analyses employ the orig-inal reference vector again, but utilize the offset-correctedimage data after the application of two data perturbationfunctions, F and G. The functions are represented by vec-tors f and g, each p dimensions long, that are applied asweighing factors to each of the p wavelength bands(frames) in the offset-corrected image data set. By se-lecting F and G to be orthogonal to each other in p-dimensional space and separately applying their weightsto each spectrum in D, two new image data sets are cre-ated. Ideally, spectra corresponding to the same imagepixel are orthogonal in the perturbed data sets. This con-dition is satisfied when
[F(l)Di(l)]·[G(l)Di(l)] 5 0 (1)
where Di is the ith spectrum in the image data set. Inpractice, the degree of orthogonality depends on the num-ber of wavelength bands employed and the shapes of thespectra being perturbed. If the perturbed spectra are or-thogonal, it follows from the Pythagorean Theorem that
2zF(l)D (l) 1 G(l)D (l)zi i
2 25 zF(l)D (l)z 1 zG(l)D (l)z (2)i i
Consequently, by expansion of Eq. 2, the perturbed spec-tra are orthogonal when
p2D (l )F(l )G(l ) 5 0 (3)O i q q q
q51
where q is the qth wavelength dimension. Although thenumber of orthogonal sets of functions to choose from isinfinite, it is important that each weighing function bewell distributed across the basis space of the data so thateach wavelength receives nearly equal impartiality in thesubsequent analyses. In addition, the perturbation func-tions should complement one another; where one dimin-ishes, the other should amplify. In SIM, the trigonometricfunctions, cosine and sine, which closely satisfy the se-lection criteria, are employed as F and G. By dividingone period of each trigonometric perturbation functioninto p segments, the vectors containing the weighing fac-tors become
APPLIED SPECTROSCOPY 1311
1·2p 2·2p 3·2p p·2pf 5 cos , cos , cos , . . . , cos1 2 1 2 1 2 1 2[ ]p p p p
(4)and
1·2p 2·2p 3·2p p·2pg 5 sin , sin , sin , . . . , sin1 2 1 2 1 2 1 2[ ]p p p p
(5)
The cosine- and sine-perturbed spectral image data sets,Dc and Ds, are then calculated from
Dc 5 f D and (6)m,q q m,q
Ds 5 g D (7)m,q q m,q
where m is the mth image pixel and q is the qth wave-length band (image frame). The purpose of the pertur-bation functions is to distort the wavelength space aboutthe fixed reference vector in a way that makes each spec-tral vector generate a unique set of three CCA scores.Spectral vectors pointing in the same direction will pro-duce identical sets of CCA scores. Spectra in D that aresymmetrically situated about the reference vector, but notpointing in the same direction, yield different CCA scoresfor their counterparts in the Dc and Ds data sets.
Cosine Correlation Analysis. While SAM returns theangle, u, between the reference vector and the spectralvector, CCA returns scores calculated as cos u. Conse-quently, spectra that have the same shape as the referencevector will have cos u scores equal to 1 (u ø 08), andspectra that are entirely dissimilar will yield cos u scoresequal to 0 (u ø 908). The impetus for returning cos uinstead of u is that the former is statistically relevant andis well suited for assimilation with other multivariatetechniques. Consider the statistical correlation, rij, be-tween the elements of the ith and jth rows (ith and jthspectra) of the data matrix, D, which is given by
D*·D*jir 5 (8)i j ps si j
where D and D are the mean-centered spectra, and si* *i j
and sj are the standard deviations of the ith and jth row,respectively. By substituting zD zzD zcos u for the inner* *i j
product, D ·D , and expanding si and sj, Eq. 8 becomes* *i j
rij 5 cos u (9)
where u is the angle between D and D . Consequently,* *i j
the statistically relevant correlation between two spectracan be thought of as the cosine of the angle between thevectors plotted in p-dimensional space. The statisticalcorrelation between the reference vector and a spectralimage vector is obtained by replacing either D and D* *i j
in the calculation with the mean-centered reference spec-trum, R*. The asterisk indicates mean-centered vectors.
Since raw spectral image data consists of intensity val-ues that are usually positive integers, it is conceptuallynon-intuitive to center the data about the mean. If theoffset-corrected data are not mean centered, Eq. 8 can berewritten as
D ·Djir 5 (10)i j zD z zD zi j
where zDiz and zDjz are the lengths of the ith and jth spec-tra. Likewise, it is not necessary to mean center the ref-erence vector when calculating the correlation between itand other non-centered spectral vectors.
By performing CCA pixel-wise on spectral image datasets, the correlation score, CiR, between the spectrum atthe ith pixel, Di, and a fixed reference spectrum, R, iscalculated as
p
D RO i,q qq51
C 5 5 r (11)iR iRzD z zRzi
where q is the wavelength band or frame number. Thecalculated score, CiR, replaces the spectrum correspond-ing to each pixel and reduces the dimensionality of thedata from p 1 2, p wavelengths and two spatial dimen-sions, to 1 1 2. Consequently, CCA is a data reductiontechnique. Data reduction techniques such as SAM andCCA suffer from information loss. The principal mani-festation of this loss is in the assignment of a particularCCA or SAM score to more than one spectral shape.Because an infinite number of spectra may lie along theperiphery of a cone having an axis of symmetry corre-sponding to the reference vector, spectra that are verydifferent from one another in shape may produce similaru and cos u values with respect to the reference vector.Directly using these scores to generate chemical imagecontrast may lead to erroneous qualitative estimates ofsample composition. Unfortunately, the erroneous imageresult is often visually appealing and sometimes closelyresembles what the investigators expect to find. Figure 2shows the symmetry present in the model tape data whenthe average spectrum of the offset corrected data is em-ployed as the reference vector in a SAM assessment. Thepattern of symmetry will be similar for an analysis em-ploying CCA, but the absolute scores will differ from theSAM scores. The situation cannot be remedied by choos-ing a different reference spectrum because concentriccones about any reference spectrum will still pass throughthe data cluster (Fig. 2C). Therefore, it remains probablethat more than one spectral vector will intersect the pe-riphery of the same hypothetical cone. For spectral vec-tors uniformly distributed in the cluster space, the prob-ability of this occurring is proportional to the degree ofarc subtended by the cone within the data cluster. Thebest that can be achieved using the conventional imple-mentations of SAM and CCA is to select a referencevector that differentiates between the major composition-al classes in the sample. The full description of CCAincludes an iterative protocol that implements a series ofdifferent reference vectors.31 Although the method is ca-pable of differentiating many compositional classes with-in an image data set and reduces data symmetry, the en-hancement in chemical specificity is gained at the ex-pense of data reduction. The difficulty in avoiding erro-neous data symmetry is not in choosing a referencevector, but in the strategy of relying on an inherentlysymmetrical view of the data, a set of concentric hyper-cones about the reference vector. What is needed is amathematical method for the reduction of the spectral im-age data to a single image frame that preserves the rangeof chemical compositions present in the original data set.
1312 Volume 58, Number 11, 2004
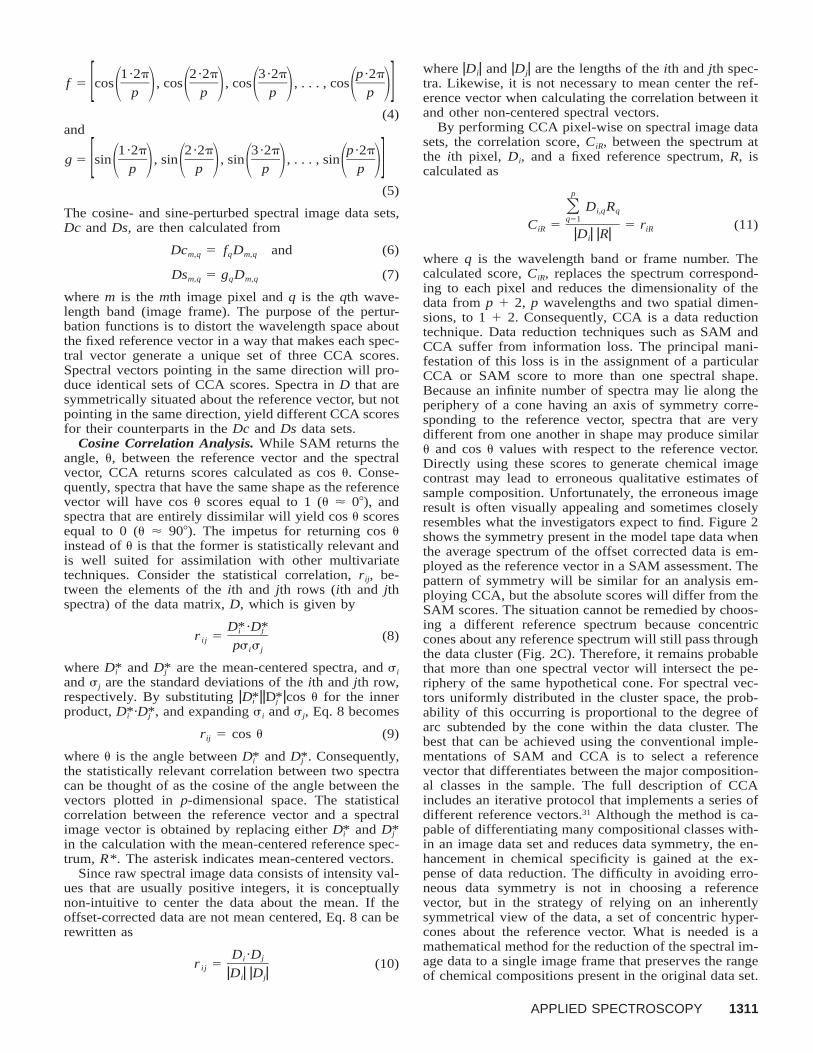
FIG. 2. Conventional SAM result of polymer-coated paper image data.(A) The SAM image produced using the average spectrum of the offset-corrected image data as the reference vector. The angular separationbetween the reference vector and the spectral vectors is reported as uin SAM and as cos u in CCA. Because the raw image data resides inthe positive quadrant of the p-dimensional space, the features appearingin the CCA image would strongly correlate with those appearing in theSAM result. Due to the relationship between u and cos u, bright featuresin SAM would appear dark in CCA. (B) A map of the data symmetriesremaining in the SAM image. Similar colors represent similar spectralangles. Pixels corresponding to spectral vectors that are not symmetricalwith other spectral vectors are shown in black. (C) By carefully se-lecting the reference vector, the chemical specificity between data clas-ses can be improved (vector R2), but it is not an effective measure inremoving data symmetry.
To approximate this, SIM asymmetrically distorts eachwavelength axis according to the F and G perturbationfunctions and generates color contrast based on the CCAscores from the undistorted, cosine-distorted, and sine-distorted image data sets. In order for erroneous datasymmetries to exist in the SIM result, the reference vectorwould have to lie in a plane bisecting Di and Dj, whilealso lying in the planes bisecting Dci and Dcj, and Dsi
and Dsj.The SIM method described here, using three CCA it-
erations with two orthogonal data perturbation functions,greatly enhances the chemical specificity of the resultingimage. In addition, it provides significant data reductionwhile preserving the intuitive nature of the result. TheSIM procedure utilizes the same reference vector duringCCA analyses of the unperturbed data (D), the cosine-perturbed data (Dc), and the sine-perturbed data (Ds). Foreach CCA analysis, the individual scores, one for eachspectral vector, are mapped to their corresponding pixel
locations in an x by n/x image, where x and n/x are theinteger numbers of pixel columns and pixel rows in theimage. The result is three CCA score-based images. Thefull-color SIM image is produced by assigning each CCAimage to one of the RGB (red, green, blue) color chan-nels. Modern RGB displays encode each channel with 8bits of dynamic range, allowing a total of 224 possiblecolors. The number of simultaneously viewable colorsdepends on the computer operating system, but is typi-cally limited to 28.
Optimizing the Reference Vector in Spectral IdentityMapping. The optimal reference vector for distinguishingbetween spectral vectors Di and Dj is the vector perpen-dicular to one of the spectral vectors and laying in thedirection pointing towards the other. The Gram–Schmidtorthogonalization method can be used to calculate theoptimal vector. The Gram–Schmidt projection, PGS, isgiven by
D ·DjiP 5 D 2 D (12)GS i j1 2D ·Dj j
where PGS is the component of Di orthogonal to Dj. Be-cause the Gram–Schmidt reference vector is mathemati-cally derived and is not obtained by the process of dataacquisition, it may contain negative intensity values. Byemploying the Gram–Schmidt generated vector as thereference vector, spectra from the image dataset that arecloser in shape to Di will have larger values for cos uthan image spectra closer in shape to Dj, which will havecos u values near zero.
RESULTS
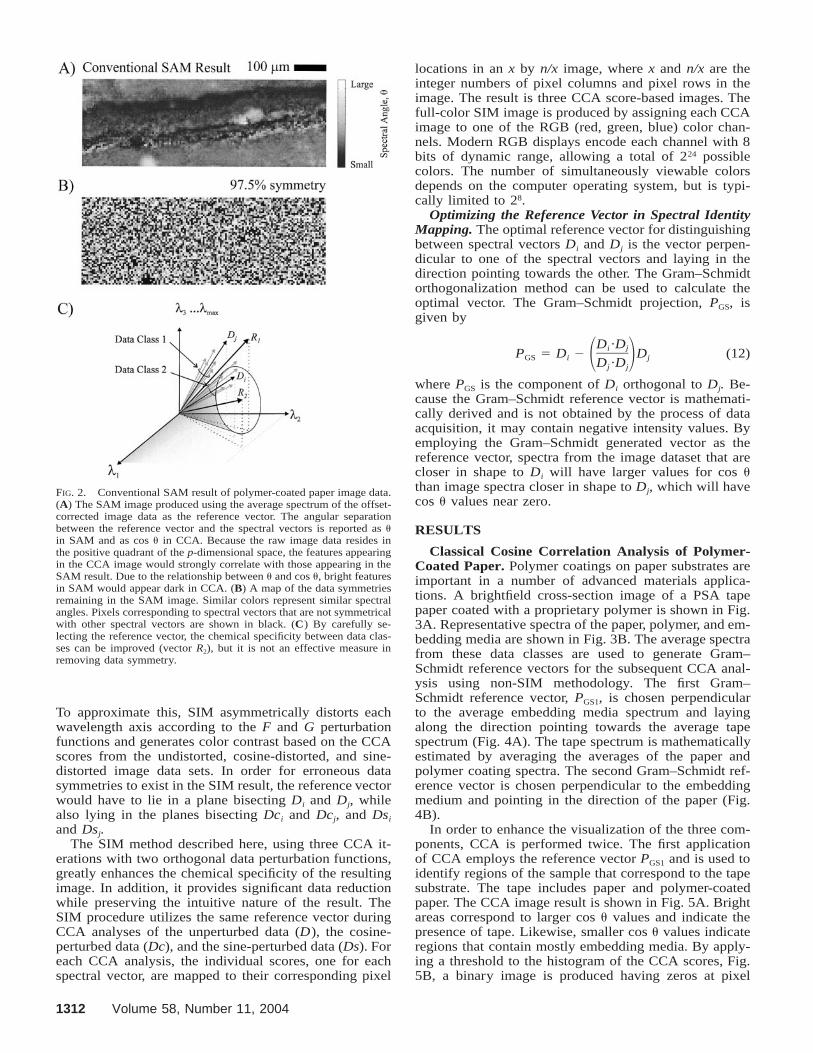
Classical Cosine Correlation Analysis of Polymer-Coated Paper. Polymer coatings on paper substrates areimportant in a number of advanced materials applica-tions. A brightfield cross-section image of a PSA tapepaper coated with a proprietary polymer is shown in Fig.3A. Representative spectra of the paper, polymer, and em-bedding media are shown in Fig. 3B. The average spectrafrom these data classes are used to generate Gram–Schmidt reference vectors for the subsequent CCA anal-ysis using non-SIM methodology. The first Gram–Schmidt reference vector, PGS1, is chosen perpendicularto the average embedding media spectrum and layingalong the direction pointing towards the average tapespectrum (Fig. 4A). The tape spectrum is mathematicallyestimated by averaging the averages of the paper andpolymer coating spectra. The second Gram–Schmidt ref-erence vector is chosen perpendicular to the embeddingmedium and pointing in the direction of the paper (Fig.4B).
In order to enhance the visualization of the three com-ponents, CCA is performed twice. The first applicationof CCA employs the reference vector PGS1 and is used toidentify regions of the sample that correspond to the tapesubstrate. The tape includes paper and polymer-coatedpaper. The CCA image result is shown in Fig. 5A. Brightareas correspond to larger cos u values and indicate thepresence of tape. Likewise, smaller cos u values indicateregions that contain mostly embedding media. By apply-ing a threshold to the histogram of the CCA scores, Fig.5B, a binary image is produced having zeros at pixel
APPLIED SPECTROSCOPY 1313
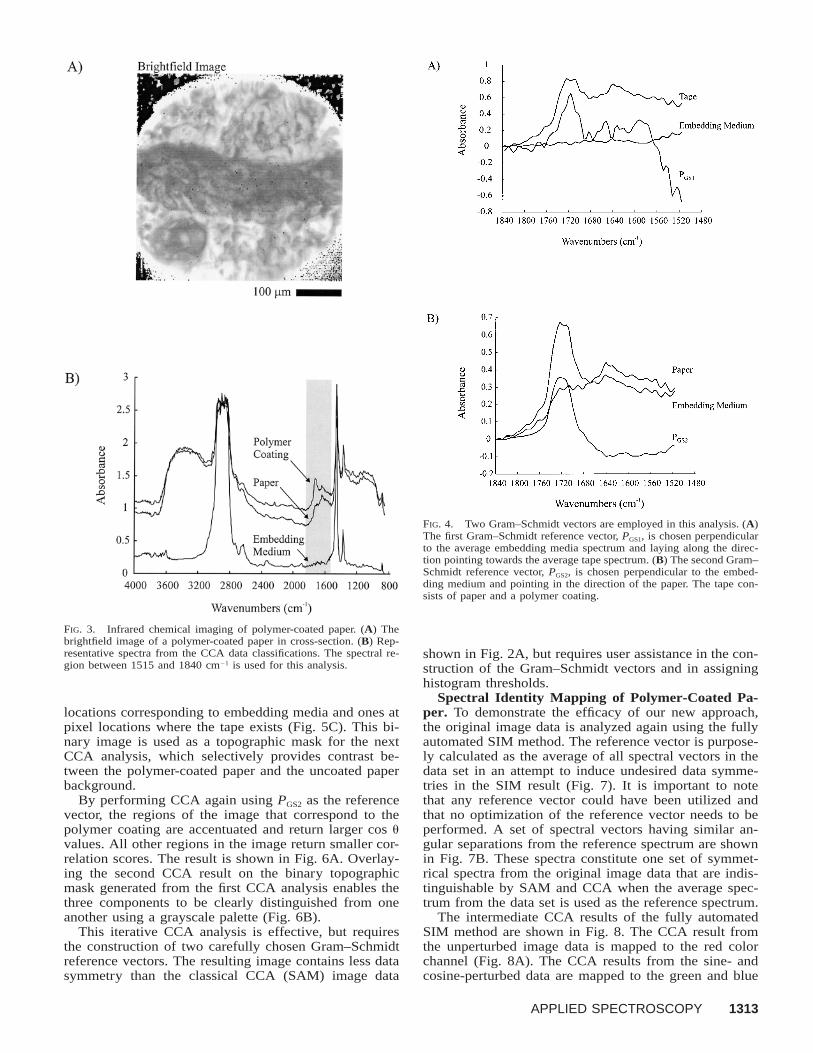
FIG. 3. Infrared chemical imaging of polymer-coated paper. (A) Thebrightfield image of a polymer-coated paper in cross-section. (B) Rep-resentative spectra from the CCA data classifications. The spectral re-gion between 1515 and 1840 cm21 is used for this analysis.
FIG. 4. Two Gram–Schmidt vectors are employed in this analysis. (A)The first Gram–Schmidt reference vector, PGS1, is chosen perpendicularto the average embedding media spectrum and laying along the direc-tion pointing towards the average tape spectrum. (B) The second Gram–Schmidt reference vector, PGS2, is chosen perpendicular to the embed-ding medium and pointing in the direction of the paper. The tape con-sists of paper and a polymer coating.
locations corresponding to embedding media and ones atpixel locations where the tape exists (Fig. 5C). This bi-nary image is used as a topographic mask for the nextCCA analysis, which selectively provides contrast be-tween the polymer-coated paper and the uncoated paperbackground.
By performing CCA again using PGS2 as the referencevector, the regions of the image that correspond to thepolymer coating are accentuated and return larger cos uvalues. All other regions in the image return smaller cor-relation scores. The result is shown in Fig. 6A. Overlay-ing the second CCA result on the binary topographicmask generated from the first CCA analysis enables thethree components to be clearly distinguished from oneanother using a grayscale palette (Fig. 6B).
This iterative CCA analysis is effective, but requiresthe construction of two carefully chosen Gram–Schmidtreference vectors. The resulting image contains less datasymmetry than the classical CCA (SAM) image data
shown in Fig. 2A, but requires user assistance in the con-struction of the Gram–Schmidt vectors and in assigninghistogram thresholds.
Spectral Identity Mapping of Polymer-Coated Pa-per. To demonstrate the efficacy of our new approach,the original image data is analyzed again using the fullyautomated SIM method. The reference vector is purpose-ly calculated as the average of all spectral vectors in thedata set in an attempt to induce undesired data symme-tries in the SIM result (Fig. 7). It is important to notethat any reference vector could have been utilized andthat no optimization of the reference vector needs to beperformed. A set of spectral vectors having similar an-gular separations from the reference spectrum are shownin Fig. 7B. These spectra constitute one set of symmet-rical spectra from the original image data that are indis-tinguishable by SAM and CCA when the average spec-trum from the data set is used as the reference spectrum.
The intermediate CCA results of the fully automatedSIM method are shown in Fig. 8. The CCA result fromthe unperturbed image data is mapped to the red colorchannel (Fig. 8A). The CCA results from the sine- andcosine-perturbed data are mapped to the green and blue
1314 Volume 58, Number 11, 2004
FIG. 5. Results from the first CCA analysis employing PGS1 as thereference vector. (A) The raw CCA image produced from the correlationscores. (B) A histogram of the correlation scores. (C) The binary imagemask created by applying a threshold to the CCA values in the corre-lation image.
FIG. 7. (A) Average FT-IR spectrum from the infrared image data set.The SIM analysis performed here employs the average spectrum as thereference spectrum. (B) A set of 17 symmetrical spectra from the orig-inal data set that are separated from the reference vector, R, by the sameangle. The set of spectra is shown before and after application of thesine and cosine perturbation functions. The variance, s2, of the CCAscores for the member spectra of the symmetry group changes after dataperturbation. Since the average spectrum is likely to induce many datasymmetries, its implementation as the reference vector tests the efficacyof the SIM method.
FIG. 6. Results from an additional CCA analysis using PGS2 as thereference vector. (A) The raw CCA image produced from the correlationscores. (B) A color-mapped surface showing low lying areas as embed-ding medium and elevated regions as tape. The pseudo-coloration is aqualitative estimate of the concentration of polymer coating present.
channels, respectively (Figs. 8B and 8C). Each interme-diate CCA result retains unwanted data symmetries, butfrom one result to the next, the pixels belonging to aparticular symmetry group change. Since spectra that dif-fer in shape are not likely to remain paired in the samesymmetry groups after data perturbation, the effect is togreatly reduce data symmetry. The SIM result of thecombined CCA images is shown in Fig. 9. The map ofdata symmetries persisting in the SIM image, Fig. 9B,indicates that more than 99 percent of the existing sym-metries have been removed and that 99.8 percent of thespectra have uniquely identifiable shapes within the pre-cision of the calculation. The source code we employ toperform SIM distinguishes between spectra having cos uscores that differ by at least 1024. After SIM analysis, 14of the 7293 spectra in the image data lack unique sets of
APPLIED SPECTROSCOPY 1315
FIG. 8. Intermediate SIM results from the polymer-coated paper data. The SIM result consists of three CCA analyses performed on the offset-corrected image data. In two of the analyses, the data is first perturbed using weights obtained from the trigonometric functions, sine and cosine.(A) The CCA image produced from the unperturbed data showing chemical contrast similar to the SAM and conventional CCA results. The CCAimages from (B) the sine-perturbed data and (C) the cosine-perturbed data act as data symmetry filters. In each CCA calculation, the same referencevector is utilized. (D, E, and F) Maps of data symmetries existing in A, B, and C, respectively. Similar colors represent similar CCA scores. Blackpixels correspond to CCA scores that are unique, appearing only once in the image data.
FIG. 9. The SIM image result. (A) The SIM result obtained by map-ping each CCA result shown in Fig. 8 to one of the color channels inan RGB image. The CCA result from the unperturbed data is mappedto the red channel and the results from the sine- and cosine-perturbeddata are mapped to the green and blue channels, respectively. (B) Amap of data symmetries demonstrating the significant reduction of datasymmetry in SIM. Black pixels correspond to CCA scores that areunique, appearing only once in the image data.
CCA score triplets. Seven score triplets, each correspond-ing to two spectra, make up the data symmetry. Figure10 shows the seven pairs of symmetrical spectra. Ob-servable differences between the spectra in each pairingsuggest that greater symmetry reduction is achievable byimproving the precision of the SIM calculation to betterthan 1024. For the SIM analysis presented here, greaterprecision is unnecessary. Since the purpose of SIM is toassign a color to each image pixel that is specific to thecorresponding spectral shape and to differentiate betweenspectra that are symmetrically situated about the refer-ence vector, it suffices that closely related spectra are as-signed to closely related scores in each of the interme-diate CCA images. The important corollary to this is thatpixels corresponding to dissimilar spectra will be as-signed different colors in the SIM image. The small var-iance within each group of symmetrical spectra (Fig. 10)demonstrates that the classical SAM and CCA-type sym-metries, which enable dissimilar spectra to be assignedto similar scores (colors), have been effectively removed.
Because SIM is spectral shape specific, noise in theimage data set can degrade the chemical relevance of thecolor contrast in the SIM image. The problem is notunique to SIM, however, since noise is a fundamental
1316 Volume 58, Number 11, 2004
FIG. 10. Spectra that produce non-unique SIM scores. Fourteen pixelsin the SIM image shown in Fig. 9 lack uniqueness. Unlike classicalSAM and non-iterative CCA methods, which can erroneously assigndissimilar spectra to the same data class, SIM effectively removes sym-metries of this type. The variances within each group of undifferentiatedspectra (A through G) are small and indicate superior shape specificityin SIM.
limitation to most data analyses. The vast quantities ofdata acquired in spectral imaging experiments can be ad-vantageous though, since the S/N ratio is proportional toÏp. Consequently, the pointing stability of a spectralvector residing in p-dimensional space improves as thedimensionality of the space increases, assuming that thenoise is wavelength independent. Because spectral shapeis a manifestation of chemical composition, techniquesthat are impervious to noise or that remove noise shouldbe carefully scrutinized when the aim of a particular anal-ysis is to extract subtle variations in sample composition.Frequency domain techniques such as Fourier filtering,for example, are effective in the removal of noise, butoften superimpose artifacts from the analysis on the data.Ghosting artifacts, for example, are sometimes observedwhen Fourier filtering is performed across the spatial di-mensions of an image.
The CCA score triplets that make up the SIM imageare easily integrated with existing multivariate methods.By applying conventional methods like cluster analysisto the SIM results, the number of chemically distinctidentities that exist in the original image data can be es-timated. One convenient approach is to plot the CCAresults from the analyses of D, Dc, and Ds in three di-mensions so that each image pixel is represented by a setof three CCA scores, one from each image data set an-alyzed in SIM. By taking advantage of the chemical spec-ificity and data reduction capabilities of SIM, clusteranalysis of image data sets having many wavelengths ( pk 3) can be performed in three dimensions. While it issometimes not possible to determine the exact number ofchemical species present in a particular sample, becausetwo or more species may always appear coalesced in theimage data, cluster analysis of the intermediate CCA re-sults is one example that illustrates how SIM can be in-tegrated with traditional chemometric methods. BecauseSIM can be fully automated, it is useful in data miningand classification applications that are not limited to spec-tral image data.
CONCLUSION
We have developed a novel data reduction method forgenerating chemically relevant image contrast from largespectral image data sets. The qualitative SIM method isscale invariant and is well suited to automated data anal-ysis and data mining applications. An extension of theCCA and SAM techniques, the SIM method provides im-proved spectral shape specificity and enhanced chemicalimage contrast without the need for training data, learn-ing algorithms, or other forms of a priori chemical in-formation. The SIM result is a single full-color image inwhich pixels having similar colors correspond to samplevolumes having similar compositions. By implementingspectral amplitudes and combining the SIM approachwith classical chemometric strategies, SIM can be easilyadapted for quantitative spectral image analysis.
ACKNOWLEDGMENT
The authors express appreciation to the Society of Analytical Chem-ists of Pittsburgh for financial support of this work.
1. J. F. Turner II, SPIE’s OE Magazine, May 30 (2002).2. H. F. Hamann, A. Gallagher, and D. J. Nesbitt, Appl. Phys. Lett.
73, 1469 (1998).3. K. D. Weston, J. A. DeAro, and S. K. Buratto, Rev. Sci. Instrum.
67, 2924 (1996).4. C. E. Jordan, S. J. Stranick, R. R. Cavanagh, L. J. Richter, and D.
B. Chase, Surf. Sci. 433–435, 48 (1999).5. B. Hecht, B. Sick, U. P. Wild, V. Deckert, R. Zenobi, O. J. F. Martin,
and D. W. Pohl, J. Chem. Phys. 112, 7761 (2000).6. Y. D. Suh and R. Zenobi, Adv. Mater. 12, 1139 (2000).7. M. D. Schaeberle, H. R. Morris, J. F. Turner II, and P. J. Treado,
Anal. Chem. 71, 175A (1999).8. S. Schlucker, M. D. Schaeberle, S. W. Huffman, and I. W. Levin,
Anal. Chem. 75, 4312 (2003).9. J. F. Turner II and P. J. Treado, Proc. SPIE 2599, 576 (1996).
10. Q. S. Hanley, P. J. Verveer, and T. M. Jovin, Appl. Spectrosc. 53,1 (1999).
11. R. A. DeVerse, R. M. Hammaker, and W. G. Fateley, J. Mol. Struct.521, 77 (2000).
12. D. C. Tilotta, R. M. Hammaker, and W. G. Fateley, Appl. Spectrosc.41, 727 (1987).
13. D. C. Tilotta, R. D. Freeman, and W. G. Fateley, Appl. Spectrosc.41, 1280 (1987).
14. W. R. Dillon and M. Goldstein, Multivariate Analysis Methods andApplications (John Wiley and Sons, New York, 1984).
15. N. Cliff, Analyzing Multivariate Data (Harcourt Brace Jovanovich,New York, 1987).
16. P. Geladi and H. Grahn, Multivariate Image Analysis (John Wileyand Sons, New York, 1996).
17. V. P. Wallace, J. C. Bamber, D. C. Crawford, R. J. Ott, and P. S.Mortimer, Phys. Med. Biol. 45, 2859 (2000).
18. J. R. Schoonover, R. Marx, and S. L. Zhang, Appl. Spectrosc. 57,154A (2003).
19. S. Tomatis, C. Bartoli, A. Bono, N. Cascinelli, C. Clemente, andR. Marchesini, J. Photochem. Photobiol. 42, 32 (1998).
20. W. Windig, Chemom. Intell. Lab. Syst. 4, 293 (1988).21. M. Mellinger, Chemom. Intell. Lab. Syst. 2, 225 (1987).22. S. Wold, K. Esbensen, and P. Geladi, Chemom. Intell. Lab. Syst.
2, 209 (1987).23. B. K. Lavine, Anal. Chem. 70, 209R (1998).24. J. Kanglee, S. Tsai, Y. Ho, S. Chanclai, and C. Kao, Anticancer
Res. 21, 1481 (2001).25. M. Romeo, F. Burden, M. Quinn, B. Wood, and D. McNaughton,
Cell. Mol. Biol. 44, 179 (1998).26. P. Lasch and D. Naumann, Cell. Mol. Biol. 44, 189 (1998).
APPLIED SPECTROSCOPY 1317
27. M. Jackson, J. R. Mansfield, B. Dolenko, R. L. Somorjai, H. H.Mantsch, and P. H. Watson, Canc. Det. Prev. 23, 245 (1999).
28. C. A. Drumm and M. D. Morris, Appl. Spectrosc. 49, 1331 (1995).29. T. T. Cai, D. Zhang, and D. Ben-Amotz, Appl. Spectrosc. 55, 1124
(2001).30. F. A. Kruse, A. B. Lefkoff, J. W. Boardman, K. B. Heidebrecht, A.
T. Shapiro, P. J. Barloon, and A. F. H. Goetz, Remote Sens. Environ.44, (1993).
31. J. F. Turner II, Ph.D. Thesis, University of Pittsburgh, Pittsburgh,Pennsylvania (1998).
32. H. R. Morris, J. F. Turner II, B. Monroe, R. A. Ryntz, and P. J.Treado, Langmuir 15, 2961 (1999).