ic chain configuration producinghigh performance PEBAX-1657 membranes for CO2
separation†
Pankaj Sharma, * Young-Jin Kim, Min-Zy Kim, Syed Fakhar Alamand Churl Hee Cho *
Although PEBAX-1657 is one of the promising polymeric materials for selective CO2 separation, there
remain many questions about the optimal polymeric structure and possibility of improving performance
without adulterating its basic structure by impregnating inorganic fillers. In order to improve the gas
separation performance, low thickness PEBAX membranes were synthesized under steady solvent
evaporation conditions by keeping in mind that one of its segments (nylon 6) shows structural variance
and molecular orientation with a change in the evaporation rate. Furthermore, phase pure zeolite
nanocrystals with cubic (zeolite A) and octahedral (zeolite Y) shapes have been synthesized through
liquid phase routes using microwave hydrothermal reactors. The average sizes of zeolite A and Y crystals
are around 55 and 40 nm, respectively. The inspection of XRD, DSC and Raman shift of PEBAX
membranes demonstrates the formation of a stable polymeric structure with an improved crystalline
state which results in high CO2 permeability membranes. The CO2 permeability as well as diffusivity
increase with a decrease in membrane thickness and reach a maximum value of 184.7 Barrer and 2.6 �10�6 cm2 s�1, respectively. The as-fabricated pristine PEBAX membrane shows much better performance
in terms of permeance (CO2 184.7 Barrer), diffusivity (CO2 2.6 � 10�6 cm2 s�1) and selectivity (CO2/N2
59.7), which substantiate its promising prospects for CO2 capture. This exceptional performance of the
pristine PEBAX membrane arises from the free volume generated during the steady polymerization. This
reported approach for PEBAX membrane synthesis provides a direction in the design of membrane
fabrication processes for economic CO2 separation.
1. Introduction
Global warming is mainly caused by the emission of greenhousegases and 72% of the total emitted greenhouse gases are carbondioxide (CO2), 18% methane and 9% nitrous oxide (NOx).Therefore, CO2 emission is the primary cause of global warm-ing, and human activities are mainly responsible for green-house gas emission into the earth environment.1 Thus, CO2
capture, separation, and storage have been considered as one ofthe most important technological efforts to combat the globalwarming challenge. Compared to well-known technologies forCO2 capture including amine scrubbing, solid adsorption,solvent adsorption, and cryogenic distillation, membraneseparation is more promising due to its system compactness(small footprint), ease of operation, least environmental impactand exceptional reliability.2–10 Particularly, the amine scrubbing
ology, Chungnam National University, 99
ublic of Korea. E-mail: sharmapankaj47@
tion (ESI) available. See DOI:
hemistry 2019
based post-combustion CO2 capture process has large humanhealth and environmental concern because of solvent emis-sions during the processing. Furthermore, a high amount ofenergy is needed for CO2 desorption which results in efficiencyloss in the case of amine-based scrubbing.
Inorganic and polymeric membranes are two major playersfor CO2 capture.11 Although, inorganic membranes have alsobeen extensively investigated for gas separation due to theirexceptional separation performance and incredible thermal andchemical stability, their cost and lack of processability are themajor issues for their large-scale production. Furthermore,assembling of inorganic membranes into high packing densitymembrane modules is critical for the ue gas process. On theother hand, polymeric membranes have emerged as an idealcandidate for large scale processing plants.12,13 However,polymer-based membranes have a major drawback, the so-called permeability–selectivity trade-off, i.e., either increase inpermeability or decrease in selectivity or vice versa.14
To address these issues and to prepare novel membranes/materials, researchers made attempts to combine the merits ofpolymeric and inorganic materials to develop a new class ofmembranes.14–23 Poly(ether-block-amide) polymer commonly
Scheme 1 Zeolite framework structures representing the channeldiameter of zeolites Y and A, whereas the chemical structure of PEBAX1657 displays the composition of monomers.
Nanoscale Advances Paper
Ope
n A
cces
s A
rtic
le. P
ublis
hed
on 1
4 M
ay 2
019.
Dow
nloa
ded
on 1
2/4/
2021
7:0
6:33
PM
. T
his
artic
le is
lice
nsed
und
er a
Cre
ativ
e C
omm
ons
Attr
ibut
ion
3.0
Unp
orte
d L
icen
ce.
View Article Online
known as PEBAX is considered as one of the ideal polymericmaterials for membrane-based separation of CO2 from ue gasand natural gas because of its comparatively high gas perme-ability as well as CO2 selectivity.1,16,24–38 PEBAX consists of twomonomers polyethylene oxide (PEO) and polyamide (PA), wherethe earlier component provides exibility and high CO2 perme-ability due to its high affinity with the polar CO2 molecule, whilethe latter component imparts mechanical strength to themembrane. As ether oxygen moieties have a signicant affinity toacid gases, PEBAX is considered as one of the best candidates forCO2 separation from light gases.24,32 The perfect balance betweenpermeability and CO2 selectivity can be achieved by increasingthe free ow of gas molecules through the polymeric membranewithout altering the surface structure of the polymer.
Polymer free-volume, the fraction of the volume not occupiedby the electronic clouds of the polymer, plays an important rolein the transport properties of low molecular weight species andgases. In other words, molecular transport through a densepolymer depends strongly on free volume; therefore, control overfree-volume is thus important for the development of bettermembranes for a wide variety of applications such as gas sepa-ration, pharmaceutical purication, and energy storage.13,15,24,39–43
Free volume (i.e., static voids created by inefficient chain packingor transient gaps generated by thermally induced chain segmentrearrangements) presents diffusing molecules with a low resis-tance avenue for transport.15,39,40,44–47 Not only the overall amountof free-volume but also the distribution of the effective microporesize is likely to have a signicant inuence on polymer propertiesif the free-volume elements are interconnected. The use of inor-ganic llers in mixed matrix membrane (MMM) is to inuencethe free volume.15,24,40 However, the addition of cost-ineffectivenano-size inorganic llers generally shows negative effects onthe selectivity with little improvement in permeability. If theaddition of nano-inorganic llers is just to improve the perme-ability of the membrane, then it is better to nd an alternativemethod to achieve the same. Recently, ultrathin supports havebeen utilized to develop high performance polymer compositemembranes.48–53
In this reported paper, attempts have been made to improvethe permeability as well as CO2 selectivity of the PEBAX-1657membrane by improving the polymeric structure and control-ling the free volume of the membrane. This work reects that thefree volume of the PEBAX-1657 membrane can easily becontrolled by controlling the polymer chain conformation.Furthermore, to ascertain the structural as well as chemicalreforms in the as-fabricated pristine PEBAXmembrane elaboratediffraction, electron scanning, thermal, spectroscopic, etc., anal-yses were conducted. Moreover, a number of experiments wereperformed to compare the selectivity of pristine PEBAX-1657membranes with that of nano-molecular sieves (Scheme 1)embedded mixed matrix membranes (MMMs).
2. Experimental2.1 Materials
Commercially available PEBAX® 1657 was used for membranesynthesis. The chemicals used for nano-size NaA and NaY
2634 | Nanoscale Adv., 2019, 1, 2633–2644
zeolite molecular sieve synthesis, membrane preparation, andperformance evaluation were as follows: tetramethylammo-nium silicate (TMAS) ((CH3)4N(OH)$2SiO2, 15–20 wt%,$99.99%, Aldrich), colloidal silica suspension (CSS) (SiO2,LUDOX®HS-30 colloidal silica, 30 wt% suspension in H2O,Aldrich), aluminium isopropoxide (Al(OCH(CH3)2)3, $98%,Aldrich), tetrametylammonium hydroxide (TMAOH) pentahy-drate ((CH3)4N(OH)$5H2O, 98%, Alfa Aesar), tetrametylammo-nium bromide (TMABr) ((CH3)4N(Br), 98%, Sigma Aldrich),sodium hydroxide (min. 97%, Junsei Chemical Co. Ltd., Japan),and ethanol (EtOH) (99.9% absolute, OCI company Ltd.). Allchemicals used in this study were of analytical grade andultrapure water (0.054 mS cm�1) obtained from a mPure system(ROMAX, Human Science, Republic of Korea) was usedthroughout the experiments. Ultra-high purity grade CO2, O2,N2, and CH4 gases were used for single gas permeationexperiments.
2.2 Zeolite molecular sieve synthesis
Zeolite molecular sieves (zeolite A (LTA type) and zeolite Y (FAUtype)) having different porous characters (structure and size)and Si/Al ratios have been synthesized through liquid phaseroutes using a microwave hydrothermal reactor (CEM, Discover-909150, maximum power of 300 W). Detailed synthesis condi-tions with chemical compositions and their structural proper-ties have been summarized in Table 1. Aer the synthesis, theresultant milky suspensions containing nano-size zeolitemolecular sieves were cooled to room temperature and dilutedwith deionized water. The resulting nano-crystals were thenseparated from the mother liquor by high speed centrifugationat 20 000 rpm for 20 min at 4 �C followed by repeated re-dispersion in deionized water and centrifugation (washing
step was repeated 5 times). To avoid the aggregation or coagu-lation of the nano-particles during drying, the nally collectedwet zeolite particles were directly dispersed in DIW. The re-ported percentage of zeolite molecular sieves loaded on PEBAX-1657 membranes was directly obtained from the wet sample.
2.3 Membrane synthesis
Fig. S1, ESI† presents the stepwise preparation procedure forthe pristine PEBAX and double layer PEBAX/nano-molecularsieve MMMs. PEBAX® 1657 pellets were dissolved inEtOH : H2O (70 : 30 wt%) solvent at 80 �C for 2 h with highspeed stirring in a microwave hydrothermal reactor to obtain2.5% PEBAX solution. Different thickness membrane lms wereobtained by pouring different amounts of polymer solution intoa Teon Petri dish (f 85 mm). Subsequently, the polymersolution containing Teon Petri dish was covered with lterpapers (F1113 grade, Chmlab) to slow down the evaporation ofsolvent allowing the formation of a polymeric membrane withuniform thickness and better crystallinity. The polymeric solu-tion was dried for 2 days at 40 �C. Once dried, the lm wasplaced under vacuum for 24 h for complete solvent removalfrom the lm. Aer this period, the lm was allowed to cool toroom temperature under vacuum. A 50 mm diameter circularsample was cut from the lm and used for permeation tests,whereas, the PEBAX/nano-molecular sieve MMMs were fabri-cated by just casting the inorganic ller suspension in 1%PEBAX solution (EtOH : H2O: 70 : 30) on a dried PEBAX lm asshown in Fig. S1, ESI† followed by drying. Casting of inorganicmolecular sieves on the polymeric lm instead of mixing withpolymer solution was performed to avoid the void formationbetween the high concentration polymer and inorganic parti-cles at their interface. The resultant membranes were denotedas P75, P40, P22, P14, P63A, and P56Y, where digits in the subscriptrepresent the thickness of the membrane and letters molecularsieves.
2.4 Zeolite particles and membrane characterization
Powder X-ray diffraction studies of the nano-molecular sievesand PEBAXmembranes were performed on a PANalytical: X'PertPRO diffractometer with Cu-Ka radiation (l ¼ 1.5418 A) and thedata were collected in the 2q range of 5–60� with a step size of0.02� s�1. Phase identication for zeolites A and Y was per-formed with the help of JCPDS les for inorganic compounds(LTA #97-002-4901 and FAU # 98-003-4277). The morphologicalcharacteristics, particle size, and membrane thickness wereevaluated with a scanning electronmicroscope (SEM, JEOL-JSM-7000F). The membrane samples were prepared by fracturing themembrane in liquid nitrogen and subsequent sputter coating ofpalladium. The average particle size and particle size distribu-tions of the inorganic llers were measured by light scatteringanalysis (Nanotrac Wave, Microtrac, Inc.) at 298 K. Trans-mission electronmicroscopy (TEM) images were obtained usingan FEI Tecnai™ G2 F30 electron microscope, operating at 300kV. The particle size distribution (PSD) in volume percent wascalculated by using Microtrac FLEX 11 operating soware. Thethermal properties and glass transition temperatures (Tg) of
pristine PEBAX membranes were determined using a differen-tial scanning calorimeter (DSC) (TGA/DSC 1 STARe systemMETTLER TOLEDO instruments). The measurements werecarried out using a standard heating–cooling–heating proce-dure at a rate of 10 K min�1 in a nitrogen atmosphere.Furthermore, the chemical structure of the as-fabricated PEBAXmembranes was characterized by using Raman spectra, whichwere recorded by using a LabRAM HR Evolution 800, RamanSpectrometer from Horiba Scientic (785 nm diode laser exci-tation). Fourier transform infrared spectroscopy (FTIR, ALPHA-Platinum ATR, Bruker) spectra of pristine PEBAX membranesamples were recorded in the range of 600–3600 cm�1 witha resolution of 1.4 cm�1 (64 scans) to assert the changes in thepolymeric chain conformation. Water vapor adsorption/desorption experiments were performed at 298 K using anautomatic adsorption measurement apparatus, BELSORP-max(BEL Japan, Inc.), and each sample was outgassed for 6 h at423 K before analysis. A �66 point water vapor adsorption/desorption isotherm has been recorded and used for surfacearea and total pore volume calculation. The experimental valuesof membrane density were determined at 25 �C using Archi-medes' principle with an electronic balance (Mettler ToledoXS205) equipped with a density measurement kit. An auxiliaryliquid, silicon oil (ro ¼ 0.913 g cm�3), with known densities wasused to evaluate the density, and to affirm the variation infraction free volume (FFV). A piece (approximately 4 cm2) ofeach polymeric membrane was introduced into a sample panand basket for weight measurement in air and the liquid phase,respectively. Considering some degree of hydrophilicity of thePEBAX membrane, two different uid (de-ionized water andsilicon oil) were selected to minimize the source of error due tothe liquid–polymer interaction over the time scale of
Fig. 1 Schematic diagram of the experimental set-up (time-lag machin
2636 | Nanoscale Adv., 2019, 1, 2633–2644
equilibration during weight measurement. The experimentalvalues of density (rp) were calculated by using the followingequation:
rp ¼ (Wair/(Wair � Wliquid))ro (1)
where Wair and Wliquid are the membrane weight in air and inthe liquid phase, respectively.
The fraction free volume (FFV) and specic free volume (SFV)of pristine PEBAX membranes were calculated using thefollowing equations based on the density data:24
FFV ¼ 1 � 1.3nwrp (2)
SFV ¼ 1/rp � 1.3nw (3)
where rp is the density of PEBAX, and nw is the van der Waal'svolume (0.590 cm3 g�1) of the repeat unit of PEBAX.24
2.5 Gas permeation measurement
The permeability of the polymeric membranes and MMMs weremeasured at room temperature (25 �C) and at a feed pressure of2.7 bar using a single gas with a xed-volume pressure increaseinstrument.54 The permeability was measured directly and thetime lag method was applied to the recorded data to determinethe diffusivity coefficient. The solubility coefficient was taken asthe ratio of the permeability to the diffusivity coefficient. Theschematic diagram of the permeation system is shown in Fig. 1.A at sheet circular cell affixed with a mesh to support themembrane of effective area 15.2 cm2 was placed in a thermostatoven to control the temperature. Before analysis, themembranes were evacuated for at least 24 h to remove thepreviously adsorbed species. Moreover, to achieve accurate
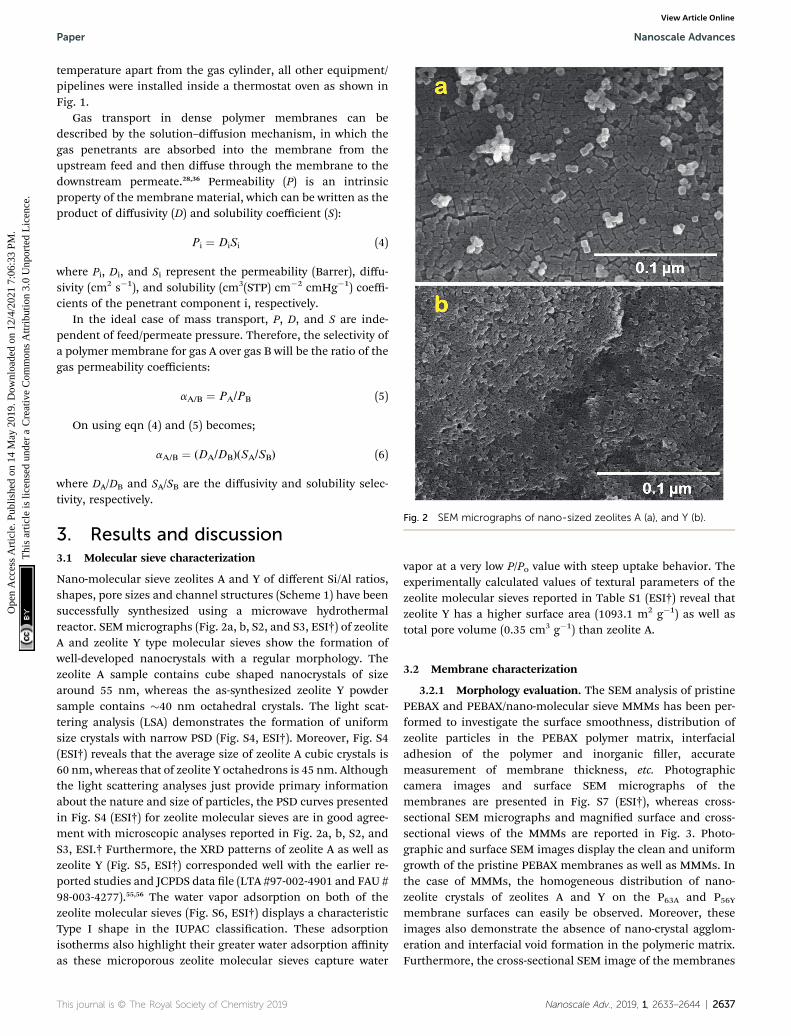
Fig. 2 SEM micrographs of nano-sized zeolites A (a), and Y (b).
Paper Nanoscale Advances
Ope
n A
cces
s A
rtic
le. P
ublis
hed
on 1
4 M
ay 2
019.
Dow
nloa
ded
on 1
2/4/
2021
7:0
6:33
PM
. T
his
artic
le is
lice
nsed
und
er a
Cre
ativ
e C
omm
ons
Attr
ibut
ion
3.0
Unp
orte
d L
icen
ce.
View Article Online
temperature apart from the gas cylinder, all other equipment/pipelines were installed inside a thermostat oven as shown inFig. 1.
Gas transport in dense polymer membranes can bedescribed by the solution–diffusion mechanism, in which thegas penetrants are absorbed into the membrane from theupstream feed and then diffuse through the membrane to thedownstream permeate.28,36 Permeability (P) is an intrinsicproperty of the membrane material, which can be written as theproduct of diffusivity (D) and solubility coefficient (S):
Pi ¼ DiSi (4)
where Pi, Di, and Si represent the permeability (Barrer), diffu-sivity (cm2 s�1), and solubility (cm3(STP) cm�2 cmHg�1) coeffi-cients of the penetrant component i, respectively.
In the ideal case of mass transport, P, D, and S are inde-pendent of feed/permeate pressure. Therefore, the selectivity ofa polymer membrane for gas A over gas B will be the ratio of thegas permeability coefficients:
aA/B ¼ PA/PB (5)
On using eqn (4) and (5) becomes;
aA/B ¼ (DA/DB)(SA/SB) (6)
where DA/DB and SA/SB are the diffusivity and solubility selec-tivity, respectively.
3. Results and discussion3.1 Molecular sieve characterization
Nano-molecular sieve zeolites A and Y of different Si/Al ratios,shapes, pore sizes and channel structures (Scheme 1) have beensuccessfully synthesized using a microwave hydrothermalreactor. SEMmicrographs (Fig. 2a, b, S2, and S3, ESI†) of zeoliteA and zeolite Y type molecular sieves show the formation ofwell-developed nanocrystals with a regular morphology. Thezeolite A sample contains cube shaped nanocrystals of sizearound 55 nm, whereas the as-synthesized zeolite Y powdersample contains �40 nm octahedral crystals. The light scat-tering analysis (LSA) demonstrates the formation of uniformsize crystals with narrow PSD (Fig. S4, ESI†). Moreover, Fig. S4(ESI†) reveals that the average size of zeolite A cubic crystals is60 nm, whereas that of zeolite Y octahedrons is 45 nm. Althoughthe light scattering analyses just provide primary informationabout the nature and size of particles, the PSD curves presentedin Fig. S4 (ESI†) for zeolite molecular sieves are in good agree-ment with microscopic analyses reported in Fig. 2a, b, S2, andS3, ESI.† Furthermore, the XRD patterns of zeolite A as well aszeolite Y (Fig. S5, ESI†) corresponded well with the earlier re-ported studies and JCPDS data le (LTA #97-002-4901 and FAU #98-003-4277).55,56 The water vapor adsorption on both of thezeolite molecular sieves (Fig. S6, ESI†) displays a characteristicType I shape in the IUPAC classication. These adsorptionisotherms also highlight their greater water adsorption affinityas these microporous zeolite molecular sieves capture water
vapor at a very low P/Po value with steep uptake behavior. Theexperimentally calculated values of textural parameters of thezeolite molecular sieves reported in Table S1 (ESI†) reveal thatzeolite Y has a higher surface area (1093.1 m2 g�1) as well astotal pore volume (0.35 cm3 g�1) than zeolite A.
3.2 Membrane characterization
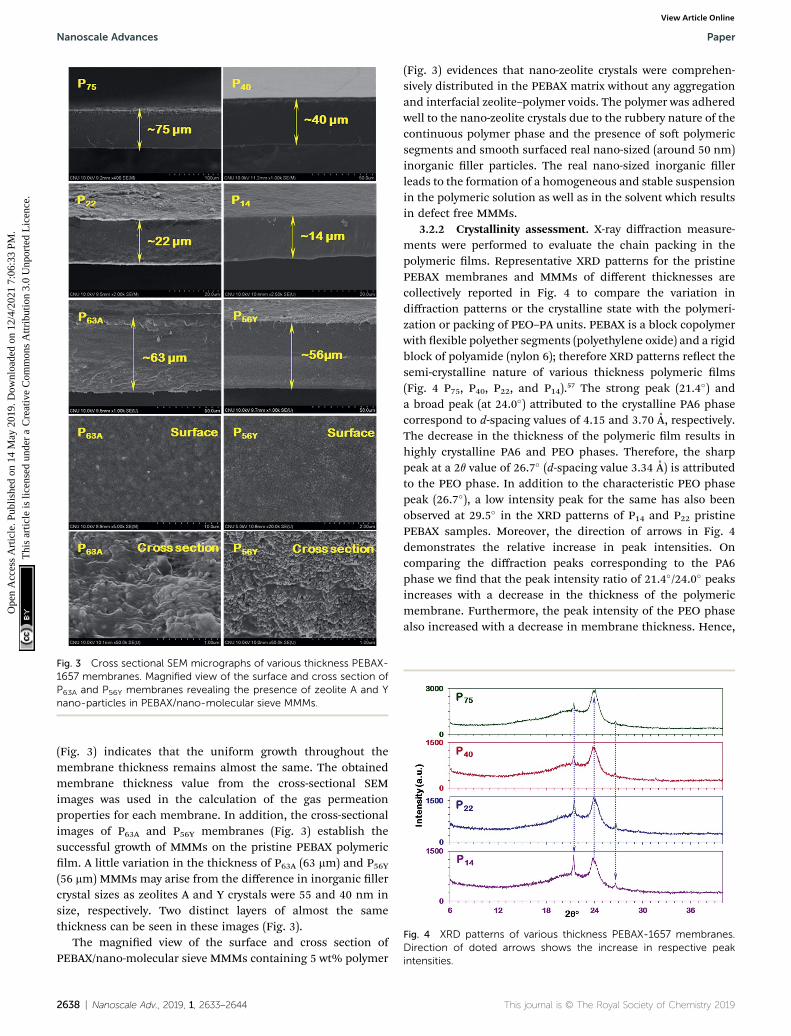
3.2.1 Morphology evaluation. The SEM analysis of pristinePEBAX and PEBAX/nano-molecular sieve MMMs has been per-formed to investigate the surface smoothness, distribution ofzeolite particles in the PEBAX polymer matrix, interfacialadhesion of the polymer and inorganic ller, accuratemeasurement of membrane thickness, etc. Photographiccamera images and surface SEM micrographs of themembranes are presented in Fig. S7 (ESI†), whereas cross-sectional SEM micrographs and magnied surface and cross-sectional views of the MMMs are reported in Fig. 3. Photo-graphic and surface SEM images display the clean and uniformgrowth of the pristine PEBAX membranes as well as MMMs. Inthe case of MMMs, the homogeneous distribution of nano-zeolite crystals of zeolites A and Y on the P63A and P56Ymembrane surfaces can easily be observed. Moreover, theseimages also demonstrate the absence of nano-crystal agglom-eration and interfacial void formation in the polymeric matrix.Furthermore, the cross-sectional SEM image of the membranes
Fig. 3 Cross sectional SEM micrographs of various thickness PEBAX-1657 membranes. Magnified view of the surface and cross section ofP63A and P56Y membranes revealing the presence of zeolite A and Ynano-particles in PEBAX/nano-molecular sieve MMMs.
Fig. 4 XRD patterns of various thickness PEBAX-1657 membranes.Direction of doted arrows shows the increase in respective peakintensities.
Nanoscale Advances Paper
Ope
n A
cces
s A
rtic
le. P
ublis
hed
on 1
4 M
ay 2
019.
Dow
nloa
ded
on 1
2/4/
2021
7:0
6:33
PM
. T
his
artic
le is
lice
nsed
und
er a
Cre
ativ
e C
omm
ons
Attr
ibut
ion
3.0
Unp
orte
d L
icen
ce.
View Article Online
(Fig. 3) indicates that the uniform growth throughout themembrane thickness remains almost the same. The obtainedmembrane thickness value from the cross-sectional SEMimages was used in the calculation of the gas permeationproperties for each membrane. In addition, the cross-sectionalimages of P63A and P56Y membranes (Fig. 3) establish thesuccessful growth of MMMs on the pristine PEBAX polymericlm. A little variation in the thickness of P63A (63 mm) and P56Y(56 mm) MMMs may arise from the difference in inorganic llercrystal sizes as zeolites A and Y crystals were 55 and 40 nm insize, respectively. Two distinct layers of almost the samethickness can be seen in these images (Fig. 3).
The magnied view of the surface and cross section ofPEBAX/nano-molecular sieve MMMs containing 5 wt% polymer
2638 | Nanoscale Adv., 2019, 1, 2633–2644
(Fig. 3) evidences that nano-zeolite crystals were comprehen-sively distributed in the PEBAX matrix without any aggregationand interfacial zeolite–polymer voids. The polymer was adheredwell to the nano-zeolite crystals due to the rubbery nature of thecontinuous polymer phase and the presence of so polymericsegments and smooth surfaced real nano-sized (around 50 nm)inorganic ller particles. The real nano-sized inorganic llerleads to the formation of a homogeneous and stable suspensionin the polymeric solution as well as in the solvent which resultsin defect free MMMs.
3.2.2 Crystallinity assessment. X-ray diffraction measure-ments were performed to evaluate the chain packing in thepolymeric lms. Representative XRD patterns for the pristinePEBAX membranes and MMMs of different thicknesses arecollectively reported in Fig. 4 to compare the variation indiffraction patterns or the crystalline state with the polymeri-zation or packing of PEO–PA units. PEBAX is a block copolymerwith exible polyether segments (polyethylene oxide) and a rigidblock of polyamide (nylon 6); therefore XRD patterns reect thesemi-crystalline nature of various thickness polymeric lms(Fig. 4 P75, P40, P22, and P14).57 The strong peak (21.4�) anda broad peak (at 24.0�) attributed to the crystalline PA6 phasecorrespond to d-spacing values of 4.15 and 3.70 A, respectively.The decrease in the thickness of the polymeric lm results inhighly crystalline PA6 and PEO phases. Therefore, the sharppeak at a 2q value of 26.7� (d-spacing value 3.34 A) is attributedto the PEO phase. In addition to the characteristic PEO phasepeak (26.7�), a low intensity peak for the same has also beenobserved at 29.5� in the XRD patterns of P14 and P22 pristinePEBAX samples. Moreover, the direction of arrows in Fig. 4demonstrates the relative increase in peak intensities. Oncomparing the diffraction peaks corresponding to the PA6phase we nd that the peak intensity ratio of 21.4�/24.0� peaksincreases with a decrease in the thickness of the polymericmembrane. Furthermore, the peak intensity of the PEO phasealso increased with a decrease in membrane thickness. Hence,
Fig. 5 Raman spectra of different thickness PEBAX membranes.
Paper Nanoscale Advances
Ope
n A
cces
s A
rtic
le. P
ublis
hed
on 1
4 M
ay 2
019.
Dow
nloa
ded
on 1
2/4/
2021
7:0
6:33
PM
. T
his
artic
le is
lice
nsed
und
er a
Cre
ativ
e C
omm
ons
Attr
ibut
ion
3.0
Unp
orte
d L
icen
ce.
View Article Online
these diffraction patterns affirm that low thickness PEBAXmembranes have better polymeric chain arrangement andcrystallinity in comparison to thick membranes. It has beenreported that nylon 6 (PA6) has two different crystalline struc-tures, i.e., a, and g-forms. The molecules in the a crystal exhibita fully extended, planar zigzag chain conrmation which isa thermodynamically stable structure and is well formed underslow crystallization while those in the g-form crystal forma helical, metastable structure favored by rapid crystalliza-tion.58,59 Thus, these shis in the diffraction peak intensity(Fig. 4) may be attributed to the chain packing in the copolymerlms. Moreover, it is possible that the drying duration (2 days at40 �C) is not sufficient for P40 and P75 membrane samples to drycompletely under closed or controlled evaporation conditions.Therefore, understanding and controlling the crystal structuresof polymers are pursued to gain insights into their mechanicalproperties and chain alignment.
To conrm the above ndings, a comparison of XRD resultswith literature reported studies has been performed. Oncomparing Fig. 4 and S8, ESI,† we found that the as-fabricatedmembranes have distinct peaks for PA6 and PEO crystallinephases whereas in earlier reported studies no such distinctionhas been made. Most of the diffraction patterns in Fig. S8, ESI†show a broad peak ranging from 15–25� with a shoulder orsmall intensity peak, which implies the irregular packing of thepolymer chains. The XRD patterns also evidence the formationof a metastable, helical g-form type (PA6) structure in thesePEBAX membranes. Moreover, these diffraction patterns(Fig. S8, ESI†) display a remarkably lower degree of crystallinityin comparison with P14, P22, P40, and P75 membranes (Fig. 4).
3.2.3 Thermal analysis. According to the TGA results(Fig. S9a, ESI†), the thermal weight loss proles for differentthickness pristine PEBAX membranes follow the same trendand the pyrolysis of the membranes occurs between 350 and450 �C which is in accordance with earlier reports.32,60,61 Thisdeterioration of polymeric membranes is mainly associatedwith the decomposition reaction of the polymer precursors.
Furthermore, to evaluate the thermal properties, polymericchain rigidity, crystallization tendency, Tg and Tm (meltingtemperature) of polymers/segments, DSC analyses were per-formed. As reported in Fig. S9b (ESI†), the typical peaks of PEOand PA6 crystalline phases establish the semi-crystalline andphase separation characteristics of PEBAX membranes.38 In thecase of the PEO segment, a small variation in the melting peakcan be noticed. The area of the Tm PEO peak decreases with anincrease in the membrane thickness whereas an increase inmelting temperature has been observed which depicts thechange in the crystallinity of the PEO segment. Moreover,a decrease in Tg values from �52.3 �C to �54.0 with a decreasein membrane thickness indicates the polymeric chain mobilityand much regular arrangement. Furthermore, the Tg valuesreported in Fig. 5b for the PEO segment are much lower thanpreviously reported values for pristine PEBAX membranes,where Xin et al.,35 Li et al.,38 Wang et al.30 and Rahman et al.1
reported�50.4 �C,�51.6 �C,�51.4 �C, and�51.0 �C for pristinePEBAX 1657 membranes, respectively. In addition to variationin the DSC prole of the PEO segment with a change in
membrane thickness, a split in the Tm peak of the PA segmentfor the P75 membrane has also been observed which conrmsthe dual phase formation (a and g PA6) during P75 membranecrystallization. Therefore, DSC observation affirms the XRDanalysis ndings.
3.2.4 Chemical structure analysis. Vibrational spectros-copy, which is sensitive to the molecular conrmation ofpolymers, also demonstrated similar ndings to those ofXRD.59,62 As shown in Fig. 5, the spectrum of the high thicknessP75 membrane exhibits different peak positions and intensi-ties of characteristic peaks than that of the thin P14membrane, which implies a change in the polymeric chainconguration. Additionally, there are obvious differences inthe C–C stretching region (900–1150 cm�1) and the C–N–Hbending region (1300–1350 and 1440–1490 cm�1), and in theintensity of the amide regions (Fig. 5). The amide band at1632 cm�1 is primarily attributed to the CO stretch, whileanother amide mode is a combination of the C–N–H stretchingand the C]O in-plane bending of the amide group (–C(O)–NHC–). The C–C stretching region is composed of four primarypeaks, 1022, 1062, 1072 and 1127 cm�1. The 1062 and1127 cm�1 peaks are indicative of an all-trans C–C backboneconformation while the 1080 cm�1 peak is attributed to thepresence of gauche bonds in the polymeric lm. The C–N–Hbending region of the Raman spectrum is also sensitive to theconformation (planar or nonplanar) of the amide group.Bands observed in the regions of 1270–1350 and 1440–1490 cm�1 are indicative of different amide conformations.Furthermore, the disappearance or decrease in the intensity ofthe 1465 cm�1 peak in the spectrum of the P14 membraneevidences the change in the conformation of the polymer. If wego by the explanation given by Giller et al.59 and Stephenset al.63 for PA6, then we can also expect more than one ener-getically favorable crystalline structure (and/or chain confor-mations) in PEBAX membranes.
Fig. 6 Two different classes of crystal structures formulated with different polymeric chain packing schemes in nylon 6. Schematic repre-sentation of PEBAX polymerization, and hydrogen bonding among polymeric chains leads to a stable polymeric configuration, high crystallinityand enhanced FFV.
Fig. 7 FTIR spectra of P14, P22, P40 and P75 PEBAX membranes. Insetspectra represent the variation in vibrational peaks in the range of
Nanoscale Advances Paper
Ope
n A
cces
s A
rtic
le. P
ublis
hed
on 1
4 M
ay 2
019.
Dow
nloa
ded
on 1
2/4/
2021
7:0
6:33
PM
. T
his
artic
le is
lice
nsed
und
er a
Cre
ativ
e C
omm
ons
Attr
ibut
ion
3.0
Unp
orte
d L
icen
ce.
View Article Online
Furthermore, nylon 6 is an important constituent of the PEBAXpolymer and it impartsmechanical strength to PEBAXmembranes.The –NH(CH2)5(CO)– repeating groups lead to a structure in whichthe peptide units (NH–CO) provide hydrogen bonding betweenpolymer chains. Although nylon is crystalline, the presence of thecrystalline lamella in an amorphous matrix makes it difficult toobtain precise crystallography.64 It has been well documented thatnylon 6 exists in mainly two forms of regular crystal structures:a form (with amide bonds parallel to the methylene sheets) and g
form (with amide bonds perpendicular to themethylene sheets), asshown in Fig. 6.58,59,64–66 Out of these two forms, the a form isconsidered to be more stable than the g form. If we go by thesereported ndings for nylon 6, then we can expect that the as-fabricated membranes have a different polymer conformationthan that in earlier published reports. Thus, the polymeric chainsin the crystalline zone of PEBAXmay favor bonding among chains,and the nature of these folds affects the optimum chain spacing,chain structure/conguration, and connection between them. Insimple words, the conformation of the PEBAX membrane hasa high inuence on its single gas permeation performance.
FTIR spectroscopy was used to explore the polymer confor-mation and interfacial interaction between the polymericchains in the as-fabricated high permeability PEBAXmembranes. Fig. 7 shows the FTIR spectra of the differentthickness PEBAX membranes. The inset image in each spec-trum reveals that there is a considerable difference between thevibrational peaks of low thickness and high thicknessmembranes (Fig. 7). A close look at the inset image in Fig. 7 P14reveals a strong peak at 1461 cm�1 but with the increase in thethickness of the polymeric membrane in the P44 membranesample, a shoulder appears which further changes to a lowintensity peak (1440 cm�1) in the P75 sample. On the other
2640 | Nanoscale Adv., 2019, 1, 2633–2644
hand, the 1275 cm�1 peak in P14 and P22 polymer lms dis-appeared in P40 and P75 membranes which indicates a changein the polymeric chain arrangement with an increase in thethickness of the membrane. In addition to the disappearance ofthe 1275 cm�1 peak in the P75 membrane spectrum, a shi in
the peak position (to 1245 cm�1), peak broadening andappearance of weak shoulder peaks have also been noticed.Moreover, vibrational peak patterns, especially in the 1200–1500 cm�1 wave number region of the as-fabricated PEBAXmembranes, are unquestionably different from the spectra re-ported byMurali et al.,26Wang et al.,30 Xiang et al.32 and Li et al.38
The appearance and disappearance of vibrational peaks in the1200–1500 cm�1 wave number region demonstrate trans-formation in the polymer chain conformation and interfacialinteractions as highlighted in Fig. 7.58,67 The interactionbetween the two different classes of crystal structures formu-lated with different polymeric chain packing schemes in nylon 6can also be considered as a crucial factor for a stable polymericchain conguration in PEBAX membranes. The FTIR spectrumof the P75 membrane also shows some change in the intensitiesand position shi of the symmetric stretching vibration peak ofthe –CH3 group highlighted by a dotted circle. Furthermore, thespectra reported in Fig. 7 reveal an unequivocally better poly-meric chain arrangement and chemical structure than earlierreported spectra for pristine PEBAX 1657 membranes.26,32 Thesharp and strong bands at 1732 and 1636 cm�1 represent C]Ostretching vibration in the two types of amide groups, whereas1541 cm�1 peaks correspond to N–H deformation of the PA6segment.38 For the pristine PEBAXmembrane, the characteristicpeak at 1096 cm�1 is mainly attributed to the C–O stretchingvibration of the PEO segment. As reported by Zheng and Xu,67
Ruiz-Hitzky and Aranda,68,69 and Papke et al.,70 the peaks at 949and 848 cm�1 assigned to the CH2 rocking vibration of methy-lene groups in a gauche conformation indicate the possiblehelical structure of the PEO segment in the PEBAX membrane.From the Raman and FTIR spectra discussion, we can concludethat the polymer chain conformation, hydrogen bonding andinteraction between polymeric chains play decisive roles in thefree space and polymeric membrane performance.
3.2.5 Free volume assessment. Free volume is useful forexplaining the different aspects of polymers such as polymericchain arrangements, mobility, and permeability but at the sametime, it is relatively difficult to estimate with full accuracy. In thePEBAX membrane the PEO component mainly selectivelyinteracts with polar gases such as CO2 to have high solubilityselectivity towards polar gases. Ideally, based on the solution–diffusion model for dense membranes, the solubility selectivitydue to the PEO segment should enhance the CO2 permeability ifthe diffusivity component PA6 is arranged well and notadversely affected by the PEO segment.18 As XRD and DSCstudies affirmed the regular arrangement of the polymericchain and high crystallinity PEBAX membrane formation, itbecomes essential to evaluate the FFV and SFV. The FFV andSFV of pristine PEBAX membranes were estimated based on thegroup contribution method coupled with density measure-ments and the results are listed in Table 2. As shown, the FFVvalues of PEBAX membranes increase with a decrease in themembrane thickness which is favorable for enhancing thepermeability.38 The P14 membrane of 14 mm thickness has thehighest value of FFV as well as SFV. The obtained FFV valuesbased onmembrane density data are in good agreement with Tgvalues and crystalline character, as obtained from DSC and XRD
results. In these terms, it seems clear that the glass transitiontemperature and the fraction of free volume have a distinctcorrelation. Virtually in the case of rubbery polymers, the FFVincreases with decreasing Tg.71 These observations indicate thatthe planar polymeric chain conformation with a stable poly-meric structure formed under slow crystallization generatesinter-chain spacing which results in signicantly high FFVPEBAX membranes. The as-fabricated PEBAX membranes notonly show a better polymeric structure but also have a highvalue of FFV in comparison to earlier reports.16,38
3.3 Single gas permeation performance assessment
3.3.1 Gas permeability of pristine PEBAX membranes andMMMs. The single gas permeation performance of polymericmembranes and MMMs was measured by a single gas perme-ation test of CO2, N2, O2, and CH4. The polymeric membraneswere different thickness PEBAX membranes whose thicknessvaries from 14–75 mm, and the MMMs were the polymericmembranes with 5 wt% zeolite nanoparticles (zeolites A and Y).The CO2, N2, O2, and CH4 permeability and their intrinsicselectivity for PEBAX and MMMs have been presented in Table3. The tabulated values of permeability and permselectivitydemonstrate a distinct relationship between CO2 permeabilityand the thickness of the membrane. It can be noticed that thehigh thickness PEBAX membrane (P75) displays a low value ofpermeability while the thin P14 membrane shows exceptionallyhigh CO2 permeability. As can be seen in Table 3, the decreaseof membrane thickness increases the permeability of CO2 whilethe permeability values of the other gases vary slightly. Conse-quentially, the ideal permeation selectivity values for CO2/N2,CO2/O2, and CO2/CH4 were increased with decreasingmembrane thickness and stable PEBAX lm formation. As thereis a direct relationship between gas permeability and FFV, theincrease of CO2 permeability and selectivity over the other gasescan be attributed to increases in FFV. The increased selectivitycan also be attributed to change in chain stiffness withmembrane thickness variation. Unfortunately, the loading ofzeolites A and Y onto PEBAXmembranes shows a negative effecton membrane selectivity. In the case of MMMs (P56Y), anincrease in gas permeation was observed for all the gases whichresults in low CO2 permselectivity. However, selectivity valuesare comparable with those of the pristine PEBAX P75membrane.
In order to obtain further insight into the role of theimproved characteristics of the membrane in slow solventevaporation and reduced thickness in gas permeation, the
diffusivity and solubility data of the membranes were alsomeasured using the time lag method. As shown in Table S2(ESI†), the diffusion coefficient for CO2 gas increases for pris-tine PEBAX membranes as the thickness decreases. The diffu-sion coefficient of CO2 increases from nearly 1.2 � 10�6 cm2 s�1
for P75 to 2.6� 10�6 cm2 s�1 for P14 pristine PEBAXmembranes.The increase of FFV in both PEO and PA6 segments of pristinePEBAX membranes results in an enormous increase in CO2
diffusivity.30 Car et al.72 reported a CO2 diffusion coefficient of4.6 � 10�7 cm2 s�1 at 30 �C and 600 mbar feed pressure. Kimet al.73 determined a CO2 diffusion coefficient of 1.52 � 10�6
cm2 s�1 by using a continuous ow technique at 25 �C and 3atmosphere feed pressure. Furthermore, Wang et al.,30 Xinet al.35 and Reijerkerk et al.36 reported CO2 diffusion coefficientsof 1.35 � 10�6 cm2 s�1, 1.43 � 10�6 cm2 s�1 and 7.9 � 10�7 cm2
s�1 for pristine PEBAX membranes, respectively. Thesecomparative diffusivity results illustrated that the as-fabricatedPEBAX membranes have a higher specic volume of the poly-mer in comparison to other reported pristine PEBAXmembranes.
3.3.2 Comparison with other pristine PEBAX membranesand PEBAX based MMMs. The CO2 gas permeation perfor-mance of the as-fabricated pristine PEBAX membranes wascompared. The CO2 gas permeation performance of somerepresentative pristine PEBAX, as well as PEBAX, based MMMsis compiled in Table S3 (ESI†) with detailed experimentalconditions. Table S3 (ESI†) substantiates that the permeabilityas well as the selectivity of the as-fabricated pristine PEBAXmembrane for CO2 and N2 separation is not only higher thanthat of literature reported pristine PEBAX membranes but alsohigher than that of MMMs. These results also show that wefabricated a high performance membrane without using anyinorganic ller and with very low polymer concentration (2.5%).Furthermore, the thickness of the as-fabricated membrane (14mm) is much lower than that of the other reported membranes.The enhanced selectivity of the as-fabricated pristine PEBAXmembrane approves the high FFV and better polymerization ofthe polymeric lm.74 The gas permeability for PEBAX basedmixed matrix membranes reveals that addition of inorganicllers to the polymeric lm does not always boost themembrane performance. Furthermore, they also may havea negative effect on the adhesion of the polymer on the surfaceof the llers which generates structural defects in themembrane. Furthermore, the addition of inorganic llers some
2642 | Nanoscale Adv., 2019, 1, 2633–2644
time induces polymeric chain destruction, active functionalgroup blockage, etc.
4. Conclusions
Nanostructure zeolite molecular sieves (zeolites A and Y) weresynthesized for MMM fabrication. Pristine PEBAX membranesof different thicknesses have been fabricated and their singlegas permeation performance, polymeric conformation, andchemical structure have been evaluated extensively. Thediffraction, thermal and spectroscopic studies assert thatsolvent evaporation kinetics plays a signicant role in theobserved polymeric conformation. Moreover, during evapora-tion, the polymeric lm remains in contact with the vapor ofthe solvent which signicantly affects the crystal structure ofthe resultant polymer. The single gas permeation resultsdemonstrate the high potential of the reported polymericstructure optimization concept to signicantly enhance thegas permeability. The optimal 14 mm thickness P14 membranewith high FFV shows very high CO2 permeability (184.7 Barrer)as well as CO2/N2 selectivity (59.7) at 2.7 bar and 25 �C. Thispaper also demonstrates that the permeability, as well as CO2
selectivity, can be improved by just reforming the polymericstructure without using any inorganic llers and surfactants. Itreveals that the permeability and selectivity improvement ismainly attributed to changes in the polymer conformation andtotal free volume. Thus, by improving the polymeric structureof PEBAX as well as by reforming the free-volume in themembrane, pristine PEBAX lms can absorb CO2 moleculesmore favorably than N2 molecules. The pristine PEBAXmembranes reported in this paper show even better perfor-mance than PEBAX based MMMs which encourages us tocheck the possibilities to fabricate high quality and greaterCO2 separation performance membranes.
Conflicts of interest
There are no conicts to declare.
Acknowledgements
This work was supported by the Korean CCS R&D Center (KCRC)funded by the Ministry of Science and ICT, Repulic of Korea(Grant No. 2014M1A8A1049310).
1 M. M. Rahman, S. Shishatskiy, C. Abetz, P. Georgopanos,S. Neumann, M. M. Khan, V. Filiz and V. Abetz, J. Membr.Sci., 2014, 469, 344–354.
2 F. M. Enujekwu, C. I. Ezeh, M. W. George, M. Xu, H. Do,Y. Zhang, H. Zhao and T. Wu, Nanoscale Adv., 2019, 1,1442–1451.
3 V. Zelenak, M. Skrınska, A. Zukal and J. Cejka, Chem. Eng. J.,2018, 348, 327–337.
4 Z. Dai, J. Deng, L. Ansaloni, S. Janakiram and L. Deng, J.Membr. Sci., 2019, 578, 61–68.
5 D. Zhao, X.-H. Liu, J.-H. Guo, H.-J. Xu, Y. Zhao, Y. Lu andW.-Y. Sun, Inorg. Chem., 2018, 57, 2695–2704.
6 M. Shan, B. Seoane, A. Pustovarenko, X. Wang, X. Liu,I. Yarulina, E. Abou-Hamad, F. Kapteijn and J. Gascon, J.Membr. Sci., 2018, 566, 213–222.
7 E. Knapik, P. Kosowski and J. Stopa, Chem. Eng. Res. Des.,2018, 131, 66–79.
8 J. G. Vitillo, B. Smit and L. Gagliardi, Chem. Rev., 2017, 117,9521–9523.
9 A. Villarreal, G. Garbarino, P. Riani, E. Finocchio, B. Bosio,J. Ramırez and G. Busca, J. CO2 Util., 2017, 19, 266–275.
10 Y. Lv, X. Yu, J. Jia, S. T. Tu, J. Yan and E. Dahlquist, Appl.Energy, 2012, 90, 167–174.
11 O. Ovalle-Encinia, H. Pfeiffer and J. Ortiz-Landeros, Ind. Eng.Chem. Res., 2018, 57, 9261–9268.
12 X. Zhu, Y. Hua, C. Tian, C. W. Abney, P. Zhang, T. Jin, G. Liu,K. L. Browning, R. L. Sacci, G. M. Veith, H.-C. Zhou, W. Jinand S. Dai, Angew. Chem., Int. Ed., 2018, 57, 2816–2821.
13 N. Du, H. B. Park, G. P. Robertson, M. M. Dal-Cin, T. Visser,L. Scoles and M. D. Guiver, Nat. Mater., 2011, 10, 372–375.
14 L. M. Robeson, J. Membr. Sci., 2008, 320, 390–400.15 T. C. Merkel, B. D. Freeman, R. J. Spontak, Z. He, I. Pinnau,
P. Meakin and A. J. Hill, Science, 2002, 296, 519–522.16 Y. Li, S. Wang, H. Wu, J. Wang and Z. Jiang, J. Mater. Chem.,
2012, 22, 19617–19620.17 G. Dong, H. Li and V. Chen, J. Mater. Chem. A, 2013, 1, 4610–
4630.18 S. Luo, K. A. Stevens, J. S. Park, J. D. Moon, Q. Liu,
B. D. Freeman and R. Guo, ACS Appl. Mater. Interfaces,2016, 8, 2306–2317.
19 H. W. Kim, H. W. Yoon, S. Yoon, B. M. Yoo, B. K. Ahn,Y. H. Cho, H. J. Shin, H. Yang, U. Paik, S. Kwon, J.-Y. Choiand H. B. Park, Science, 2013, 342, 91–95.
20 L. Cao, K. Tao, A. Huang, C. Kong and L. Chen, Chem.Commun., 2013, 49, 8513–8515.
21 M. Karunakaran, R. Shevate, M. Kumar andK. V. Peinemann, Chem. Commun., 2015, 51, 14187–14190.
22 M. A. Aroon, A. F. Ismail, T. Matsuura and M. M. Montazer-Rahmati, Sep. Purif. Technol., 2010, 75, 229–242.
23 V. Nasi and M. B. Hagg, ACS Appl. Mater. Interfaces, 2014, 6,15643–15652.
24 Y. Li, Q. Xin, H. Wu, R. Guo, Z. Tian, Y. Liu, S. Wang, G. He,F. Pan and Z. Jiang, Energy Environ. Sci., 2014, 7, 1489–1499.
25 Y. Wang, H. Li, G. Dong, C. Scholes and V. Chen, Ind. Eng.Chem. Res., 2015, 54, 7273–7283.
26 R. Surya Murali, S. Sridhar, T. Sankarshana andY. V. L. Ravikumar, Ind. Eng. Chem. Res., 2010, 49, 6530–6538.
27 B. Yu, H. Cong, Z. Li, J. Tang and X. S. Zhao, J. Appl. Polym.Sci., 2013, 130, 2867–2876.
28 T. Li, Y. Pan, K. V. Peinemann and Z. Lai, J. Membr. Sci., 2013,425–426, 235–242.
29 R. Surya Murali, A. F. Ismail, M. A. Rahman and S. Sridhar,Sep. Purif. Technol., 2014, 129, 1–8.
30 S. Wang, Y. Liu, S. Huang, H. Wu, Y. Li, Z. Tian and Z. Jiang,J. Membr. Sci., 2014, 460, 62–70.
31 P. Dutta, Y. Chen, B. Wang, L. Zhao and W. S. Winston Ho, J.Membr. Sci., 2015, 495, 415–423.
32 L. Xiang, Y. Pan, G. Zeng, J. Jiang, J. Chen and C. Wang, J.Membr. Sci., 2016, 500, 66–75.
33 A. Ghadimi, T. Mohammadi and N. Kasiri, Ind. Eng. Chem.Res., 2014, 53, 17476–17486.
34 P. Bernardo, J. C. Jansen, F. Bazzarelli, F. Tasselli, A. Fuoco,K. Friess, P. Izak, V. Jarmarova, M. Kacırkova and G. Clarizia,Sep. Purif. Technol., 2012, 97, 73–82.
35 Q. Xin, Y. Zhang, T. Huo, H. Ye, X. Ding, L. Lin, Y. Zhang,H. Wu and Z. Jiang, J. Membr. Sci., 2016, 508, 84–93.
36 S. R. Reijerkerk, M. H. Knoef, K. Nijmeijer and M. Wessling,J. Membr. Sci., 2010, 352, 126–135.
37 M. Aghajani, A. Kargari, E. Ahmadpour, A. A. Shamsabadiand R. M. Behbahani, J. Nat. Gas Sci. Eng., 2014, 21, 518–523.
38 Y. Li, X. Li, H. Wu, Q. Xin, S. Wang, Y. Liu, Z. Tian, T. Zhou,Z. Jiang, H. Tian, X. Cao and B. Wang, J. Membr. Sci., 2015,493, 460–469.
39 C. Nagel, K. Gunther-Schade, D. Fritsch, T. Strunskus andF. Faupel, Macromolecules, 2002, 35, 2071–2077.
40 N. Petzetakis, C. M. Doherty, A. W. Thornton, X. C. Chen,P. Cotanda, A. J. Hill and N. P. Balsara, Nat. Commun.,2015, 6, 7529.
41 N. R. Horn, J. Membr. Sci., 2016, 518, 289–294.42 P. M. Budd, N. B. McKeown and D. Fritsch, J. Mater. Chem.,
2005, 15, 1977–1986.43 J. R.Wiegand, Z. P. Smith, Q. Liu, C. T. Patterson, B. D. Freeman
and R. Guo, J. Mater. Chem. A, 2014, 2, 13309–13320.44 S. Tan, Q. Fu, J. M. P. Scoeld, J. Kim, P. A. Gurr, K. Ladewig,
A. Blencowe and G. G. Qiao, J. Mater. Chem. A, 2015, 3,14876–14886.
45 J. Y. Park and D. R. Paul, J. Membr. Sci., 1997, 125, 23–39.46 Q. Song, S. Cao, R. H. Pritchard, B. Ghalei, S. A. Al-Muhtaseb,
E. M. Terentjev, A. K. Cheetham and E. Sivaniah, Nat.Commun., 2014, 5, 1–12.
47 K. Y. Huang, C. L. Shiu, Y. A. Su, C. C. Yang, J. M. Yeh, Y. Weiand K. R. Lee, J. Membr. Sci., 2009, 339, 171–176.
48 P. D. Sutrisna, J. Hou, M. Y. Zulkii, H. Li, Y. Zhang,W. Liang, D. M. D'Alessandro and V. Chen, J. Mater. Chem.A, 2018, 6, 918–931.
49 Y. Wang, T. Hu, H. Li, G. Dong, W.Wong and V. Chen, EnergyProcedia, 2014, 63, 202–209.
50 E. Esposito, G. Clarizia, P. Bernardo, J. C. Jansen,Z. Sedlakova, P. Izak, S. Curcio, B. de Cindio andF. Tasselli, Chem. Eng. Process., 2015, 94, 53–61.
51 P. Li, Z. Wang, W. Li, Y. Liu, J. Wang and S. Wang, ACS Appl.Mater. Interfaces, 2015, 7, 15481–15493.
52 L. Liu, A. Chakma and X. Feng, Chem. Eng. J., 2004, 105, 43–51.
53 J. Sanchez-Laınez, I. Gracia-Guillen, B. Zornoza, C. Tellezand J. Coronas, New J. Chem., 2019, 43, 312–319.
54 J. C. Jansen, K. Friess and E. Drioli, J. Membr. Sci., 2011, 367,141–151.
55 P. Sharma, J. G. Yeo, M. H. Han and C. H. Cho, RSC Adv.,2012, 2, 7809–7823.
56 B. A. Holmberg, H. Wang, J. M. Norbeck and Y. Yan,Microporous Mesoporous Mater., 2003, 59, 13–28.
57 S. A. Habibiannejad, A. Aroujalian and A. Raisi, RSC Adv.,2016, 6, 79563–79577.
58 D. Cho, E. Zhmayev and Y. L. Joo, Polymer, 2011, 52, 4600–4609.
59 C. B. Giller, D. B. Chase, J. F. Rabolt and C. M. Snively,Polymer, 2010, 51, 4225–4230.
60 Y. Shao, H. Chen, Y. Li and X. Ma, Chem. Eng. J., 2015, 276,51–58.
61 A. Tena, S. Shishatskiy and V. Filiz, RSC Adv., 2015, 5, 22310–22318.
62 S. Garreau, M. Leclerc, N. Errien and G. Louarn,Macromolecules, 2003, 36, 692–697.
2644 | Nanoscale Adv., 2019, 1, 2633–2644
63 J. S. Stephens, D. B. Chase and J. F. Rabolt, Macromolecules,2004, 37, 877–881.
64 Y. Li and W. A. Goddard, Macromolecules, 2002, 35, 8440–8455.
65 D. R. Holmes, C. W. Bunn and D. J. Smith, J. Polym. Sci.,1955, XVII, 159–177.
66 H. Arimoto, J. Polym. Sci., Part A: Gen. Pap., 2003, 2, 2283–2295.
67 X. Zheng and Q. Xu, J. Phys. Chem. B, 2010, 114, 9435–9444.68 E. Ruiz-Hitzky and P. Aranda, Adv. Mater., 1990, 2, 545–547.69 P. Aranda and E. Ruiz-Hitzky, Chem. Mater., 1992, 4, 1395–
1403.70 B. L. Papke, M. A. Ratner and D. F. Shriver, J. Phys. Chem.
Solids, 1981, 42, 493–500.71 R. Recio, A. E. Lozano, P. Pradanos, A. Marcos, F. Tejerina
and A. Hernandez, J. Appl. Polym. Sci., 2008, 107, 1039–1046.72 A. Car, C. Stropnik, W. Yave and K. V. Peinemann, J. Membr.
Sci., 2008, 307, 88–95.73 J. H. Kim, S. Y. Ha and Y. M. Lee, J. Membr. Sci., 2001, 190,
179–193.74 M. Carta, R. Malpass-Evans, M. Croad, Y. Rogan, J. C. Jansen,
P. Bernardo, F. Bazzarelli and N. B. McKeown, Science, 2013,339, 303–307.