Shoreline habitat assessment methods July 30, 2014 1 A Standard Assessment Protocol for Assessing the Habitat Quality of Ecologically Enhanced Urban Shorelines. Reid, D. J. and Bone, E.K. Methods Shoreline sites A thorough search was done to identify appropriate sites to allow a broad spatial coverage of representative shoreline types that presently exist within the New York–New Jersey Harbor. That search involved examination of aerial maps of the shorelines around the entire Harbor, visual assessments of shorelines during circumnavigation of Manhattan and travel from Governors Island to the north-western shoreline of Staten Island by boat, and ground-truthing of a selected suite of sites. Ground-truthing was carried out to ensure that chosen shorelines were accessible by land and were suitable for the deployment of sampling devices. The dominant hardened shoreline types were found to be concrete seawall and riprap revetment. There was also some shoreline built from large stone bricks and small stretches of gabion baskets, but there is inadequate coverage across the Harbor to allow replication of these shoreline designs across a broad geographic area. During this study, site clusters will be used to ensure that most environmental conditions are as similar as possible between pairs of shorelines differing in habitat complexity. The subset of site clusters that will be used in this study are Harlem River Park (Manhattan), southern end of Randalls Island (Manhattan) and Astoria (Queens), West Harlem Piers (Manhattan), Brooklyn Bridge Park (Brooklyn), Liberty State Park and Ellis Island (New Jersey) and Fort Wadsworth (Staten Island) (Figure 1). The main focus of the study will be determining whether the methods are readily repeatable across sites and produce ecologically meaningful data that can aid in distinguishing the relative habitat value of the most common ecologically-enhanced and traditional urban shoreline stabilization types in the New York–New Jersey Harbor, and therefore will be suitable for use in a habitat assessment protocol across the region. All clusters include a riprap site with enhanced structural complexity paired with a seawall site with minimal structural complexity, which will be used as a control. To examine whether the survey methods are applicable to other shoreline designs, also included are a gabion basket site at Harlem River Park and a stone brick site at Randall’s Island. Sites within clusters were no further than 1 km apart at their closest points. Each shoreline site is 100 m in length.
Transcript
Shoreline habitat assessment methods July 30, 2014
1
A Standard Assessment Protocol for Assessing the Habitat Quality of Ecologically Enhanced Urban
Shorelines.
Reid, D. J. and Bone, E.K.
Methods
Shoreline sites
A thorough search was done to identify appropriate sites to allow a broad spatial coverage of
representative shoreline types that presently exist within the New York–New Jersey Harbor. That search
involved examination of aerial maps of the shorelines around the entire Harbor, visual assessments of
shorelines during circumnavigation of Manhattan and travel from Governors Island to the north-western
shoreline of Staten Island by boat, and ground-truthing of a selected suite of sites. Ground-truthing was
carried out to ensure that chosen shorelines were accessible by land and were suitable for the deployment
of sampling devices. The dominant hardened shoreline types were found to be concrete seawall and riprap
revetment. There was also some shoreline built from large stone bricks and small stretches of gabion
baskets, but there is inadequate coverage across the Harbor to allow replication of these shoreline designs
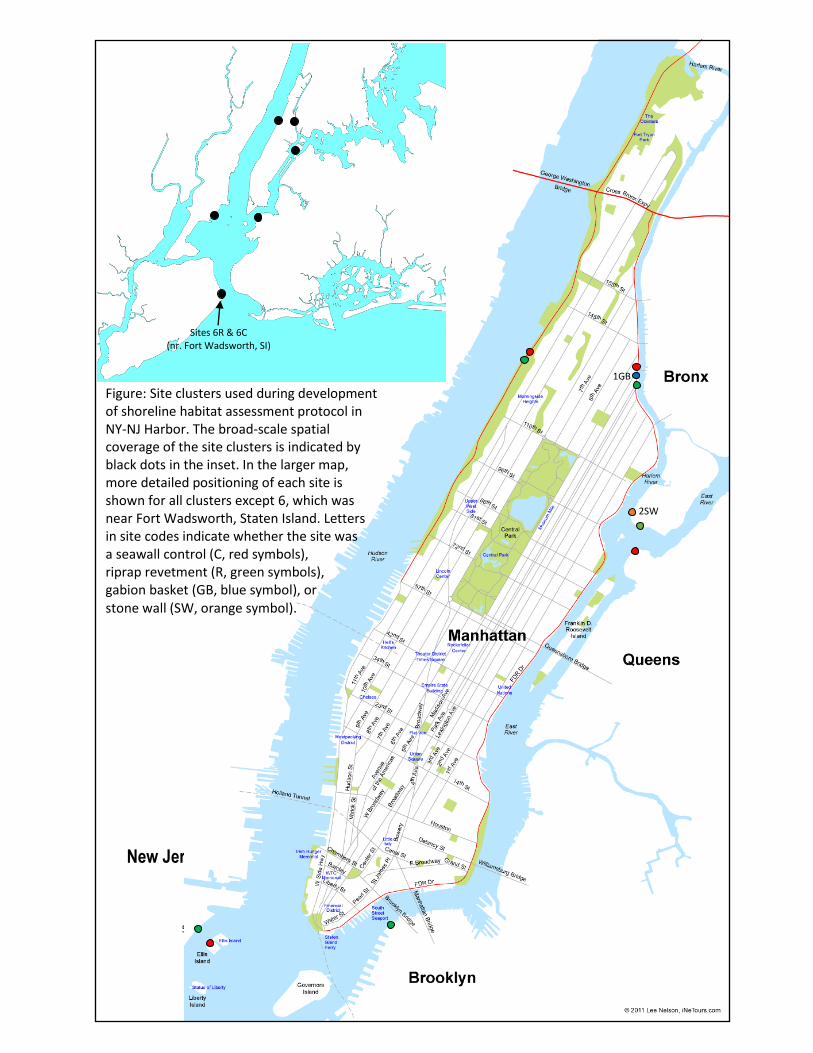
across a broad geographic area. During this study, site clusters will be used to ensure that most
environmental conditions are as similar as possible between pairs of shorelines differing in habitat
complexity. The subset of site clusters that will be used in this study are Harlem River Park (Manhattan),
southern end of Randalls Island (Manhattan) and Astoria (Queens), West Harlem Piers (Manhattan),
Brooklyn Bridge Park (Brooklyn), Liberty State Park and Ellis Island (New Jersey) and Fort Wadsworth
(Staten Island) (Figure 1).
The main focus of the study will be determining whether the methods are readily repeatable
across sites and produce ecologically meaningful data that can aid in distinguishing the relative habitat
value of the most common ecologically-enhanced and traditional urban shoreline stabilization types in the
New York–New Jersey Harbor, and therefore will be suitable for use in a habitat assessment protocol
across the region. All clusters include a riprap site with enhanced structural complexity paired with a
seawall site with minimal structural complexity, which will be used as a control. To examine whether the
survey methods are applicable to other shoreline designs, also included are a gabion basket site at Harlem
River Park and a stone brick site at Randall’s Island. Sites within clusters were no further than 1 km apart
at their closest points. Each shoreline site is 100 m in length.
Shoreline habitat assessment methods July 30, 2014
2
To allow comparison amongst a broad range of different shoreline types, it is important that
standardized measurements can be obtained regardless of differences in physical habitat structure. A
novel approach will be required that is customized to sampling on stable, near vertical shorelines, which
differ from the habitat where most estuarine surveys are conducted. Given that surveys involving entry
into the water along near vertical shorelines is hazardous, the methods are designed to minimize the need
for entry of personnel into the water, and to allow placement of sampling devices at precise depths.
Intertidal community assessment
Most past studies comparing the relative habitat value of engineered and natural shorelines have
been conducted in the intertidal zone (Table 1). However, preliminary visual assessments during site
ground-truthing indicated that there is relatively low diversity of fauna in the intertidal zone of riprap
revetment sites, compared to the diversity observed in past related studies. Further, the intertidal zone of
most vertical seawall shorelines is not easily accessible from the landward side and, where visible,
appears to support very low biotic diversity. Although this preliminary information suggest that it is
unlikely that intertidal communities will be useful for assessment of the relative habitat of the majority of
urbanized shorelines in the New York–New Jersey Harbor, more quantitative data will be collected from
a subset of sites. In June 2014, the intertidal community of riprap sites will be assessed within five
quadrats (250 × 250 mm) placed randomly across the midshore and five quadrats placed randomly across
the low shore, with the quadrats at each tidal level separated from each other by at least 5 m.
Mobile invertebrate community assessment
The main focus of the study will be developing a standard method for assessing the subtidal
communities on hard shorelines differing in structural habitat complexity. Sampling devices will allow
both sessile and mobile biota to colonize a standardized surface area of available habitat over a
standardized colonization period (Figure 2). To allow adequate time for all animals from the surrounding
shoreline to colonize the sampling devices, they will be deployed for eight weeks from early June to early
August, 2014. The settlement plates will be attached to a cage (Foxy-Mate® low profile crab trap, 10.5 ×
10.5 × 6”) which will be used to contain the netting and brick used for sampling mobile invertebrates. The
polyvinylchloride plastic (PVC) piping attached to the shoreward side of cages will provide stability
when the sampling devices are sitting against the shoreline, countering rotational forces of waves acting
to overturn submerged cages. Sampling devices will be deployed in the subtidal zone (so that the
sampling surfaces are at least 0.5 m below mean low tide mark: sensu Levinton et al. 2006), and will be
placed at each site during low spring tides to ensure that each device remains submerged. Five sampling
Shoreline habitat assessment methods July 30, 2014
3
devices will be used at each site. The positioning of replicate devices will be randomized across the 100
m long sites, with traps at least five meters apart.
A list of the mobile invertebrates likely to be present along hard shorelines was created based on
information in previous reports on the Hudson benthic fauna, such as those by Levinton et al. (2006) and
Pearce (1974). These mobile invertebrates will be sampled using sheets of plastic mesh netting (mesh size
of 4 × 4 mm, sheet dimensions of 750 × 2100 mm) that is bunched up and placed within cages, along with
a brick with ten circular holes (brick dimensions of 191 × 90 × 56 mm, hole diameters ~ 20 mm), to
provide structural habitat complexity. A pilot study showed that the plastic mesh facilitates the build-up
of detritus and sediment, which are anticipated to continue accumulating whilst devices are submerged.
This accumulation will potentially provide a range of habitats and organic food materials for the mobile
invertebrate species that colonize the devices from the surrounding shoreline.
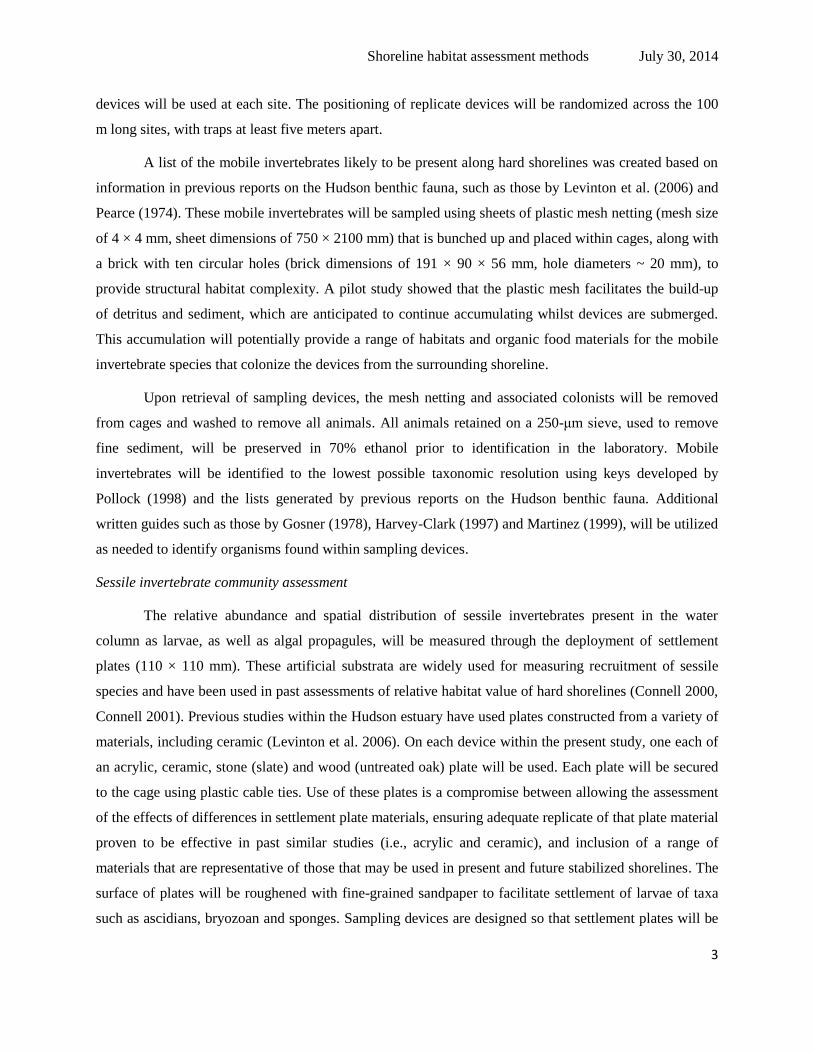
Upon retrieval of sampling devices, the mesh netting and associated colonists will be removed
from cages and washed to remove all animals. All animals retained on a 250-μm sieve, used to remove
fine sediment, will be preserved in 70% ethanol prior to identification in the laboratory. Mobile
invertebrates will be identified to the lowest possible taxonomic resolution using keys developed by
Pollock (1998) and the lists generated by previous reports on the Hudson benthic fauna. Additional
written guides such as those by Gosner (1978), Harvey-Clark (1997) and Martinez (1999), will be utilized
as needed to identify organisms found within sampling devices.
Sessile invertebrate community assessment
The relative abundance and spatial distribution of sessile invertebrates present in the water
column as larvae, as well as algal propagules, will be measured through the deployment of settlement
plates (110 × 110 mm). These artificial substrata are widely used for measuring recruitment of sessile
species and have been used in past assessments of relative habitat value of hard shorelines (Connell 2000,
Connell 2001). Previous studies within the Hudson estuary have used plates constructed from a variety of
materials, including ceramic (Levinton et al. 2006). On each device within the present study, one each of
an acrylic, ceramic, stone (slate) and wood (untreated oak) plate will be used. Each plate will be secured
to the cage using plastic cable ties. Use of these plates is a compromise between allowing the assessment
of the effects of differences in settlement plate materials, ensuring adequate replicate of that plate material
proven to be effective in past similar studies (i.e., acrylic and ceramic), and inclusion of a range of
materials that are representative of those that may be used in present and future stabilized shorelines. The
surface of plates will be roughened with fine-grained sandpaper to facilitate settlement of larvae of taxa
such as ascidians, bryozoan and sponges. Sampling devices are designed so that settlement plates will be
Shoreline habitat assessment methods July 30, 2014
4
oriented in the same plane as the shoreline. The steep gradient of the majority of engineered shorelines
within the New York – New Jersey Harbor will minimize smothering of organisms by fine sediment,
which can be particularly prevalent in some portions of the Harbor (Bokuniewicz 2006).
Upon retrieval of sampling devices, high resolution photographs will be taken with a digital
camera (Olympus TG-3, Olympus Imaging America Inc.) mounted on a forensic stand (Quadra-PodTM
)
positioned at a standardized distance from each settlement plate. Abundances of sessile organisms on
artificial hard substrata will be assessed using a count of 100 regularly spaced points across each
photograph taken of the plate surface (Glasby 1998; Knott et al. 2004). Using a grid has been shown to be
effective at reliably estimating the actual abundances of organisms within sessile assemblages (Sams and
Keough 2007). Point counts allow counting of species occurring as individuals (e.g., barnacles) or percent
cover for colonial species, such as colonial ascidians. Communities will be analysed using the program
photoQuad (Trygonis and Sini 2012), in which multiple methods can be used to analyze photoquadrats of
sessile communities. These include grid point counts (our proposed method), random point counts, image
segmentation-based analysis and analysis of freehand regions. These methods can also be compared for
their precision and accuracy on a sample set of assemblages before deciding on the final method to be
used.
Bivalve assessment
Given the importance of bivalve communities to the stabilization and productivity of shoreline
habitats (Gutiérrez et al. 2003, Strayer and Findlay 2010), the assessment of these communities is of
specific interest. Some bivalves, such as oysters, may recruit to vertical tiles (Levinton et al. 2006). But
other bivalves may settle on other three-dimensional substrates. The relative abundance of bivalve (e.g.
mussel, oyster) recruits to each sampling device will be assessed using nylon scouring pads. Nylon
scourers (usually Tuffy™) are commonly utilized to assess the recruitment of bivalves to hard substrata
(Menge et al. 1994; Navarrete et al. 2008). Although the larvae of the eastern oyster Crassostrea
virginica have been shown to settle on oyster shell (Michener and Kenny 1991) and concrete (Anderson
1996), scourers can also provide favorable microhabitats for this species and are more easily acquired,
manipulated and deployed than either oyster shells or concrete surfaces. One nylon scourer will be tied to
the inside of the cage of each sampling device. Upon retrieval, each scourer will be placed within a
sample bag to which 70% ethanol will be added to preserve bivalves. Scourers will be dismantled in the
laboratory to remove and identify bivalves.
Shoreline habitat assessment methods July 30, 2014
5
Photoquadrats using SCUBA and remotely operated camera
Underwater photographs will be taken of the subtidal region of shorelines, at the same tidal height
at which sampling devices are deployed. The communities in these photographs will be assessed using the
same methods as outlined above for sessile communities on settlement plates (i.e., grid point counts).
Two methods for taking underwater photographs will be trialed, just prior to retrieval of sampling
devices. SCUBA divers will take photographs at a small subset of sites, as entry into the water is difficult
at the majority of subtidal shorelines in New York–New Jersey Harbor and use of divers is not compatible
with use in a readily repeatable protocol. Divers will also take photographs of the settlement plates on
sampling devices, which will be compared to the photographs taken when devices are retrieved. This will
allow a comparison of the resolution of images of the same communities both when photographs are
taken underwater and on land. Photographs will also be taken using a remotely operated camera mounted
on a pole that can be lowered into the subtidal zone from the landward side. A customized frame will be
constructed to ensure that the camera can be positioned at a standardized distance from the shoreline,
enabling determination of the surface area represented within each photograph. Comparison of
photographs taken using different methods will enable cross-checking of whether the sessile communities
that colonize settlement plates and bivalves that colonize scourers are representative of the communities
occurring directly on shorelines. Ultimately, the goal is to develop a method that is representative of the
shoreline community but requires less difficulty and resources than SCUBA surveys.
Fish community assessment
Small fish communities will be surveyed using five replicate minnow traps at each site. These
will be deployed overnight. In the field, each fish will be identified and their length measured, before
returning them to the water. Rare species that cannot be confidently identified to species in the field will
be photographed and fin-clipped for future genetic analyses to definitely identify individuals to species.
Samples will be lodged with the American Museum of Natural History for genetic analyses and
comparison to species barcode libraries. Larger fish will not be targeted for collection as a component of
the protocol. These fish are likely to be transitory across a variety of estuarine habitats and their presence
or absence would not be useful for determining the local habitat suitability for each species. These larger
fish are also more difficult to sample than smaller fish, requiring larger nets. This is not consistent with
the development of a cost-effective and readily repeatable estuarine shoreline assessment protocol.
Shoreline habitat assessment methods July 30, 2014
6
Assessment of abiotic conditions and food resources
Measurement of abiotic conditions and a proxy measure for primary food source availability will
assist the interpretation of the relative degree of influence of local habitat complexity on the structure of
communities. Water temperature and light reaching sampling devices will be measured continuously
whilst these devices are submerged using HOBO data loggers (Onset Corporation, Bourne MA). During
deployment and retrieval of sampling devices at each site, water quality meters (Multi-probe, YSI,
Yellow Springs OH) will be used to measure salinity, conductivity, dissolved oxygen and turbidity. Water
samples will also be collected at those times to determine concentrations of total suspended solids, and
nutrients (nitrates, nitrites, phosphates, silicates) in the Marine Biology laboratory of Lamont-Doherty
Earth Observatory, using a 4-channel autoanalyzer.
Given that the source of water flows into sites will have a large bearing on water quality and
habitat value, oxygen isotopes will also be measured to determine the relative proportion of water
contributed from upstream freshwater sources. Oxygen isotope samples will be measured by the cavity
ring-down mass spectrometer method at the Lamont-Doherty Environmental Tracers Group laboratory.
This method is inexpensive and yields high-precision measurements, with standard error rates in the 0.03
percent range. Chlorophyll a will be measured from water samples using the acetone extraction method
(Strickland and Parsons 1972), and will be used as a proxy measure for the relative amount of primary
productivity at each site. Many pollutants may influence the structures of communities on shorelines
affected by urbanization in the New York–New Jersey Harbor, including numerous heavy metals,
polycarbonated biphenyls (PCBs), polyaromatic hydrocarbons (PAHs) and pharmaceuticals.
Measurement of all these constituents is impractical for the current project and incompatible with the
development of a cost-effective and replicable protocol. The structure of invertebrate communities thus
provides an integrated proxy measure of the influence of various water quality influences and is most
useful in assessment protocols owing to the costs of analyses and simplicity of interpretation of patterns.
Nutrient and oxygen isotope samples are inexpensive to measure, and will be collected in
duplicate. The nutrient samples will be stored frozen prior to analyses. Initially all samples will be
measured in duplicate. If the dispersion in sample measurements indicates that duplicate measurement is
an unnecessary expense, then replicate measurements will be reduced to a random selection of 20% of all
samples collected. A randomly selected 10% of samples will be measured by an external laboratory for
validation.
Shoreline habitat assessment methods July 30, 2014
7
Statistical analyses
The response variables ultimately used in the protocol will be selected based on their contribution
to the assessment of relative habitat value of estuarine shorelines; whether their collection can be
standardized and reliably collected with minimal training or specialized equipment, and the cost-
effectiveness of their collection. Repeatability and ease of interpretation will be important considerations,
and commonly used metrics will be favored for use in the protocol. Analyses will include those univariate
and multivariate measures of community structure that are commonly used in other ecological
assessments, including comparisons of taxon richness, total abundances, species evenness (e.g. Shannon–
Weiner) and multivariate structure of faunal communities. Univariate response variables will be analyses
using analyses of variance (ANOVAs), whilst multivariate community structure will be analyzed using
non-metric multidimensional scaling (nMDS) and PERMANOVA (Anderson 2005) of Bray–Curtis
dissimilarities. The main factors that will be included in analyses will be location of cluster and shoreline
type (i.e., seawall or riprap). Gabion basket and stone wall sites will not be included in most analyses, but
a qualitative comparison to other shorelines will be possible for all response variables. The relationship
between response variables and the abiotic environment will be determined using multiple regressions,
with simplification of multiple regression models to determine which abiotic variables are most important
to measure to assist interpretation of relative habitat value of hard shorelines. Depending on which species
are present, trait analyses may also be used to add an additional layer of useful information for assessment
of shoreline habitat. The abundances of common species (i.e., those which constitute greater than 10% of
the number of individuals occurring on either seawall or riprap) will be compared between shoreline
types, to examine their potential as indicator species. Species will be useful as indicators if they are
consistently more abundant on one shoreline type than on the other.
These methodologies together will allow us to develop a robust and repeatable protocol for use in
assessing habitat quality of shorelines across the region. Figure 3 shows the progression of steps that will
be used in the development of this protocol.
Shoreline habitat assessment methods July 30, 2014
8
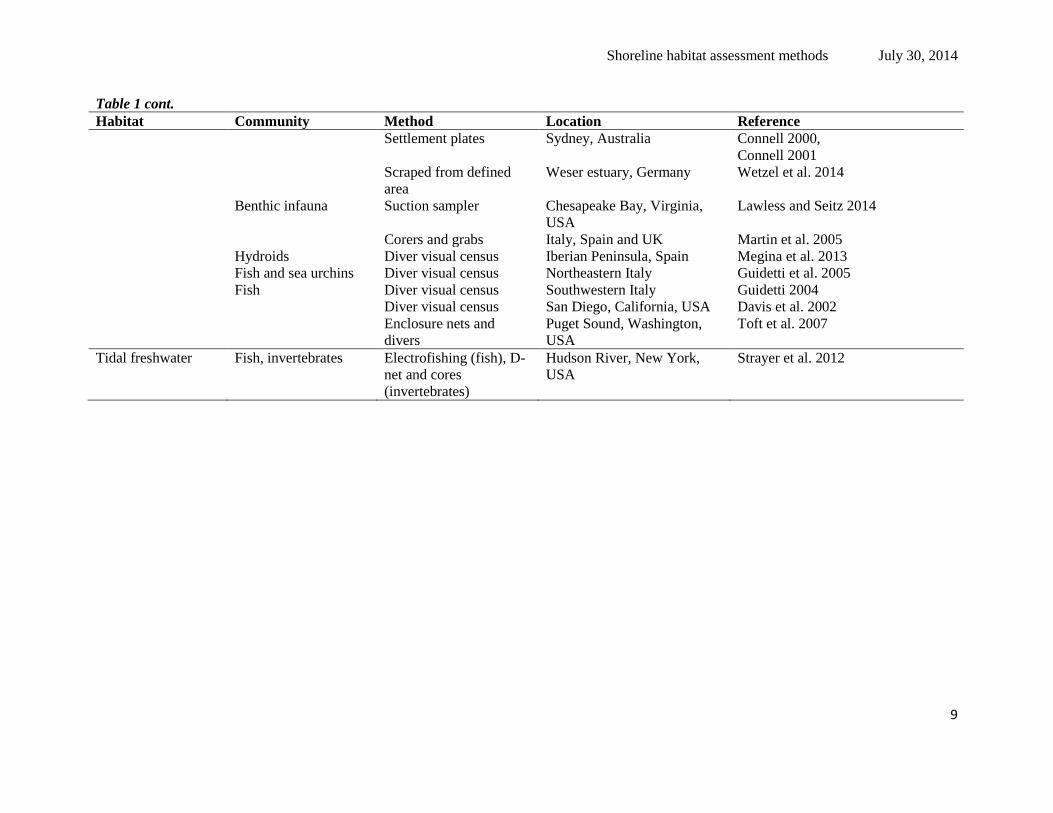
Table 1: Previous methods used to compare the relative habitat value of natural and engineered hard shorelines or breakwaters in urbanized
estuaries or along coastlines for different aquatic community types. Note: methods were designed for use in addressing the specific research
questions of each study, not for use in a repeatable protocol.
Habitat Community Method Location Reference
Intertidal Algae and
invertebrates
Quadrats or belt
transects
Sydney, Australia
Chapman 2003,
Chapman and Bulleri 2003,
Bulleri et al. 2005,
Bulleri 2005b,
Chapman 2006,
Green et al. 2012
Northeastern Italy Bacchiocchi and Airoldi 2003
Northwestern Italy Bulleri and Chapman 2004
Catalan coast, Spain Gacia et al. 2007
Denmark, Italy, Spain and
UK
Moschella et al. 2005
Victoria Harbor, Hong Kong Lam et al. 2009
Vizhinjam Bay, India Ravinesh and Bijukumar 2013
San Diego, California, USA Davis et al. 2002
Southern California, USA Pister 2009
Quadrats positioned
within experimental
clearings
Sydney, Australia Bulleri 2005a,
Bulleri 2005b
Settlement plates Sydney, Australia Bulleri 2005a
Molluscs Quadrats Sydney, Australia Chapman 2006
Limpets Quadrats Sydney, Australia Moreira et al. 2006
Intertidal mussel
beds
Sessile and mobile
invertebrates
Scraped from defined
area
Sydney, Australia People 2006
Subtidal Sessile epibiota Photoquadrats Sydney, Australia
Connell and Glasby 1999,
Glasby 1999,
Knott et al. 2004
Dubai, United Arab Emirates Burt et al. 2011
Shoreline habitat assessment methods July 30, 2014
9
Table 1 cont.
Habitat Community Method Location Reference
Settlement plates Sydney, Australia Connell 2000,
Connell 2001
Scraped from defined
area
Weser estuary, Germany Wetzel et al. 2014
Benthic infauna Suction sampler Chesapeake Bay, Virginia,
USA
Lawless and Seitz 2014
Corers and grabs Italy, Spain and UK Martin et al. 2005
Hydroids Diver visual census Iberian Peninsula, Spain Megina et al. 2013
Fish and sea urchins Diver visual census Northeastern Italy Guidetti et al. 2005
Fish Diver visual census Southwestern Italy Guidetti 2004
Diver visual census San Diego, California, USA Davis et al. 2002
Shoreline habitat assessment methods July 30, 2014
10
New Jersey
1R
1C
2C
2R
3R 3C
5R
5C 4R
2SW
1GB
Sites 6R & 6C (nr. Fort Wadsworth, SI)
Figure: Site clusters used during development of shoreline habitat assessment protocol in NY-NJ Harbor. The broad-scale spatial coverage of the site clusters is indicated by black dots in the inset. In the larger map, more detailed positioning of each site is shown for all clusters except 6, which was near Fort Wadsworth, Staten Island. Letters in site codes indicate whether the site was a seawall control (C, red symbols), riprap revetment (R, green symbols), gabion basket (GB, blue symbol), or stone wall (SW, orange symbol).
Shoreline habitat assessment methods July 30, 2014
11
26
2.5
mm
(1
0.5
inch
es)
Rope for attachment to shoreline
Shackle for attachment to cage (optional)
Cable ties to attach piping to cage
Cage (262.5 mm x 262.5 mm x 150
mm) – 10.5 x 10.5 x 6”
Settlement plate (with sampling
area 110 x 110 mm)
PVC piping (750 mm)
262.5 mm (10.5 inches)
750 mm
Plastic
mesh
PVC piping
Nylon scourer
26
2.5
mm
(1
0.5
”)
150 mm (6”)
a)
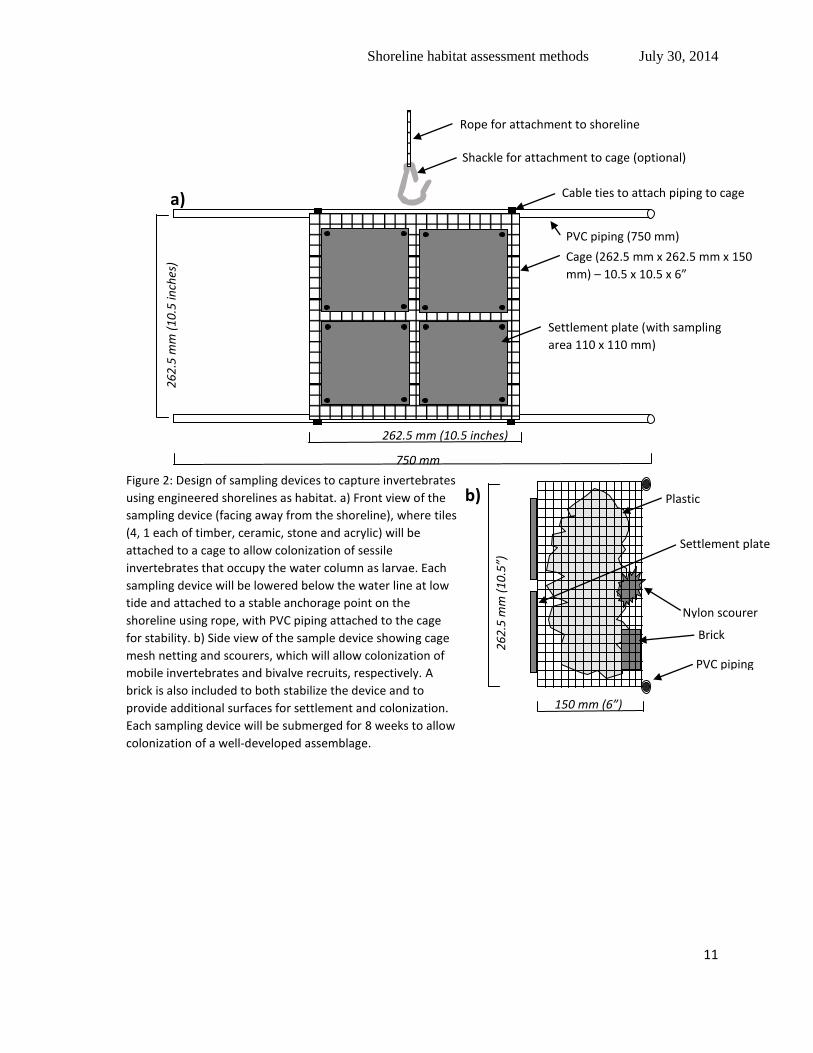
b) Figure 2: Design of sampling devices to capture invertebrates
using engineered shorelines as habitat. a) Front view of the
sampling device (facing away from the shoreline), where tiles
(4, 1 each of timber, ceramic, stone and acrylic) will be
attached to a cage to allow colonization of sessile
invertebrates that occupy the water column as larvae. Each
sampling device will be lowered below the water line at low
tide and attached to a stable anchorage point on the
shoreline using rope, with PVC piping attached to the cage
for stability. b) Side view of the sample device showing cage
mesh netting and scourers, which will allow colonization of
mobile invertebrates and bivalve recruits, respectively. A
brick is also included to both stabilize the device and to
provide additional surfaces for settlement and colonization.
Each sampling device will be submerged for 8 weeks to allow
colonization of a well-developed assemblage.
Settlement plate
Brick
Shoreline habitat assessment methods July 30, 2014
12
Figure 3: Flow diagram of sequential stages in development of the habitat assessment protocol
(modified from Gibson et al., 2000).
Study design, e.g. selection and classification of representative sites
for use in protocol development
Refine methodologies and response variables
Define objectives to be addressed by protocol
Collection, compilation and analyses of community structure, physical
and water quality data
Preliminary methods
Literature review
Validation, i.e. testing and evaluation of metrics effectiveness in
determining differences in habitat value
Application via implementation of protocol (with ongoing feedback
and refining of methods and metrics)
Inform shoreline management
Shoreline habitat assessment methods July 30, 2014
13
This project was funded by an agreement awarded by the Environmental Protection Agency to the New
England Interstate Water Pollution Control Commission in partnership with the New York-New Jersey
Harbor & Estuary Program.
Although the information in this document has been funded wholly or in part by the United States
Environmental Protection agency under agreement CE98272003 to NEIWPCC, it has not undergone the
Agency’s publications review process and therefore, may not necessarily reflect the views of the Agency,
and no official endorsement should be inferred. The viewpoints expressed here do not necessarily
represent those of the New York-New Jersey Harbor & Estuary Program, NEIWPCC, or U.S. EPA, nor
does mention of trade names, commercial products, or causes constitute endorsement or recommendation