15
A Statistical Analysis of Commercial Aviation Accidents 1958-2015 Airbus

A Statistical Analysis of Commercial Aviation Accidents 1958-2015
Airbus

1
Introduction 2Foreword 3A look at aviation accident statistics 4
#01 Year 2015 6
#02 Since the advent of the jet age
Evolution of the yearly accident rate 10Evolution of the yearly number of � ights and accidents 11Evolution of the commercial air transport world � eet 12Evolution of the accident ratesfor each generation of aircraft 13
#03Over the last 20 years
Evolution of the 10 year moving average accident rate for the last three aircraft generations 16Evolution of the yearly accident rate 17Distribution of accidents by � ight phase 19Distribution of accidents by accident category 20Evolution of three main accident categories 21Controlled Flight Into Terrain (CFIT) accident rates 22Loss Of Control In-� ight (LOC-I) accident rates 23Runway Excursion (RE) accident rates 24
Contents

32
Scope of the Brochure
• All western-built commercial air transport jets above 40 passengers. The following aircraft are included in the statistics: 328 JET, A300, A300-600, A310, A318/319/320/321, A330, A340, A350, A380, Avro RJ series, B707, B717, B720, B727, B737, B747, B757, B767, B777, B787, BAC -111, BAE 146, Bombardier CRJ series, Caravelle, Comet, Concorde, Convair 880/990, DC-8,DC-9, DC-10, Embraer E series, Embraer ERJ series, F-28, F-70, F-100, L-1011, MD-11, MD-80/90, Mercure, Trident, VC-10, VFW 614.
Note: non-western-built jets are excluded due to lack of information and business jets are not considered due to their peculiar operating environment.
• Since 1958, the advent of commercial jets
• Revenue �ights
• Operational accidents
• Hull loss and fatal types of accidents
De�nitions
• Revenue �ight: �ight involving the transport of passengers, cargo or mail for remuneration or hire. Non revenue �ight such as training, ferry, positioning, demonstration, maintenance, acceptance and test �ights are excluded.
• Operational accident: an accident taking place between the time any person boards the aircraft with the intention of �ight until such time as all such persons have disembarked, excluding sabotage, military actions, terrorism, suicide and the like.
• Hull loss: an event in which the aircraft is destroyed or substantially damaged beyond economical repair.
• Fatal accident: an event in which at least one person is fatally or seriously injured as a result of:- being in the aircraft, or- direct contact with any part of the aircraft, including parts which have-
become detached from the aircraft, or- direct exposure to jet blast, except when the injuries are from natural
causes, self-in�icted or in�icted by other persons, or when the injuries are to stowaways hiding outside the areas normally available to the passengers and crew.
Source of Data
• The accident data was extracted from of�cial accident reports, as well as from the ICAO, Ascend and Airbus data bases.
• Flight operations data were extracted from the Ascend data base.
Introduction
Publishing a yearly brochure on commercial aviation accident statistics is a challenge that deserves some explanation. Of course, the �gures for the latest year are new. But it raises some fundamental questions:
• Can we draw any safety lesson or devise any safety strategy from the latest year’s �gures?
• Is there any signi�cant change to the rest of the statistics that is worth speci�c action?
In both cases, the answer is NO. Therefore, why do it? This question gives rise to a number of answers, not all very convincing or satis-factory: because others do it, because people love �gures, because people expect it…
Keeping in mind that our ultimate goal is to enhance safety, it is worth rewording the question and wonder: in what respect can accident statistics help to enhance safety? What can they tell us about safety? What can they not tell us about safety?
Most of the time statistics prove to be rather counter intuitive, just as probabilities. It is often even worse when it comes to rare events which are governed by “the law of small numbers” Fortunately, this is the case of aviation accidents. They are very rare events.
Publishing a yearly accident statistics brochure is an opportunity to discuss what these �gures tell us or not and why.
Foreword

54 A look at aviation accident statistics
2015: the safest year ever by number of fatal accidents…
In 2015, 1 fatal accident can be counted when sabotage, military action, terrorism, suicide and the like are excluded. This is it: the aeronautic industry made it down to 1 fatal accident in a whole year, thus making 2015 the safest year ever by number of fatal accidents! We need to look all the way back to 1959 (or even 1958 when no fatal accident occurred at all) to see such a noticeable �gure. While this achievement may give cause for satisfaction and self-congratulation, let us not forget what it truly means, and where it comes from. Let us not forget that this is not the end of the story…
From a purely statistical point of view, it is true that this is close to the best we can expect from the global aviation safety net. The rate of accidents for 2015 is at its lowest since at least 1973 and the trend is towards �ights having fewer accidents. Overall, the global safety system is effective. But safety is a little bit more complex than reaching low scores in accident statistics.
In an era of superlatives and records - the lowest rate of fatal accidents ever in aviation history, the highest number of �ight cycles, the highest number of aircraft in operation, to name but a few - it is important to keep the order of magnitude of these �gures in mind when interpreting statistics. More than 31 million �ight cycles were �own by commercial airplanes last year. It means that, although an event may have only a 1 in a million probability of happening, it can, statistically, occur several times a year. If we then consider that the number of aircraft in operation is growing, this means that even if the rate of accidents per �ight drops slightly, the actual number of accidents will increase. This casts a rather gloomy shadow over the years to come.
… but an average year by number of hull losses
And indeed… In stark contrast with the declining trend in the number of fatal accidents, the number of hull losses tends to remain relatively stable, and it even increased in 2015 compared to 2014. Thinking beyond numbers, the border between a hull loss and a fatal accident may be relatively thin sometimes. So we’re making good progress, but it is stressed stability and the global safety net might well become more porous in the future. We shall not forget that the concomitance of factors leading to a fatal accident bears a random dimension. In each hull loss case, these factors could well have arranged otherwise, and thus told us a different story.
But rather than being pessimistic, we need to look and think beyond numbers. Aircraft accident statistics can prove a valuable source of information that allows for the setting of priorities and the monitoring of progress. Interpreting yearly �gures however can be misleading, and we must ensure we keep an eye on trends rather than yearly variations. These trends are indicative of the evolution of the air transport system safety over the years, and they help setting the right priorities and developing the right efforts in the years to come. The accident rate has been divided by around 8 for fatal accidents, and by around 3 for hull losses in the last 20 years. Traf�c increased by more than 86% over the same period. This shows that improvements bear fruit and in the past years, the air transport system has evolved in the appropriate direction in its efforts to enhance safety.
Enhancing safety beyond statistics
Keeping an eye on emerging hazards and threats
Today, we can see the operational environment is expanding and evolving fast with new operators, new types of operations, new players and new threats. We need to - we must - keep pace with this evolving landscape, and certainly not become complacent: safety efforts are still needed.
Despite the tremendous records and comforting numbers recorded over recent years, and in 2015 more particularly, we, as an industry, must keep dedicating our creative intelligence to the safety of passengers who �y onboard our airplanes. We now need to maintain our efforts and adapt our response to the new hazards and threats that are arising; some of which will be driving our efforts. The following can be named:
• The �eets growth rate is tremendous and the number of new aircraft being delivered every year increases exponentially, thus resulting in a higher exposure. This ramp-up in production and deliveries will in turn drive a growing need in well-trained pilots and crews to �y and operate these aircraft.
• This implies urgent and new training needs and stakes to train all these new pro�les according to their background and skills.
• The latter leads us to wonder: is the safety model developed by countries with a sound aeronautical background and history suited to all new countries where aviation now strives? How can, and do the lessons we derive from our analysis of available data apply to countries with a different culture, different professional pro�les and backgrounds, different operational conditions (be they environmental or economical)?
• Finally, security concerns receive more and more attention and regularly make headlines in the news. Clearly the security threat is taking its toll on commercial operations. How will the air transport system cope with this worldwide concern and increase travel security?
Knowing how the industry performed in the previous year is always a question. But it should not be the sole driver, and we need also to focus on trends and signals from today’s operations. We need to keep pace with expansion and traf�c increase collectively. Together, we must perpetuate our commitment to safety and continue to share the same ambition across the industry to continue to improve.

#01Year 2015
Commercial air transport accidents for the year 2015 31
million � ights
Exposure
111
which translates into a rate of 0.03 accident per million � ights
which translates into a rate of 0.35 accident per million � ights
Fatal accidents
Hull losses
7#01 Year 2015

#02Since the advent of the jet age
9#02 since the advent of the jet age8

11#02 since the advent of the jet age #02 since the advent of the jet age10
Fatal
Hull loss
20152012200920062003200019971994199119881985198219791976197319701967196419611958
Evolution of the yearly accident rate
Behind the numbers
The peak values observed at the beginning of the curve illustrate the fact that accidents, being rare events, need to be considered in the light of a meaningful number of � ights, reasonably at least a million � ights per year.
Therefore this curve, and all those following in the brochure, will appear as dotted lines until a million � ights a year are reached
A steady decrease over time “ ”
Yearly accident rate per million � ights
Yearly accident rate per million � ights
Fatal
Hull loss
35
Evolution of the number of � ights and accidents
Behind the numbers
Accidents are rare occurrences, consequently their number may vary considerably from one year to the next. Therefore, focusing too closely on a single year’s � gure may be misleading.
As a consequence, in the following charts, a 10 year moving average is used i.e. for any given year, the accident rate is the average of the yearly accident rates over the 10 preceding years.
A virtually stable absolute number of accidents despite a massive increase in exposure
“”

13#02 since the advent of the jet age #02 since the advent of the jet age12
Det
ail o
f A
ircr
aft
Gen
erat
ions First Generation
Early commercial jetsSecond GenerationMore integrated Auto
Flight System
Third GenerationGlass cockpit
and FMS
Fourth GenerationFly-By-Wire with � ight envelope protection
0
5
10
15
20
25
30
35
20152012200920062003200019971994199119881985198219791976197319701967196419611958
1952 1964 1980 1988
1st year of entry into service:
In 2
015
Caravelle, Comet, BAC 111, Trident, VC-10, B707, B720, Convair 880/990, DC-8
Concorde, A300 (except A300-600), BAE 146, Mercure, B727, B737-100/200, B747-100/SP/200/300, F-28, L-1011, DC-9, DC-10, VFW 614
A300-600, A310, Avro RJ series, B717, B737-300/400/500, B737 NG -600/700/800/ 900, B757, B767, B747-400, B747-8, Bombardier CRJ Series, Embraer ERJ Series, 328JET, F-70, F-100, MD-11, MD-80, MD-90
A318/A319/A320/A321, A330, A340-200/300/500/600, A350, A380, B777-200/300, B787-8/9, Embraer E Series
Evolution of the commercial air transport world � eet
Signi� cant changes in both the number and the nature of aircraft
Behind the numbers
Beyond the size and nature of the � eet, a number of evolutions took place at the air transport system level impacting its safety, hence its accident rate.
Technology has evolved in different areas like aircraft, simulators, airports, air traf� c control, weather forecasting etc. In parallel, qualitative progress has been achieved in the governance of airlines and authorities. “ ”
Yearly number of � ights in millions
671 � ights
13 aircraft
269.722 � ights
567 aircraft
16,6 million � ights
12.782 aircraft
14,1 million � ights
10.862 aircraft
Evolution of the accident rates for each generation of aircraft
Advances in technology bring a decrease in accident rates
Behind the numbers
Commercial air transport evolves in a very dynamic environment. Today’s operational conditions bear little resem-blance to those at the beginning of the jet age. As a consequence, in the fol-lowing charts, a 20 years frame is used.
This ensures a relatively homogeneous commercial air transport environment as well as a reasonably large statistical sample.
“ ”
2015
*Below 10 years of operation, the moving average is based on the number of years of operation.
*Below 10 years of operation, the moving average is based on the number of years of operation.
10 year moving average accident rate per million � ights*
10 year moving average accident rate per million � ights*
Fatal
Hull loss

#03Over the last 20 years
15#03 over the last 20 years14

17#03 over the last 20 years #03 over the last 20 years16
Behind the numbers
The fourth and latest generation of aircraft is characterized by Fly-By-Wire technology that allowed the introduction of � ight envelope protection.
The previous generation was characterized by the introduction of Glass Cockpits that came with Navigation Displays and Flight Management Systems.
0
0.5
1
1.5
2
2015201320112009200720052003200119991997
0.10
0.20
1.70
10 year moving average accident rate per million �ights
2.5
2
3
4.5
1.5
1
0.5
0
6
2015201320112009200720052003200119991997
0,25
0,59
6,0210 year moving average accident rate per million �ights
Evolution of the 10 year moving average accident rate for the last three aircraft generations
The introduction of the latest generation has allowed to halve the accident rate compared to the previous one
“”
10 year moving average accident rate per million � ights
10 year moving average accident rate per million � ights
Fatal
Hull loss
Evolution of the yearly accident rate
Behind the numbers
A hull loss is de� ned as an event in which an aircraft is destroyed or damaged beyond economical repair. The threshold of economical repair is decreasing with the residual value of the aircraft. Therefore, as an aircraft is ageing, an event leading to a damage economically repairable years before may be considered a hull loss.
0,0
0,2
0,4
0,6
0,8
1
2015201320112009200720052003200119991997
Trend lineTrend line
Yearly accident rate per million �ights
2015201320112009200720052003200119991997
0
0.3
0.6
0.9
1.2
1.5
Trend line
The accident rate was divided by around 8 for fatal accidents, and by around 3 for hull losses
“”
Yearly accident rate per million � ights
Yearly accident rate per million � ights
Fatal
Hull loss
19#03 over the last 20 years #03 over the last 20 years18
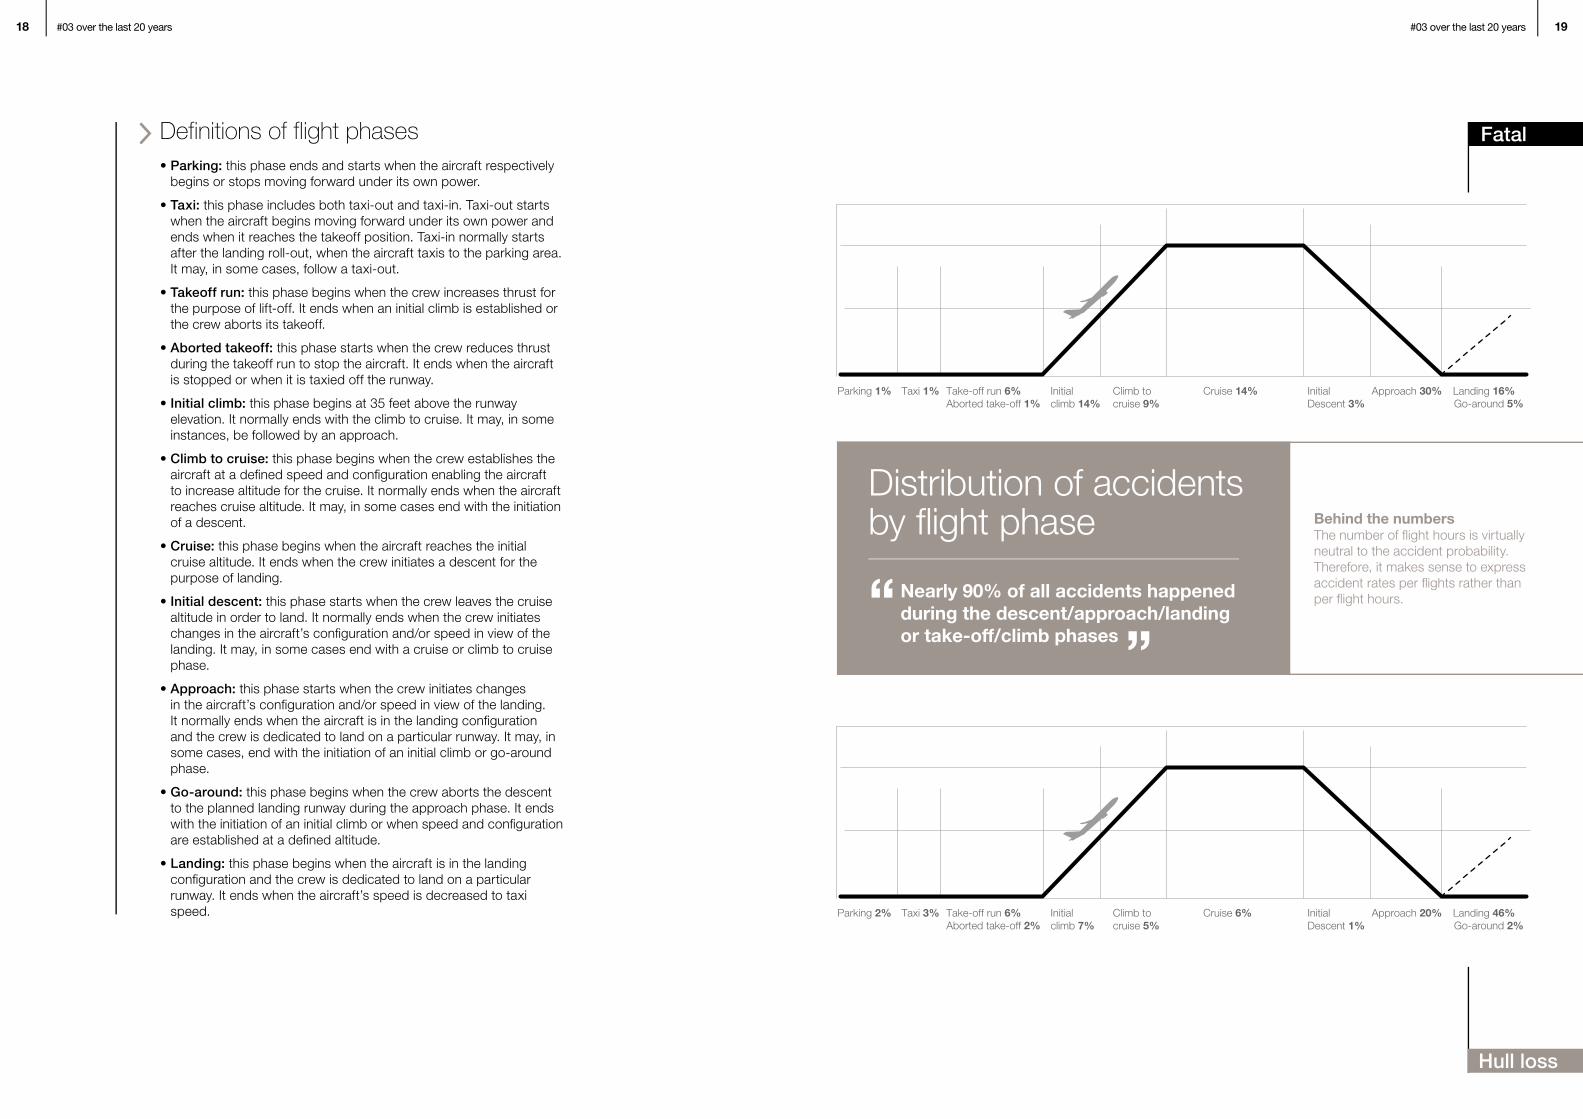
Definitions of flight phases• Parking: this phase ends and starts when the aircraft respectively
begins or stops moving forward under its own power.
• Taxi: this phase includes both taxi-out and taxi-in. Taxi-out starts when the aircraft begins moving forward under its own power and ends when it reaches the takeoff position. Taxi-in normally starts after the landing roll-out, when the aircraft taxis to the parking area. It may, in some cases, follow a taxi-out.
• Takeoff run: this phase begins when the crew increases thrust for the purpose of lift-off. It ends when an initial climb is established or the crew aborts its takeoff.
• Aborted takeoff: this phase starts when the crew reduces thrust during the takeoff run to stop the aircraft. It ends when the aircraft is stopped or when it is taxied off the runway.
• Initial climb: this phase begins at 35 feet above the runway elevation. It normally ends with the climb to cruise. It may, in some instances, be followed by an approach.
• Climb to cruise: this phase begins when the crew establishes the aircraft at a de� ned speed and con� guration enabling the aircraft to increase altitude for the cruise. It normally ends when the aircraft reaches cruise altitude. It may, in some cases end with the initiation of a descent.
• Cruise: this phase begins when the aircraft reaches the initial cruise altitude. It ends when the crew initiates a descent for the purpose of landing.
• Initial descent: this phase starts when the crew leaves the cruise altitude in order to land. It normally ends when the crew initiates changes in the aircraft’s con� guration and/or speed in view of the landing. It may, in some cases end with a cruise or climb to cruise phase.
• Approach: this phase starts when the crew initiates changes in the aircraft’s con� guration and/or speed in view of the landing. It normally ends when the aircraft is in the landing con� guration and the crew is dedicated to land on a particular runway. It may, in some cases, end with the initiation of an initial climb or go-around phase.
• Go-around: this phase begins when the crew aborts the descent to the planned landing runway during the approach phase. It ends with the initiation of an initial climb or when speed and con� guration are established at a de� ned altitude.
• Landing: this phase begins when the aircraft is in the landing con� guration and the crew is dedicated to land on a particular runway. It ends when the aircraft’s speed is decreased to taxi speed.
Distribution of accidents by � ight phase
Nearly 90% of all accidents happened during the descent/approach/landing or take-off/climb phases
“”
Behind the numbersThe number of � ight hours is virtually neutral to the accident probability. Therefore, it makes sense to express accident rates per � ights rather than per � ight hours.
Fatal
Hull loss

21#03 over the last 20 years #03 over the last 20 years20
Definition of accident categories• System/Component Failure
or Malfunction (SCF): Failure or malfunction of an aircraft system or component, which leads to an accident, whether they are related to the design, the manufacturing process or a maintenance issue.SCF includes the powerplant, software and database systems.
• Abnormal Runway Contact (ARC): Hard or unusual landing, not primarily due to SCF, leading to an accident.
• Runway Excursion (RE): A veer off or overrun off the runway surface, not primarily due to SCF or ARC.
• Loss of Control in Flight (LOC-I): Loss of aircraft control while in � ight not primarily due to SCF.
• Controlled Flight Into Terrain (CFIT): In-� ight collision with terrain, water, or obstacle without indication of loss of control.
• Undershoot: A touchdown off the runway surface, not primarily due to SCF.
• Fuel: Fuel exhaustion or fuel contamination.
• Ground collision: Collision with another aircraft, vehicle, person or obstacle from the time the airplane leaves the gate to the aircraft’s lift-off.
• Fire: Fire/smoke in or on the aircraft leading to an accident.
• Icing: Accumulation of ice on the aircraft surfaces that adversely affects aircraft control or performance.
• Turbulence: In-� ight turbulence encounter.
• Bird: In-� ight collision with birds.
• Air collision: In-� ight collisions between aircraft.
• Unknown: Insuf� cient information to categorize the occurrence.
Distribution of accidents by accident category
Three categories of accidents accounted for the majority of accidents
“”
*All the accident categories representing less than 10% of the accidents are clustered in the "OTHER" category.
*All the accident categories representing less than 10% of the accidents are clustered in the "OTHER" category.
Percentage of total number of accidents since 1996
*All the accident categories representing less than 10% of the accidents a*All the accident categories representing less than 10% of the accidents a*All the accident categories representing less than 10% *All the accident categories representing less than 10% r*All the accident categories representing less than 10% e cluste*All the accident categories representing less than 10% e cluste*All the accident categories representing less than 10% *All the accident categories representing less than 10% r*All the accident categories representing less than 10% ed in the "O*All the accident categories representing less than 10% ed in the "O*All the accident categories representing less than 10% THER*All the accident categories representing less than 10% THER*All the accident categories representing less than 10% " categor*All the accident categories representing less than 10% " categor*All the accident categories representing less than 10% y" category" categor*All the accident categories representing less than 10% " categor*All the accident categories representing less than 10% y*All the accident categories representing less than 10% " categor*All the accident categories representing less than 10% .y.y
Percentage of total number of accidents since 1996
Fatal
Hull loss
0
0.05
0.10
0.15
0.20
0.25
0.30
2015201320112009200720052003200119991997
0
0.05
0.10
0.15
0.20
0.25
0.30
0.35
0.40
2015201320112009200720052003200119991997
Evolution of the three main accident categories
A very unequal success in addressing the three major accident categories: the rate of CFIT was divided by 7, LOC-I by 2, whereas RE remained stable
“
”
Behind the numbers
If virtually all Controlled Flight Into Terrain (CFIT) and Loss Of Control In-� ight (LOC-I) accidents lead to both fatalities and hull loss, other accident categories generate mainly only material damage. As an example, 15% of Runway Excursion (RE) accidents cause fatalities, and are the third source of fatal accidents. Yet, Runway Excursions have become the main source of hull losses. As such, like CFIT and LOC-I, it represents a signi� cant contributor to the overall accident records. Since the other accident categories have a signi� cantly lower contribution to the overall accident records, the emphasis will be put on CFIT, LOC-I and RE in the rest of the brochure.
10 year moving average accident rate per million � ights
10 year moving average accident rate per million � ights Fatal
Hull loss

23#03 over the last 20 years #03 over the last 20 years22
Fat
al
Controlled Flight Into Terrain (CFIT) accident rates
The introduction of Glass Cockpits, Flight Management Systems, and in the early 2000s, GPS together with Terrain Awareness and Warning Systems has brought signi� cant gain in CFIT accident rates
Behind the numbers
The third generation of aircraft was introduced in 1982/83 with aircraft such as the Airbus A310/A300-600 as well as the Boeing B757 and B767. “
”
2015201320112009200720052003200119991997
2015201320112009200720052003200119991997
10 year moving average CFIT accident rate per million � ights
10 year moving average CFIT accident rate per million � ights
Hul
l lo
ss
Fatal
Hull loss
Loss Of Control In-� ight (LOC-I) accident rates
The � ight envelope protection has brought a huge reduction in LOC-I accident rates
Behind the numbers
The fourth generation of aircraft was introduced in 1988 with the Airbus A320. This technology has become an industry standard and is now used on all currently produced Airbus models, on the Boeing B777, B787, Embraer E and Bombardier CS series to come.“
”
2015201320112009200720052003200119991997
2015201320112009200720052003200119991997
10 year moving average LOC-I accident rate per million � ights
10 year moving average LOC-I accident rate per million � ights
Fatal
Hull loss

| 25
Contact
Also available on airbus.com
#03 over the last 20 years24
Runway Excursion (RE) accident rates
The effect of recent technological breakthrough is not measurable… yet
Behind the numbers
Most Runway Excursions are related to aircraft energy management. Signi� cant improvement of RE accident rates can be expected from the introduction of an energy landing performance based warning system. Yet, as of today, the proportion of aircraft equipped with such system is too low for the overall gain to be visible. “ ”
0
0.05
0.10
0.15
0.20
0.25
0.30
2015201320112009200720052003200119991997
2015201320112009200720052003200119991997
2.4
1.9
1.4
0.9
10 year moving average RE accident rate per million � ights
10 year moving average RE accident rate per million � ights
Fatal
Hull loss

AIRBUS S.A.S. 31707 Blagnac Cedex, France© AIRBUS S.A.S. 2016 - All rights reserved, Airbus, its logo and the product names are registered trademarks.
Concept design by Airbus Multi Media Support 20160887. Photos by Lindner Fotogra� e, A. Doumenjou, H. Goussé, S. Ramadier, A. Pecchi, J.-B. Accariez.
Reference: GSO.420.3005 Issue 3. April, 2016. Printed in France by Art & Caractère.
Con� dential and proprietary document. This document and all information contained herein is the sole property of AIRBUS S.A.S. No intellectual property rights are granted by the delivery of this document or the disclosure of its content. This document shall not be reproduced or disclosed to a third party without the express written consent of AIRBUS S.A.S. This document and its content shall not be usedfor any purpose other than that for which it is supplied. The statements made herein do not constitute an offer.They are based on the mentioned assumptionsand are expressed in good faith. Where the supporting grounds for these statements are not shown, AIRBUS S.A.S. will be pleased to explain the basis thereof.
This brochure is printed on Stucco.This paper is produced in factories that are accredited EMAS and certi� ed ISO 9001-14001, PEFC and FSC CoC. It is produced using pulp that has been whitened without either chlorine or acid. The paper is entirely recyclable and is produced from trees grown in sustainable forest resources.
The printing inks use organic pigments or minerals. There is no use of basic dyes or dangerous metals from the cadmium, lead, mercury or hexavalent chromium group.
The printer, Art & Caractère (France 81500),is engaged in a waste management and recycling programme for all resulting by-products.


